
Understanding the Strain Path Effect on the Deformed Microstructure of Single Crystal Pure Aluminum

1
Department of Mechanical Engineering, Imperial College London, London SW7 2AZ, UK
2
School of Mechanical Engineering, Dalian University of Technology, Dalian 116024, China
*
Author to whom correspondence should be addressed.
Metals 2021, 11(8), 1189; https://doi.org/10.3390/met11081189
Submission received: 28 June 2021
/
Revised: 20 July 2021
/
Accepted: 23 July 2021
/
Published: 26 July 2021
(This article belongs to the Special Issue Metal Forming—Hot Forming Technologies of Light Alloy Tubes and Sheets)
Abstract
:During plastic deformation, the change of structural states is known to be complicated and indeterminate, even in single crystals. This contributes to some enduring problems like the prediction of deformed texture and the commercial applications of such material. In this work, plane strain compression (PSC) tests were designed and implemented on single crystal pure aluminum to reveal the deformation mechanism. PSC tests were performed at different strain rates under strain control in either one-directional or two-directional compression. The deformed microstructures were analyzed according to the flow curve and the electron back-scattered diffraction (EBSD) mappings. The effects of grain orientation, strain rate, and strain path on the deformation and mechanical response were analyzed. Experimental results revealed that the degree of lattice rotation of one-dimensional compression mildly dependents on cube orientation, but it is profoundly sensitive to the strain rate. For two-dimensional compression, the softening behavior is found to be more pronounced in the case that provides greater dislocations gliding freeness in the first loading. Results presented in this work give new insights into aluminum deformation, which provides theoretical support for forming and manufacturing of aluminum.
1. Introduction
The mechanical behavior of aluminum is of significant technological interest since aluminum is incredibly popular in engineering structures and components for its lightweight and superior corrosion resistance [1]. A long-term goal in this research direction would be the understanding of the microstructure and texture of face-centered cubic (FCC) metal after deformation and thus to develop models for predicting the strain hardening of such material. This aim requires fundamental knowledge of the changes of crystalline microstructure during deformation and the metal forming process itself.
From the perspective of industrial manufacturing, the deformation behavior of grains and the deformation heterogeneities that occurred at the particles have substantial impacts on the subsequent anisotropy of the metallic products [2,3]. To simplify the complications, this project investigates the deformation behavior of single crystal pure aluminum (SCPA) in a channel die plane strain compression (PSC). The use of PSC can provide the basic deformation condition, which is helpful to understand the deformation mechanism during metal forming. Besides, channel die compression testing allows smaller samples to be used [3]. This work orientates itself to study the deformed microstructure of single crystal with three characteristic factors: the grain orientation, the strain rate, and the strain path changes (SPCs).
The influence of grain orientation on the microstructure of plastically deformed metal has been long recognized. One complexity in the analysis of FCC structure is that cube grains are metastable in PSC such that a wide range of lattice rotation is possible for grain orientation deviated from exact cube orientation [3,4,5,6,7]. The {011}<100> orientation under rolling for single-phase crystals is highly stable to large strains [3], while particles containing crystals with {001}<110> orientation deform in unstable manners [7]. Akef et al. [4] revealed that deformation bands in the {001}<110> orientation are double coplanar slip while those in the cube-orientated crystals are single-slip models. Most research about metallic materials is implemented with specific textures, but industrial applications of aluminum could be of mixed grain orientation. This work considers the comparative effects of two different grain orientations on the deformed microstructure of SCPA, which facilitates the understanding of the macroscopic behavior of metals with various grain orientations.
The deformation behaviors and mechanism of crystal materials could exhibit a strong dependence on the deformation speed. Yamada et al. [8] experimentally studied the strain rate dependence deformation of pure aluminum by micro-indentation test. Mechanical modeling approaches [9,10] have also been developed to reveal the deformation mechanism under various deformation speeds. Many investigations have indicated that the sensitivity of metallic behavior to strain rate changes from quasi-static deformation speed to high deformation speed [11,12,13,14]. Khan et al. [13] measured significant strain rate sensitivity at high strain rates at various deformation temperatures. Suo et al. [12] suggested different rate-controlling mechanisms at high and low strain rates for equal channel angular pressing. Yan et al. [11] found that high-velocity deformation enhances the ductility in the forming process of aluminum. However, current experiments about the plane strain deformed aluminum crystal largely underestimated the effects of strain rate and used one compression speed solely [2,3,4,5,15]. The limited consideration of the strain rate effect on the deformation mechanism also existed in manufacturing industry. This ultimately leads to substantial deviations from the expected deformed states and premature failure of materials. To better understand the strain rate effects, in this research, two compression speeds are compared to study the deformation microstates under PSC.
Non-monotonic deformations usually occur in the metal forming process [16,17,18,19], such as multistep cross rolling [16], equal channel angular pressing [19] and reverse shearing [17,18], and have major implications in the mechanical behavior of the materials [20,21,22,23]. Barlat et al. [21] studied the effects of non-monotonic deformation on dislocation microstructure and crystallographic texture evolutions. The hardening effects of non-monotonic deformation were identified by Boers et al. [22]. Gracio et al. [23] found that the flow behavior of pure Al alloys strongly depends on the amplitude in the strain path change. The material response after reversal SPCs, for instance, exhibits the Bauschinger effect [24,25] and hardening stagnation [22,26]. Whereas orthogonal hardening or softening may be observed after orthogonal SPCs [18,20,27,28,29]. The transient/permanent stress-strain response after SPCs is believed to be attributed to the evolution of the underlying microstructure details [30]. This work shall explore SPCs of a two-directional compression-compression test with a different second deformation direction and provide better descriptions of the microscopic developments and macroscopic response of the material.
The aim of this work is to systematically characterize and analyze the micromechanical deformation mechanism of SCPA by channel die PSC. Different strain hardening and deformation mechanisms of the metals associate with three variables in the process (the grain orientation, the strain rate, and the SPCs) are demonstrated in flow curves. The deformation micro features are captured by electron back-scattered diffraction (EBSD). Results presented in this work gives new insights into aluminum deformation, which provides theoretical support for forming and manufacturing of aluminum.
2. Experiment
2.1. As-Received Material and Material Preparation
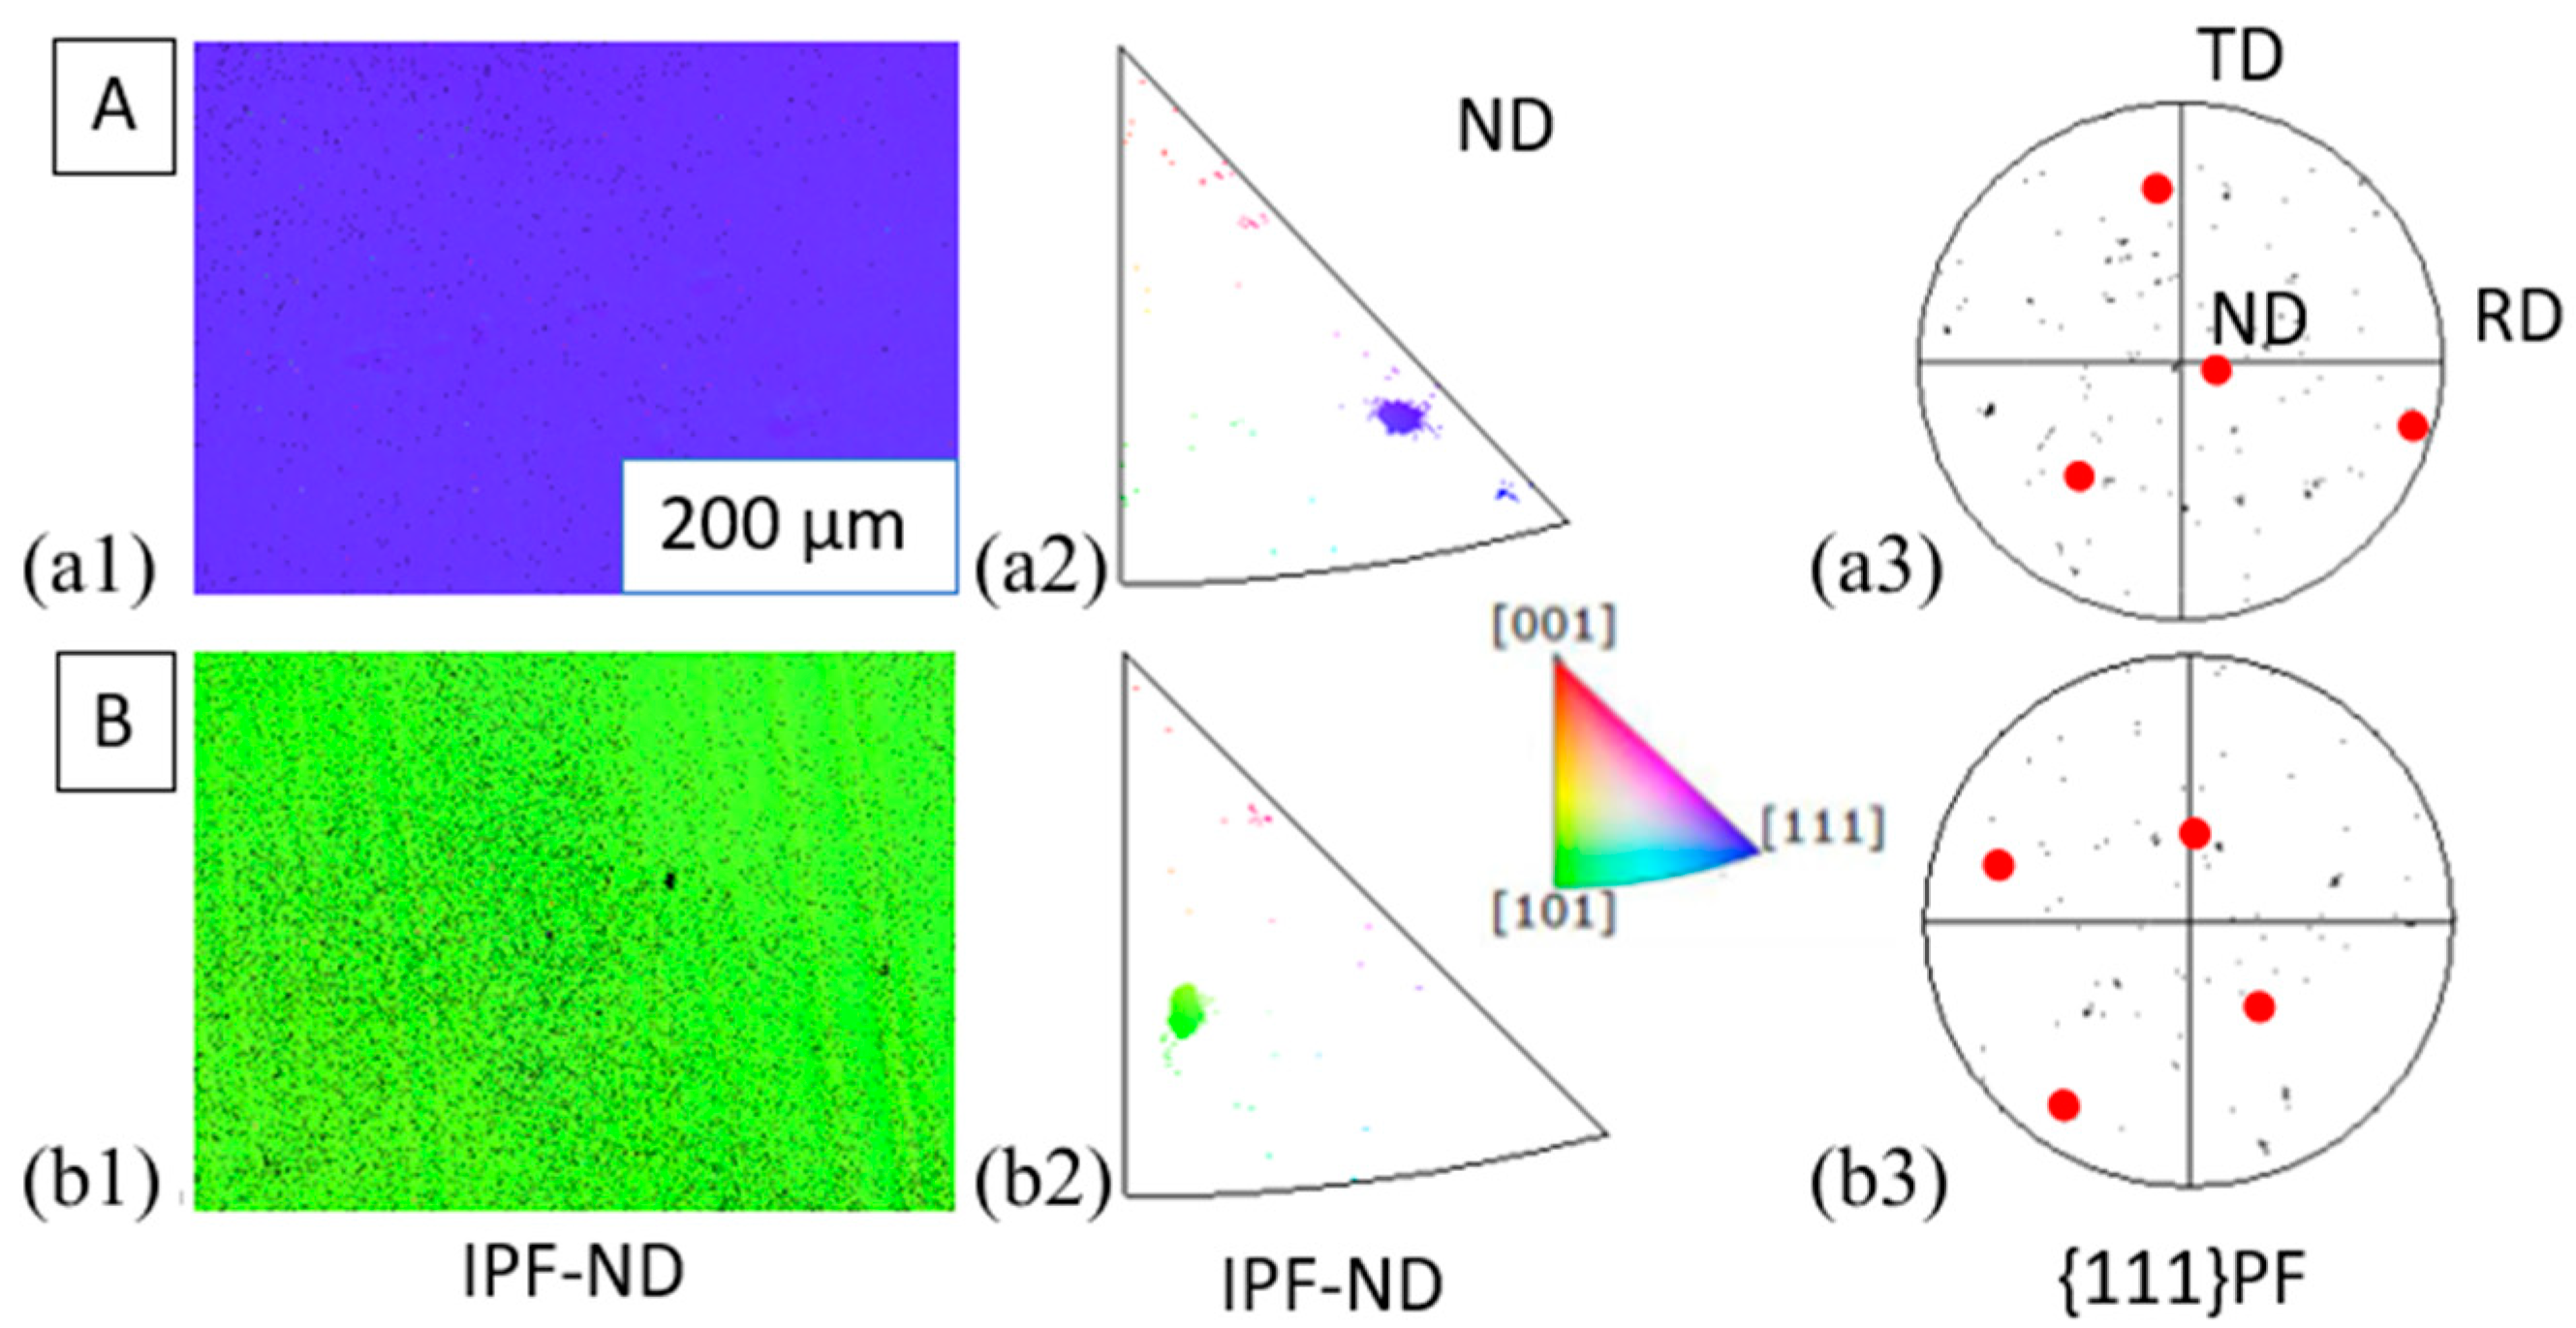
The target material of this research is commercially pure aluminum (99.99%). All the samples used in this work were cut with the dimension of 10 × 10 × 10 mm3. The coordinate system used in describing the sample geometry follows terminology for rolled material; the loading direction, transverse direction, and rolling direction with respect to the channel die are shortened to ND, TD and RD. In order to reveal the orientation effect, six SCPA samples with two grain orientations named A-oriented and B-oriented were prepared in this work (A-I to A-IV and B-I to B-II). Figure 1 shows the orientation information of undeformed samples. From Figure 1, the IPF-ND for A-oriented and B-oriented samples are close to {111} and {101}. It is known that aluminum has slip planes of the family {111}; therefore, the resolved shear stress on the slip systems would be lower for A-oriented crystals, and slip would be less likely to occur under the same strain condition.
Before PSC test, the RD-ND face of each sample was metallographically ground with SiC papers for up to 4000 grit and polished by 0.04 μm OPS (Oxide Polishing Suspensions) solution. Each face was then electropolished for 90 s in a solution of 9.5 vol% perchloric acid in ethanol at room temperature and 20 V, drawing a current of 0.19 A.
2.2. PSC Test Design
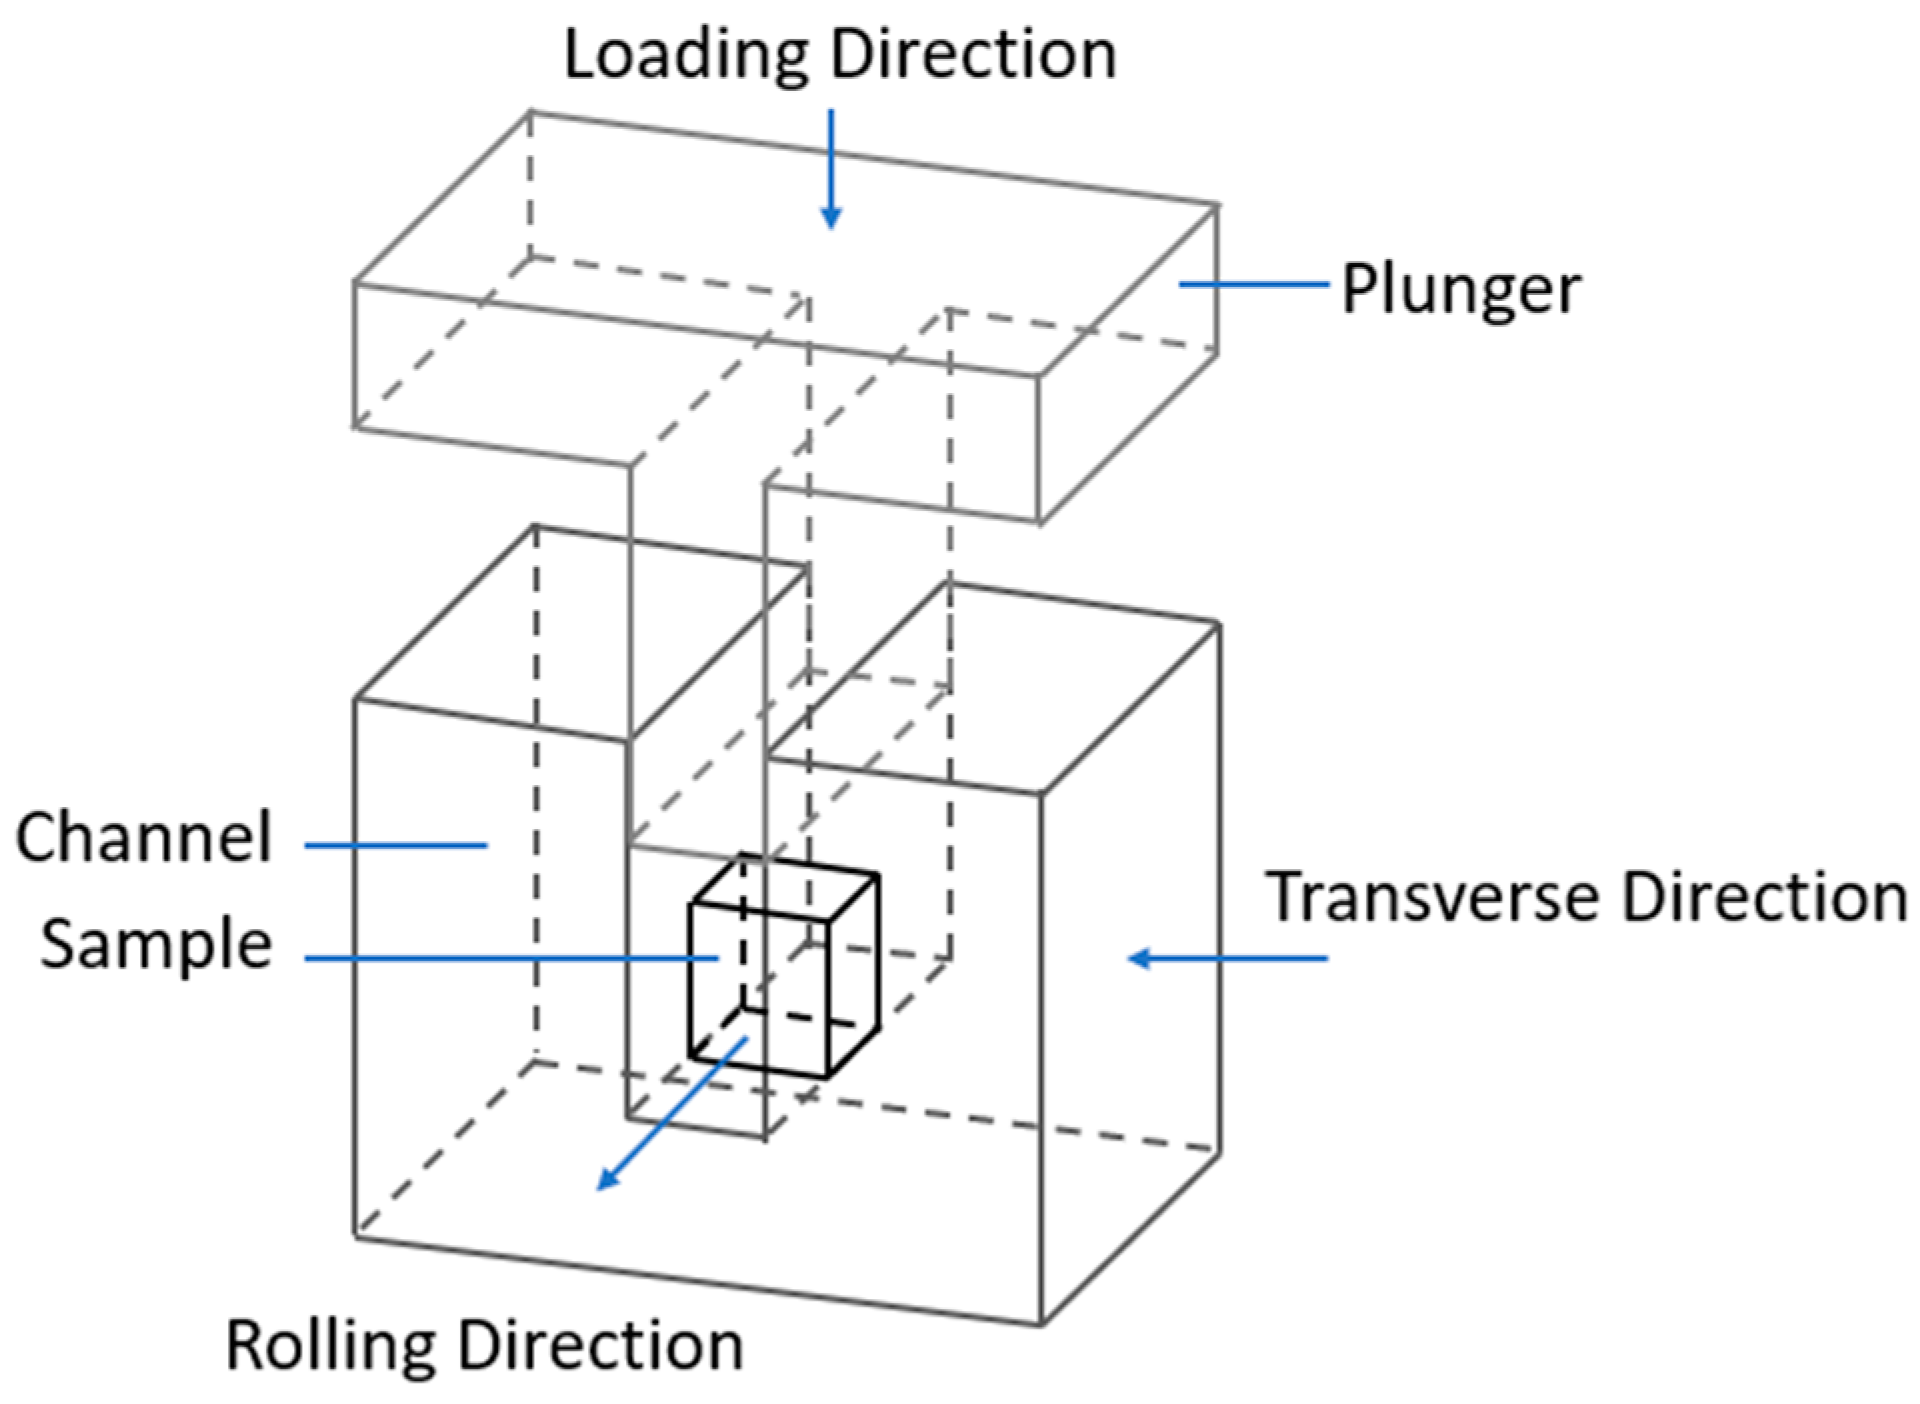
The SCPA samples were placed in a testing rig shown in Figure 2, and the constrained surfaces were lubricated by the stable lithium complex greases. The die was placed in an Instron mechanical testing machine and deformed at room temperature.
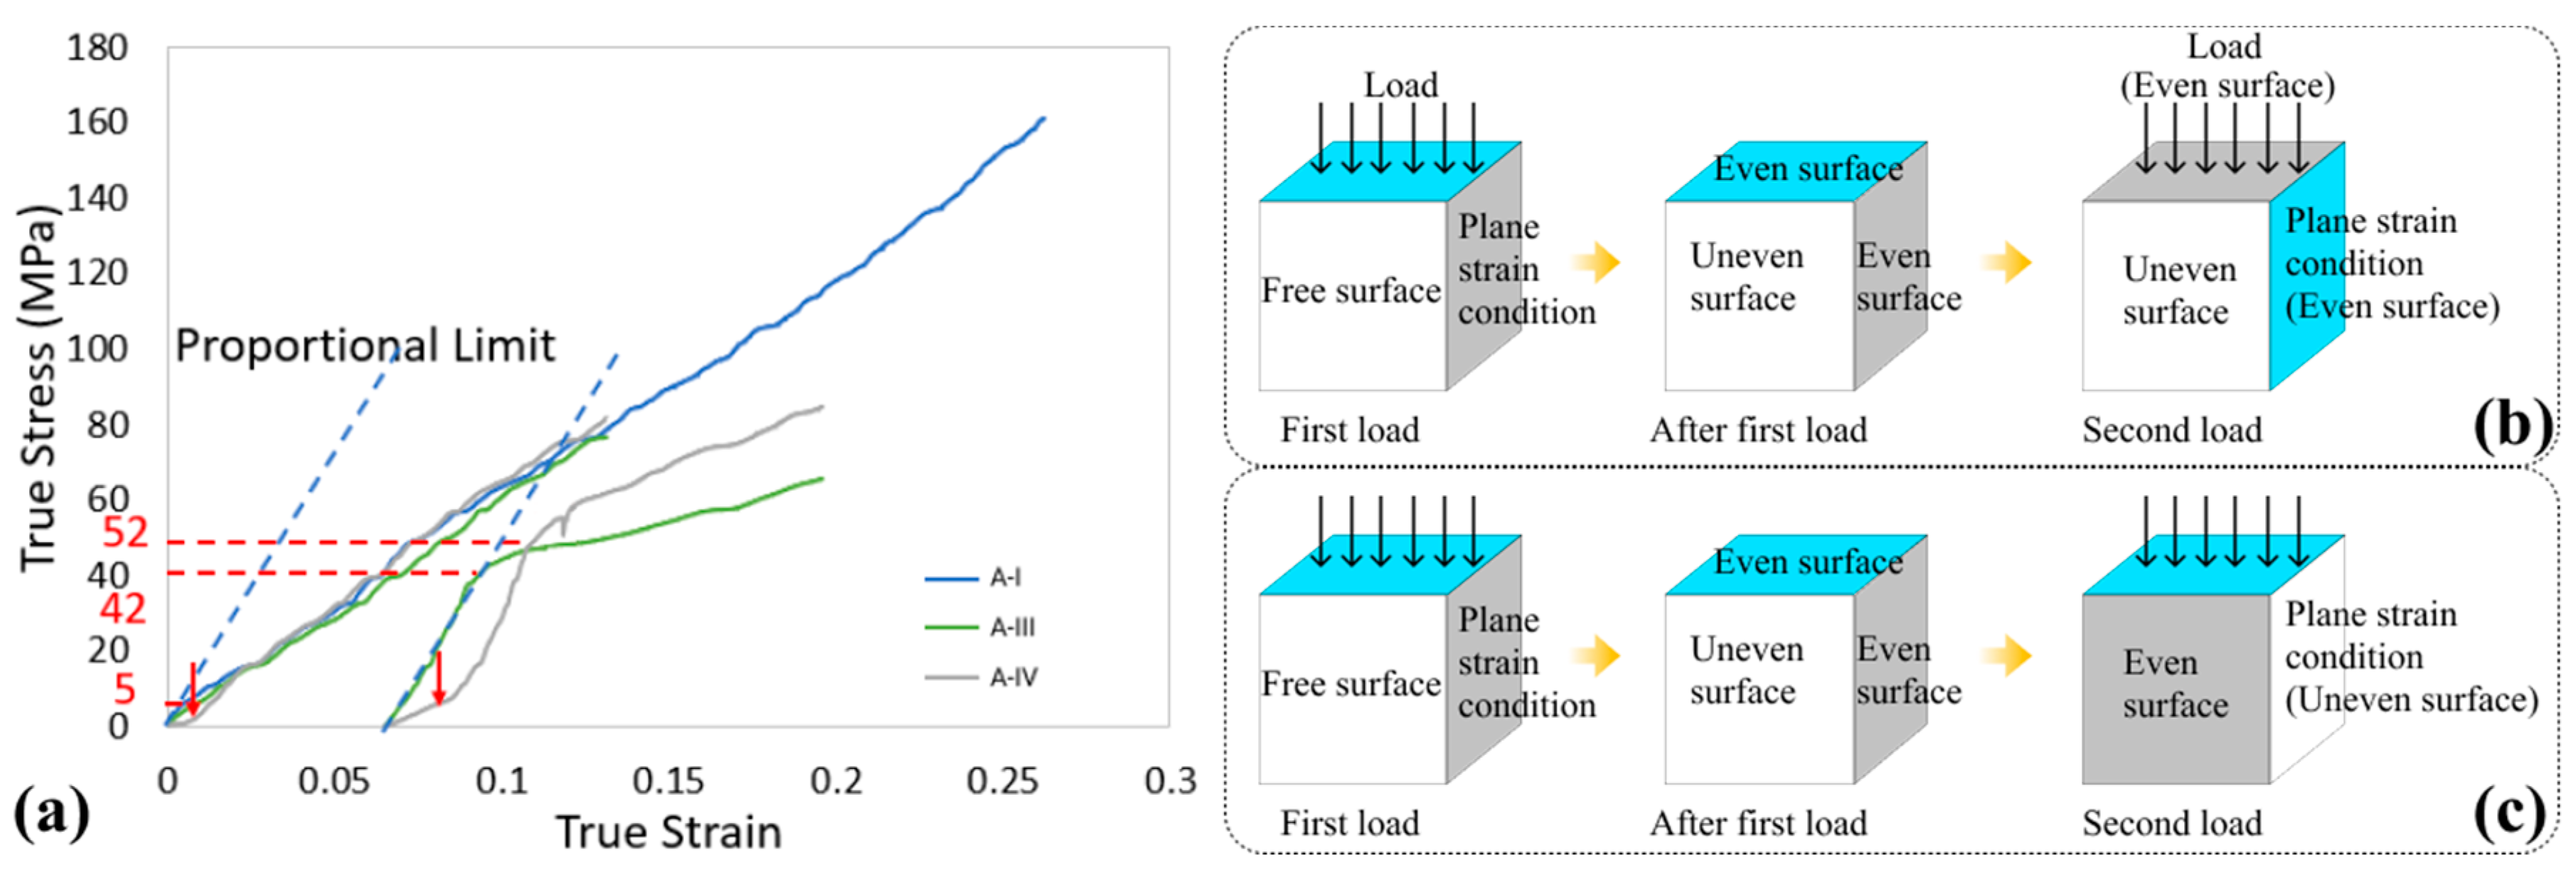
All samples were compressed to an engineering strain of 0.3 under strain control, and this engineering strain has been proven to be high enough for the DBs formation of our material. The test parameters, as presented in Table 1, were designed to conduct three groups of comparisons: the grain orientation (A-I and B-I), the strain rate (A-I and A-II; B-I and B-II), and the SPCs (A-I, A-III, and A-IV). Two quasi-static strain rates (0.002 s-1 and 0.0002 s-1) were used because under the high strain rate, adiabatic DBs often appear and change the local temperature of the samples which induce more complex factors that influence the results. The data acquisition frequency of tests was set to be 50 Hz, which gives good accuracy to capture details of the stress-strain curve. For SPCs test, two steps loading method was adopted in order to achieve two-directional loading condition. After the first load, the sample was replaced on the testing rig with different orientation. The main purpose here is to reveal the effects of strain path changes on deformation, the strain rate conditions was thus set to be the same. The surfaces subjected to plane strain condition in the first loading were colored as grey, and the hatch pattern denoted the areas in which external force was applied initially. The loading directions for both the first and second loading were illustrated by solid arrows.
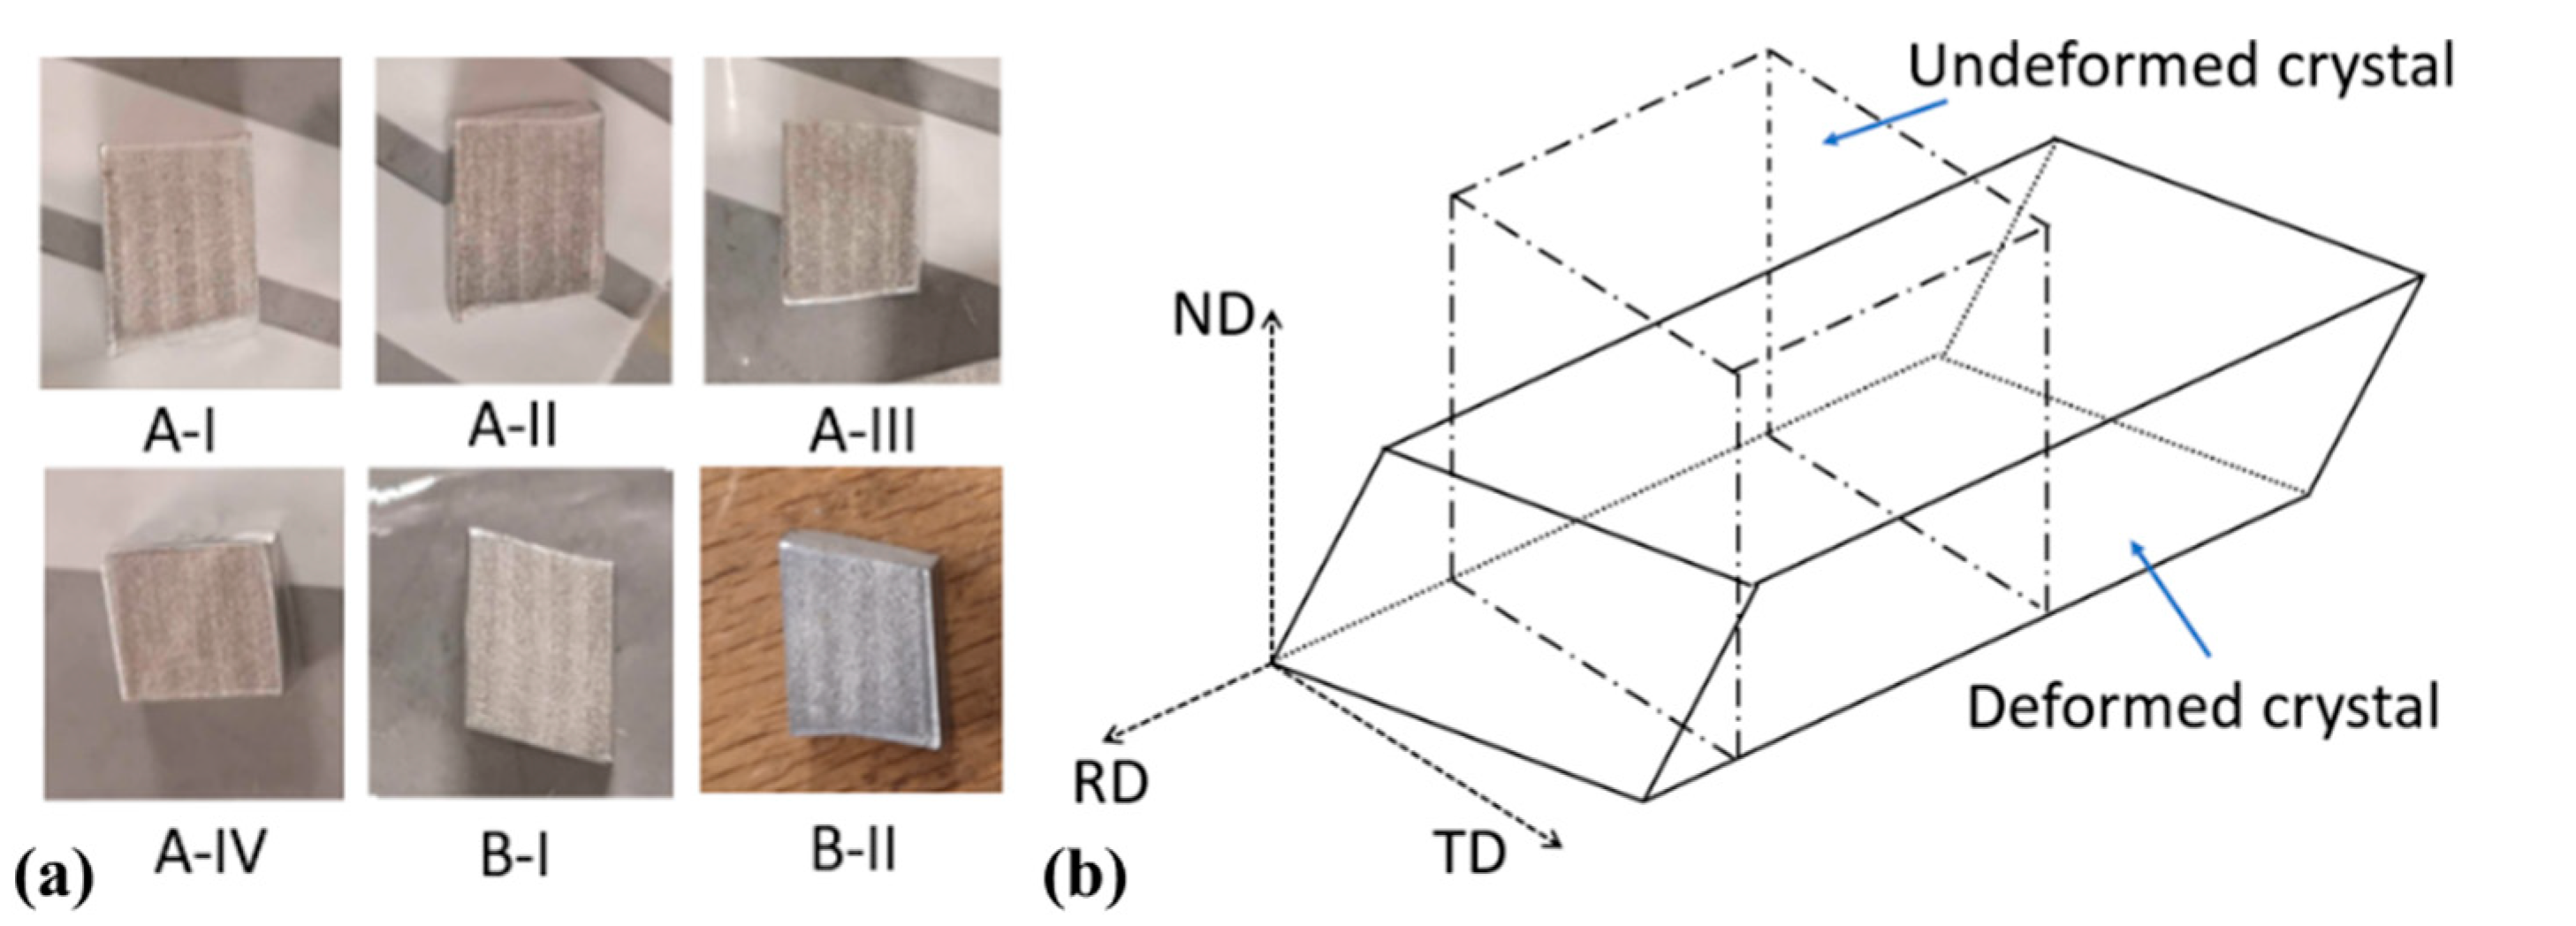
Images for the deformed aluminum samples are shown in Figure 3a. For samples that were strained one-directionally, they comply with the ideal frictionless PSC model (Figure 3b). However, it should be noticed that the non-flat edges of the compressed crystals could be the results of the inevitable frictional force during compression, and then leads to stress raisers in the specimen surface. This effect was carefully treated in the analysis of the experimental results. After PSC test, the compressed samples were then cut in the mid cross-section from the plane perpendicular to the TD. The new RD-ND surface was prepared following the same procedure as material preparation before PSC test.
2.3. Microstructure Characterization
EBSD mapping was used to examine the local crystallography and microstructural details of samples. The images in the center of the prepared surface before and after compression testing were captured by Hitachi S3400N (Hitachi, Ltd., Tokyo, Japan) equipped with an eFlashHR camera, Bruker eFlashHR EBSD system, and Esprit v2.1 software (Bruker Esprit, Billerica, MA, USA). The EBSD mappings had settings of an accelerating voltage of 20 kV and a step size of 3 μm.
3. Experimental Results
This section gives quantitative descriptions for the flow curve to examine the strain hardening behavior of each compressed specimen. Deformed microfeatures like crystallographic orientation and deformation bands (DBs) are also presented, as these factors show the imperative effects of mechanical properties [32] and correlations with subsequent recrystallization process [33].
3.1. Grain Orientation Effect
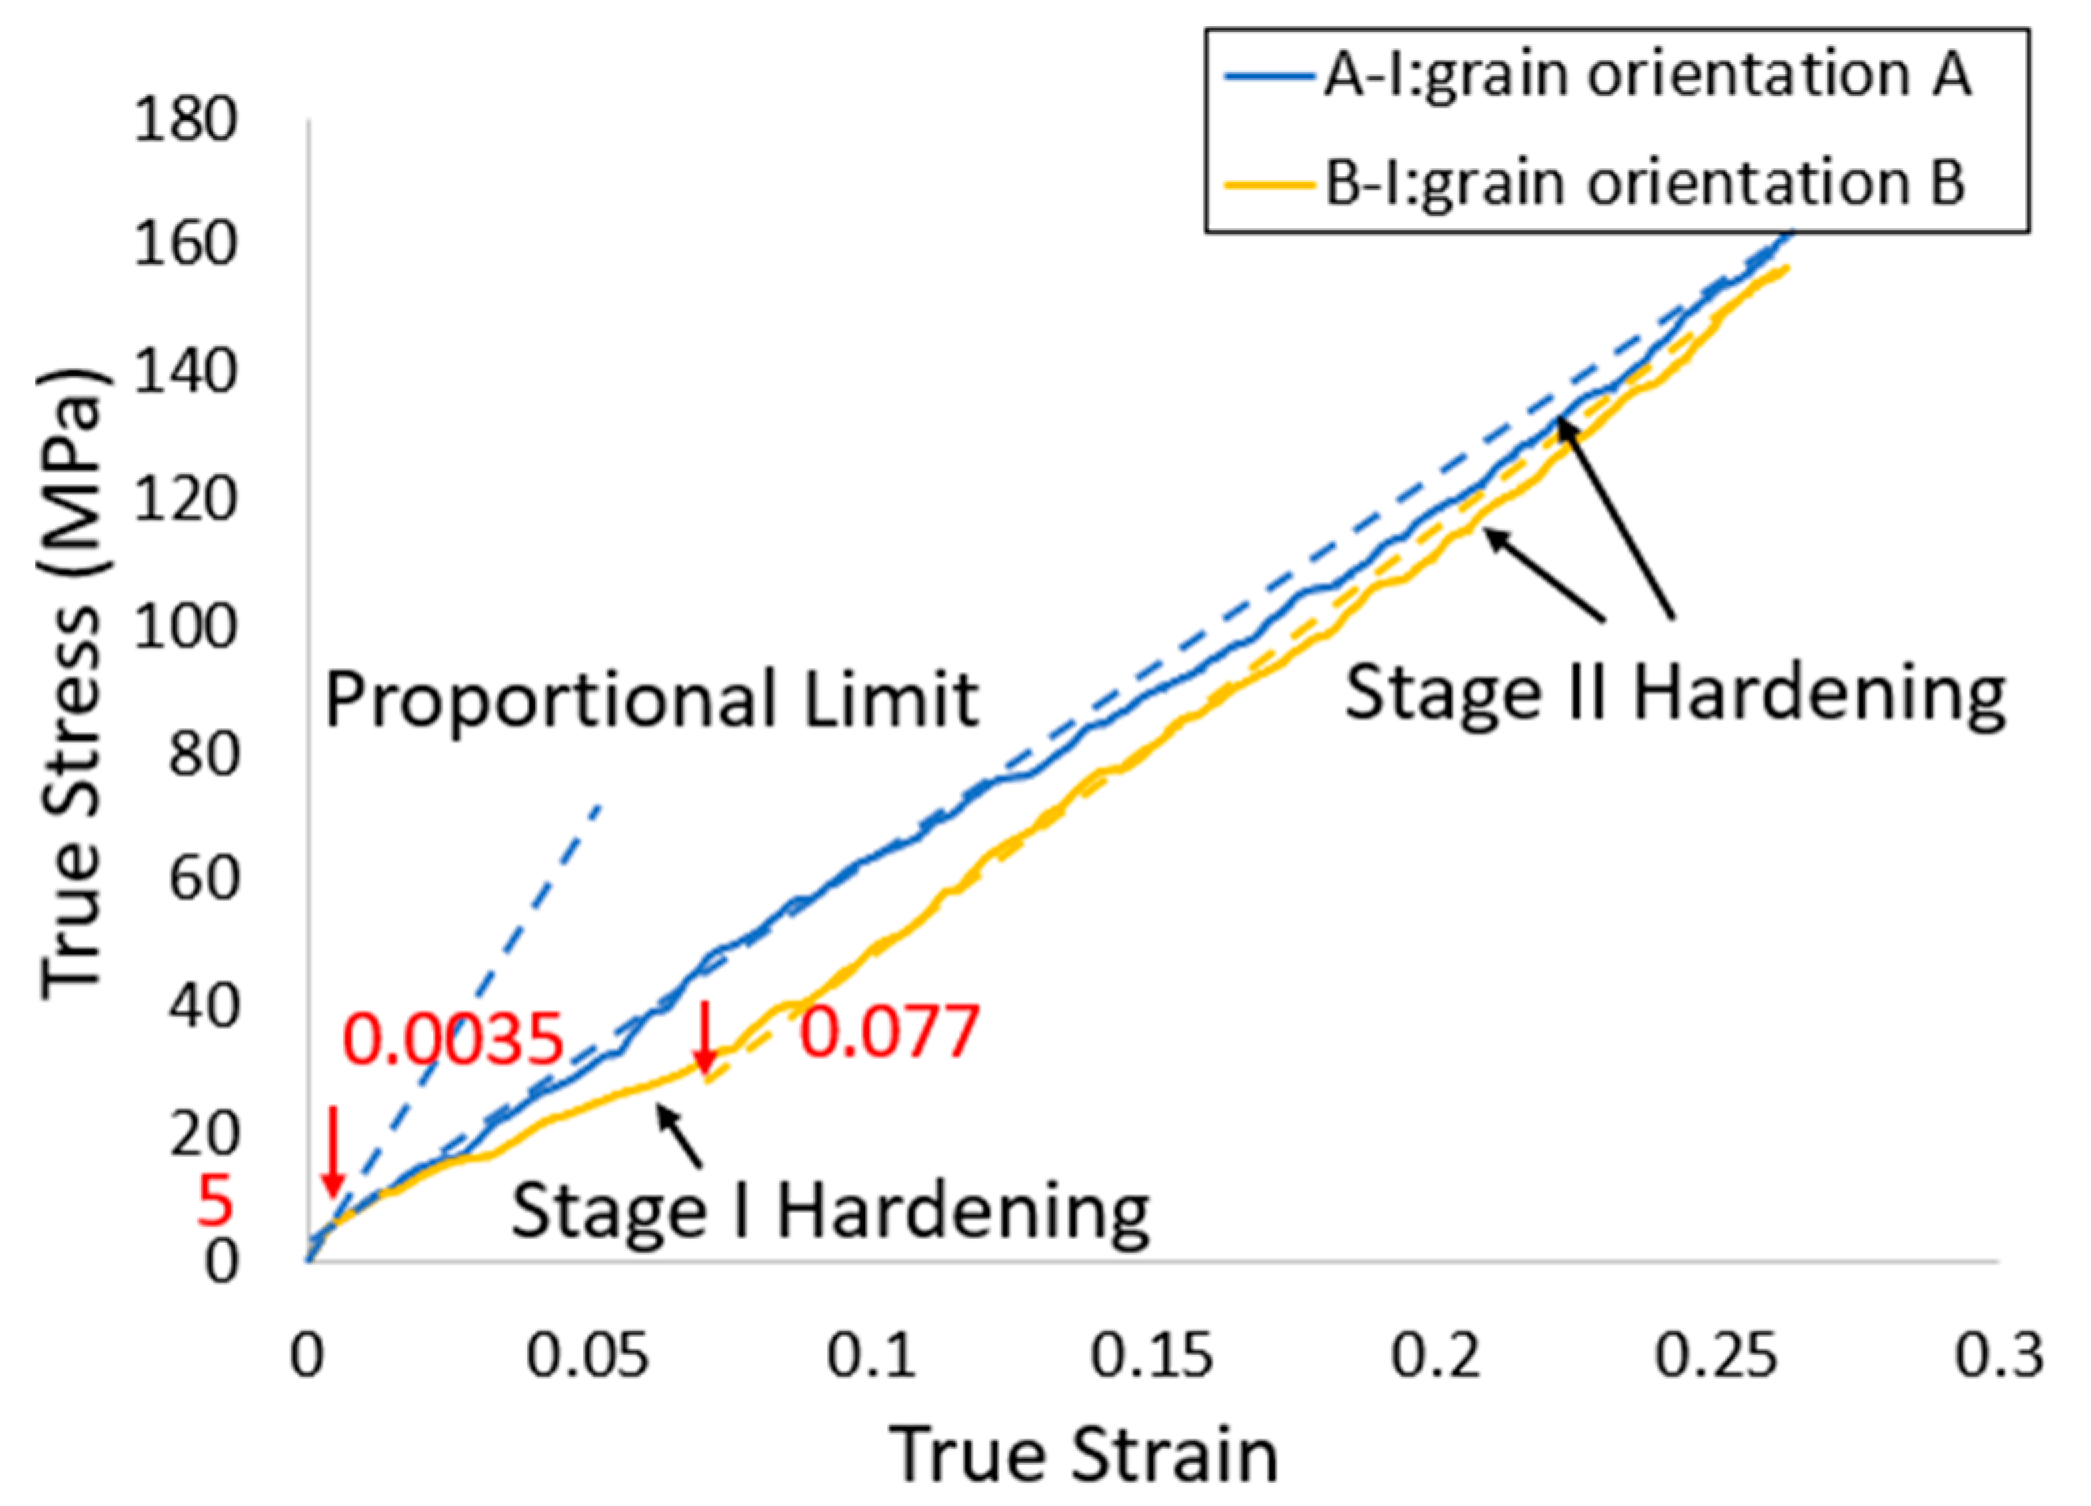
Figure 4 records the experimental data from the compression tests for sample A-I and B-I. Distinctive hardening behavior of sample A-I and B-I were identified. For sample A-I, after the initial elastic deformation to the stress level of about 5 MPa, A-I was directly strengthened by stage II hardening (terminology after Diehl [34]) with a nearly constant work hardening rate () of 575 MPa. For sample B-I, there are two steps of hardening that can be readily seen. In stage I, the hardening rate
was 360 MPa, significantly lower than that of sample A-I under the same strain level. After the strain level excessed 0.077, stage II hardening appears with the constant hardening rate of 590 MPa.
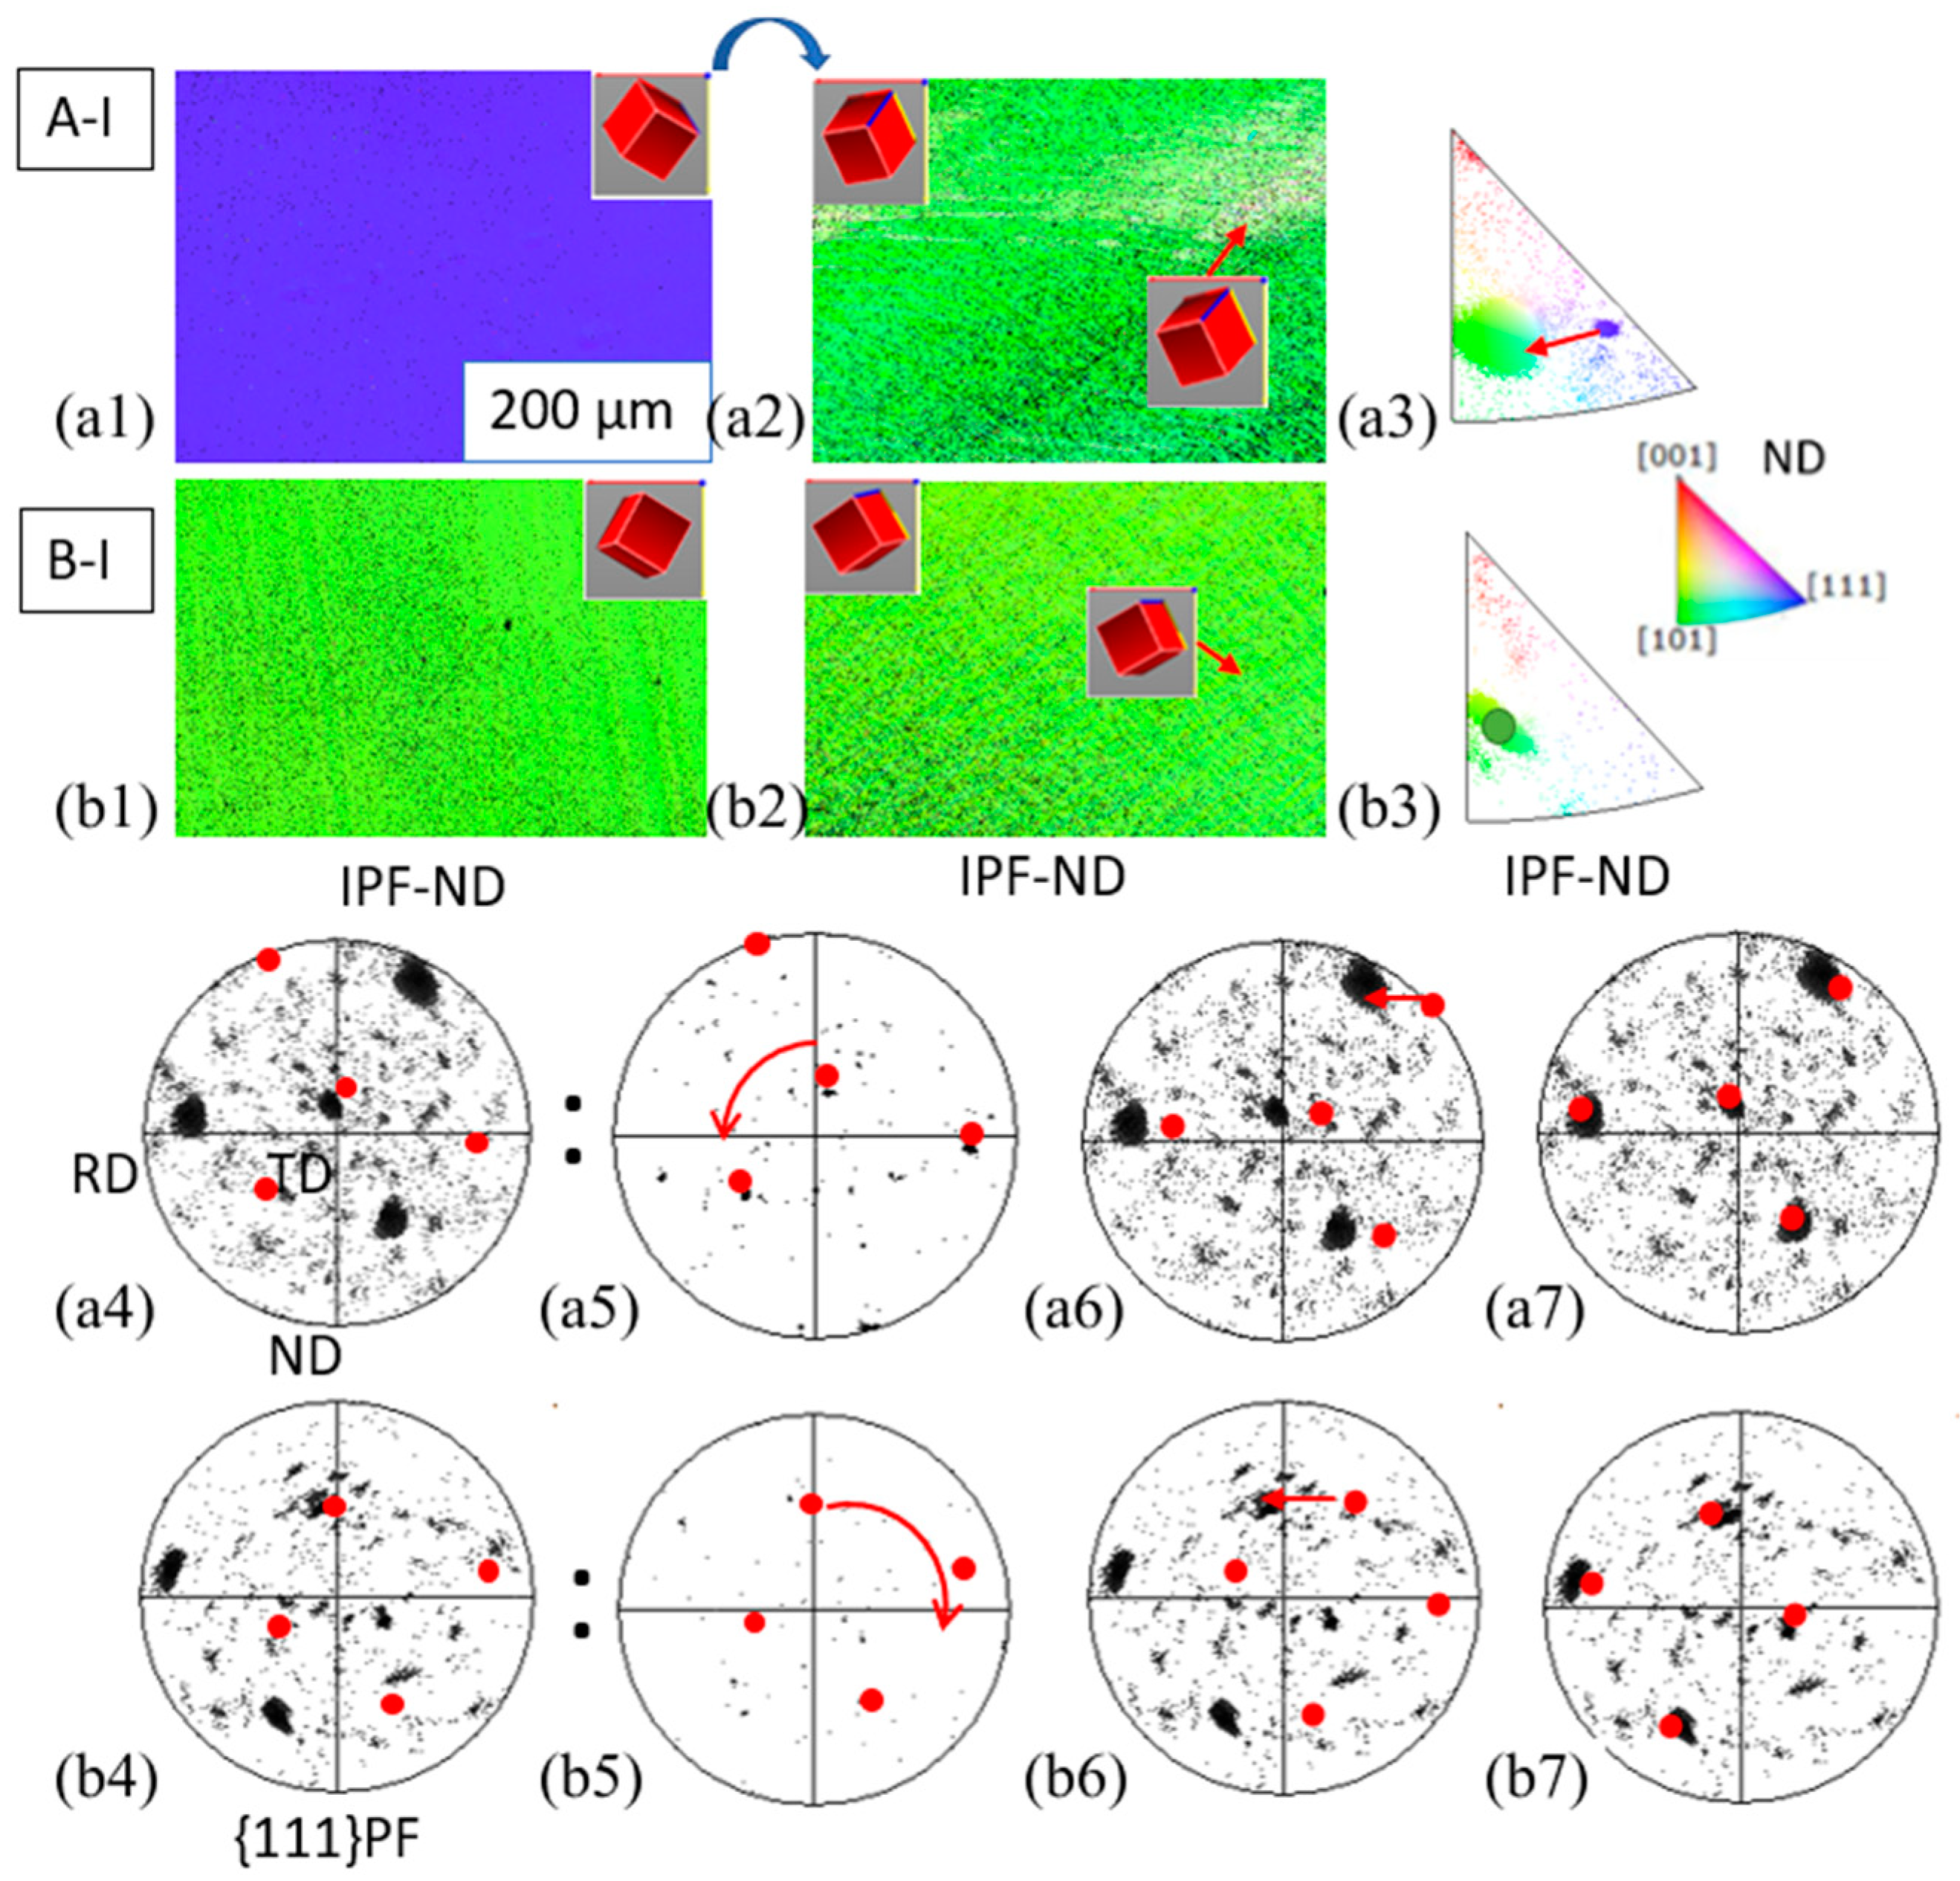
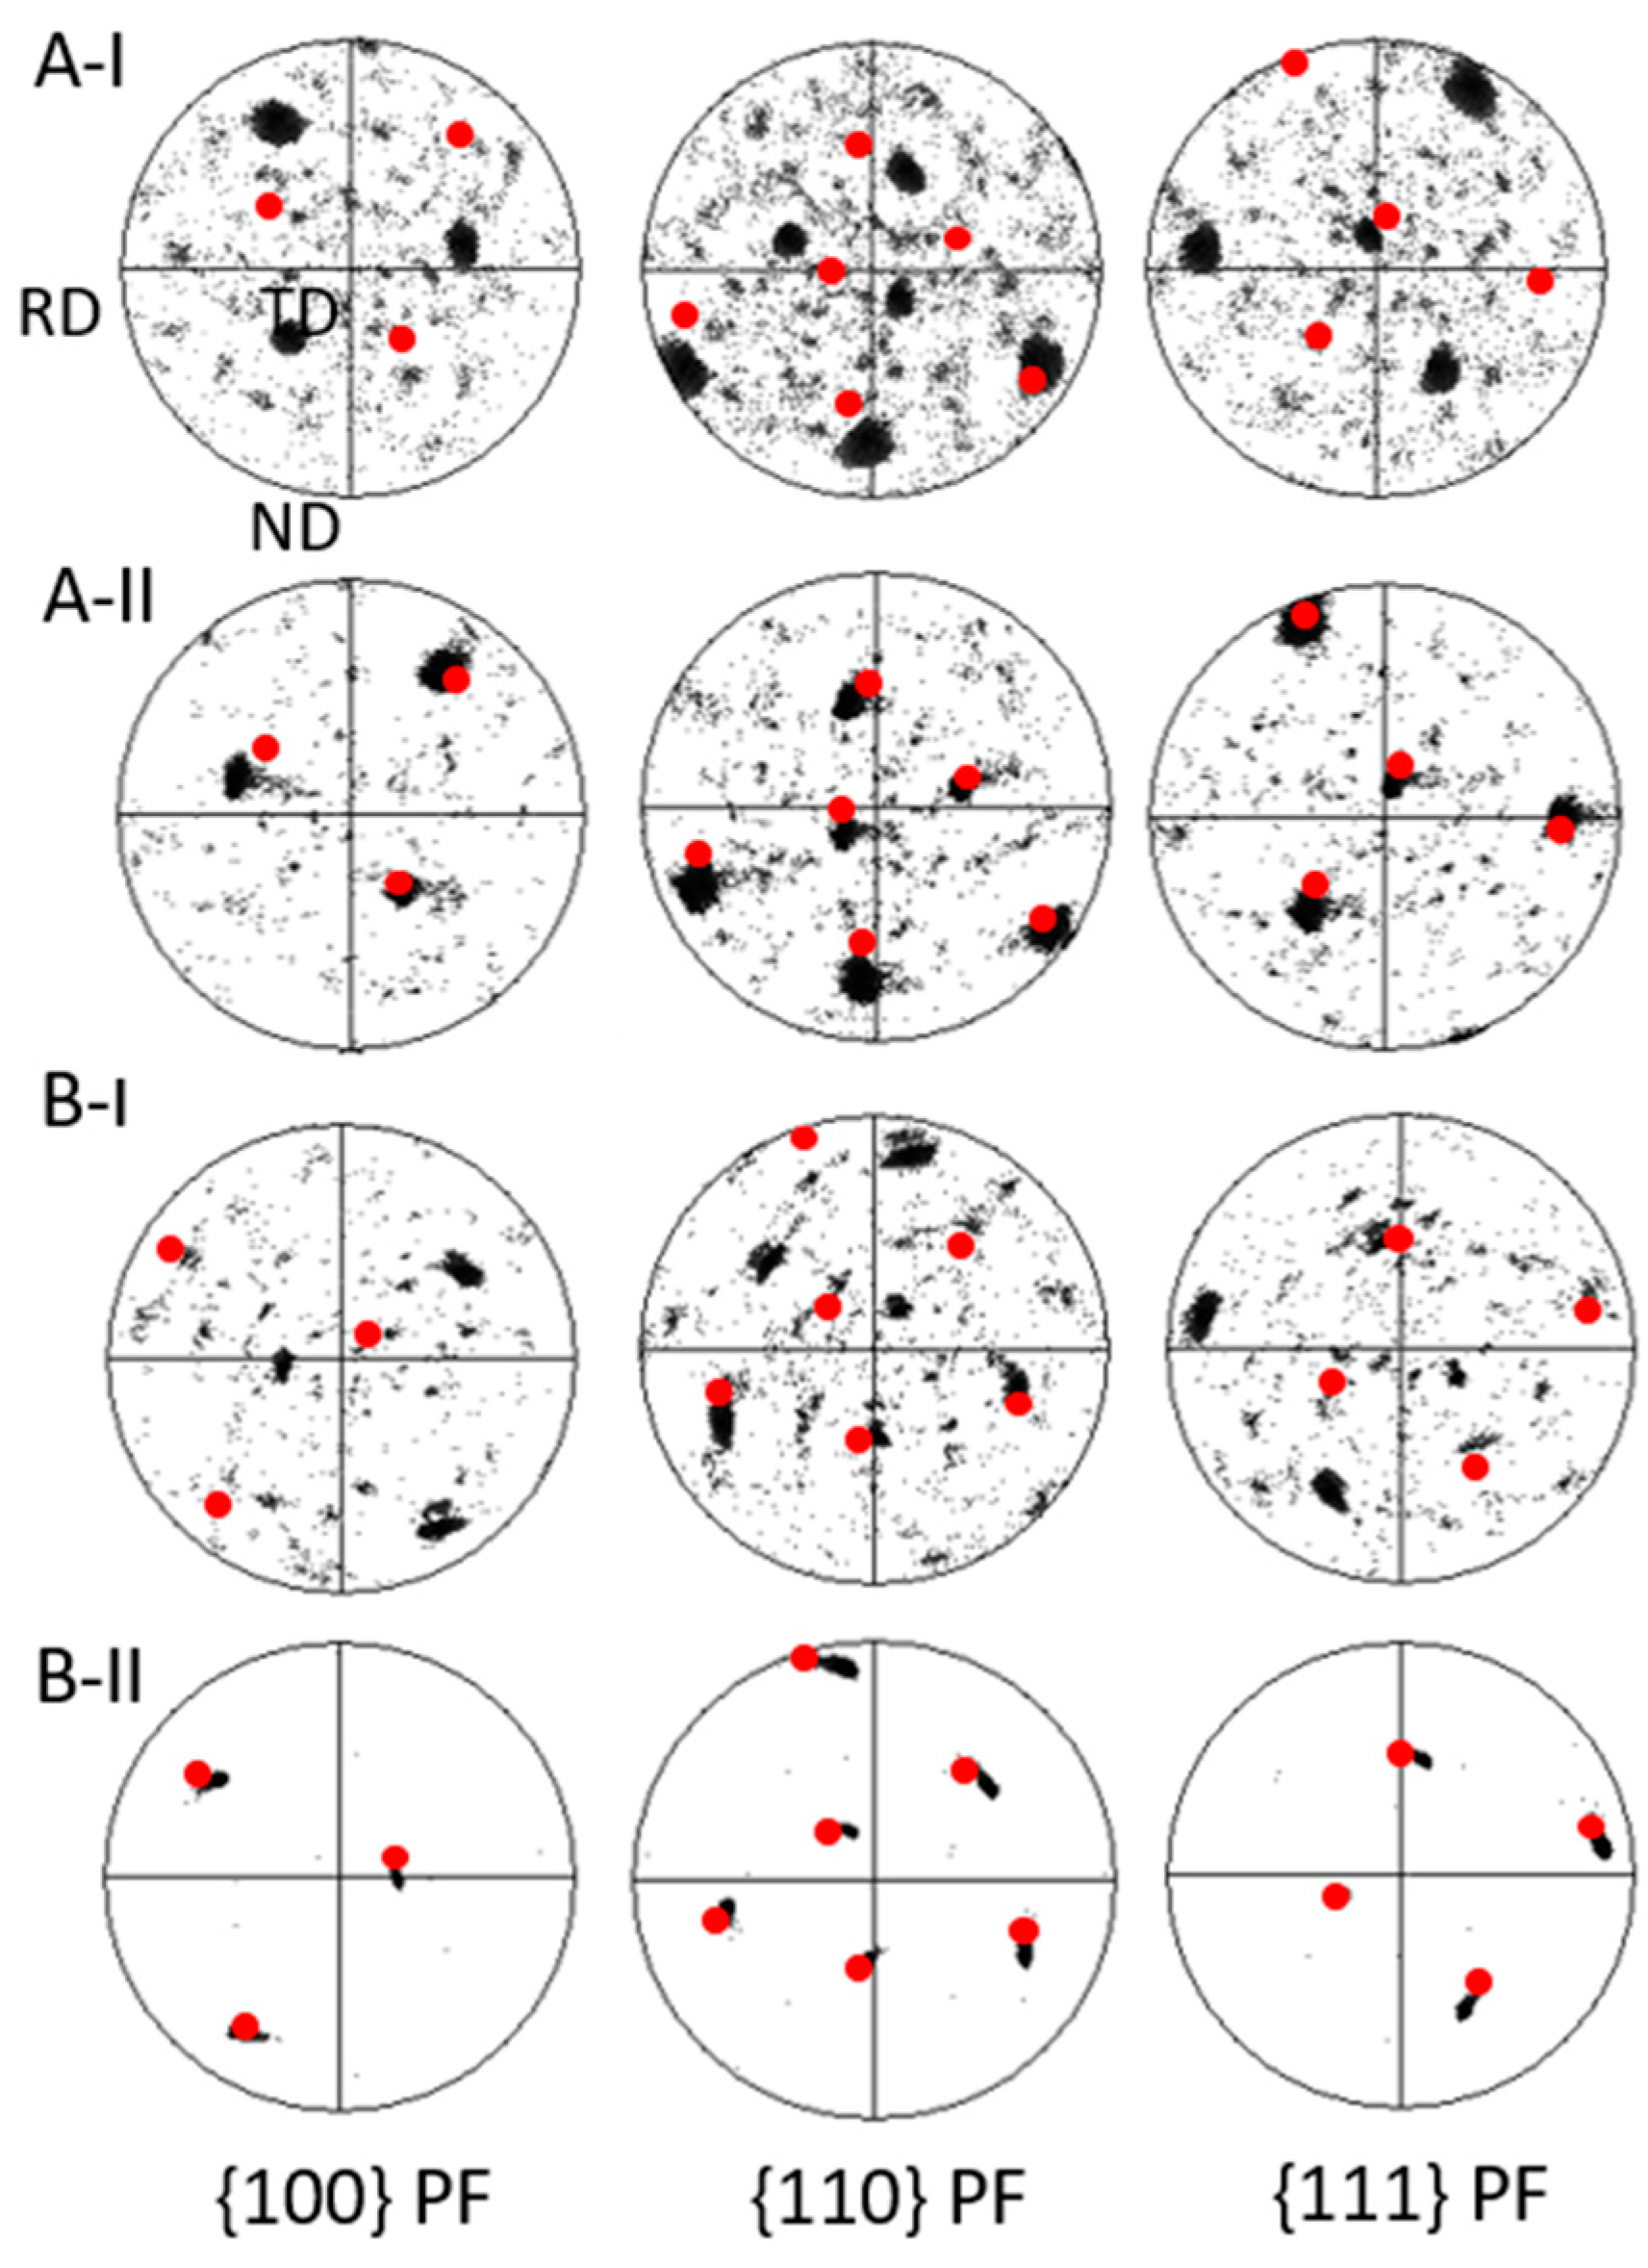
Orientation results of samples A-I and B-I in the undeformed and deformed matrix together with IPF-ND maps are plotted in Figure 5(a1,a2) and (b1,b2), and apparent rotations of the lattice are noted in both samples. The misorientation angle between undeformed and deformed lattice is 111.19° for A-I and 74.95° for B-I as calculated from the changes of Euler angles. The raw data for Euler angles are extracted from EBSD images and listed in Appendix A Table A1. The pole figure (PF) of the {111} plane for the deformed samples is superimposed with the undeformed PF in Figure 5(a4,b4), and Figure 5(a5–a7) and (b5–b7). This figure illustrates how lattices re-orientate themselves in PSC test. The rotations in both cases are found to be predominantly about TD, followed by a mild RD rotation. The PFs of {001} and {101} plane are presented in Appendix A Figure A1. EBSD IPF-ND maps for undeformed crystals alongside that of the deformed crystals are overlapped in Figure 5(a3,b3). The {101} slip planes tend to orientate perpendicular to the loading direction in the deformed states, which means the lattices are orientated to an orientation that would facilitate slip more easily.
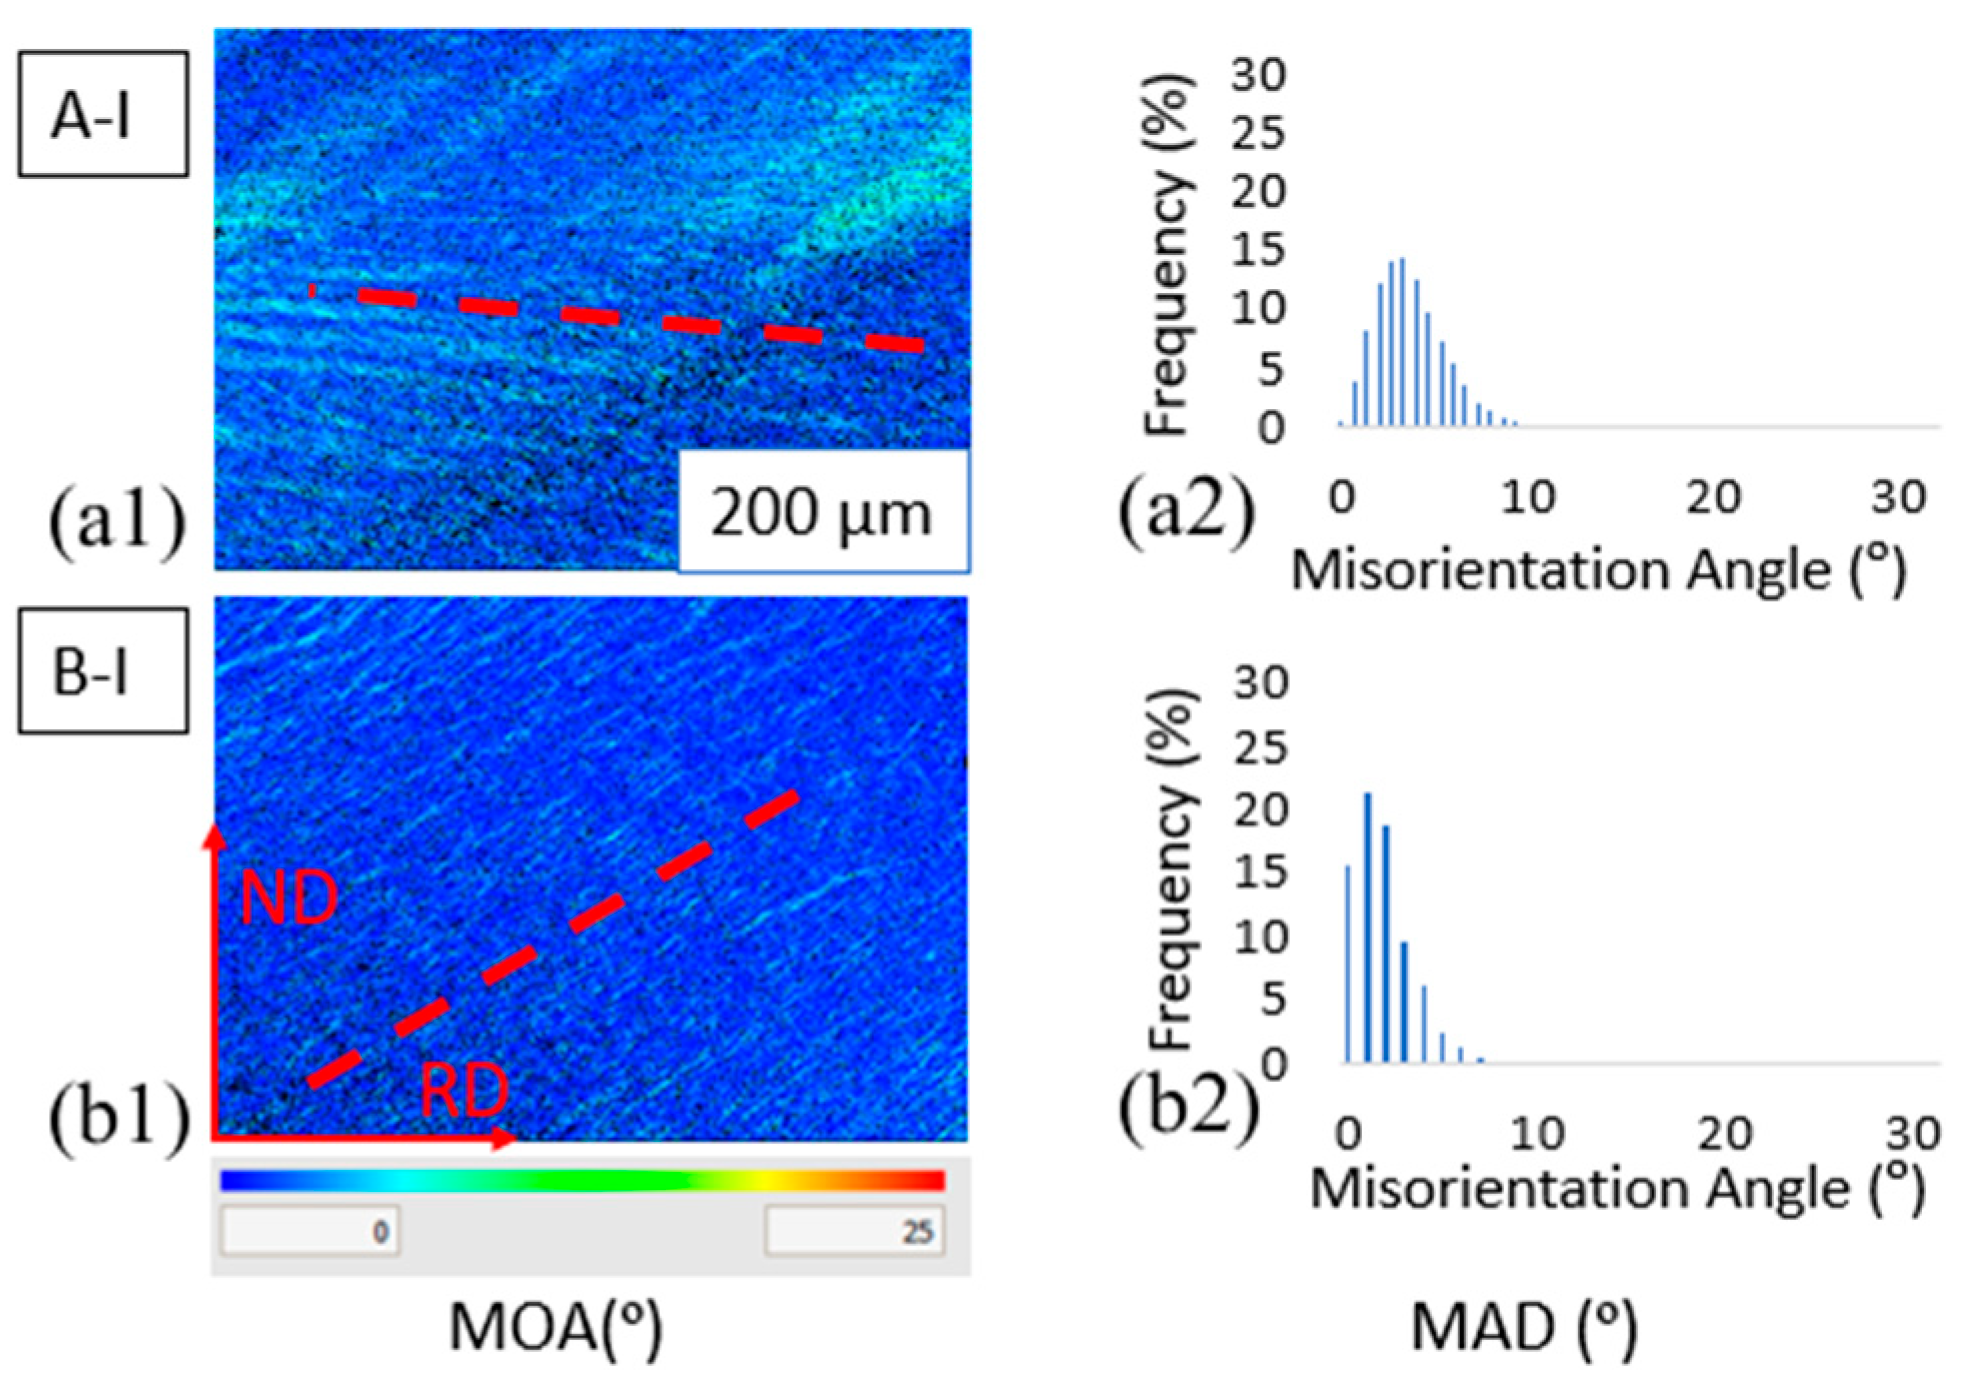
From the misorientation average (MOA) maps for deformed crystals (Figure 6(a1,b1)), different DBs are generated depending on the initial grain orientation. In A-oriented crystal, more distinct DBs are observed, accompanied by a greater increase in misorientation angle distribution (MAD) (compare Figure 6(a2) to (b2)).
3.2. Strain Rate Effect
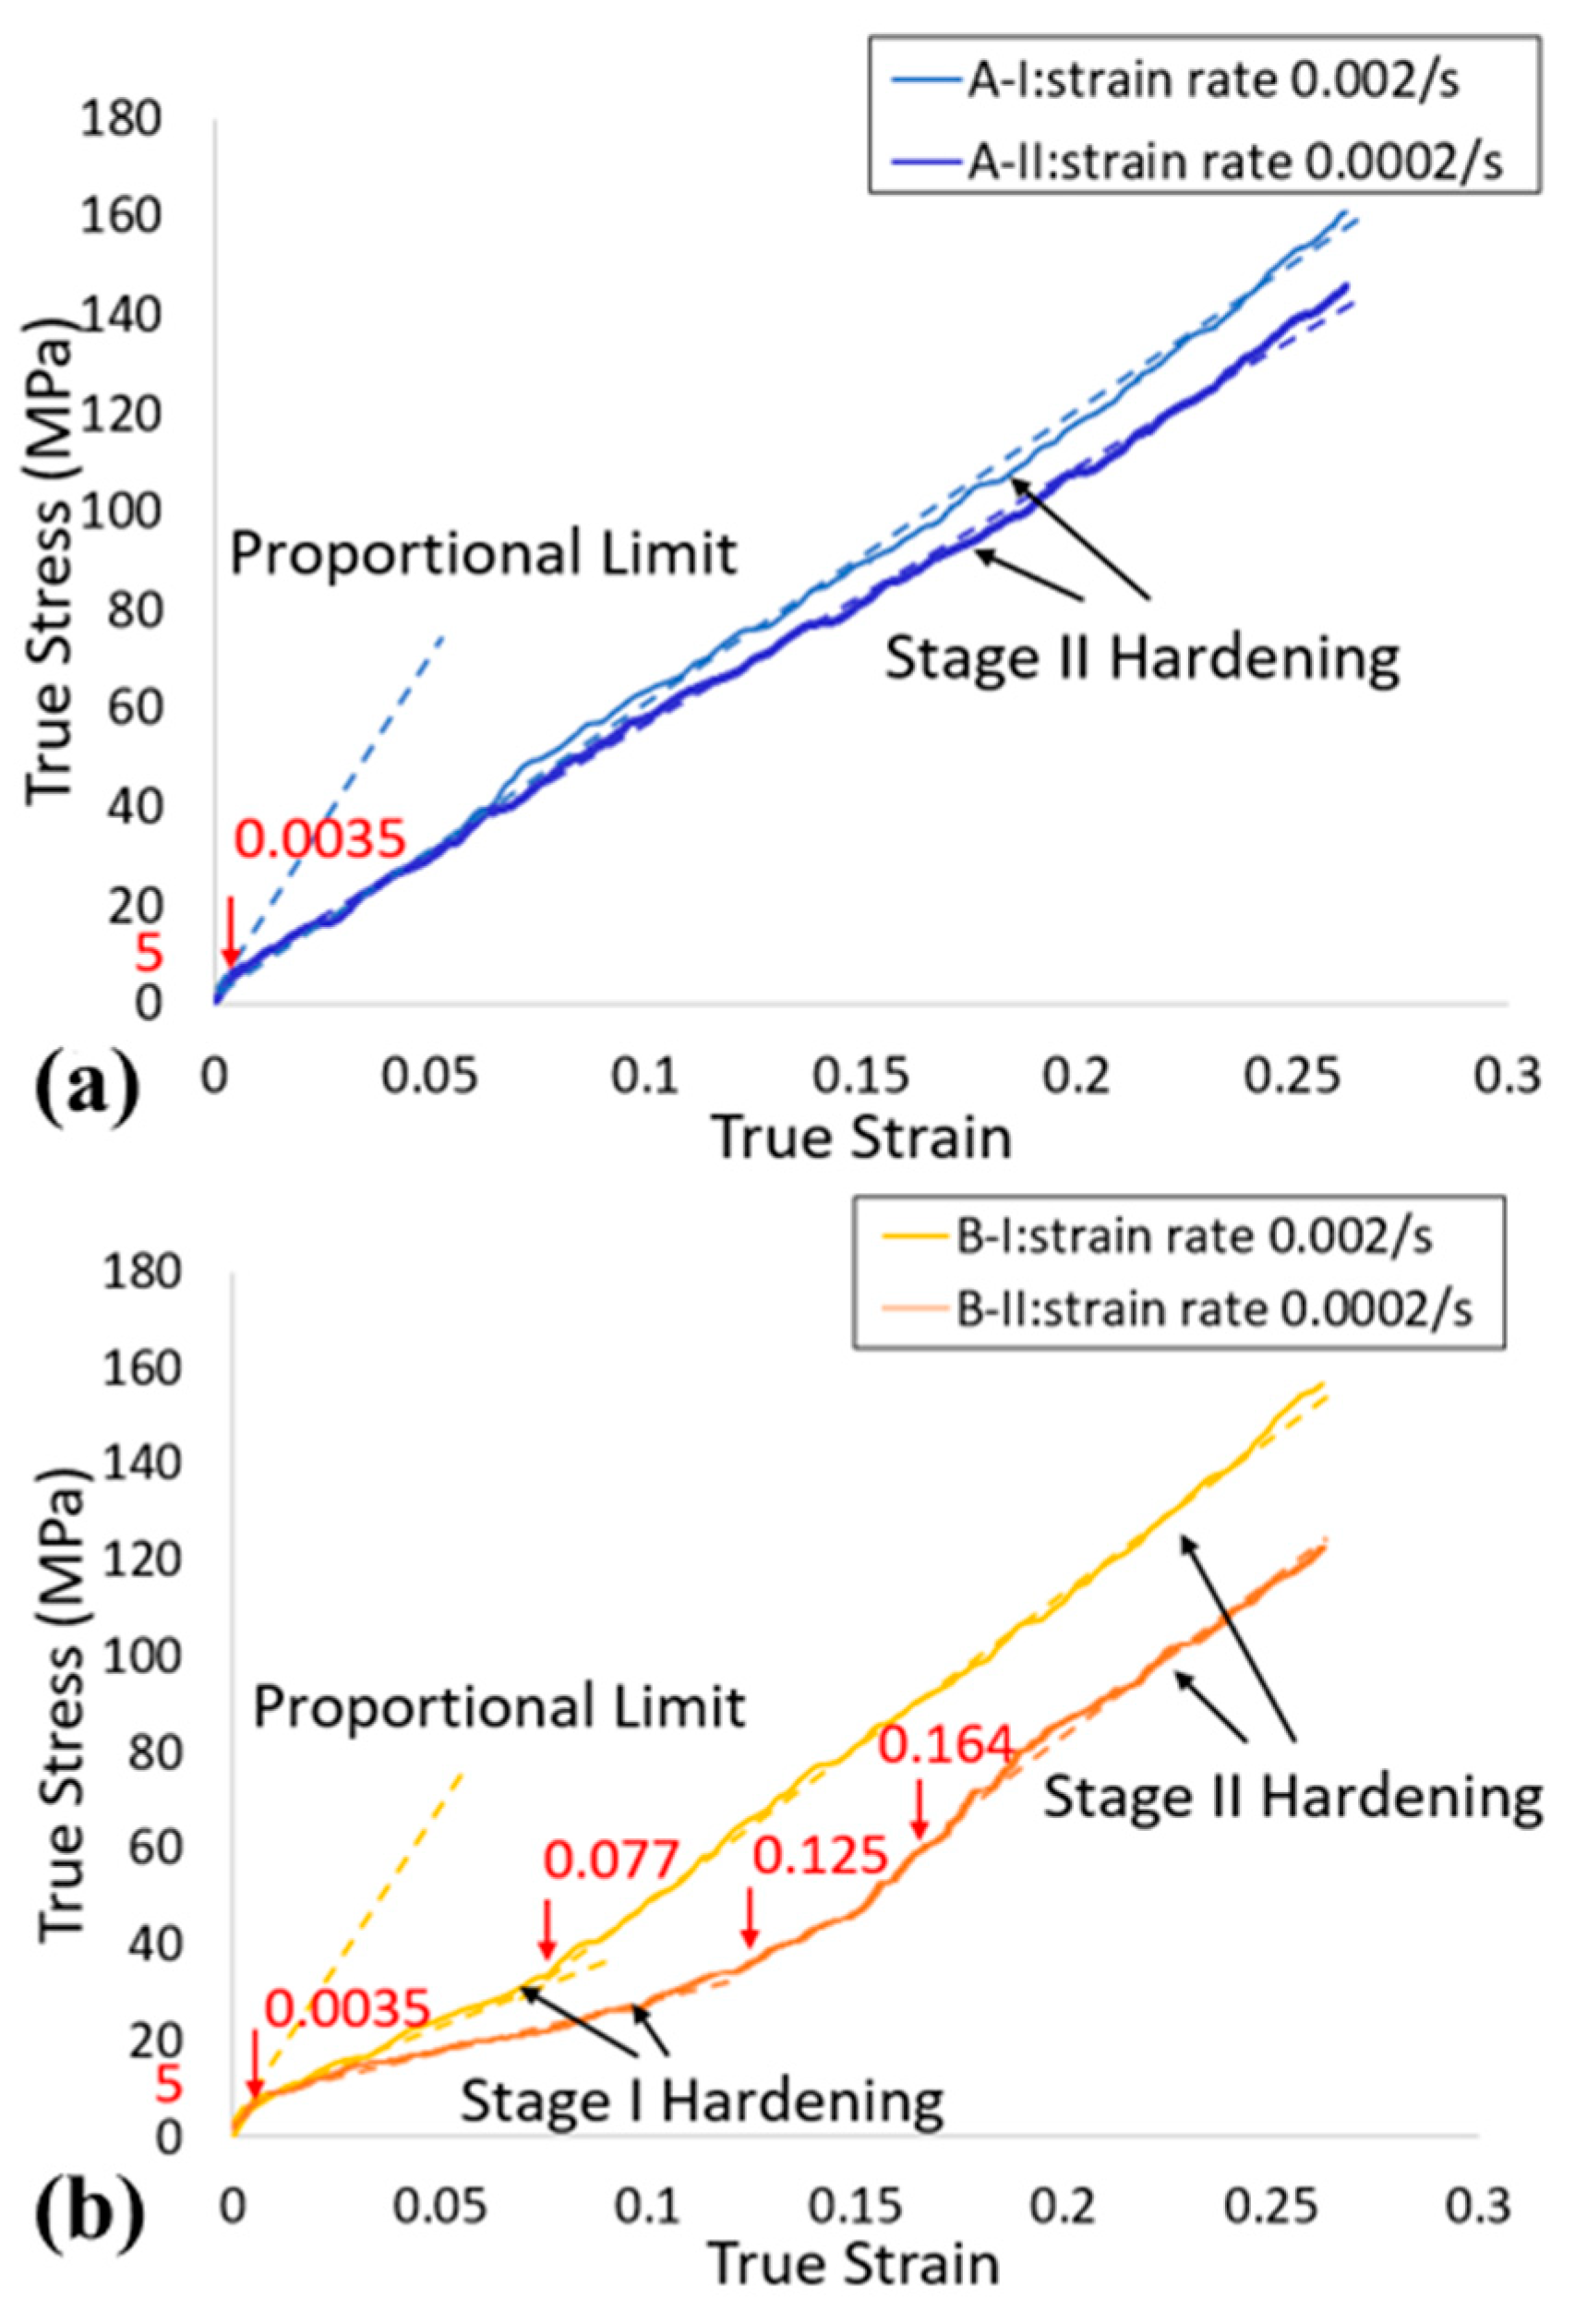
The true stress-strain curves for the samples deformed by one-directional PSC at 0.002/s and 0.0002/s are shown and evaluated in Figure 7. It clearly demonstrates that yield stress for pure aluminum single crystal is nearly independent of the grain orientation and strain rate. In the plastically deformed region, A-orientated samples (Figure 7a) had a strengthening mechanism of stage II hardening. The hardening rate in this stage is lower (523 MPa) in the case with a slow strain rate, resulting in a weak strain hardening effect. For B-oriented samples (Figure 7b), the overall strain hardening effect of case with slow strain rate is also weak. Besides, the slower deformation is found to lengthen the range of stage I hardening to the true strain of around 0.125 accompanied with the reduced
of 204 MPa. A distinct transition of hardening mechanism followed, covering the true strain from 0.125 to 0.164. Stage II hardening of 585 MPa then governed till the termination of the test. It can, therefore, be concluded that a slower strain rate contributes to a drop in the work hardening rate and lengthens stage I hardening for crystals experienced so.
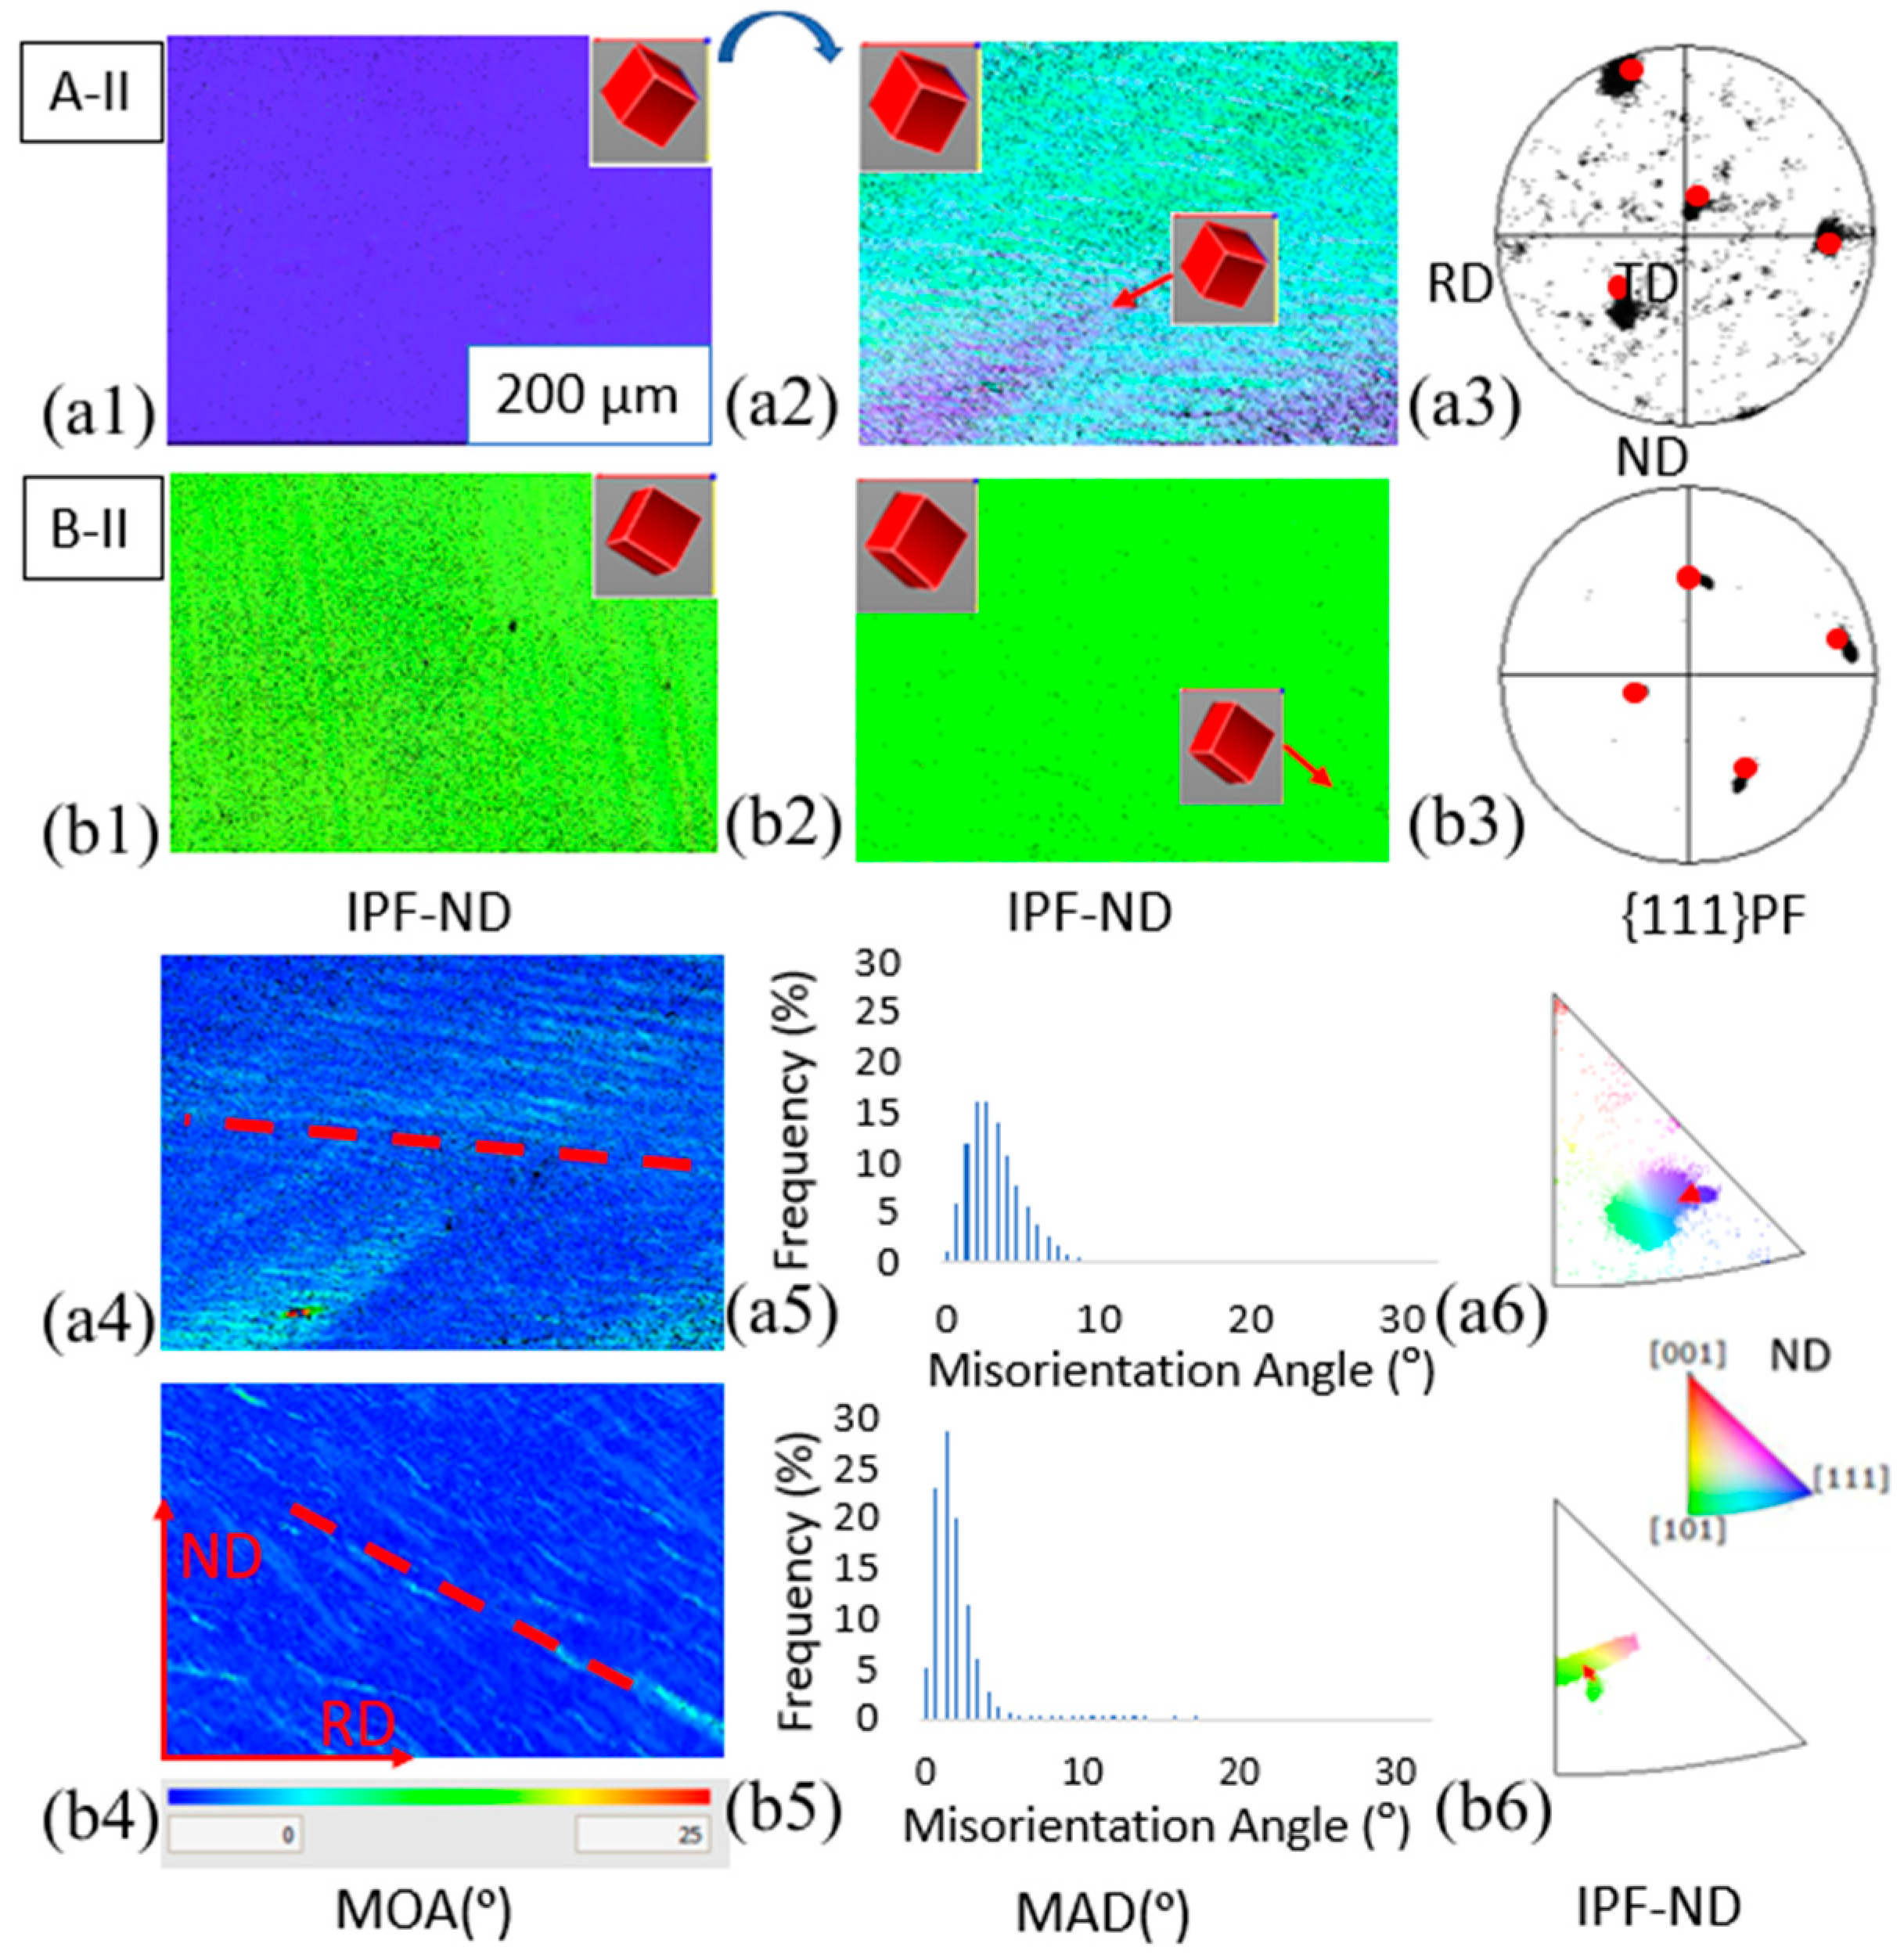
The EBSD maps for the crystals deformed at 0.0002/s are grouped in Figure 8. IPF-ND figures for undeformed and deformed crystals (Figure 8(a1,a2) and (b1,b2)) indicate that lattice in the matrix hardly rotated at this test condition regardless of starting orientations. The slight rotations are also proved by the small misorientation angles (i.e.,11.15° for A-II and 12.06° for B-II) and the minor TD rotations in the {111} PFs (Figure 8(a3,b3)). Compared to the aforementioned results collected at the strain rate of 0.002/s, it is evident that the rotation of oriented crystal in the matrix is highly dependent on the strain rate.
The MOA maps and MAD for the deformed samples (Figure 6 and Figure 8(a4,a5) and (b4,b5)) demonstrate the impacts of strain rate on the spatial distribution and formation of DBs. Particularly for the B-orientated samples, DBs of lower density and smoother deformation-induced grains boundaries are produced in the slower compression. In addition, the most apparent set of DBs incline at the nearly opposite direction in samples B-I and B-II (Figure 6(b1) and Figure 8(b4)).
3.3. Strain Path Effect
Figure 9 illustrates the true stress-strain curves for the SPCs: (a) one-directional PSC (A-I); (b) two-directional PSC-PSC testing with sample rotated around the RD after first straining (A-III); (c) two-directional PSC-PSC testing with sample rotated around the ND after first straining (A-IV). As expected, the mechanical response of the samples was similar in the first loading and then diverged from one another as deformation paths changed. Reloading raised the yield stress of pure aluminum significantly, and the increase was higher in A-IV (52 MPa) compared to A-III (42 MPa). In the second deformation, softening of the material occurred in two-directionally compressed samples with that being more noticeable in A-III than A-IV. It should be noted that, for case A-IV, the slope of the stress-strain curve in the initial stage is lower than the elastic modulus of pure aluminum (70 GPa). This was believed to be caused by the uneven surface of the samples after the first loading. The surface conditions of case A-III and case A-IV are shown in Figure 9b,c. As shown in Figure 9c the free surface becomes uneven after the first loading, and this surface is subject to plane strain condition in the second loading, which results in the deviations in case A-IV.
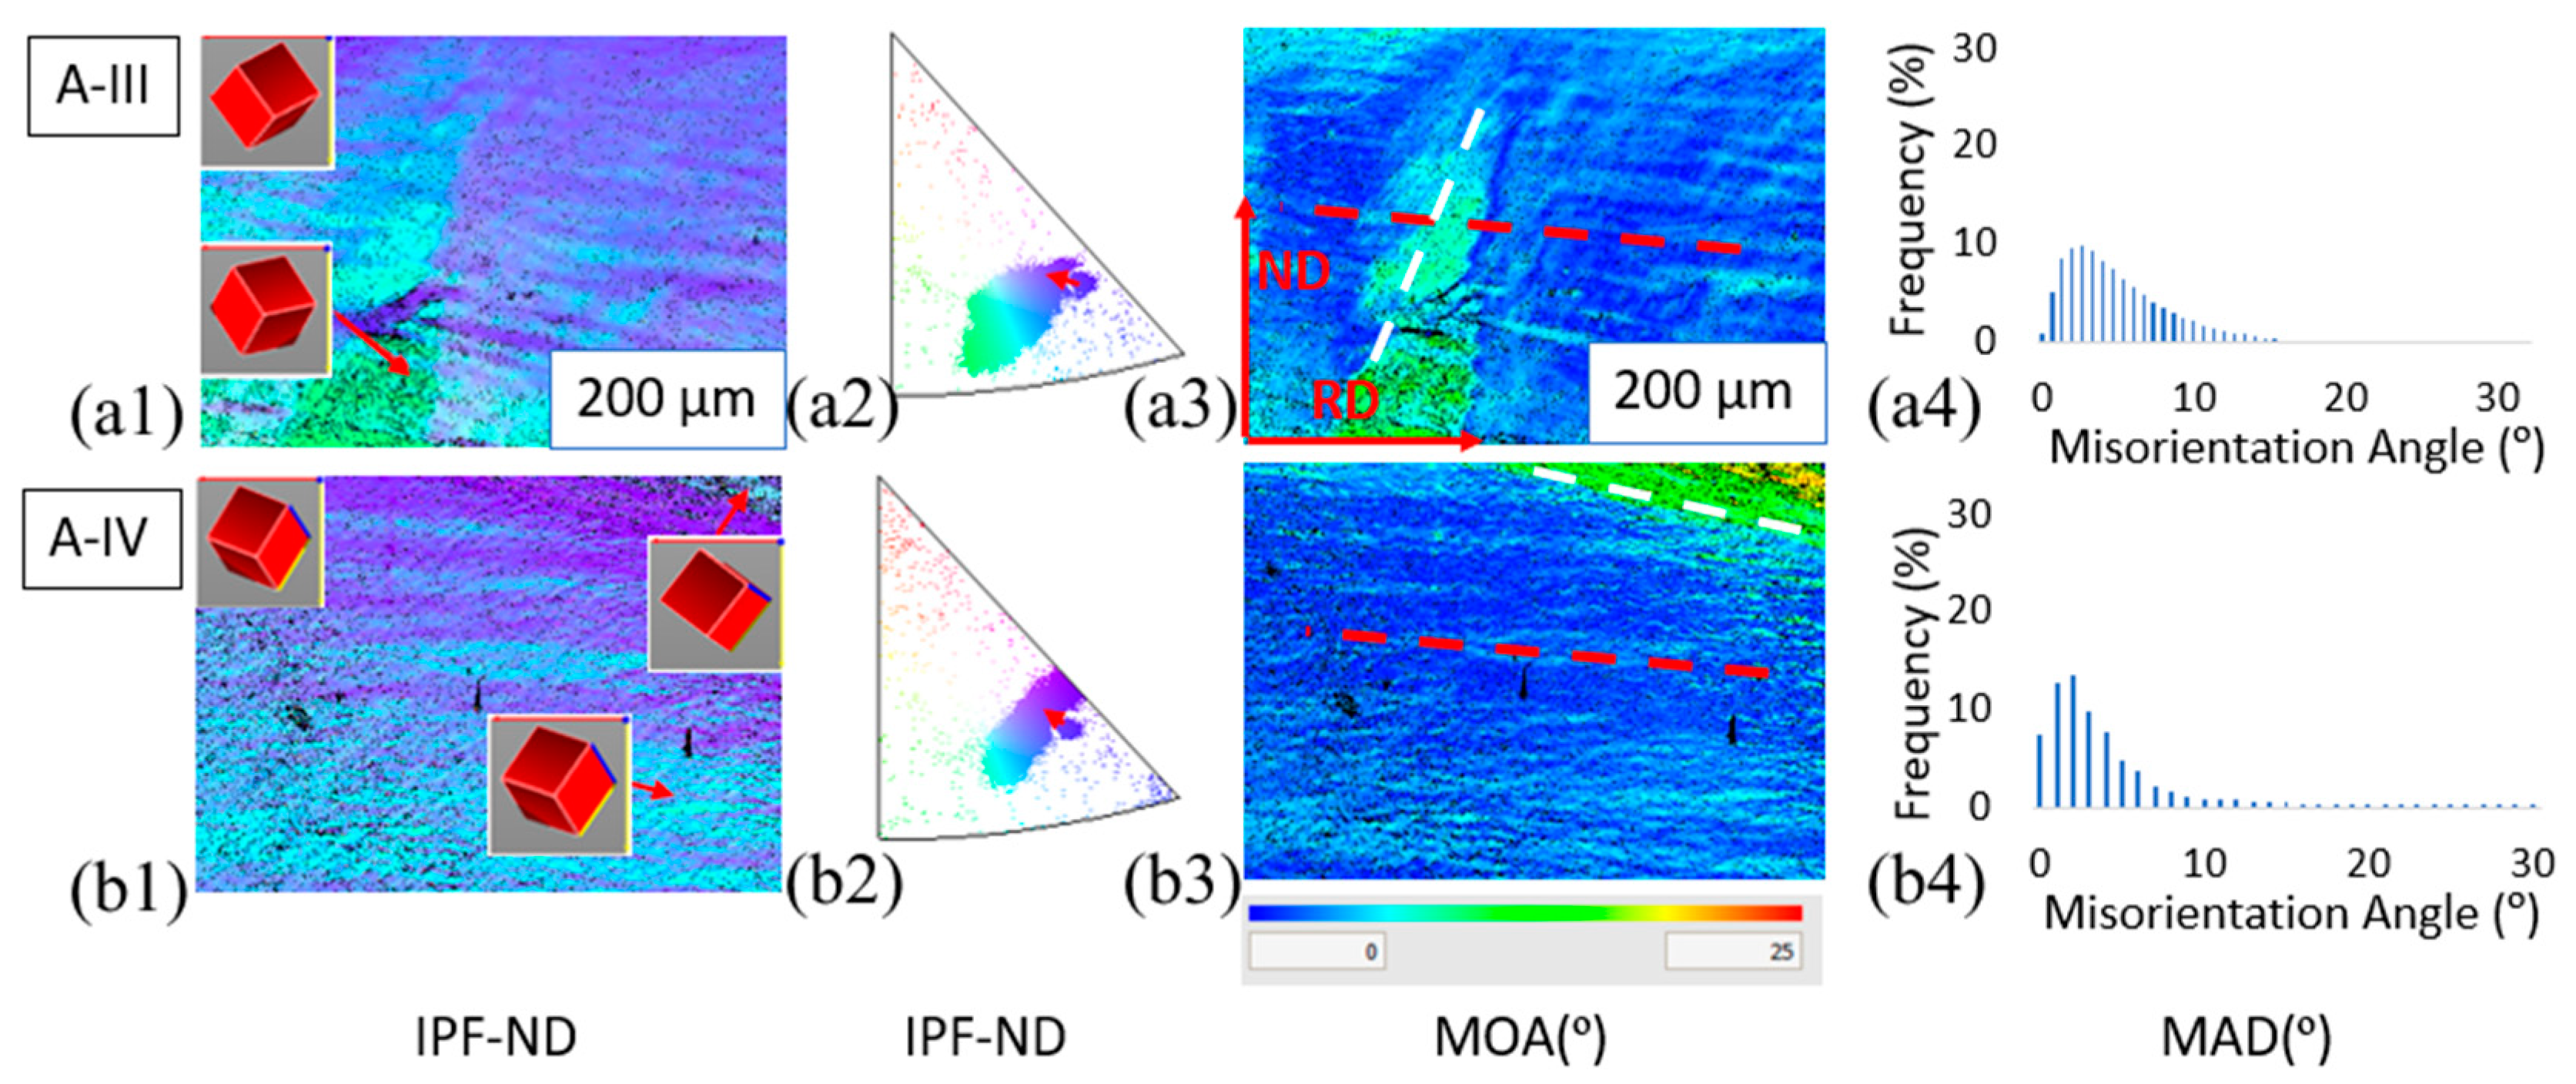
Microstructural characterizations for the two-directionally compressed samples are collected in Figure 10. Apparent lattice rotations in the matrix are noticed. Under SPCs, DBs develop into various shapes in the sense that other DBs sets are generated and incline at different directions. The newly produced DBs would lead to a higher misorientation angle.
4. Discussion
4.1. Grain Orientation Effect
Microstructural characterizations for the undeformed samples indicate that orientation A is inherently a ‘hard’ orientation in the sense that smaller initial shear stress is required to activate the slip planes compared to ‘soft’ orientation B. The differences in grain orientations significantly impact the flow curves (Figure 4) such that stage I hardening is only observed in ‘soft’ orientation. For crystal with ‘hard’ orientation, A-I experiences stage II hardening solely, and this high linear work hardening rate is a consequence of the geometrical storage of dislocations that arises from the statistical variation in the dislocation forests [35,36,37]. Whereas B-I undergoes large strain with little strain hardening initially in which a single slip is sufficient to cause plastic deformation of the metals. As more dislocations accumulate on the primary slip system, a critical resolved shear stress could be generated on the secondary slip systems [35]. The tangling up of primary with secondary dislocations leads to subsequent stage II hardening [37].
The stress-strain data from this experiment are compared to other PSC tests conducted on single crystals pure aluminum. Basson and Driver [2] showed that for cube-oriented crystal was 54 MPa at the strain rate of 0.01/s, and Akef and Driver [4] concluded
to be 110 MPa and 84 MPa for cube and 45° rotated cube orientations. Work hardening rates calculated in this study are comparatively high compared to those measured by other researchers. This appears to be the consequence of the inevitable frictions, the difference in the purity of samples, the type of deformation, the high strain rate and most importantly, the grain orientation itself. However, the hardening behaviors and the deformation patterns in those crystals are in the range of results obtained for single crystal aluminum and match other observations.
The grain orientation also profoundly influences the characteristics of DBs. In stage II hardening, the amplitude of orientation gradient raises with increasing plastic strain [35], and the high orientation gradients gradually contribute to the formation of DBs [32]. Hence, more evident deformation banding is observed in ‘hard’ orientation. Besides, grain orientation dominates the types of dislocation-dislocation interaction [38] such that ‘soft’ orientation could deform relatively homogeneously, and dislocation entanglements are less frequent.
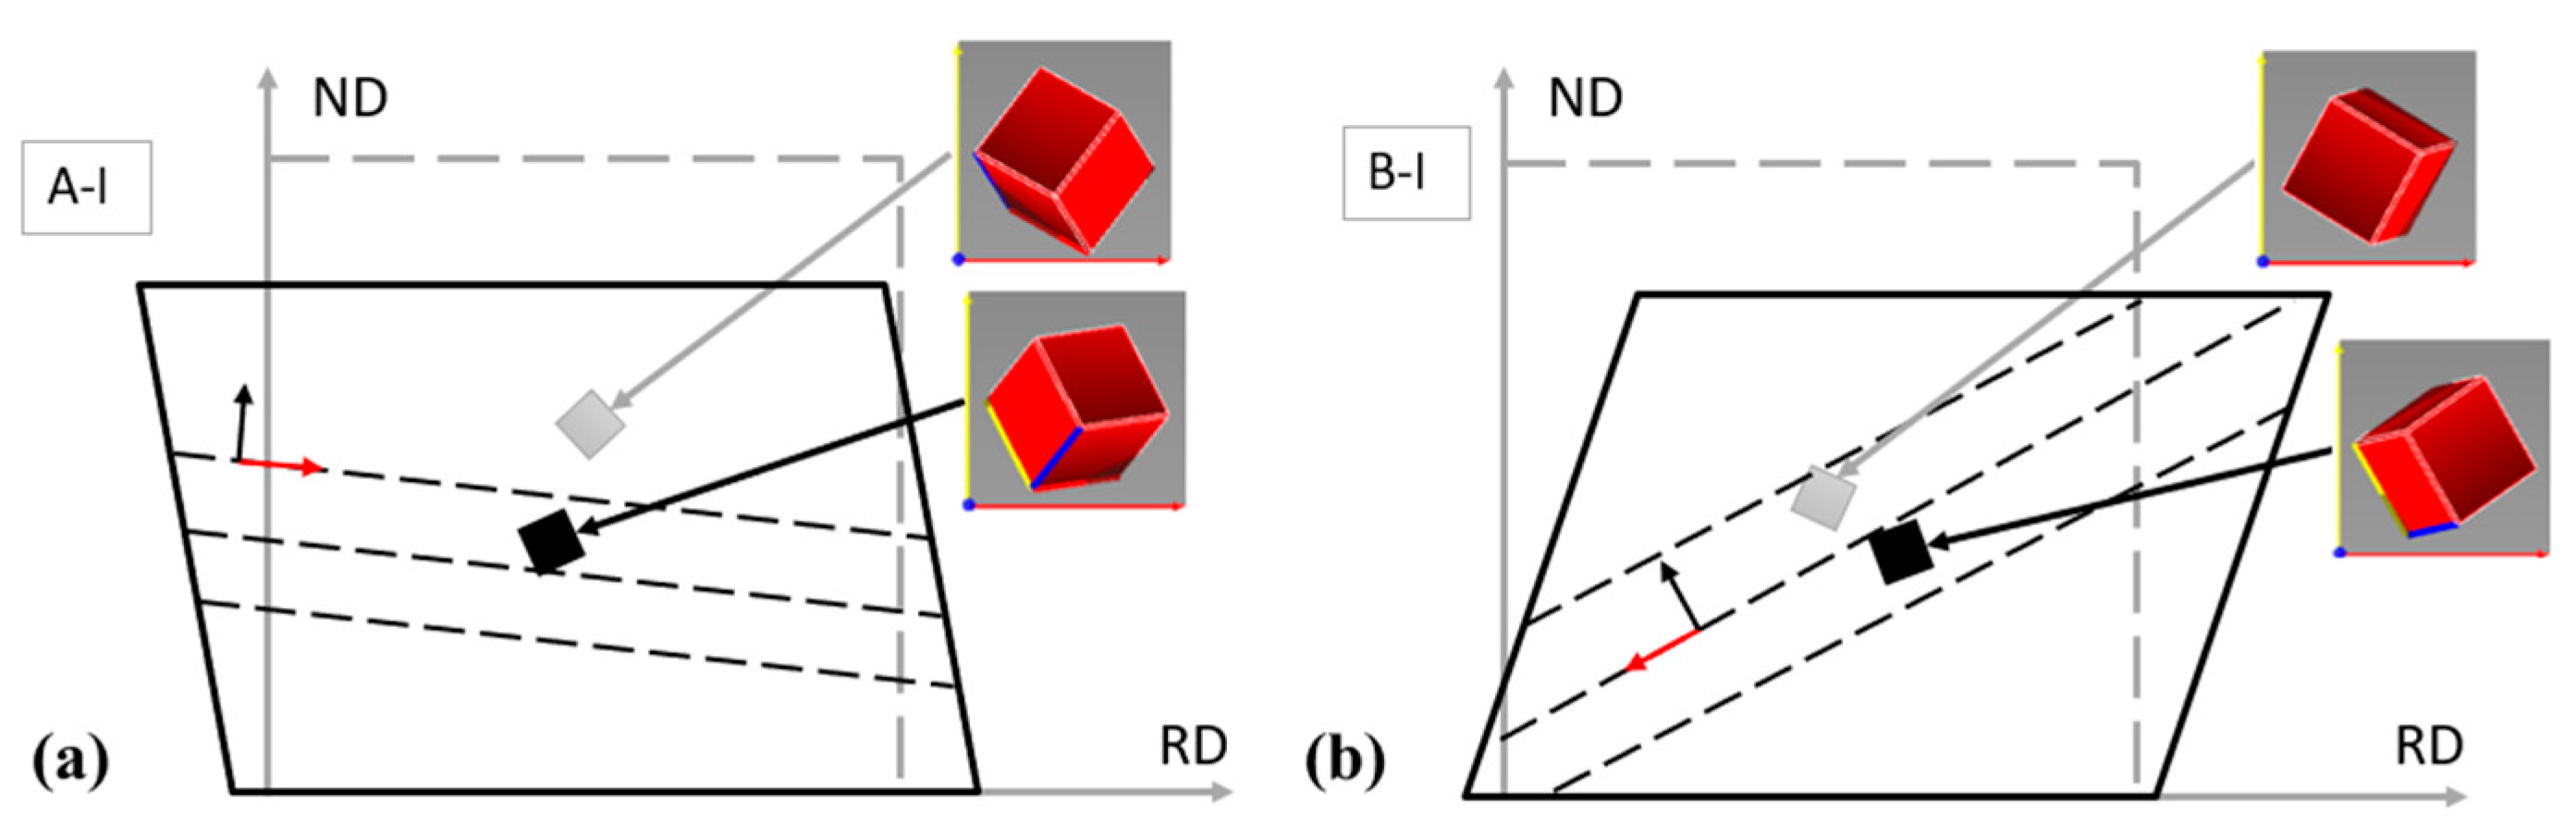
For both orientations, the rotations of lattices in the matrix are remarkable at the test speed of 0.002/s, with the misorientation angle being larger in the ‘hard’ orientation. This significant rotation of the whole crystalline structure, in addition to the generation of DBs is presented in Figure 11.
4.2. Strain Rate Effect
Dieter [39] concludes that the stage II hardening is mildly dependent on the grain orientation and strain rate. The results from this study support this statement reasonably well. With the reduction in compression speed, the annihilations between oppositely signed dislocations occur more frequently. As a consequence, lower stress, thus lower work hardening rate is demanded to cause further plastic deformation. In addition, the grain orientation affects the sensitivity of strain rate in the sense that the decrease in hardening rate is of a higher percentage for ‘hard’ orientation than that for ‘soft’ orientation.
The strain rate, meanwhile, highly influences the stage I hardening, so slower compression not only drops the work hardening rate following the aforementioned mechanism but also lengthens the stage I hardened plastic region as explained by the features of DBs. For B-II, DBs are of lower density with thicker width and more sparsely spaced compared to B-I. The DBs characteristics mean that the sliding of single slip had encountered fewer barriers such that slip traveled to a longer distance at slower compression. Dislocations thus accumulated on other slip systems less frequently, and an easy glide stage could dominate a greater strain range. It is noticed that DBs incline roughly oppositely to the RD in B-I and B-II. This is attributed to that sets of slip systems have high yet similar resolved shear stress so that they can be equally activated when loaded, and factors like surface stress raiser determine which set would cause the slip.
Among other researchers, a few have pointed out the overall lattice re-orientation for plane strain compressed single crystal pure aluminum [40,41]. However, this work states firmly that the rotations of lattices in the matrix of aluminum crystal are strongly dependent on the strain rate as noticeable misorientation angles are noticed at the 0.002/s compression. In addition, unlike the previous literature in which it is the macroscopic deformation banding lead to the divergent lattice rotation [2,33], the DBs in the compressed samples are too subtle to cause strong orientation splitting.
4.3. Strain Path Effect
Higher yield stress and lower hardening rate than these in the corresponding monotonic stress-strain curve occur after SPCs. The former is a direct consequence of the introduction of dislocations to a single crystal, and the latter results from the attractions and annihilations between oppositely signed dislocations [39]. Bauschinger effect, commonly observed in reversal and pseudo-reverse SPCs [42], is noticed in sample A-IV, and this transient in the flow stress curve is caused by micro-plasticity as proposed by Hu et al. [43].
The effect of work softening is more dramatic in A-III than in A-IV, and this phenomenon is explained by the differences in imposed constraints and dislocation sliding. Experimental evidence has shown that the deformation microstructures in the center of grains differ from those near the grain boundaries in the sense that more slip systems will be activated in the boundary parts [32,44]. For a single crystal in a channel die, the boundaries are well simulated by the imposed stress and the plane strain conditions; therefore, in regions near the highly constrained surfaces, more activated slips would result in more frequent generations and accumulations of dislocations.
Figure 12 depicts the SPCs in A-III and A-IV, and the constrained surfaces of the two kinds are colored differently. Both specimens elongate and shear along the RD in the first loading. A-III is then rotated 90° around the RD in a way that the surfaces normal to the RD remain unchanged. Meanwhile, A-IV has a 90° rotation about ND, and the surfaces subjected to plane strain condition now lie perpendicular to the RD. Compared to A-III in which the RD slips are still free, the pre-accumulated dislocations impede the slips along the elongation direction in A-IV. The difference of dislocation sliding freeness in RD affects the deformation stress such that A-IV demands higher stress in the second deformation path.
5. Conclusions
Plane strain compression (PSC) tests were systematically implemented on single crystal pure aluminum (SCPA) in this project. The flow stress curve and the EBSD mappings were utilized to study the microstructure of the compressed specimen. The effects of grain orientation, strain rate, and strain path on deformation and mechanical response were studied. The re-orientation of lattice and formation of DBs were also analyzed. The main conclusions can be summarized as follows:
- (1)
- The hardening mechanisms are profoundly affected by grain orientation such that ‘easy glide’ may not occur in certain crystal orientations, resulting in different stress-strain curves under different orientations. Strain rate also shows pronounced effects on the work hardening rate, particularly for stage I hardening. These two factors lead to distinct mechanical responses and deformation behaviors, which are critical in the metal forming process.
- (2)
- The degree of cube rotation is noticeable under the 0.002/s PSC, and lattices barely rotate at the slower compression rate of 0.0002/s. This shows the strong dependence of crystal lattices re-orientation on the strain rate. Grain orientation is observed to mildly impact the subsequent lattice rotation as well.
- (3)
- DBs are generated on the basis of the matrix lattice re-orientation. The forms of DBs show strong diversification under different hardening mechanisms. Furthermore, the density of DBs depends on the strain rate such that DBs are more finely spaced at faster compression.
- (4)
- Yields stress is profoundly affected by the strain path, such that reloading results in higher yield stress for pure aluminum. In two-directional PSC, the level of force demanded for the second compression is determined by the freeness of dislocation sliding in the elongation direction.
Author Contributions
Y.X. initiated this work, performed the mechanical testing, documented the microstructure characterization, and analyzed the data. Q.L. facilitated throughout the project. K.Z. assisted in designing the work. J.J. supervised the work. Y.X. drafted the manuscript and revised the work with Q.L. W.W. revised and handled the submission of this manuscript. All authors have read and agreed to the published version of the manuscript.
Funding
This research was funded by the EPSRC LightForm program, grant number EP/R001715/1.
Data Availability Statement
The data presented in this study are available from the corresponding author upon request.
Acknowledgments
The strong support from the Aviation Industry Corporation of China (AVIC), the First Aircraft Institute (FAI), China Scholarship Council (CSC), the Henry Lester Trust and the Great Britain-China Educational Trust for this funded research is much appreciated. The research was performed at the AVIC Centre for Structural Design and Manufacture at Imperial College London. The authors would gratefully thank Prof Jiao Zhang and Prof Hui Xing for their assistance on providing the samples and like to thank Dr Ruth Brooker and Suresh Viswanathan Chettiar for training and support of the instrument. Jun Jiang would like to thank EPSRC for the funding from the LightForm program: EP/R001715/1.
Conflicts of Interest
The authors declare no conflict of interest.
Appendix A

Table A1.
Euler angles for the oriented crystal in the undeformed and deformed matrix.
| Deformation Condition | Case | Pixel Coordinate | φ | θ | ψ | Misorientation Angle (°) |
|---|---|---|---|---|---|---|
| Undeformed | A | - | 214.4 | 37.5 | 111.9 | - |
| Deformed | A-I | 26,8 | 142.2 | 44.6 | 273 | 111.19 |
| Deformed | A-II | 352,102 | 218 | 41.7 | 118.3 | 11.15 |
| Undeformed | B | - | 293.2 | 20.7 | 48.1 | - |
| Deformed | B-I | 29,19 | 99.3 | 27.6 | 291.3 | 74.95 |
| Deformed | B-II | 250,243 | 263.8 | 27.9 | 60.4 | 12.06 |
Figure A1.
{100} {110}, and {111} plane for the deformed single crystal A-I, A-II, B-I and B-II. Red dots show the orientation for the undeformed sample.
Figure A1.
{100} {110}, and {111} plane for the deformed single crystal A-I, A-II, B-I and B-II. Red dots show the orientation for the undeformed sample.

References
- Polmear, I.J. Light Alloys: Metallurgy of the Light Metals; Arnold: London, UK, 1995. [Google Scholar]
- Basson, F.; Driver, J.H. Deformation banding mechanisms during plane strain compression of cube-oriented f.c.c. crystals. Acta Mater. 2000, 48, 2101–2115. [Google Scholar] [CrossRef]
- Ferry, M.; Humphreys, F.J. The deformation and recrystallisation of particle-containing {011} <100> aluminium crystals. Acta Mater. 1996, 44, 3089–3103. [Google Scholar] [CrossRef]
- Akef, A.; Driver, J.H. Orientation splitting of cube-oriented face-centred cubic crystals in plane strain compression. Mater. Sci. Eng. A 1991, 132, 245–255. [Google Scholar] [CrossRef]
- Wert, J. Dislocation boundary formation in a cold-rolled cube-oriented Al single crystal. Acta Mater. 1997, 45, 2565–2576. [Google Scholar] [CrossRef]
- Tóth, L.S.; Jonas, J.J.; Daniel, D.; Ray, R.K. Development of ferrite rolling textures in low- and extra low-carbon steels. Metall. Trans. A 1990, 21, 2985–3000. [Google Scholar] [CrossRef]
- Ardakani, M.G.; Humphreys, F.J. The annealing behaviour of deformed particle-containing aluminium single crystals. Acta Metall. Mater. 1994, 42, 763–780. [Google Scholar] [CrossRef]
- Yan, S.L.; Yang, H.; Li, H.W.; Yao, X. Variation of strain rate sensitivity of an aluminum alloy in a wide strain rate range: Mechanism analysis and modeling. J. Alloys Compd. 2016, 688, 776–786. [Google Scholar] [CrossRef]
- Borodin, E.N.; Gruzdkov, A.A.; Mayer, A.E.; Selyutina, N.S. Physical nature of strain rate sensitivity of metals and alloys at high strain rates. J. Phys. Conf. Ser. 2018, 991, 012012. [Google Scholar] [CrossRef]
- Yamada, H.; Ogasawara, N.; Shimizu, Y.; Horikawa, H.; Kobayashi, H. Effect of high strain rate on micro-indentation test in pure aluminum. EPJ Web Conf. 2012, 26, 01028. [Google Scholar] [CrossRef] [Green Version]
- Yan, S.L.; Yang, H.; Li, H.W.; Ren, G.Y. Experimental study of macro–micro dynamic behaviors of 5A0X aluminum alloys in high velocity deformation. Mater. Sci. Eng. A 2014, 598, 197–206. [Google Scholar] [CrossRef]
- Suo, T.; Chen, Y.; Li, Y.; Wang, C.; Fan, X. Strain rate sensitivity and deformation kinetics of ECAPed aluminium over a wide range of strain rates. Mater. Sci. Eng. A 2013, 560, 545–551. [Google Scholar] [CrossRef]
- Khan, A.S.; Liu, H. Variable strain rate sensitivity in an aluminum alloy: Response and constitutive modeling. Int. J. Plast. 2012, 36, 1–14. [Google Scholar] [CrossRef]
- Soare, M.A.; Curtin, W.A. Solute strengthening of both mobile and forest dislocations: The origin of dynamic strain aging in fcc metals. Acta Mater. 2008, 56, 4046–4061. [Google Scholar] [CrossRef]
- Liu, Q.; Hansen, N.; Maurice, C.; Driver, J. Heterogeneous microstructures and microtextures in cube-oriented al crystals after channel die compression. Metall. Mater. Trans. A 1998, 29, 2333–2344. [Google Scholar] [CrossRef]
- Sabat, R.K.; Samal, P.K.; Ahamed, S.M. Effect of strain path on the evolution of microstructure, texture and tensile properties of WE43 alloy. Mater. Sci. Eng. A 2018, 715, 348–358. [Google Scholar] [CrossRef]
- Chen, X.; Peng, Y.; Chen, C.; Li, J.; Wang, K.; Wang, T. Mechanical behavior and texture evolution of aluminum alloys subjected to strain path changes: Experiments and modeling. Mater. Sci. Eng. A 2019, 757, 32–41. [Google Scholar] [CrossRef]
- Peeters, B.; Kalidindi, S.R.; Van Houtte, P.; Aernoudt, E. A crystal plasticity based work-hardening/softening model for b.c.c. metals under changing strain paths. Acta Mater. 2000, 48, 2123–2133. [Google Scholar] [CrossRef]
- El-Danaf, E.A. Mechanical properties, microstructure and micro-texture evolution for 1050AA deformed by equal channel angular pressing (ECAP) and post ECAP plane strain compression using two loading schemes. Mater. Des. 2012, 34, 793–807. [Google Scholar] [CrossRef]
- Qin, J.; Holmedal, B.; Hopperstad, O.S. Experimental characterisation and modeling of aluminum alloy AA3103 for complex single and double strain-path changes. Int. J. Plast. 2019, 112, 158–171. [Google Scholar] [CrossRef]
- Barlat, F.; Ferreira Duarte, J.M.; Gracio, J.J.; Lopes, A.B.; Rauch, E.F. Plastic flow for non-monotonic loading conditions of an aluminum alloy sheet sample. Int. J. Plast. 2003, 19, 1215–1244. [Google Scholar] [CrossRef]
- Boers, S.H.A.; Schreurs, P.J.G.; Geers, M.G.D.; Levkovitch, V.; Wang, J.; Svendsen, B. Experimental characterisation and model identification of directional hardening effects in metals for complex strain path changes. Int. J. Solids Struct. 2010, 47, 1361–1374. [Google Scholar] [CrossRef] [Green Version]
- Gracio, J.J.; Lopes, A.B.; Rauch, E.F. Analysis of plastic instability in commercially pure Al alloys. J. Mater. Process. Technol. 2000, 103, 160–164. [Google Scholar] [CrossRef]
- Hasegawa, T.; Yakou, T.; Karashima, S. Deformation behaviour and dislocation structures upon stress reversal in polycrystalline aluminium. Mater. Sci. Eng. 1975, 20, 267–276. [Google Scholar] [CrossRef]
- Soboyejo, W.O. Mechanical Properties of Engineered Materials; Marcel Dekker: New York, NY, USA, 2003. [Google Scholar]
- He, J.; Zeng, D.; Zhu, X.; Cedric Xia, Z.; Li, S. Effect of nonlinear strain paths on forming limits under isotropic and anisotropic hardening. Int. J. Solids Struct. 2014, 51, 402–415. [Google Scholar] [CrossRef] [Green Version]
- Ha, J.; Lee, M.-G.; Barlat, F. Strain hardening response and modeling of EDDQ and DP780 steel sheet under non-linear strain path. Mech. Mater. 2013, 64, 11–26. [Google Scholar] [CrossRef]
- Manopulo, N.; Barlat, F.; Hora, P. Isotropic to distortional hardening transition in metal plasticity. Int. J. Solids Struct. 2015, 56–57, 11–19. [Google Scholar] [CrossRef]
- Tarigopula, V.; Hopperstad, O.S.; Langseth, M.; Clausen, A.H. Elastic-plastic behaviour of dual-phase, high-strength steel under strain-path changes. Eur. J. Mech. Asolids 2008, 27, 764–782. [Google Scholar] [CrossRef]
- Van Riel, M.; Brinksma, H. Strain Path Dependency in Sheet Metal: Experiments and Models. Ph.D. Thesis, Universiteit Twente, Enschede, The Netherlands, 2009. [Google Scholar]
- Havner, K.S. Analysis of fcc crystals in two singular orientations in (110) channel die compression. Mech. Mater. 2010, 42, 657–672. [Google Scholar] [CrossRef]
- Humphreys, F.J.; Hatherly, M. Recrystallization and Related Annealing Phenomena, 1st ed.; Pergamon: Oxford, UK; Tarrytown, NY, USA, 1995. [Google Scholar]
- Luan, Q.; Xing, H.; Zhang, J.; Jiang, J. Experimental and crystal plasticity study on deformation bands in single crystal and multi-crystal pure aluminium. Acta Mater. 2020, 183, 78–92. [Google Scholar] [CrossRef]
- Diehl, J. Tensile Tests on Copper Single Crystals. Z. Met. 1956, 5, 331–343. [Google Scholar]
- Rollett, A.D.; Kocks, U.F. A Review of the Stages of Work Hardening. Solid State Phenom. 1993, 35–36, 1–18. [Google Scholar] [CrossRef] [Green Version]
- Mecking, H.; Kocks, U.F. Kinetics of flow and strain-hardening. Acta Metall. 1981, 29, 1865–1875. [Google Scholar] [CrossRef]
- Loretto, M.H. (Ed.) Dislocations and Properties of Real Materials; Institute of Metals: London, UK, 1958. [Google Scholar]
- Schwink, C.; Göttler, E. Dislocation interactions, flow stress and initial work hardening of copper single crystals with [100] axis orientation. Acta Metall. 1976, 24, 173–179. [Google Scholar] [CrossRef]
- Dieter, G. Mechanical Metallurgy, 3rd ed.; McGraw-Hill Education: New York, NY, USA, 1986. [Google Scholar]
- Driver, J.H.; Skalli, A.; Wintenberger, M. A theoretical and experimental study of the plastic deformation of f.c.c. crystals in plane strain compression. Philos. Mag. A 1984, 49, 505–524. [Google Scholar] [CrossRef]
- Havner, K.S. On crystal shear, lattice rotation and constraint stress in (1 1 0) channel die compression: Rate-independent and viscoplastic analyses and predictions compared. Philos. Mag. 2014, 94, 1924–1955. [Google Scholar] [CrossRef]
- Mánik, T.; Holmedal, B.; Hopperstad, O.S. Strain-path change induced transients in flow stress, work hardening and r-values in aluminum. Int. J. Plast. 2015, 69, 1–20. [Google Scholar] [CrossRef] [Green Version]
- Hu, Z.; Rauch, E.F.; Teodosiu, C. Work-hardening behavior of mild steel under stress reversal at large strains. Int. J. Plast. 1992, 8, 839–856. [Google Scholar] [CrossRef]
- Hirth, J.P. The influence of grain boundaries on mechanical properties. Metall. Trans. 1972, 3, 3047–3067. [Google Scholar] [CrossRef]
Figure 1.
(a1–a3) and (b1–b3) are EBSD maps for undeformed A-oriented and B-oriented samples, respectively. (a1,a2) and (b1,b2) are the inverse pole figure in the loading direction (IPF-ND). (a3) and (b3) are the pole figure of the {111} plane ({111}PF) with red dots representing their orientation.
Figure 1.
(a1–a3) and (b1–b3) are EBSD maps for undeformed A-oriented and B-oriented samples, respectively. (a1,a2) and (b1,b2) are the inverse pole figure in the loading direction (IPF-ND). (a3) and (b3) are the pole figure of the {111} plane ({111}PF) with red dots representing their orientation.

Figure 2.
Schematic of a channel die testing rig with sample compressed in plane strain condition.

Figure 3.
(a) Images for the deformed aluminum samples viewing from ND. (b) The ideal resulting crystal change of cubic sample under frictionless PSC [31] (Reprinted with permission from ref. [31]. Copyright 2021 Elsevier).

Figure 4.
The true stress-true strain curve for single crystals pure aluminum with orientation A (A-I) and orientation B (B-I) deformed at 0.002/s in one-directional PSC. The value of hardening rate is taken as the slope of the trendline from the data points.
Figure 4.
The true stress-true strain curve for single crystals pure aluminum with orientation A (A-I) and orientation B (B-I) deformed at 0.002/s in one-directional PSC. The value of hardening rate is taken as the slope of the trendline from the data points.

Figure 5.
(a1–a7) and (b1–b7) are EBSD maps for A-I and B-I, respectively. (a1,b1) and (a2,b2) are the EBSD IPF-ND maps for samples before and after the PSC. (a3,b3) are the IPF-ND of the undeformed and deformed crystals plotting together, with the arrow indicates the rotation around the loading direction. (a4,b4) are the {111}PF for samples after deformation with red dots represents the orientation for the undeformed samples. (a5–a7) depict the way lattice orientation changes during the deformation: from (a5) to (a6), the red dots rotate dominantly about TD rotation, and from (a6) to (a7), the red dots shift to the left, indicating a further RD rotation. The same logic of analyzing applies to (b5–b7).

Figure 6.
(a1,a2) and (b1,b2) are EBSD results for A-I and B-I. (a1,b1) are the MOA maps of deformed crystals. Red dashed lines represent the alignment of the most apparent DBs set. (a2,b2) represent the MAD for deformed crystals.
Figure 6.
(a1,a2) and (b1,b2) are EBSD results for A-I and B-I. (a1,b1) are the MOA maps of deformed crystals. Red dashed lines represent the alignment of the most apparent DBs set. (a2,b2) represent the MAD for deformed crystals.

Figure 7.
The flow curve for crystals with orientation A (a) and orientation B (b) compressed at the strain rate of 0.002/s (A-I and B-I) and 0.0002/s (A-II and B-II).
Figure 7.
The flow curve for crystals with orientation A (a) and orientation B (b) compressed at the strain rate of 0.002/s (A-I and B-I) and 0.0002/s (A-II and B-II).

Figure 8.
(a1–a6) and (b1–b6) are the EBSD results for A-II and B-II, respectively. (a1,a2) and (b1,b2) are the EBSD IPF-ND maps for samples before and after the PSC. (a3,b3) are the {111} PF for crystals after deformation with red dots represents the orientation for the undeformed samples. (a4,b4) are MOA maps of deformed crystals. Red dashed lines represent the alignment of the most apparent DBs set. (a5,b5) represent the MAD for crystals after deformation. (a6,b6) are the IPF-ND of the undeformed and deformed crystals plotting together, with the arrow indicates the rotation around the loading direction.

Figure 9.
Two-directional compress test (a) experimental true stress-strain curve of PSC on single aluminum crystal under three strain paths A-I, A-III and A-IV, (b) surface conditions of case A-III and (c) surface conditions of case A-IV.
Figure 9.
Two-directional compress test (a) experimental true stress-strain curve of PSC on single aluminum crystal under three strain paths A-I, A-III and A-IV, (b) surface conditions of case A-III and (c) surface conditions of case A-IV.

Figure 10.
(a1–a4) and (b1–b4) are figures for A-III and A-IV. (a1,b1) are the EBSD IPF-ND maps for crystals after the compression. (a2,b2) are the IPF-ND of the undeformed and deformed crystals plotting together, with the arrow indicates the rotation around the loading direction. (a3,b3) are the MOA maps of deformed crystals. Red dashed lines represent the alignment of the most apparent DBs set generated in the first loading. White dash lines approximate the direction of dislocation created in the second loading. (a4,b4) are the MAD for crystals after deformation.

Figure 11.
(a,b) is the schematic for samples A-I and B-I before and after deformation. The grey dashed line represents the undeformed geometry, and the deformed geometry is sketched in black. The grey square represents the crystal lattice in the undeformed matrix, and the corresponding deformed shape is shown as a black square. The activated slip system, assuming aligned with the most apparent set of DBs in deformed microstructure, comprises the slip direction (red arrow) and the slip plane (black arrow).

Figure 12.
(a) depicts the sample geometry during the first loading. (b,c) represents the samples in reloading. Hatched area dictated the surface where stresses are applied in the first loading, and brick texture represents the surfaced constrained by plane strain condition initially. The slip system, taken as the alignment direction of the most apparent DBs set in EBSD MOA maps, comprises the slip direction (red arrow) and the slip plane (black arrow). For sample A-IV, the red crosses and green crosses represent the dislocation generated in the first compression and second compression, respectively.

Table 1.
Sample geometry and the testing parameters.
 |  |  |  |  |
| Compression | One-directional PSC | One-directional PSC | Two-directional PSC | Two-directional PSC |
| Ture strain | 0.2624 | 0.2624 | Each to 0.1312 | Each to 0.1312 |
| Stain rate ( ) | 0.002 | 0.0002 | 0.002 | 0.002 |
Publisher’s Note: MDPI stays neutral with regard to jurisdictional claims in published maps and institutional affiliations. |
© 2021 by the authors. Licensee MDPI, Basel, Switzerland. This article is an open access article distributed under the terms and conditions of the Creative Commons Attribution (CC BY) license (https://creativecommons.org/licenses/by/4.0/).
Share and Cite
MDPI and ACS Style
Xiong, Y.; Luan, Q.; Zheng, K.; Wang, W.; Jiang, J. Understanding the Strain Path Effect on the Deformed Microstructure of Single Crystal Pure Aluminum. Metals 2021, 11, 1189. https://doi.org/10.3390/met11081189
AMA Style
Xiong Y, Luan Q, Zheng K, Wang W, Jiang J. Understanding the Strain Path Effect on the Deformed Microstructure of Single Crystal Pure Aluminum. Metals. 2021; 11(8):1189. https://doi.org/10.3390/met11081189
Chicago/Turabian StyleXiong, Yingjue, Qinmeng Luan, Kailun Zheng, Wei Wang, and Jun Jiang. 2021. "Understanding the Strain Path Effect on the Deformed Microstructure of Single Crystal Pure Aluminum" Metals 11, no. 8: 1189. https://doi.org/10.3390/met11081189
Note that from the first issue of 2016, this journal uses article numbers instead of page numbers. See further details here.