
Numerical Study of RC Beams Strengthened with Fe-Based Shape Memory Alloy Strips Using the NSM Method


1
Department of Civil Engineering, Chungbuk National University, Chungbuk 28644, Korea
2
Land and Housing Institute, Daejeon 34047, Korea
*
Author to whom correspondence should be addressed.
Appl. Sci. 2021, 11(15), 6809; https://doi.org/10.3390/app11156809
Submission received: 15 June 2021
/
Revised: 19 July 2021
/
Accepted: 21 July 2021
/
Published: 24 July 2021
(This article belongs to the Special Issue Toward Sustainable Engineering Structures for Better Safety in Built-Environment II)
Abstract
:This paper presents a finite element (FE) analysis for predicting the flexural behavior of reinforced concrete (RC) beams strengthened with Fe-based shape memory alloy (Fe-SMA) strips using a near surface mounted (NSM) method. Experimental results reported in the literature were used to verify the proposed FE model. FE analyses were conducted using OpenSees, a general-purpose structural FE analysis program. The RC beam specimens were modeled using a nonlinear beam-column element and a fiber element. The Concrete 02 model, Steel 01 model, and Pinching 04 model were applied to the concrete, steel reinforcement, and Fe-SMA strip in the fiber element, respectively, and the FE analysis was carried out in a displacement control method based on the Newton-Raphson method. The FE model of this study accurately predicted the initial crack load, yield load, and ultimate load. From parametric analyses, it was concluded that an increase in the compressive strength of the concrete increases the ductility of the specimen, and an increase in the level of recovery stress on the Fe-SMA strip increases the initial stiffness of the specimen.
1. Introduction
Reinforced concrete (RC) is one of the most commonly used construction materials in modern society. However, RC structures deteriorate due to poor initial design, poor construction, aging, and unpredicted use load, and as a result, most RC structures need to be retrofitted using various reinforcement techniques. One of best-known methods for strengthening RC members is the externally bonded reinforcement (EBR) method. The EBR method uses a fiber reinforced polymer (FRP) composite made of carbon fiber, aramid fiber, or basalt fiber attached with an adhesive to external surfaces (e.g., tension zones) of the RC beams and slabs [1,2]. The EBR method has several advantages, such as simple installation and easy manufacturing, as well as high strength, light weight, corrosion resistance, chemical resistance, and fatigue resistance. However, it is exposed outside, which makes it easily damaged by fire and ultraviolet rays [3]. To overcome these drawbacks, a near surface mounted (NSM) method has been studied, using a FRP strip embedded in a pre-performed groove on the tension zone surface of the beam and slabs. The NSM method has solved the mentioned problems of the EBR method, but suffers because the FRP strip can be separated from the groove early, before the FRP strip is fully tensioned [4]. Several studies from various universities and research institutes have focused on a prestressing strengthening (PS) method using a pre-tensioned FRP composite as the strengthening material [5,6,7]. One side of the pre-tensioned FRP composite is anchored while the other side of it is pulled using a hydraulic jack installed on the surface of the RC structures. The PS method improves the stiffness and durability of the RC structures, due to its excellent crack control performance [8]. However, installing the anchorage and hydraulic systems for the PS method increases construction cost and time. Furthermore, the tensioned FRP strip cannot be re-tensioned after it relaxes due to concrete creeping and shrinkage. Recently, a study on a strengthening method using a shape memory alloy (SMA) was conducted as an alternative to the pre-tensioned FRP composite of the PS method [9]. SMA is an alloy with the ability to return to its original shape after plastic deformation when heated [10]. When the deformed SMA is embedded in the concrete and heated, the deformation recovery is restricted by the adhesive force between the concrete and the SMA, which creates a recovery stress in the SMA that will act as a compressive force on the concrete.
One well-known SMA is the Ni-Ti-based Nitinol, which is mainly used in aerospace and ergonomics. Nitinol is not suitable for the construction field because of its high raw material prices, and lower temperature history [11,12]. After the discovery of Fe-SMA in 1982 by Sato et al. [13], researchers and engineers in the civil engineering field have used Fe-SMA, which has a lower raw material price than Nitinol [14,15].
Shahverdi et al. [16] conducted an experimental study to evaluate the mechanical properties and recovery properties of Fe-17Mn-5Si-10Cr-4Ni(V,C) alloys. He reported that the Fe-SMA exhibited a recovery stress of 300–350 MPa at a heating temperature of 160 °C. Additionally, it was reported that about 400 °C is the maximum heating temperature at which the recovery stress of 450 MPa occurs in the Fe-SMA. Michels et al. [17] experimentally evaluated the flexural behavior of RC beams strengthened with Fe-SMA by the EBR method. They reported that the crack load and ductility of the RC beams strengthened with Fe-SMA were significantly increased, compared to those reinforced with CFRP. Hong et al. [18] conducted an experimental study to evaluate the flexural performance of RC beams strengthened with the Fe-SMA using the NSM method. They reported that the crack load and initial stiffness of the RC beams with activated Fe-SMA strips were significantly improved compared to those with deactivated Fe-SMA strips, due to the prestressing effect. Furthermore, it was reported that the ductility of RC beams reinforced with Fe-SMA strips was not significantly reduced, unlike specimens strengthened with CFRP strips. Dolatabadi et al. [19] conducted a numerical study of RC members externally strengthened with Fe-SMA bars and shotcrete. They modeled the RC beams with a three-dimensional solid element using ABAQUS. They reported that the finite element (FE) model constructed with the 3D solid elements accurately predicted the ultimate load with an error of less than 1%. Abouali et al. [20] performed a numerical study to predict the behavior of RC beams strengthened with Fe-SMA using the NSM method using ABAQUS, and three-dimensional solid elements were used for modeling. They reported that the proposed numerical model showed a well fitted load-displacement relationship with the experimental results.
Most of all existing studies have experimentally evaluated the material properties and reinforcement performance of the Fe-SMA. But very few researchers have conducted numerical studies to evaluate the strengthening performance of the Fe-SMA for concrete members [19,20,21]. In addition, in published papers, most of the numerical studies on RC members strengthened with Fe-SMA have modeled the RC members using 3D solid elements. However, using 3D solid elements is not preferred in the field because it takes longer modeling time, and requires higher computational analysis time. Therefore, in this study, a simple FE model for predicting the flexural performance of the RC beam strengthened with Fe-SMA using the NSM method is proposed, and its reliability is verified by comparing numerical results with the experimental results of a previous studies.
2. Geometry of the RC Beam
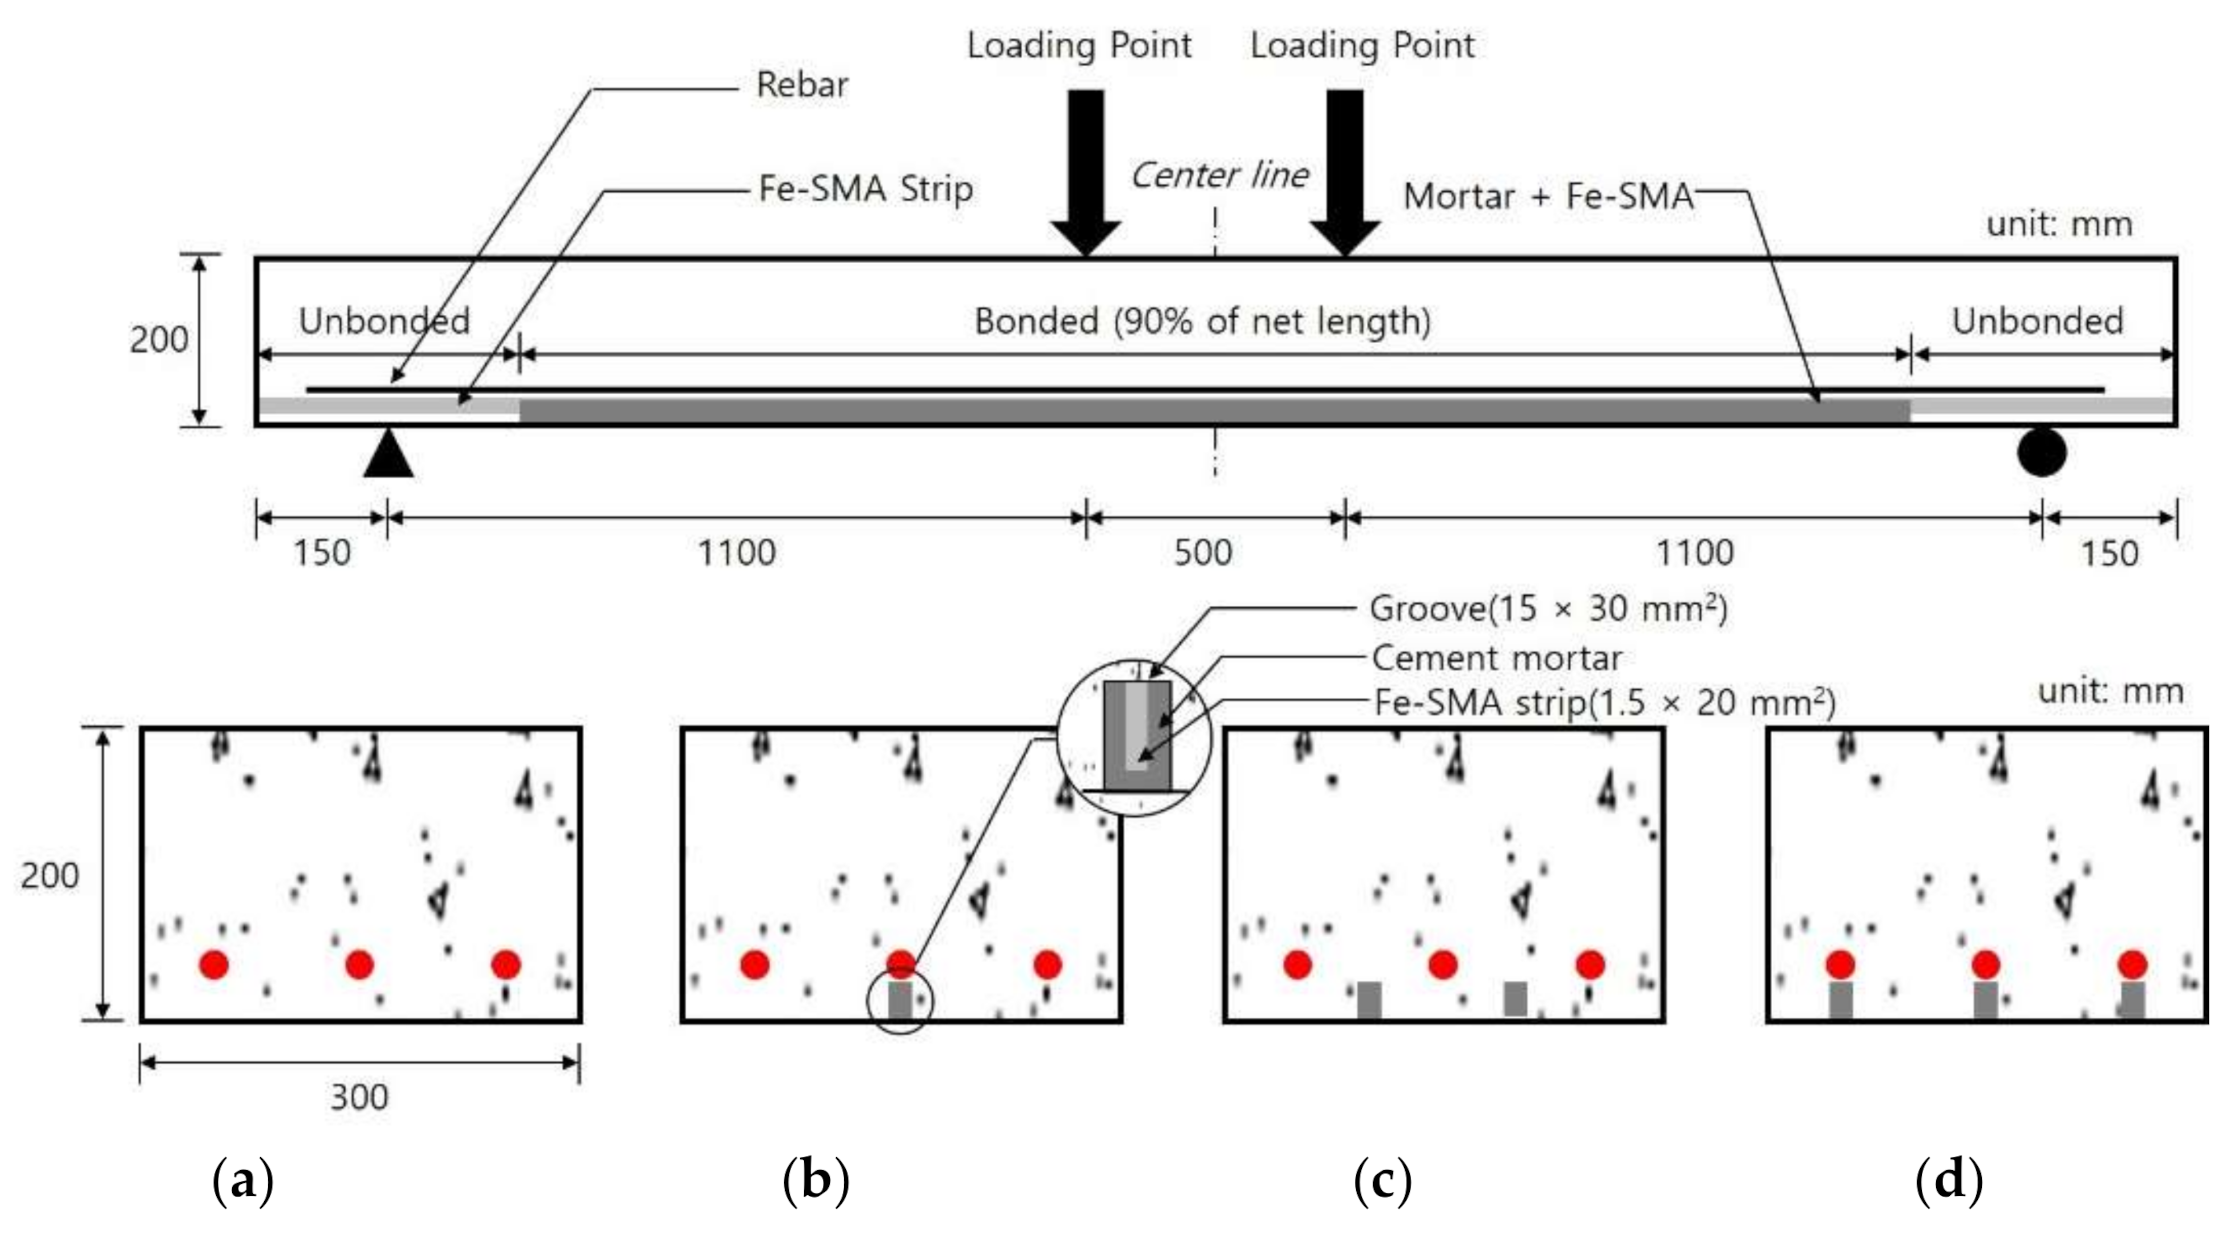
The verification of this FE model was performed by comparison with results from the numerical simulation and experiments conducted by Hong et al. [18]. The experimental specimens are summarized in Figure 1. Specimen ID in Figure 1 shows that the cross-sectional areas of the Fe-SMA were 30 S, 60 S, and 90 S, and the pre-strain rate was 4%. The width and height of these test specimens were 300 mm and 200 mm, respectively. The total length and net-span of the RC beam were 3000 mm and 2700 mm, respectively.
As shown in Figure 1, a groove with a width of 15 mm and a height of 30 mm was formed in the longitudinal direction of the specimen to strengthen the Fe-SMA strip using the NSM method. The length of the Fe-SMA strip was 2430 mm, which was 90% of the net-span. The compressive strength of the concrete used in the experiment was 32.3 MPa. Deformed steel bars with a diameter of 9.53 mm were used as the main reinforcement, and the modulus of elasticity, yield strength, ultimate strength, and elongation of the reinforcement were 200 GPa, 480 MPa, 590 MPa, and 17.1%, respectively. The width, thickness, and length of the Fe-SMA strip were 20 mm, 1.5 mm, and 3000 mm, respectively. When the Fe-SMA strip was stretched to 4% pre-strain and heated to 160 °C, a recovery stress of about 400 MPa was developed.
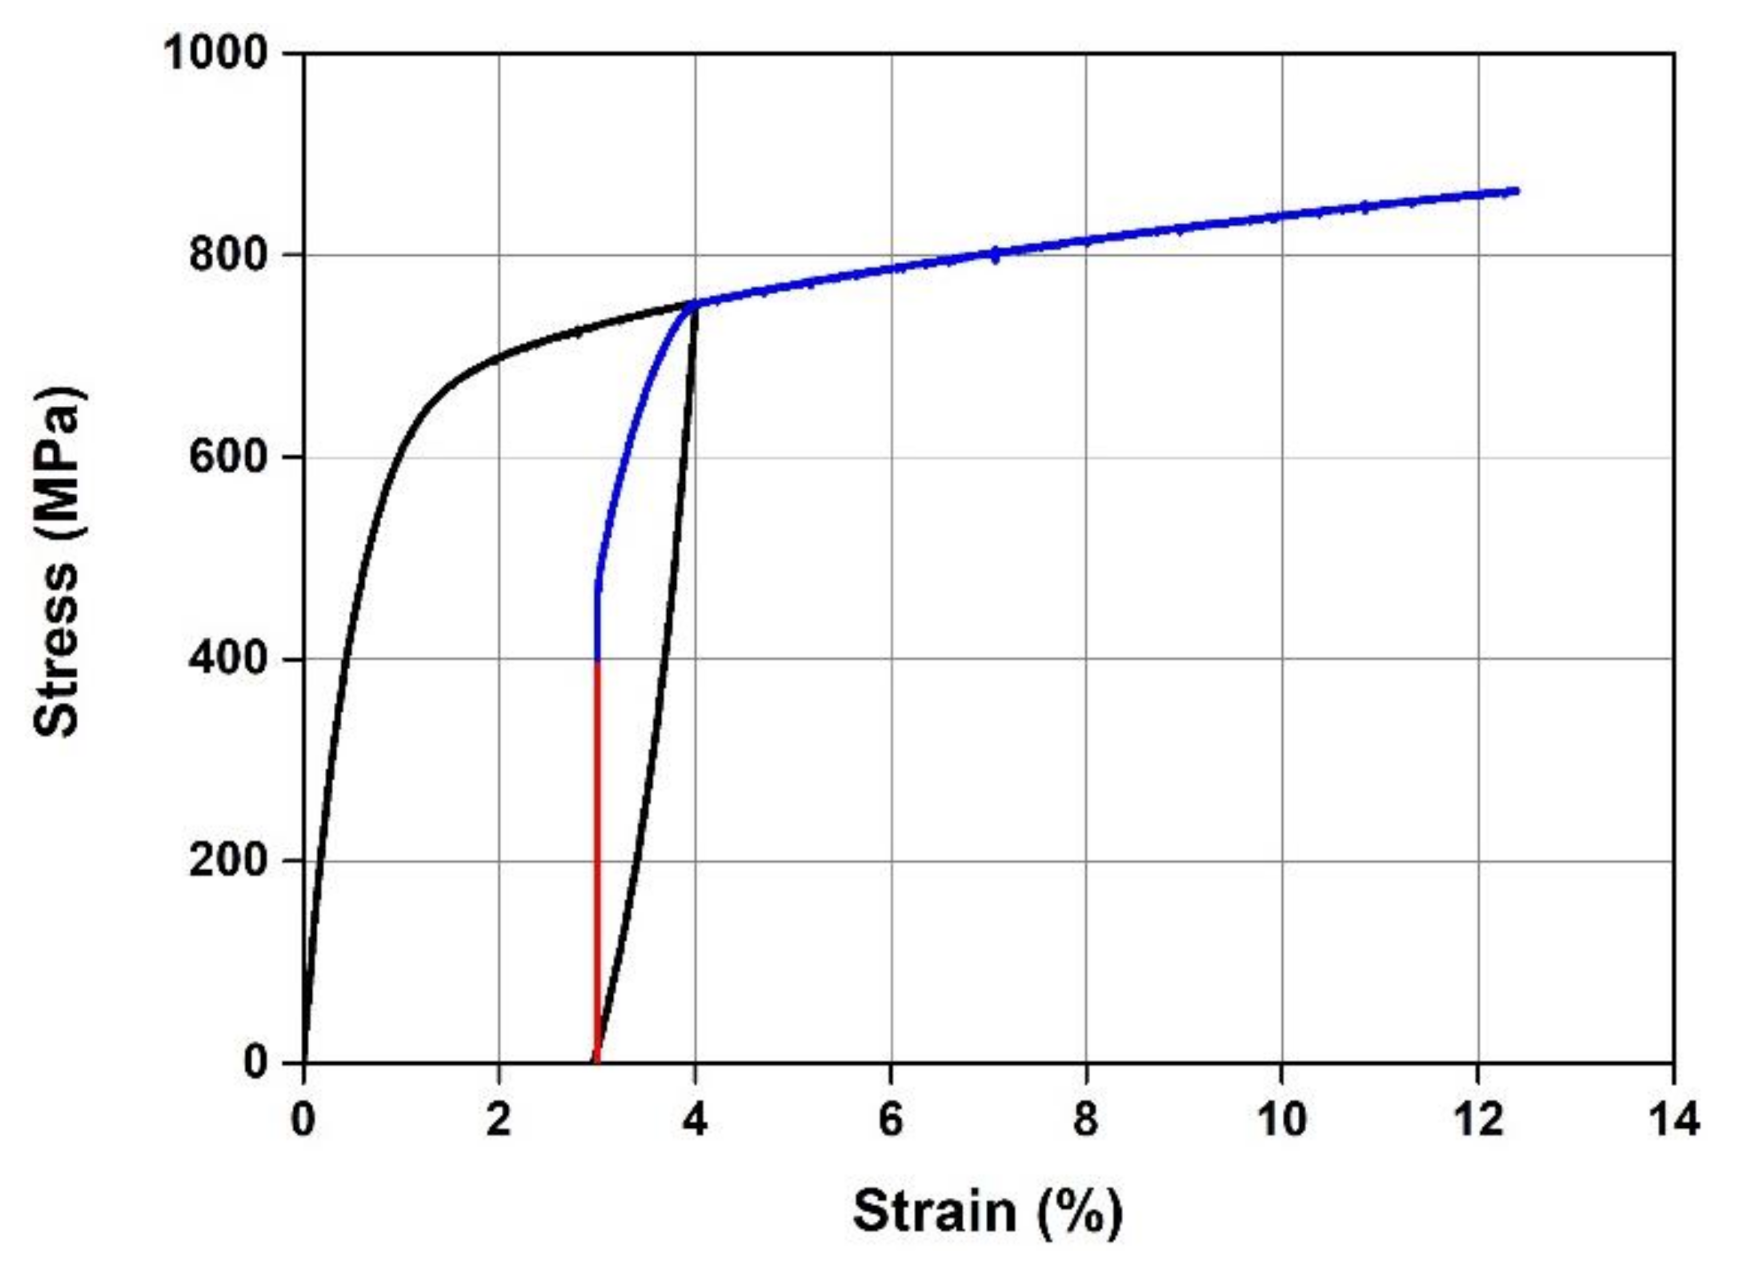
Figure 2 shows the stress-strain relationship of the Fe-SMA activation process presented in Hong et al. [22]. The black line in Figure 2 shows the stress-strain curve of the Fe-SMA when the tension is removed after the Fe-SMA strip is stretched to the pre-strain level(εpre). When the tensile load is removed at this stage, the elastic strain and the pseudo-elastic strain are restored, and only residual strain(εres) remains. When the Fe-SMA strip is constrained and activated using the electrical resistance heating system, a recovery stress(σrec) occurs, as shown by the red line in Figure 2. After that, when the tension is applied to the Fe-SMA strip again, the Fe-SMA has a stress-strain curve identical to the in-activated Fe-SMA strip, as shown in blue in Figure 2. As shown in Figure 2, Fe-SMA does not have apparent yield point. Therefore, the yield point of Fe-SMA was determined using the 0.2% offset method.
3. Finite Element Simulation
3.1. Finite Element Model
Generally, a FE model to simulate the nonlinear behavior of RC structures consists of a three-dimensional solid element and a nonlinear material model for the in-elasticity of the constituent materials. As mentioned before, an FE model using the 3D solid element takes a longer time to build lots of nodes and elements, and requires high computational time for the complex analysis. To reduce this time, Spacone et al. [23] proposed a beam element FE model using 2D fiber elements. FE models using 2D fiber elements are used by many researchers because they can accurately simulate the nonlinear flexural behavior of the RC member, while reducing running time by building the model with the beam element [24,25,26].
Therefore, in this study, the nonlinear analyses of the RC beams reinforced by Fe-SMA strips were modeled with the 2D fiber element and the non-linear beam-column element, and were simulated with OpenSees, a general computational simulation program for fiber elements.
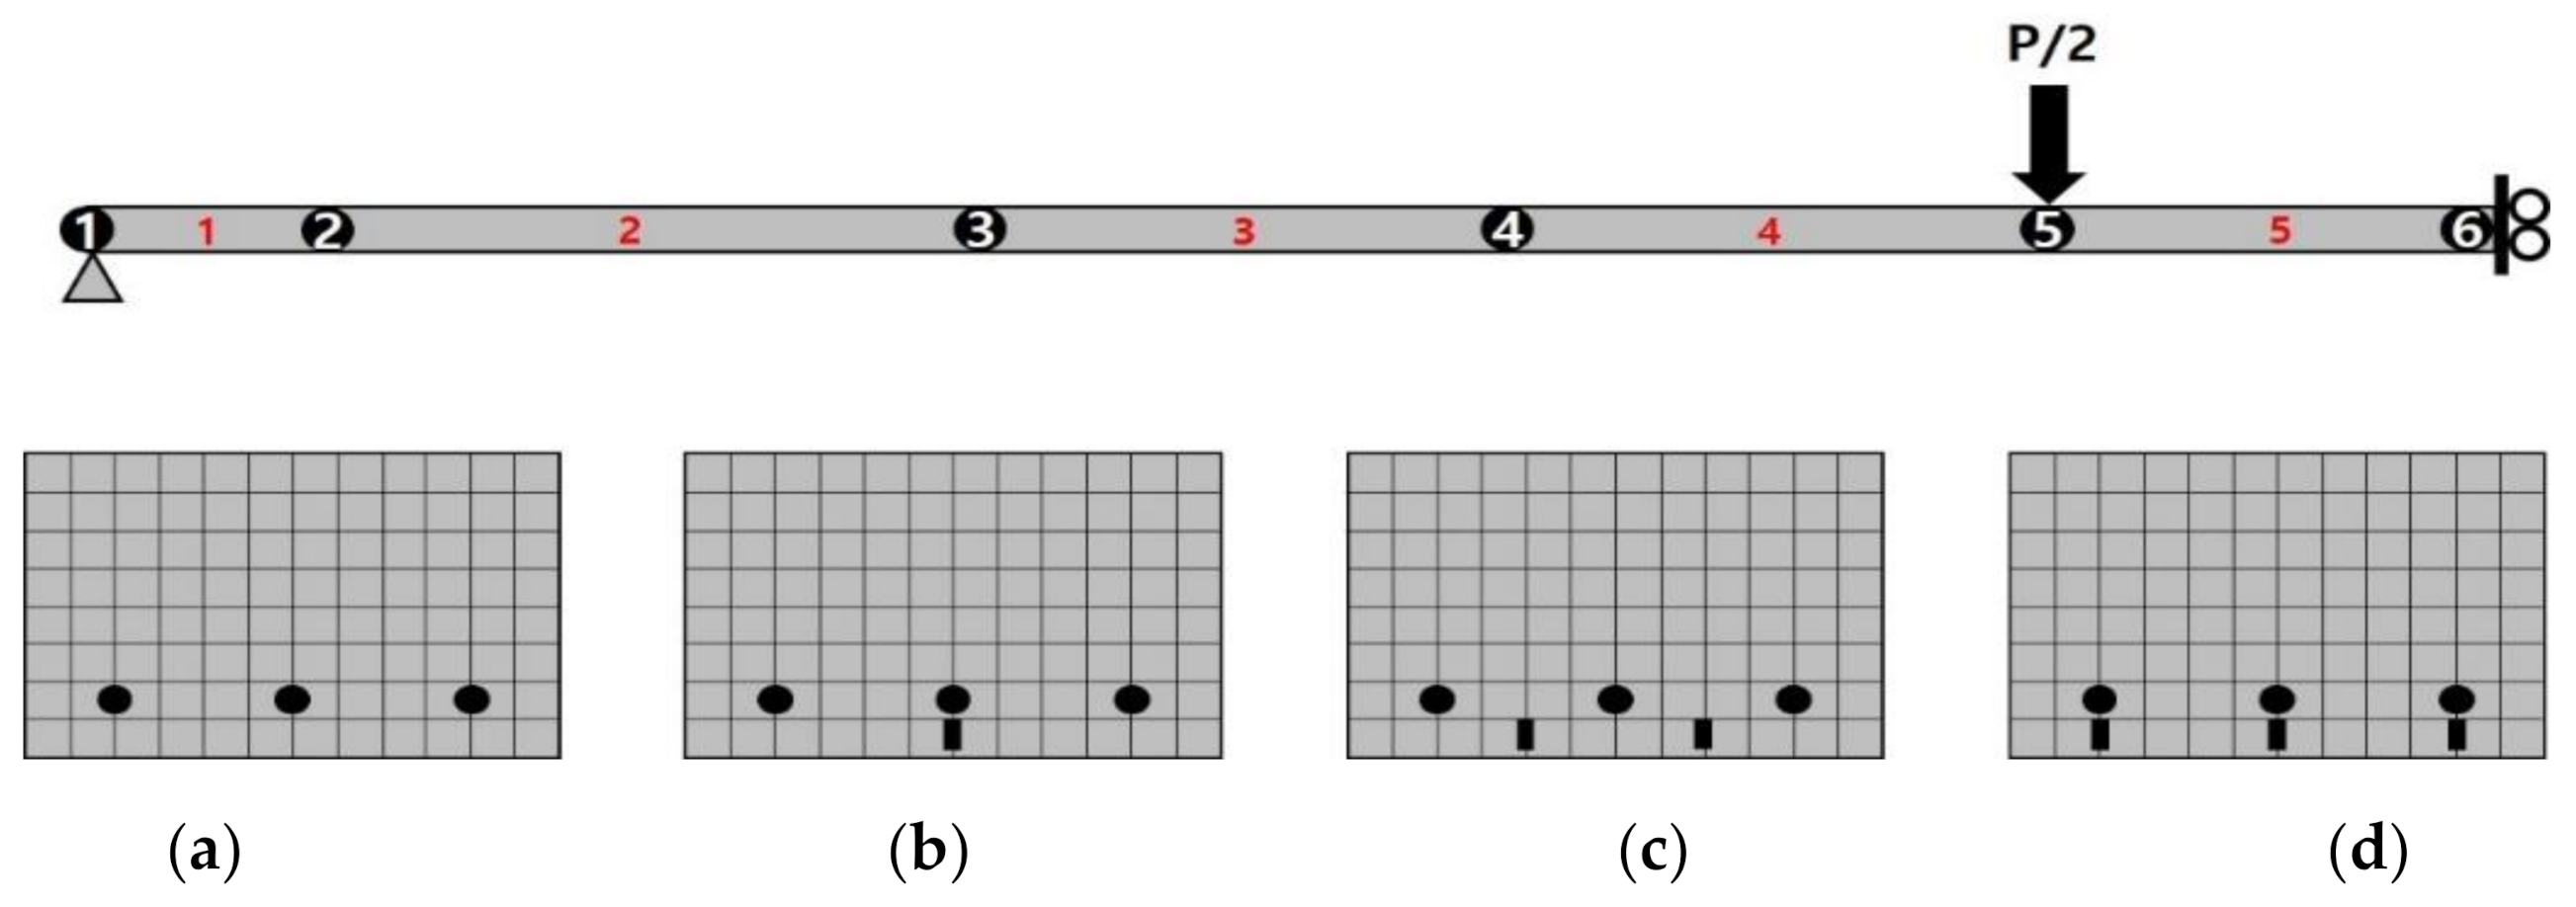
Figure 3 shows an FE model for predicting the flexural behavior of the RC beams strengthened with Fe-SMA strips using the NSM method. As shown in Figure 3, the FE model consists of a total of 6 nodes (white letters) and 5 elements (red letters). Each element was modeled with a fiber cross section and nonlinear beam-column element. The mesh size of the cross-section was 10 mm for accurate analysis. In addition, 5 integration points were set and the Gauss-Lobatto integration was used to improve the accuracy of the analysis.
As shown in Figure 3a, the cross-section of element 1 was modeled with a concrete and steel reinforcement because the Fe-SMA strip was not embedded on this region. As mentioned before, 90% of the net-span of test specimens was strengthened with the Fe-SMA strip. Elements 2 to 5 were modeled with the concrete, steel reinforcement, and Fe-SMA strip, as shown in Figure 3b–d depending on the amount of Fe-SMA strip. Hong et al. [18] suggested that the Fe-SMA strip should be bonded over 600 mm as the effective bond length. As shown in Figure 1, the bond length of Fe-SMA was 1100 mm, which exceeded the effective bond length. Therefore, the FE model assumed that perfect bonding exists between the concrete and the Fe-SMA strip and between the concrete and the tensile reinforcement. The geometry of the test specimens and their loads were symmetric, as shown in Figure 1. To simplify the FE analysis and reduce the running time, only a half-length of the test specimen was modeled, as shown in Figure 3.
For the simulation of the flexural behavior of the RC beams strengthened with Fe-SMA strip using the NSM method, a displacement control analysis employing the Newton-Raphson method was conducted, to calculate the reaction by applying a vertical displacement to the loading point (node 5 in Figure 3). In the displacement control analysis, the increment of displacement was 0.01 mm per step, and the analyses were performed until the strain of the extreme compression fiber of the concrete reached 0.003 according to ACI 318 [27]. Fundamentally, a shear span-to-effective depth ratio (a/d) greater than 6 for an RC beam means sufficient strength for shear failure [28]. The FE models had a/d values of 6.47, which indicates all of the simulated beams can be expected to fail in the compression-controlled section or the tension-controlled section. Since the Fe-SMA strip is based on steel material, an increase in the amount of Fe-SMA strip can change the failure section from the tension-controlled to the compression-controlled.
3.2. Material Model
3.2.1. Concrete Properties
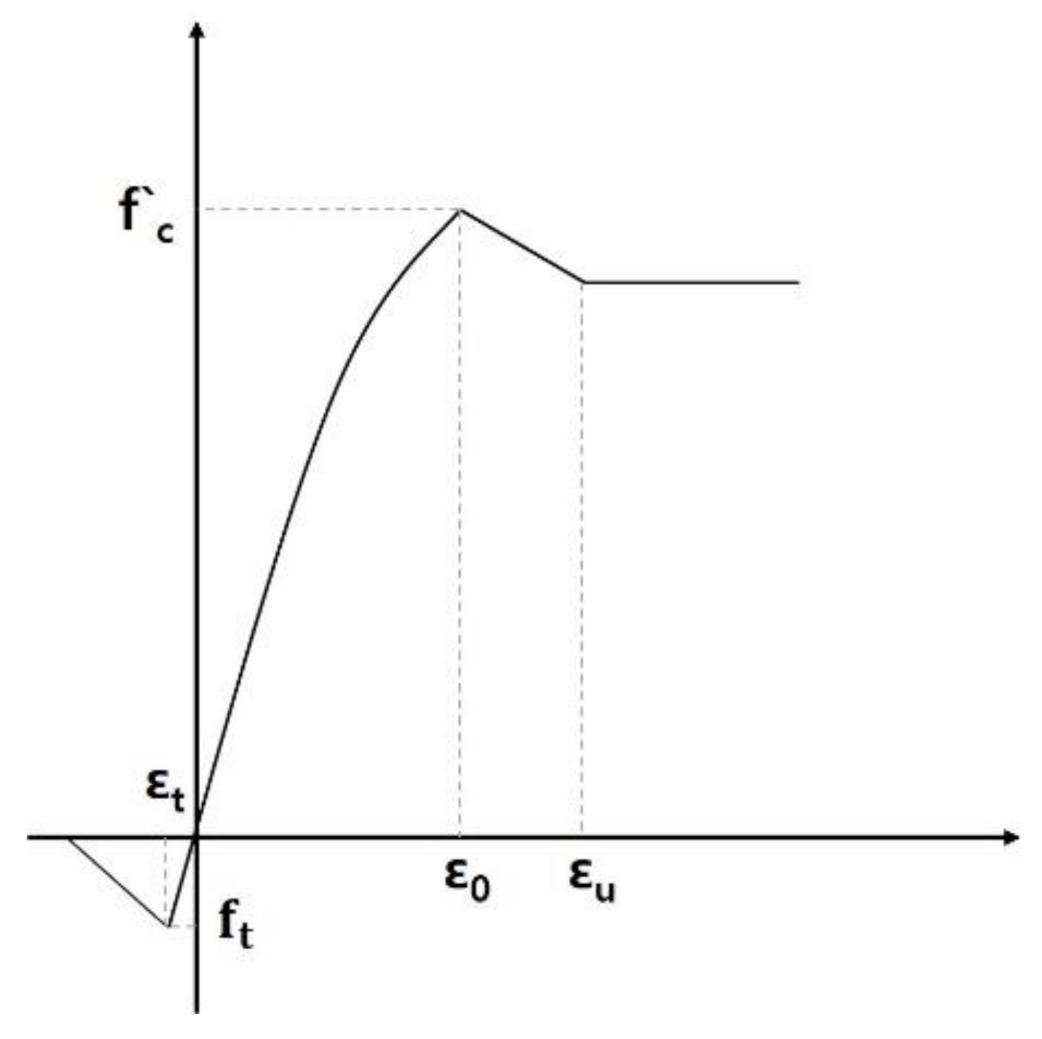
Figure 4 shows the concrete material model used in this study. The Concrete02 model supported by OpenSees was used as the concrete material model. In Figure 4, is the compressive strength of the concrete, is the strain at the concrete compressive strength, is the ultimate concrete strain, is the tensile strength of the concrete, and is the strain at the concrete tensile strength.
The strain at the compressive strength of the concrete was calculated using the following Equations (1) and (2), according to ACI 318 [27]. The compressive strength of the concrete used for FE analysis was 32.3 MPa from the Hong et al. [18].
where represents the elastic modulus of the concrete, was calculated using Equation (3) according to ACI 318 [27].
3.2.2. Steel Reinforcement
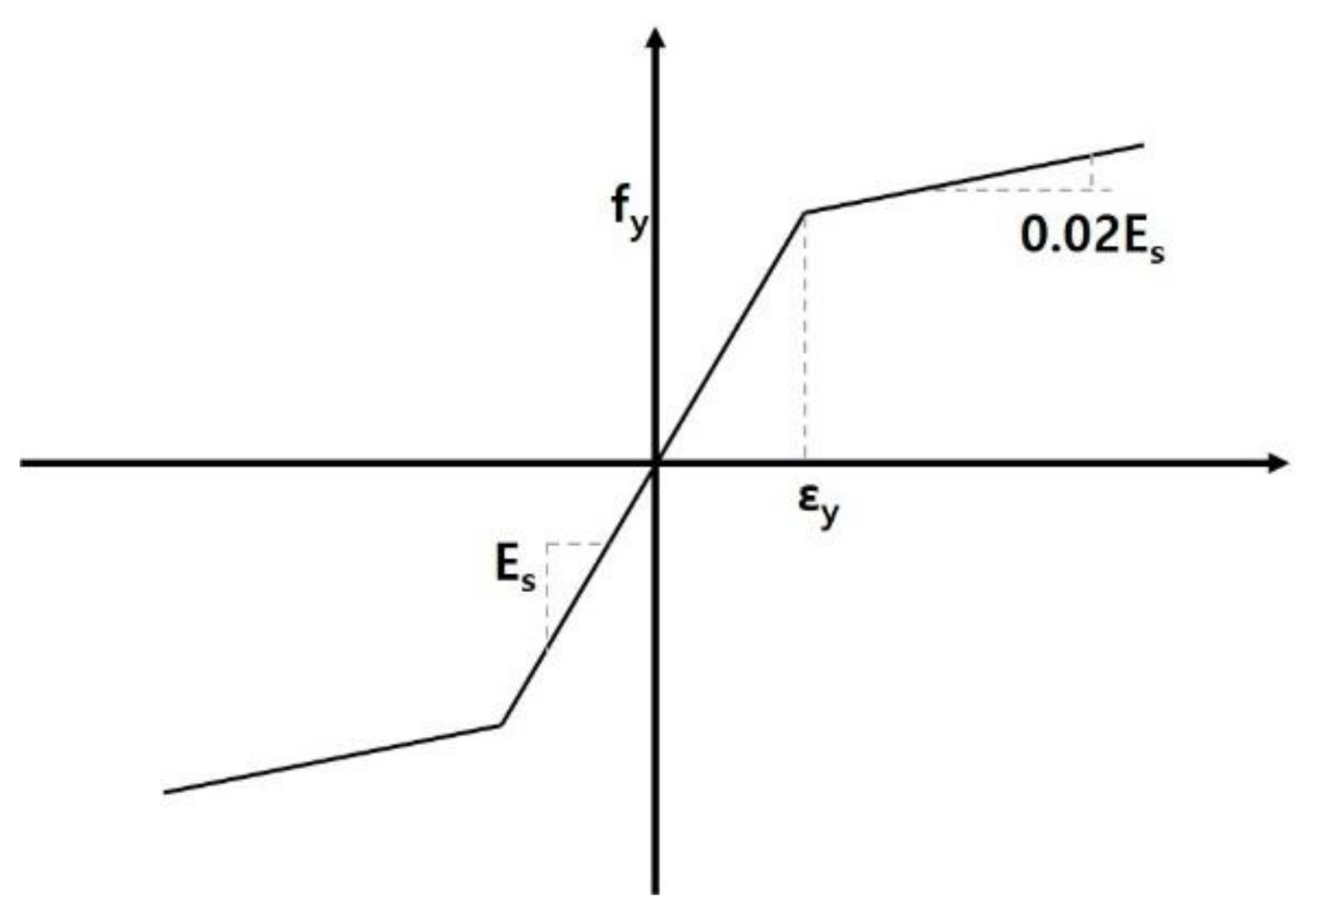
Figure 5 shows the material model of the steel reinforcement used in this study. In Figure 5, is the yield strength of the steel reinforcement, is the yield strain of the steel reinforcement, and is the young’s modulus of the steel reinforcement.
As shown in Figure 5, a bilinear steel material, the Steel01 model, was used for the steel reinforcement material. The modulus of elasticity and yield strength of the steel reinforcement were referred by Hong et al. [18]. A stain-hardening ratio of 2% was applied in consideration of the strain hardening behavior.
3.2.3. Fe-SMA Strip
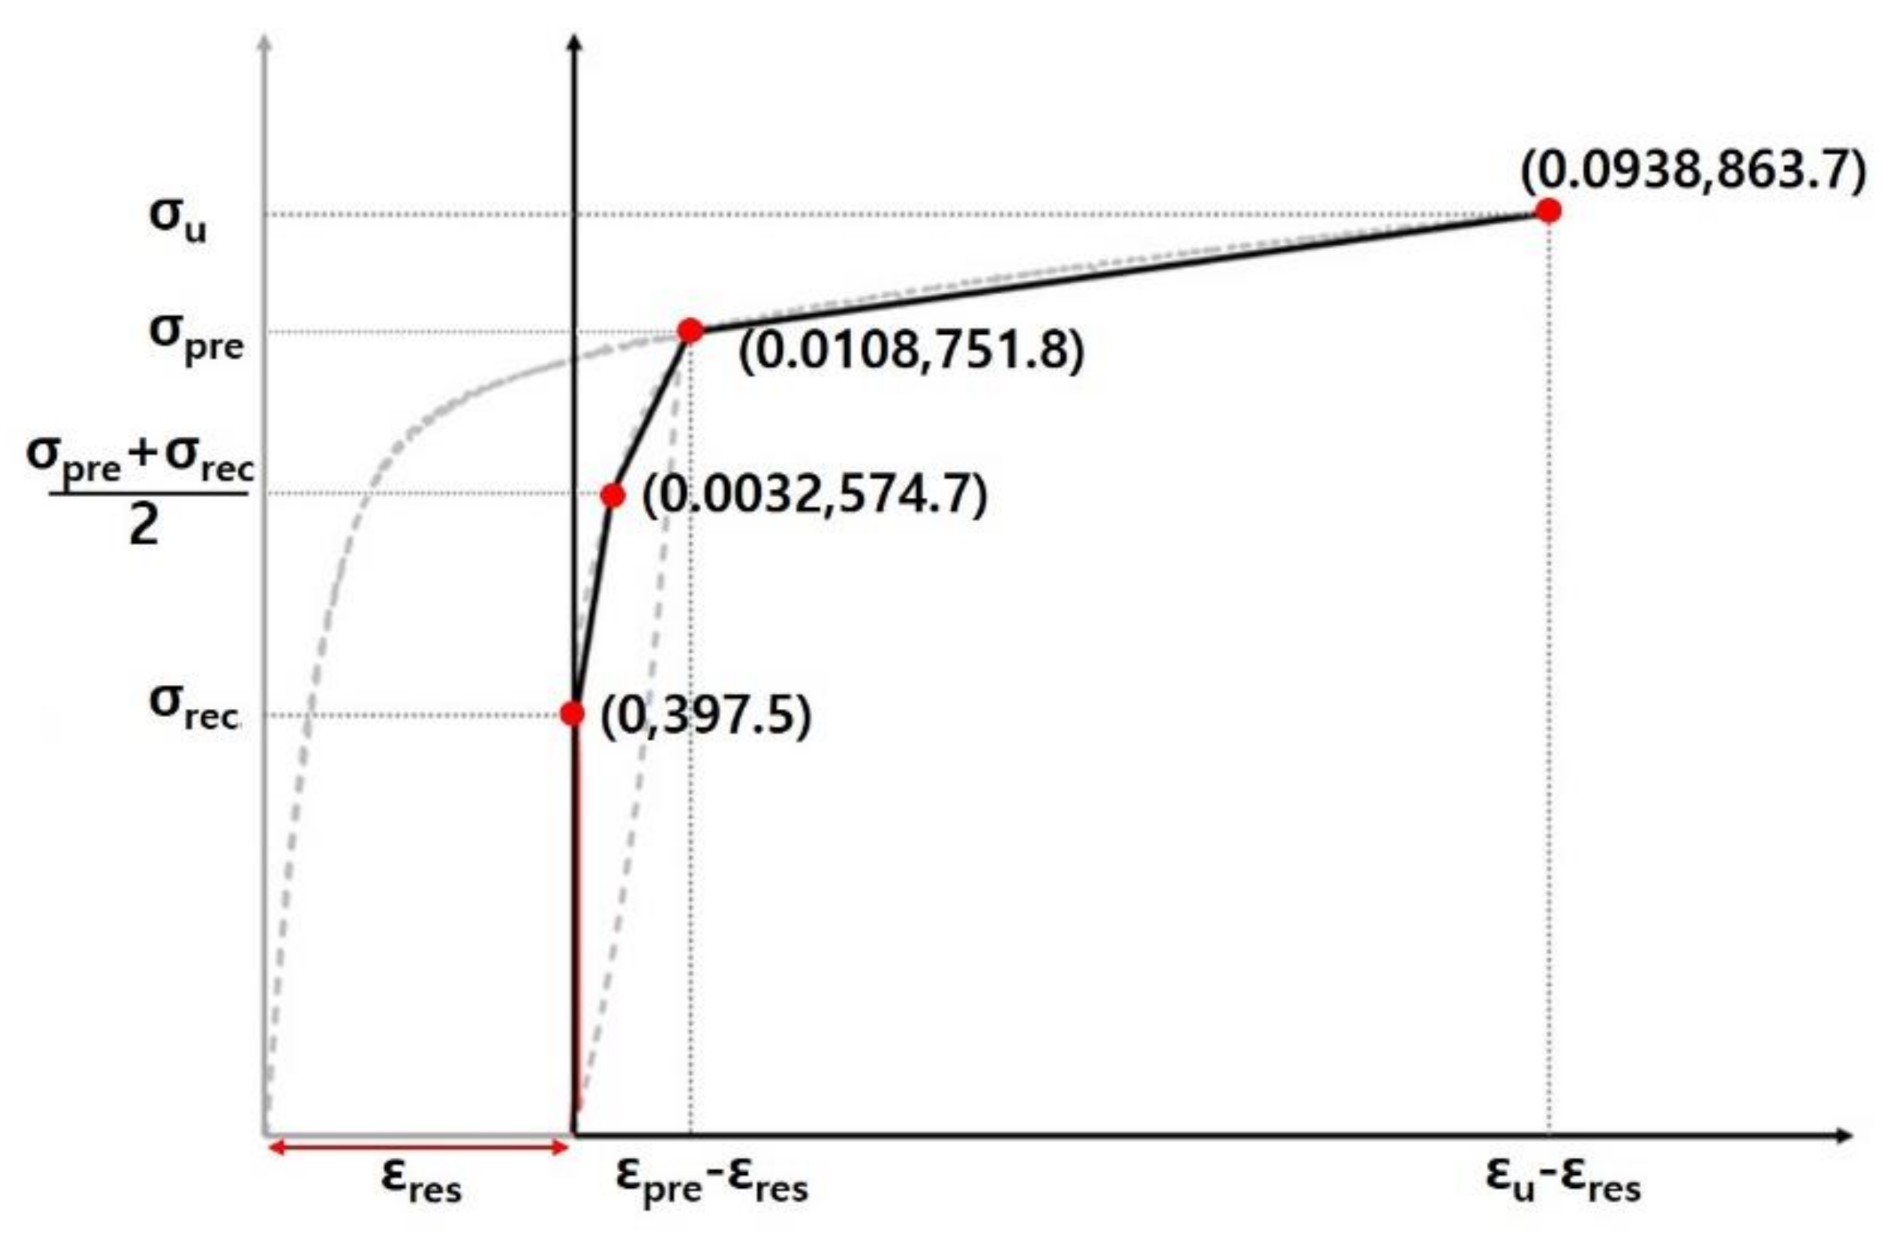
As shown in Figure 2, when Fe-SMA with residual deformation is constrained and heated, recovery stress occurs. Because of this special property, the material model of the Fe-SMA is not built into the OpenSees program. In this study, the material model was implemented using multiple linear curves based on the Pinching04 model, as indicated by the solid black line in Figure 6. In Figure 6, is the stress at the Fe-SMA pre-strain level, is the ultimate strength of the Fe-SMA, is the ultimate strain of the Fe-SMA.
To implement the recovery stress of the Fe-SMA in the Fe-SMA material model, the original x axis was shifted to the residual strain, , as shown by the bold line in Figure 6. A prestressing force is introduced in the RC beams tension zone following the recovery stress and residual strain curve in Figure 6. The Fe-SMA material model lines along four points from the residual strain value. The stress value at the first point is the recovery stress of the Fe-SMA, and the stress value at the second point is the midpoint between the stress in the pre-strain and the recovery stress. The stress value at the third point is the stress at the pre-strain, and the last point is the ultimate strength. At all of the points, the strain values were obtained by subtracting the residual strain from the strains corresponding to the stress values.
4. Results and Discussion
4.1. Comparison of Numerical and Experimental Results
Table 1 summarizes the numerical results and experimental results. The numerical and experiment results for three load stages were compared: the initial crack load where the first stiffness changes in the load-displacement curve or the initial crack is shown on the mid-span bottom of the RC strengthened beam; the yield load when the stress of the steel reinforcement reaches the yield stress; and the ultimate load at which the strain of the extreme compression fiber of the concrete reaches 0.003 according to ACI 318 [27].
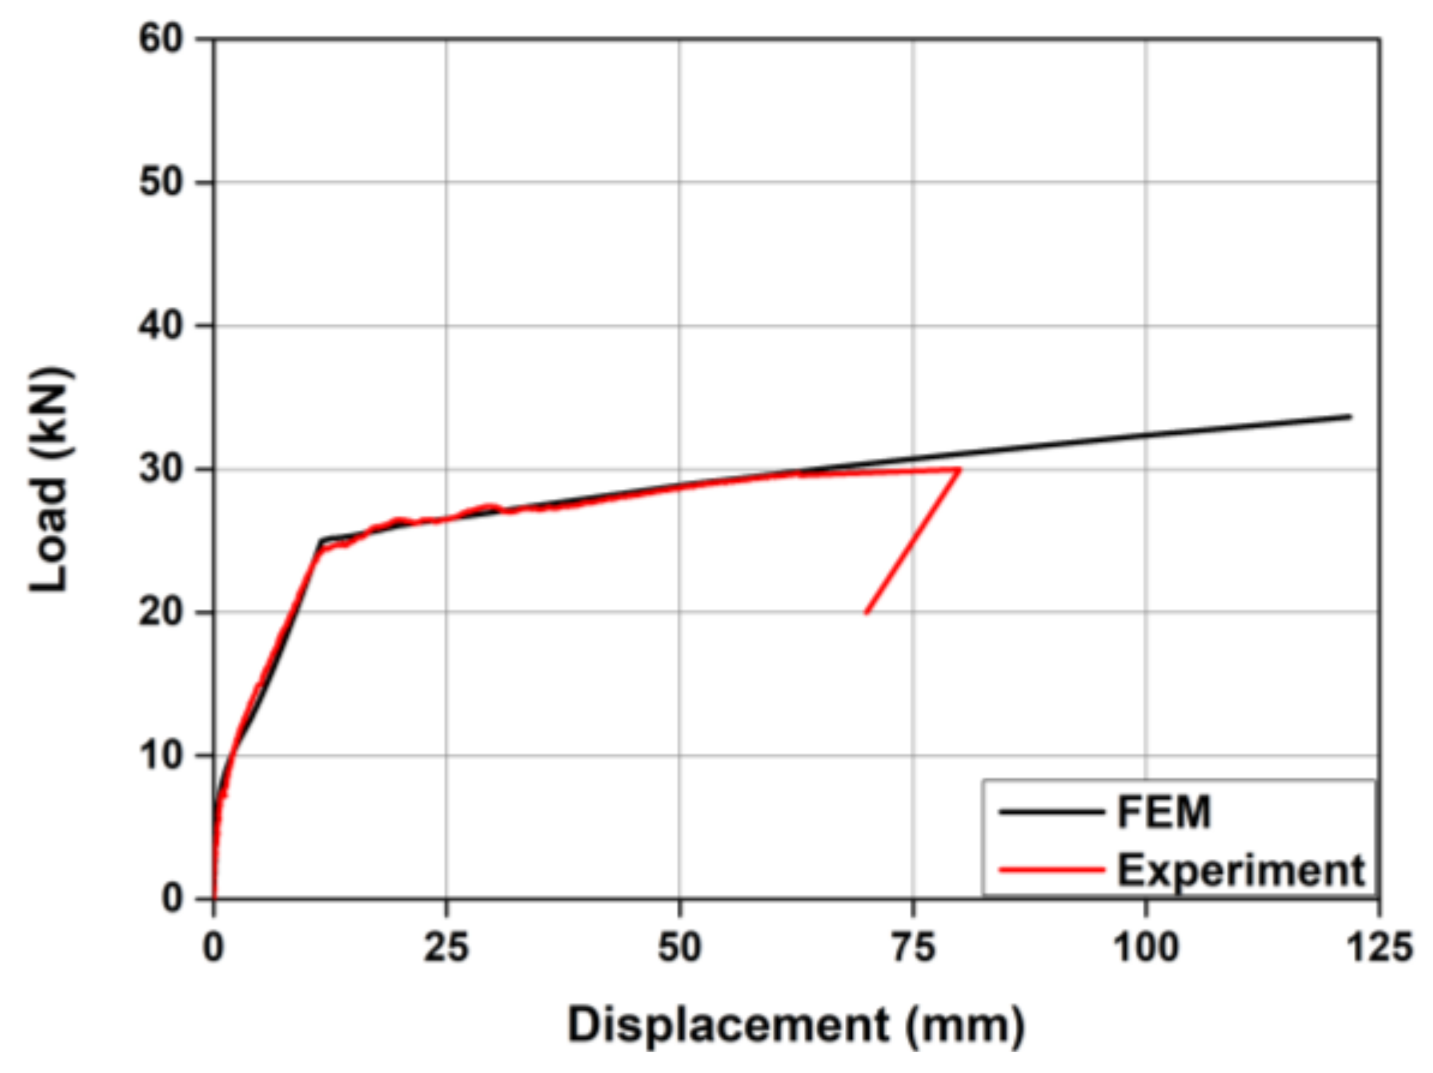
Figure 7 shows the comparison of the numerical and experimental results for the load-displacement relationship of the SL-CTRL specimen, which was an experiment without the Fe-SMA strip. The numerical initial crack load of SL-CTRL was 7.53 kN, showing a slight error of about 1.48% from the experimental result. The numerical and experimental yield loads were 25.04 kN and 23.79 kN, respectively, showing a slight error of about 5.25%. On the other hand, the ultimate loads of the numerical and experimental results were 33.64 kN and 29.59 kN, respectively, showing an error of about 13.69%.
In the experiment, SL-CTRL showed a typical flexural failure mode in which the concrete in the compression part was destroyed after yielding of the tensile reinforcement. At this time the vertical displacement of the mid-span of the specimen was about 80 mm. However, in the simulation of this specimen the strain of the extreme compressive concrete fiber reached 0.003 when the central vertical displacement reached 121.82 mm. This difference between the FE analysis and experiment caused a relatively large error at the ultimate load stage.
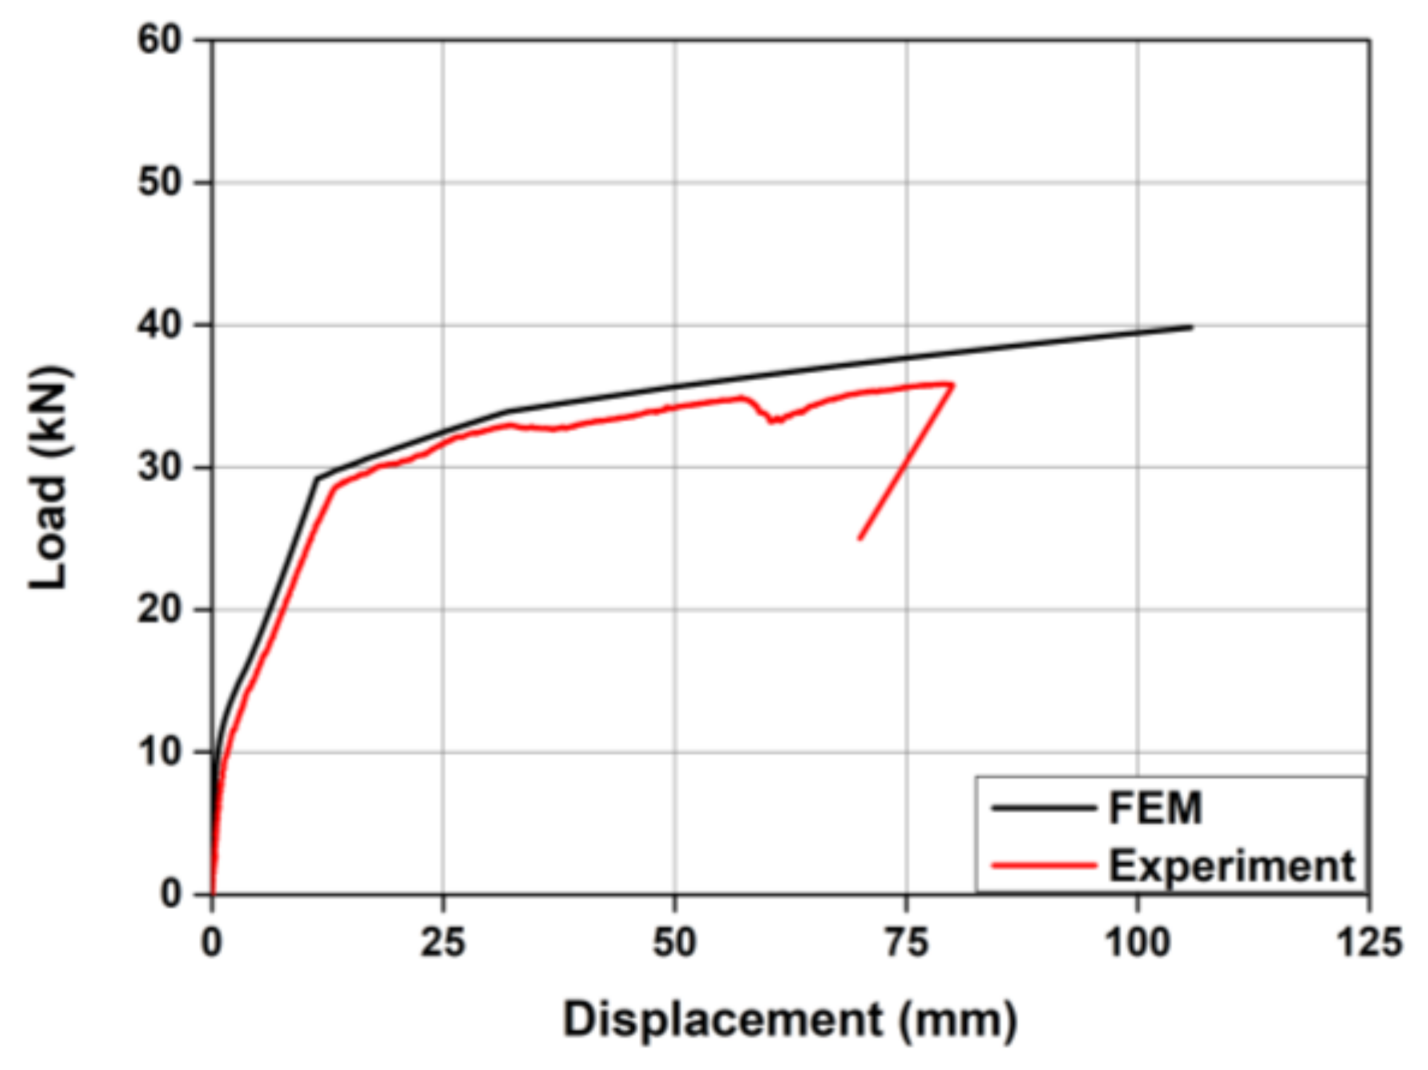
Figure 8 shows the comparison of the numerical and experimental results for the load-displacement relationship of SL-30S-4, which was strengthened with one line of Fe-SMA strip. In the FE analysis, the SL-30S-4 had an initial crack load of about 10.68 kN. This value was about 1.75 kN smaller than the experimental initial crack load of 9.42 kN. In the FE analysis, the yielding load of SL-30S-4 was about 29.38 kN, which is a slight error of about 0.9 kN when compared with the experimental results. The numerical and experimental ultimate loads also showed a small difference of about 3.03 kN. SL-30S-4 reached 0.003 in strain in the numerical extreme concrete fiber when the vertical displacement was 105.73 mm.
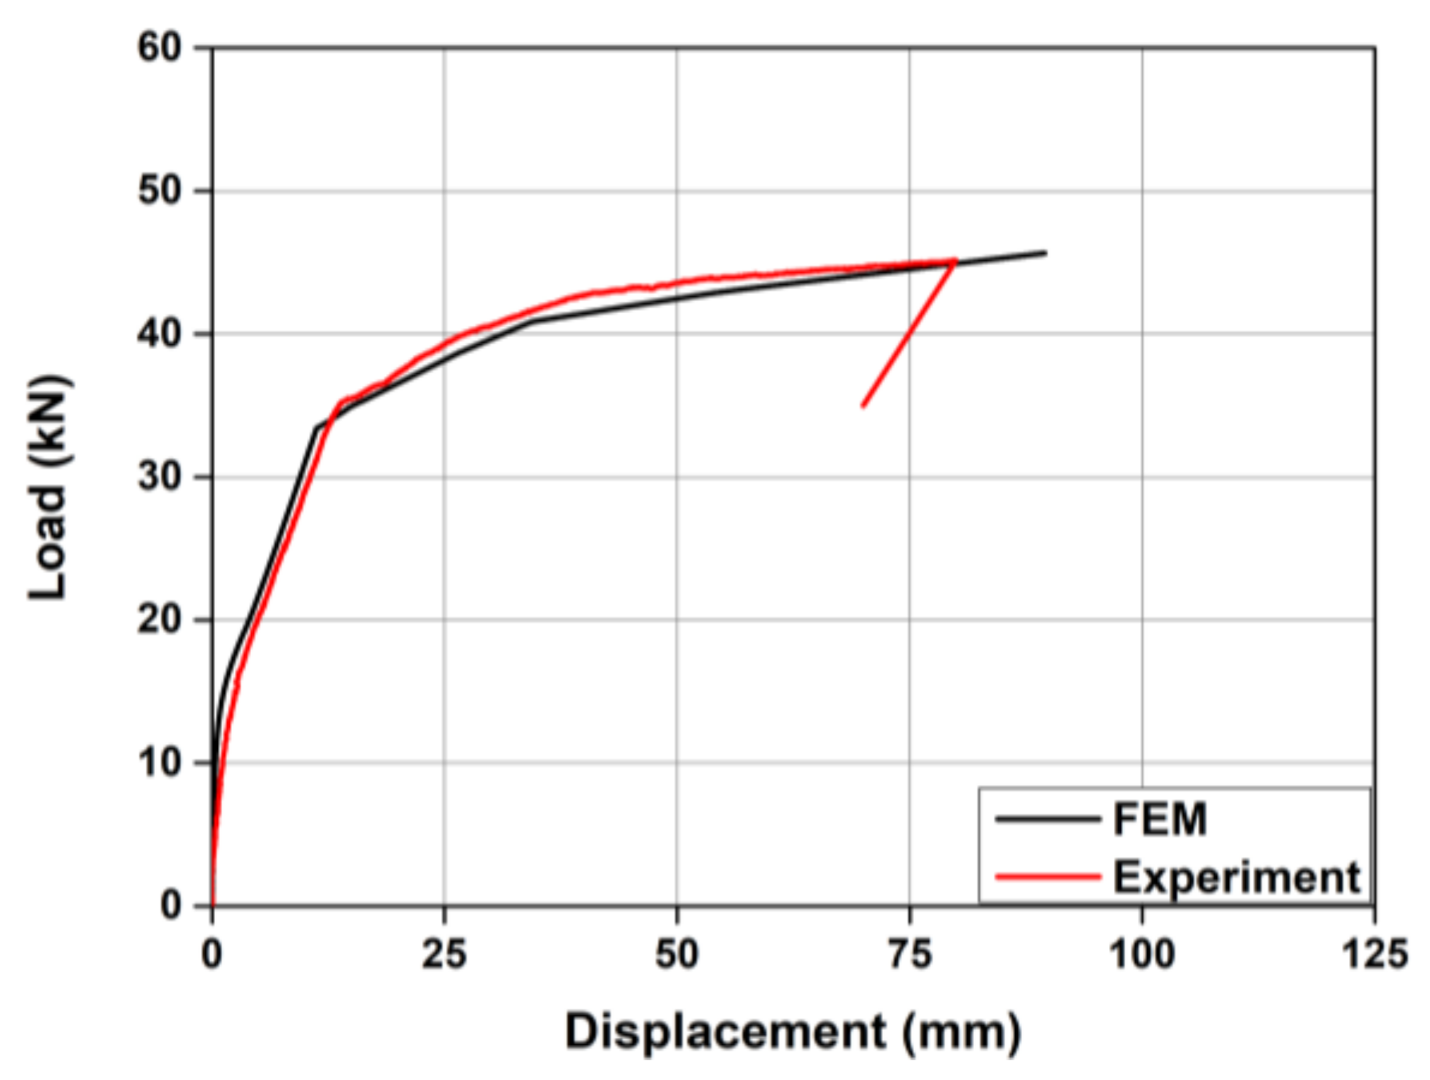
Figure 9 shows the comparison of the numerical and experimental load-displacement curves for SL-60S-4. The numerical initial crack load of SL-60S-4, a specimen strengthened with two lines of Fe-SMA strips, was 13.7 kN, which was a slightly larger value by about 0.24 kN from the experimental result. The numerical yielding load of this specimen was 33.47 kN, which is an insignificant difference of 1.62% from the experimental yielding load. The numerical ultimate load of this specimen was 45.63 kN, which is a small error of about 2.2% from the experimental ultimate load. The SL-60S-4 simulation resulted in a concrete crushing failure after the tensile reinforcement yielded at the central vertical displacement of 89.51 mm. The SL-60S-4 experimental specimen also exhibited concrete failure in the compression zone after the tensile reinforcement yielded at a central defection of about 80 mm.
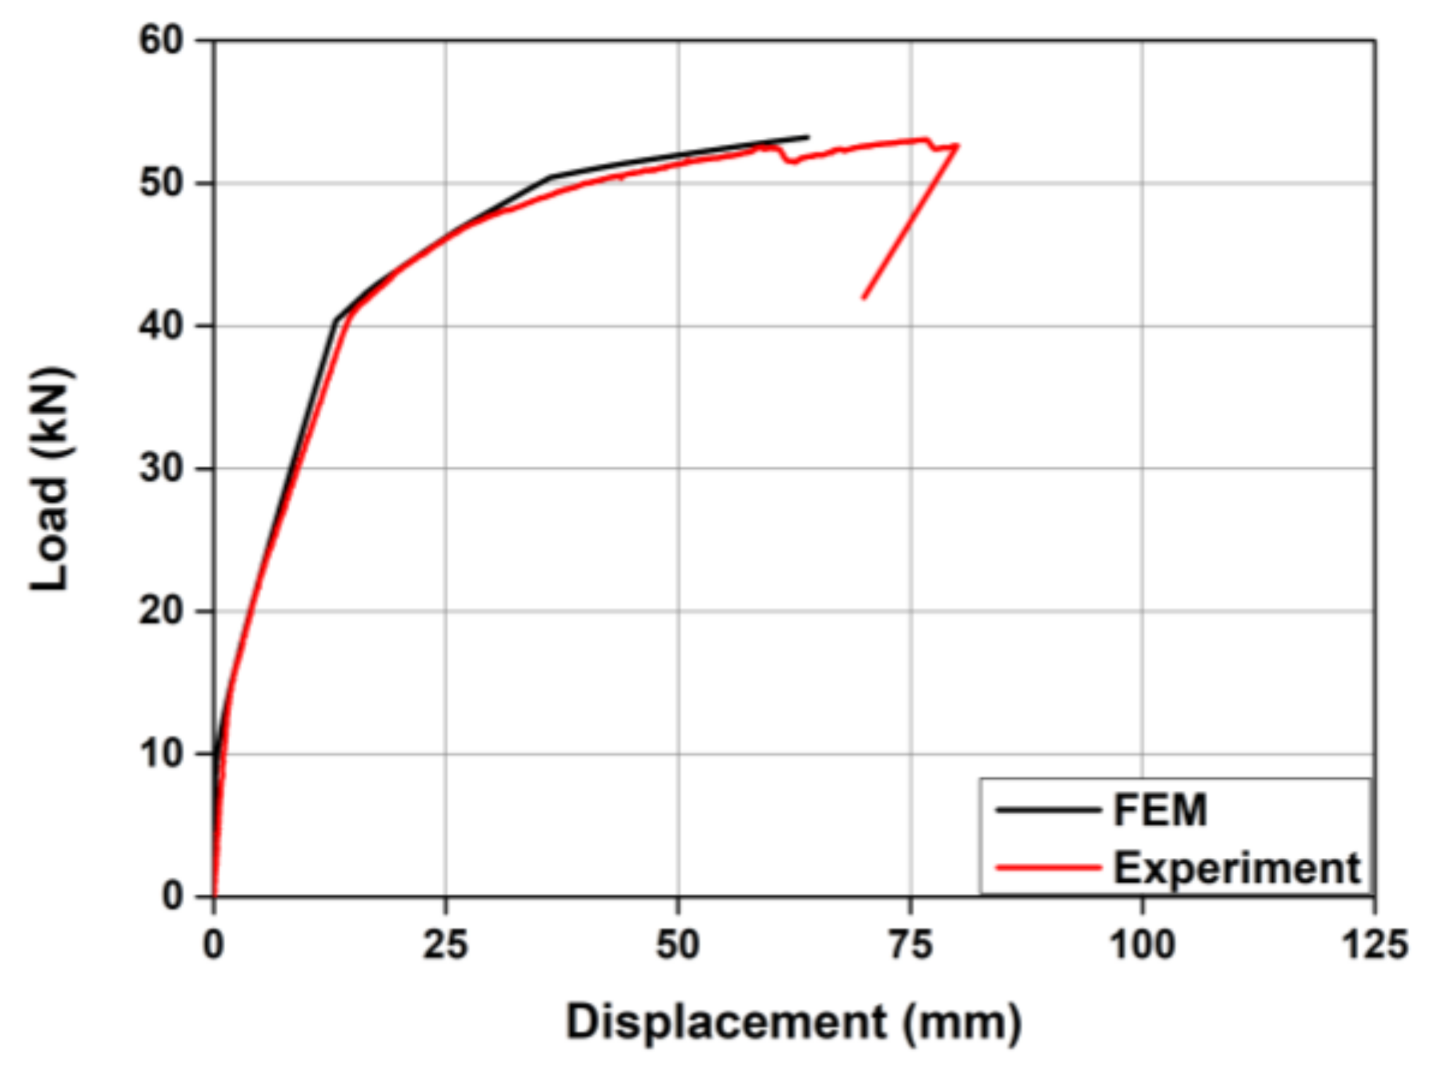
Figure 10 shows the numerical and experimental results for the load-displacement relationship of SL-90S-4. The initial crack in SL-90S-4, which was strengthened by the three-line Fe-SMA strips, occurred under a numerical load of 16.68 kN, which was about 2.64 kN larger than the experimental result. The numerical yielding load and ultimate load of this specimen were 1.26% and 4.15% higher than the experimental results, respectively. The SL-90S-4 numerical specimen also predicted concrete crushing failure in the compressive zone after the tensile reinforcement yielded.
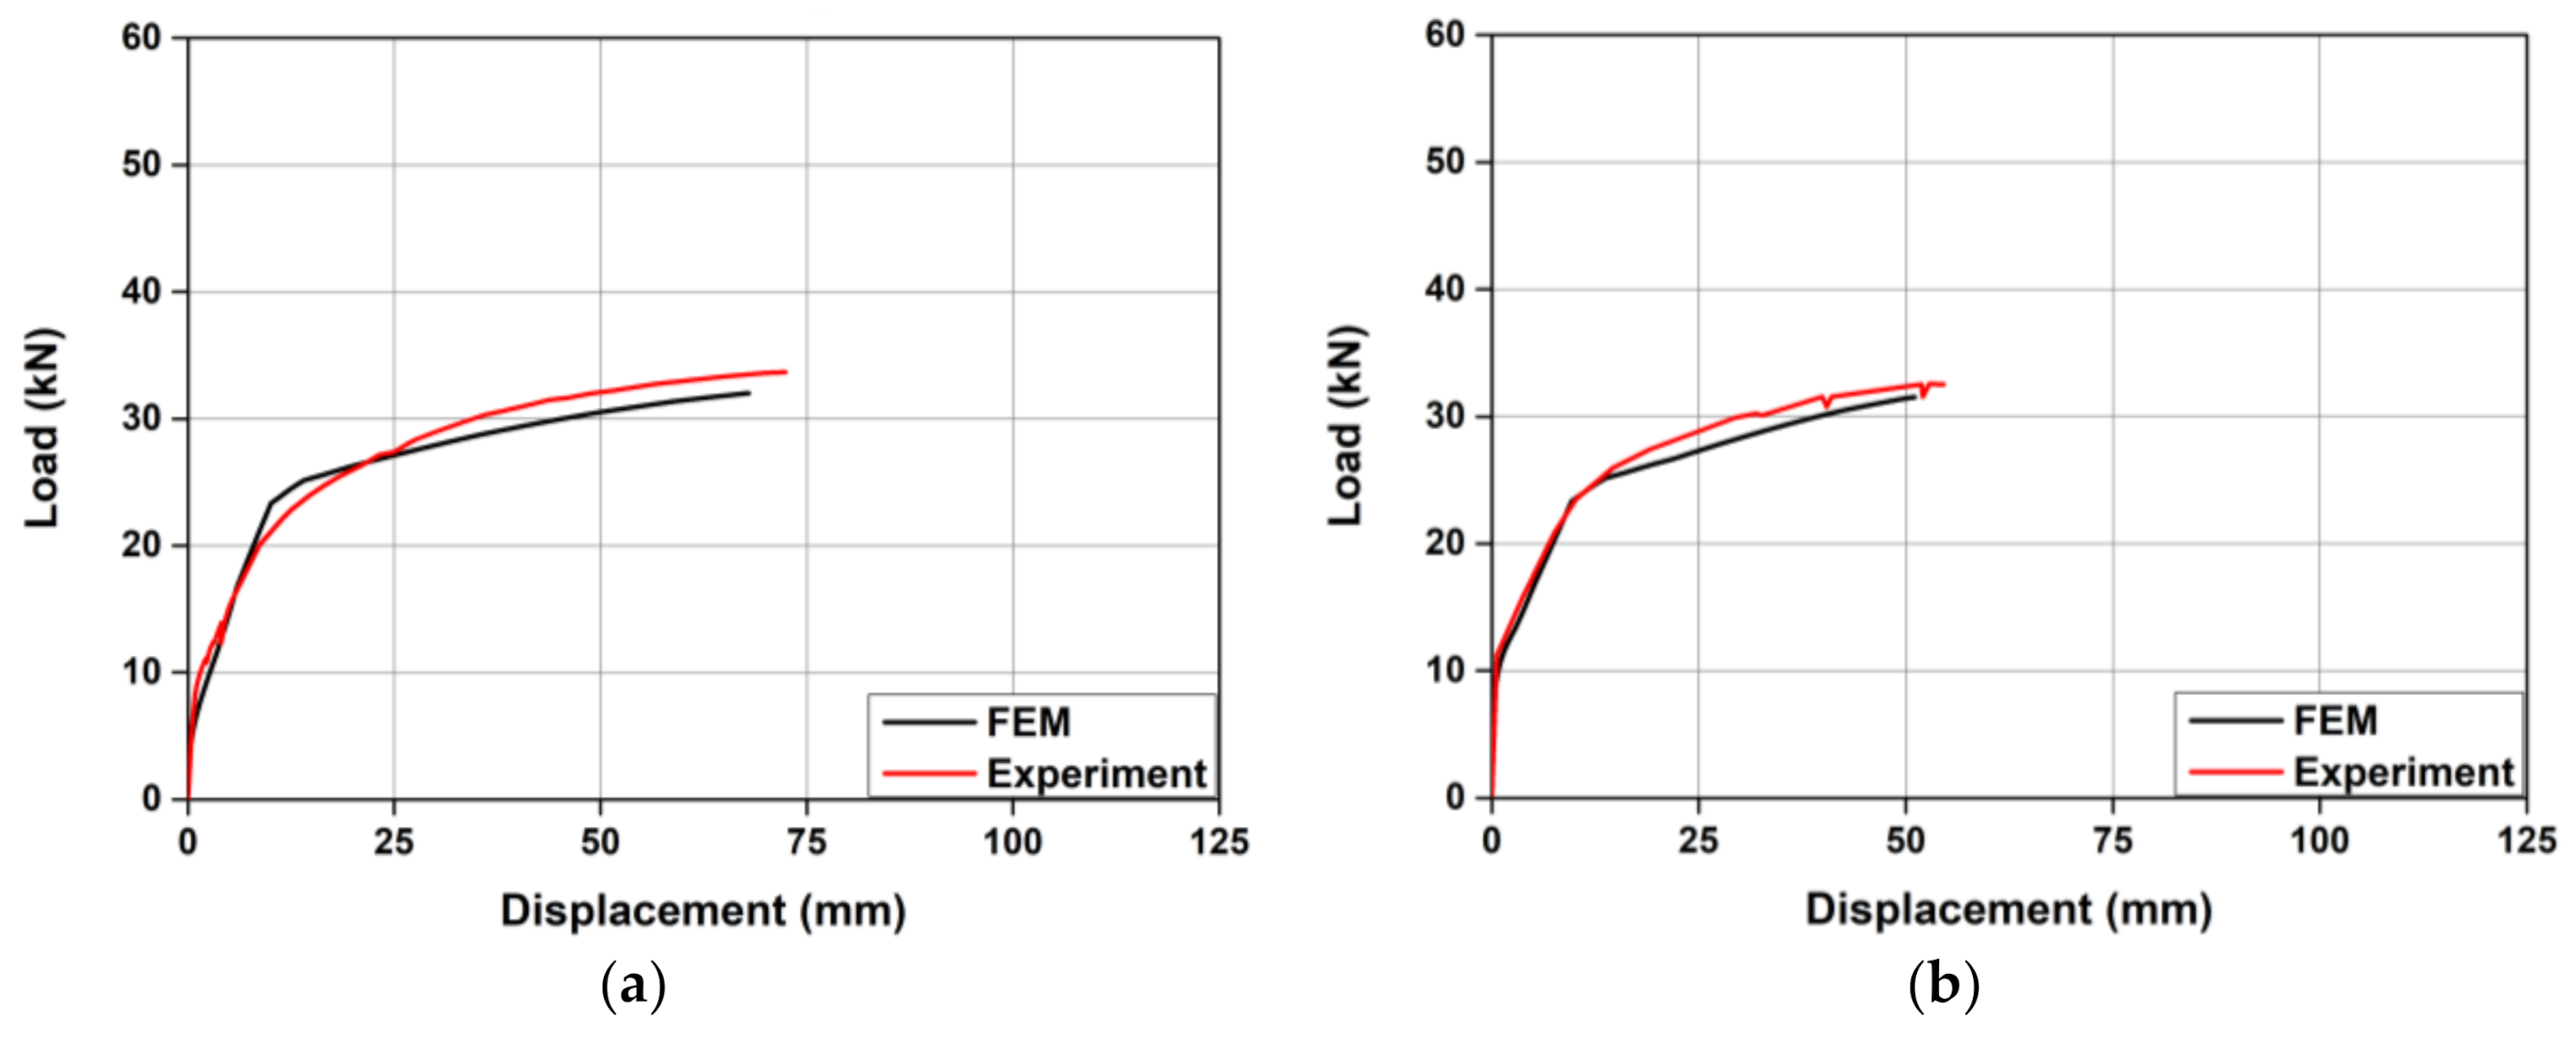
To analyze the reliability of the proposed FE model in this study, Shahverdi’s experimental results were compared with the simulation results from the FE analysis of the proposed FE model. Shahverdi et al. [29] conducted a four-point bending test of RC beams strengthened with NSM using a Fe-SMA strip. The used Fe-SMA was pre-tensioned up to 2% of its original length. The Fe-SMA strip was heated to 160 °C to activate the shape memory effect, which produced about 250 MPa in recovery stress. The length, width, and thickness of the used Fe-SMA strip were 2600 mm, 20 mm, and 1.7 mm, respectively. Detailed geometry and material properties of the used specimens are referred in Shahverdi’s paper [29].
A comparison of the experimental and the FE analysis results is shown in Figure 11a,b in terms of the initial crack load, the yield load, and the ultimate load. Figure 11a is the load-displacement curve on the RC beam strengthened with non-activated Fe-SMA strip. Figure 11b shows the load-displacement curve with an activated Fe-SMA strip. When the three load stages from the experiments and the FE analyses were compared, as shown in Figure 11a,b, the proposed FE model predicted the experimental results well, with less than 6% error. The FE analysis of the strengthened RC beam with non-activated Fe-SMA strip showed an initial crack load, yield load, and ultimate load of 4.7 kN, 23.3 kN, and 32.02 kN, respectively. Errors in the results between the test and simulation for each load stage were 6.0%, 1.7%, and 4.7%, respectively. On the other hand, the RC beam strengthened with the activated Fe-SMA strip exhibited 8.71 kN, 23.37 kN, and 31.52 kN for those three load stages, respectively, showing minor errors of 2.6%, 0.6%, and 3.9% from the experimental results.
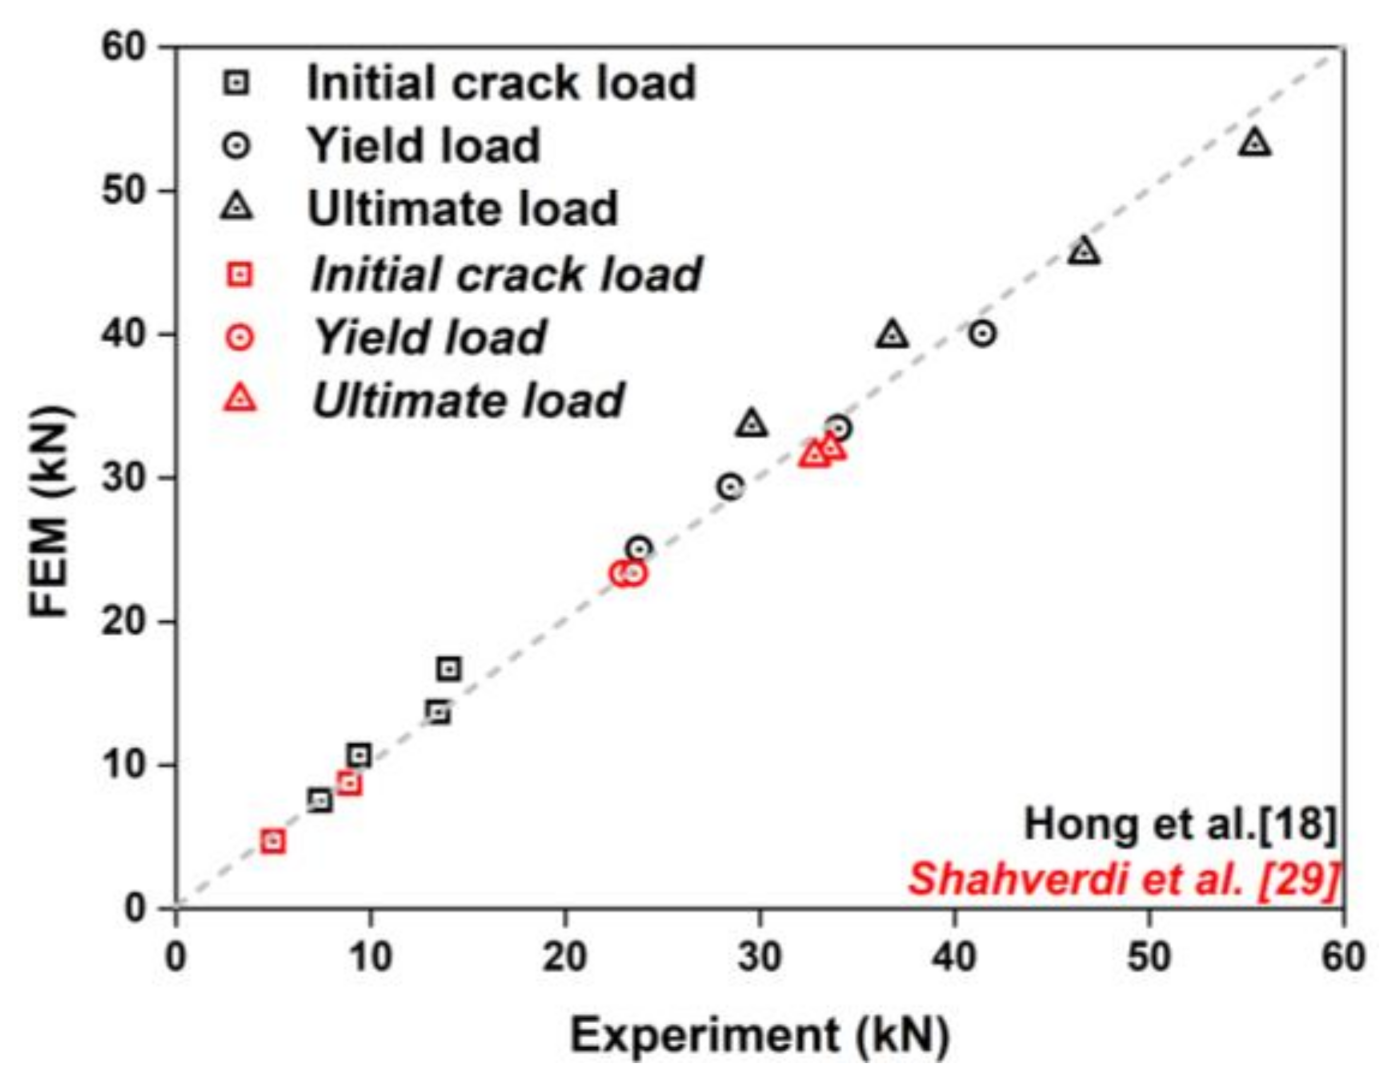
Figure 12 shows the agreement in the numerical prediction results and experimental results in terms of the initial crack load, yield load, and ultimate load. The ratio of the numerical results to the experimental results averaged 1.04, 1.01, and 1.01, respectively, and the standard deviations were an average of 0.09, 0.03, and 0.07, respectively. In other words, the FE model accurately predicted the flexural behavior of the RC beams strengthened with Fe-SMA strips using the NSM method.
4.2. Parametric Studies
As described in the previous paragraph, the proposed FE model showed relatively accurate predictions for the RC beams strengthened with the Fe-SMA strip. Parametric analyses were performed with this FE model, to investigate which variable affected the flexural strength of the RC beam strengthened with the Fe-SMA strip using the NSM method. The variables considered in this parameter analysis were the concrete compressive strength, recovery stress level, amount of Fe-SMA strip, and ratio of tensile reinforcement of the specimen SL-90S-4. The parametric studies were conducted in terms of the crack load, yield load, and ultimate load on each parametric variable. In addition, the displacement ductility index was considered to investigate the serviceability of the RC beam reinforced with the Fe-SMA strip. The displacement ductility index was calculated using Equation (4) below.
where, represents the displacement ductility index, and represent the displacement at the yielding load and ultimate load, respectively.
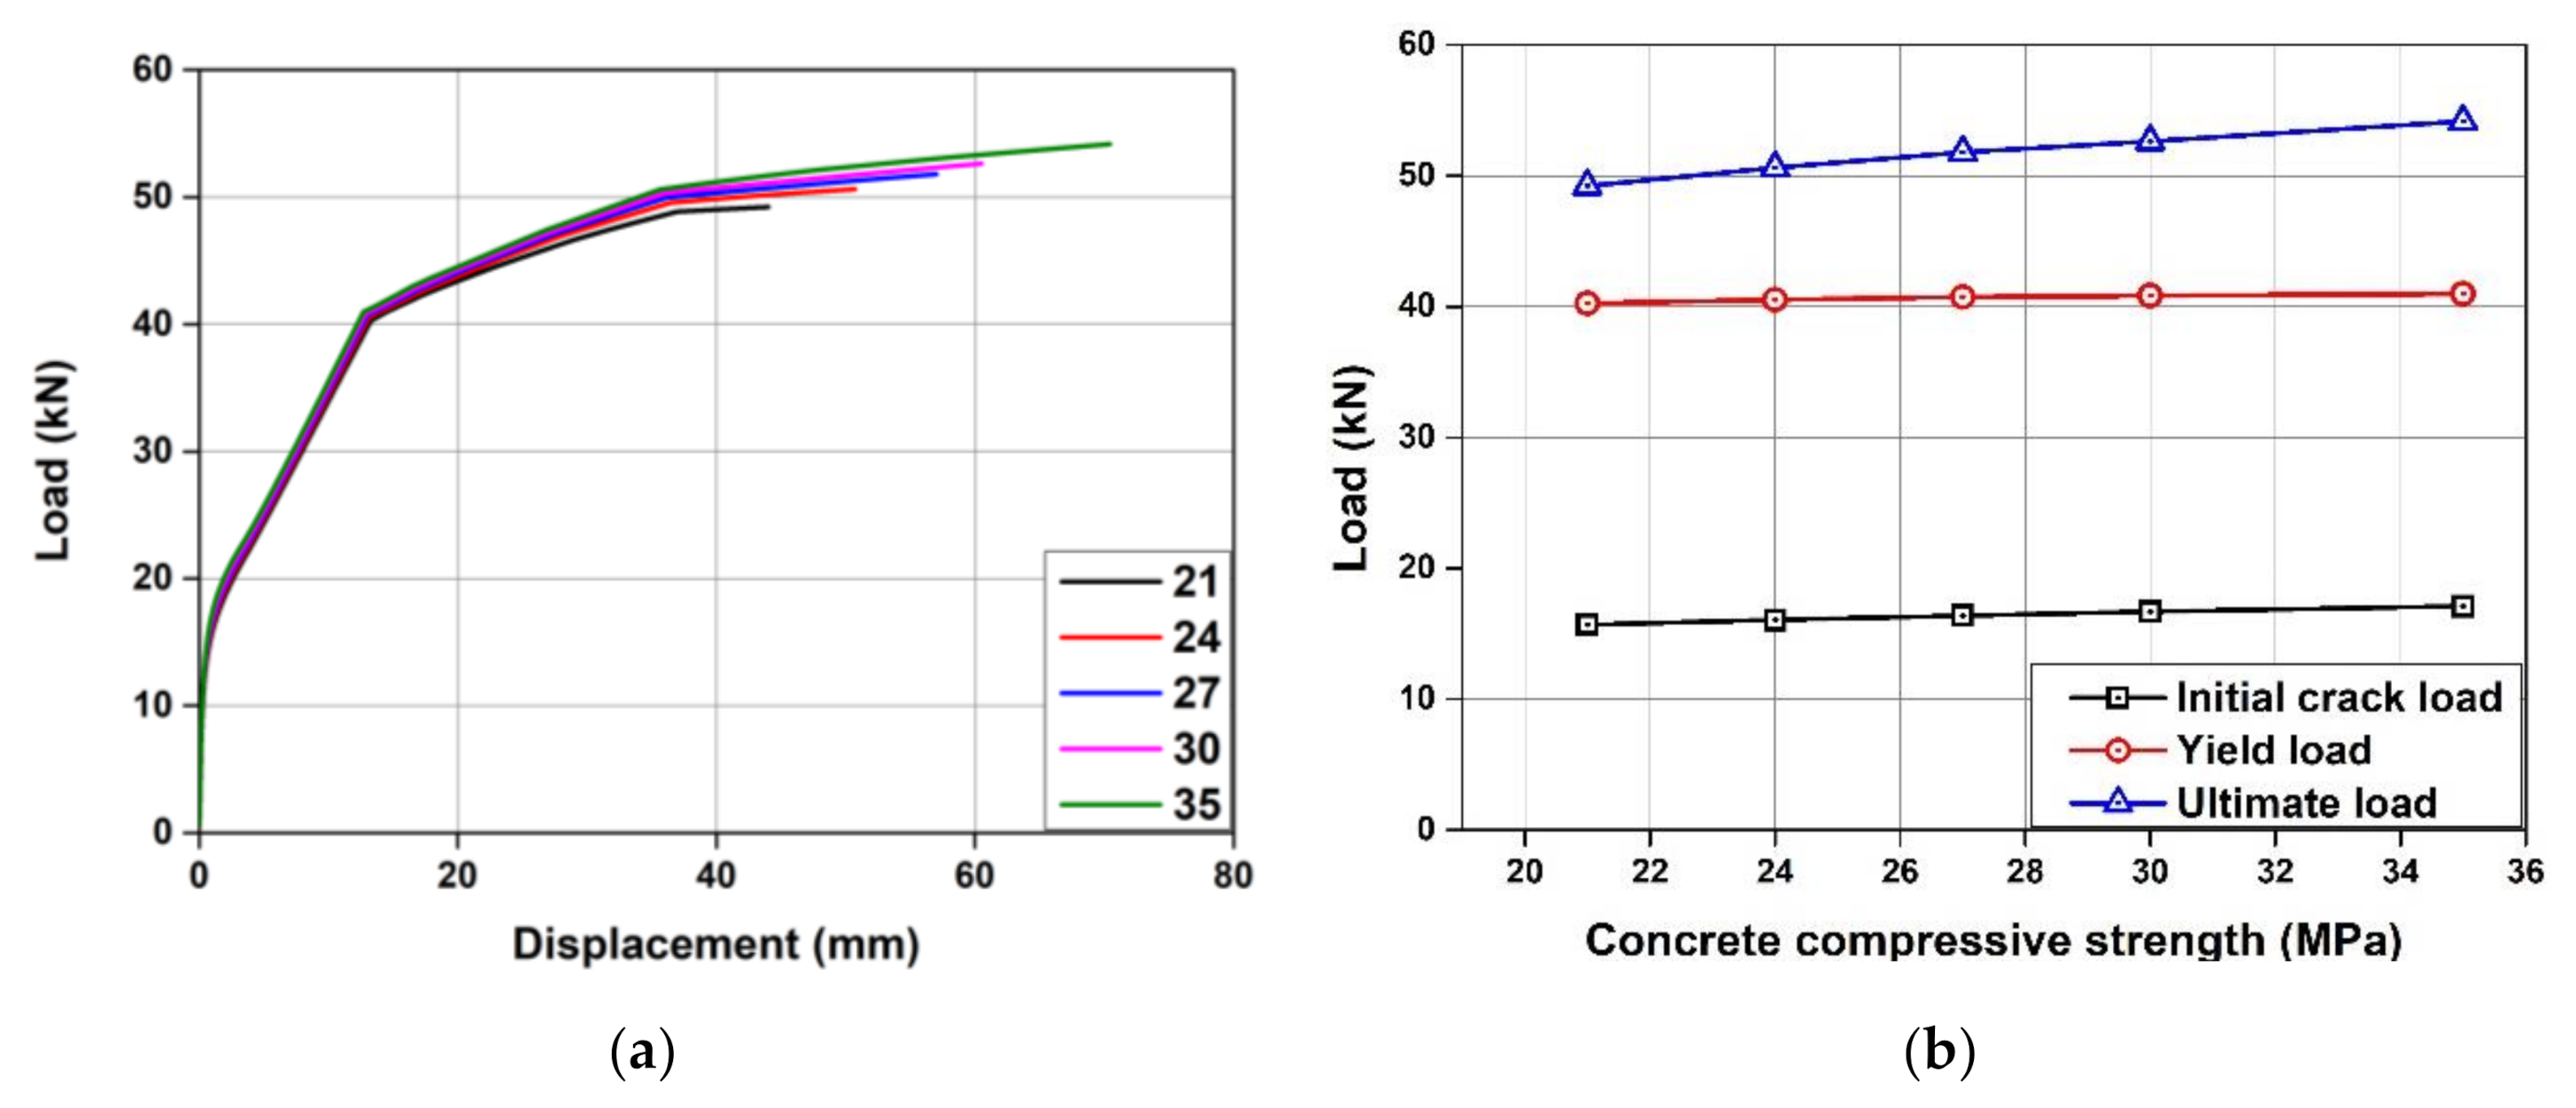
4.2.1. Effect of Concrete Compressive Strength
Figure 13a shows the comparison of the load-displacement curves for varying concrete compressive strengths for the RC beam strengthened with the Fe-SMA strip. Figure 14 shows the comparison of the crack load, yield load, and ultimate load with respect to changes in the concrete compressive strength. The concrete compressive strengths of 21 MPa, 27 MPa, 30 MPa, and 35 MPa were considered as parameters. As shown in Figure 13b, the ductility of the parametric specimens was improved following the increase in the compressive strength of the concrete, from 21 MPa to 35 MPa. The displacement ductility index increased considerably, from 3.32 to 5.54, a 66.8% improvement, with the increase in the concrete compressive strength. However, as seen in Figure 13b, the increased compressive strength of the concrete from 21 MPa to 35 MPa resulted in a slight increase of 1.41 kN in the initial crack load, 0.72 kN in yield load, and 4.95 kN in ultimate load, respectively. From these results, it was determined that the ductility of the RC beam strengthened with the Fe-SMA strip is governed by the compressive strength of the concrete.
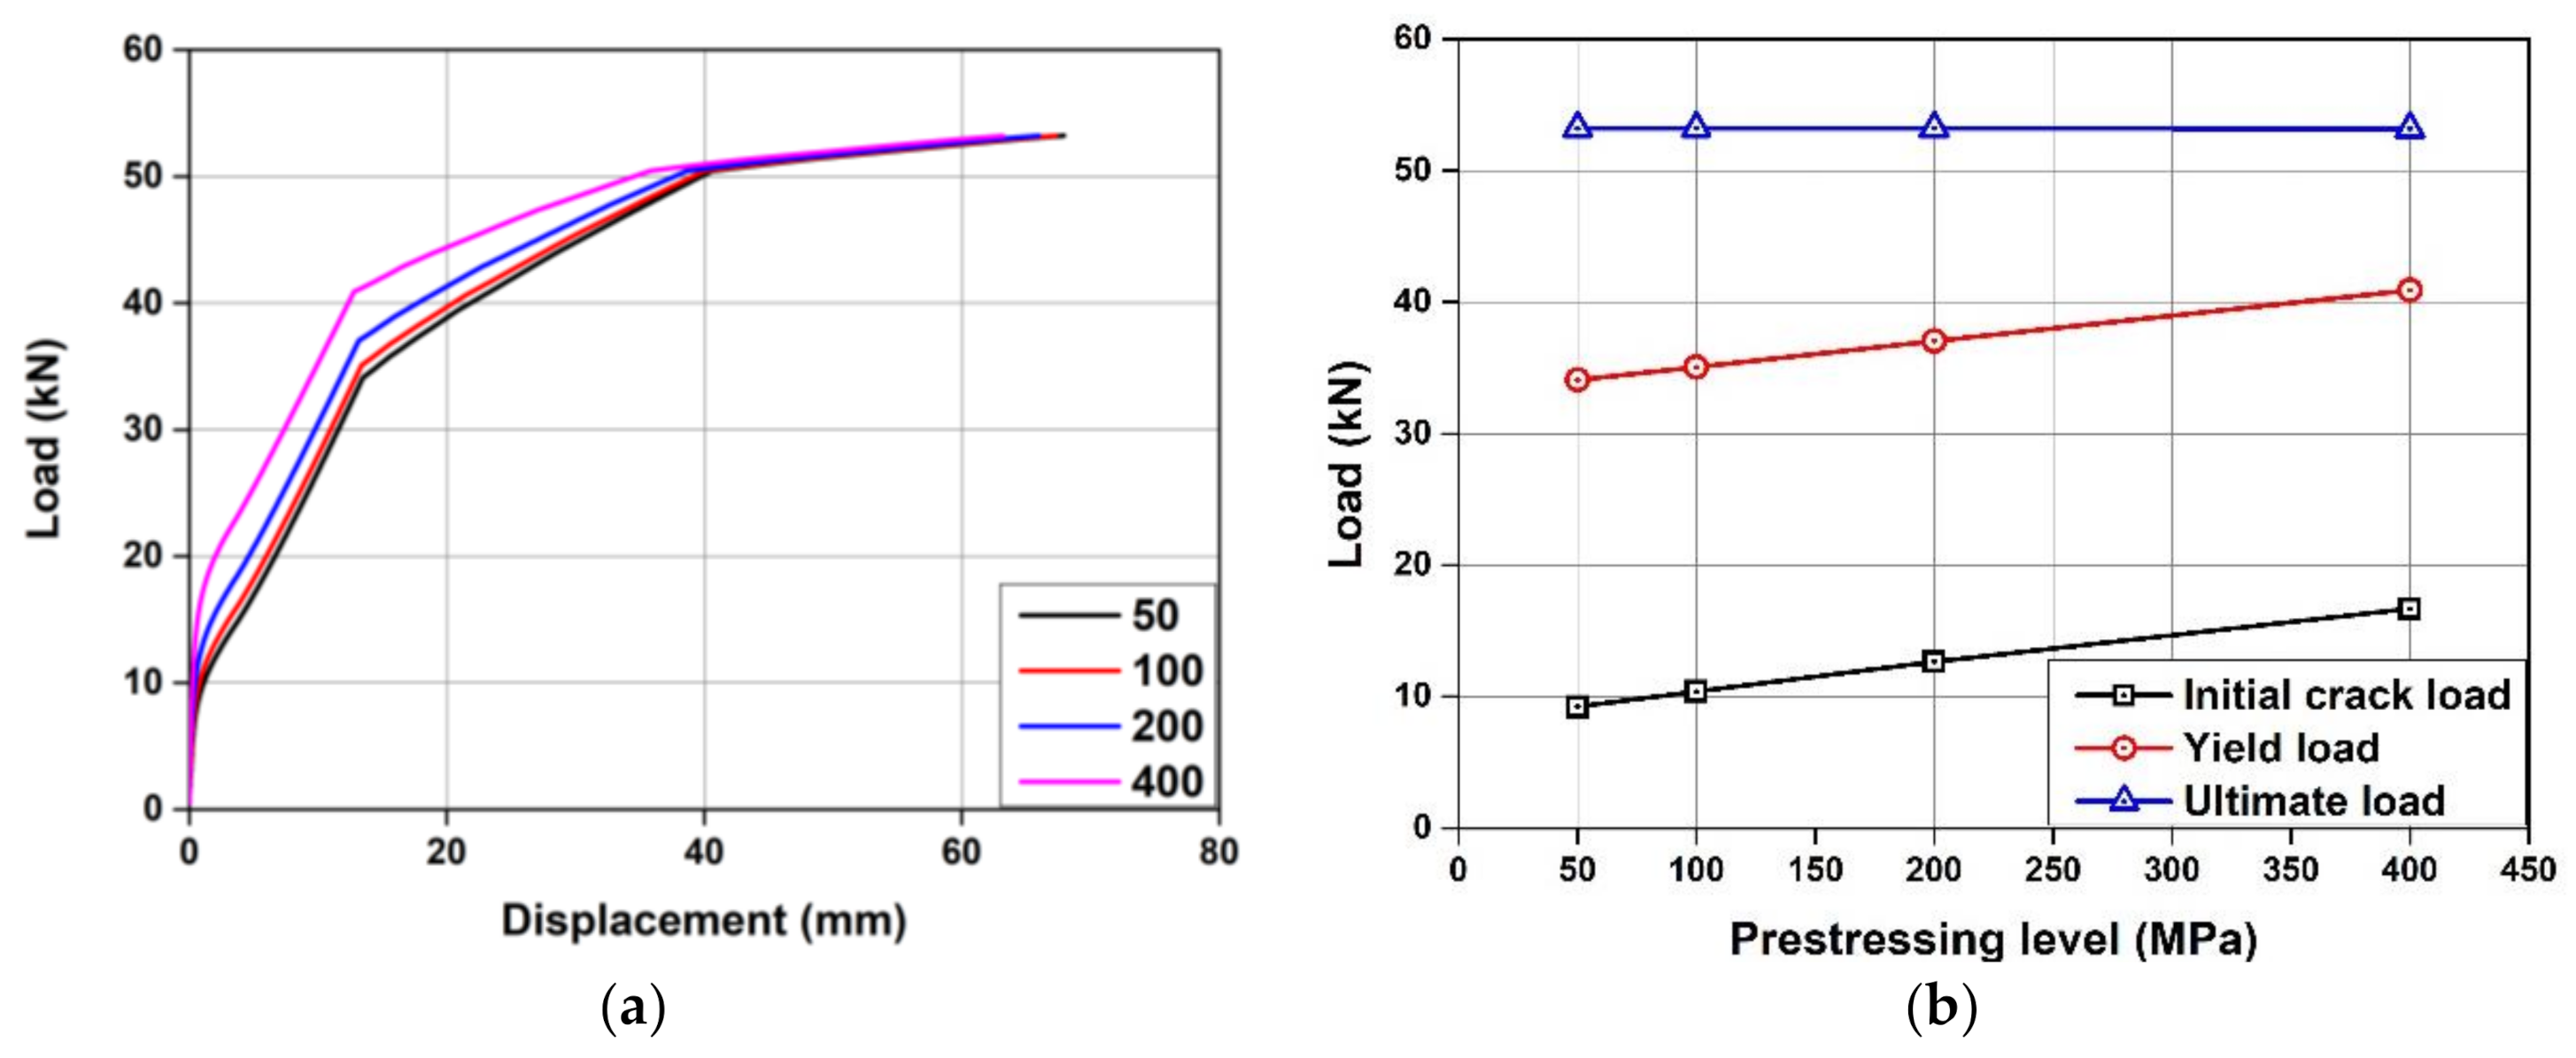
4.2.2. Effect of Recovery Stress
Figure 14a shows the comparison of the load-displacement curves according to the recovery stress level of the RC beam strengthened with an Fe-SMA strip. Figure 14b shows the initial crack load, yield load, and ultimate load of the RC beam according to different recovery stress levels of the Fe-SMA strip. Four recovery stress levels of 50 MPa, 100MPa, 200 MPa, and 400 MPa were considered. As shown in Figure 14b, as the recovery stress of the Fe-SMA increased from 50 MPa to 400 MPa, the initial crack load and yield load increased by 80.68% and 19.94%, respectively. On the other hand, the ultimate load did not show remarkable improvement, regardless of the level of recovery stress of the Fe-SMA. The displacement ductility index tended to slightly decrease to an insignificant degree as the recovery stress of the Fe-SMA increased. It was observed that the increase in the recovery stress of the Fe-SMA improved the initial stiffness of the RC member, which resulted in its improved serviceability.
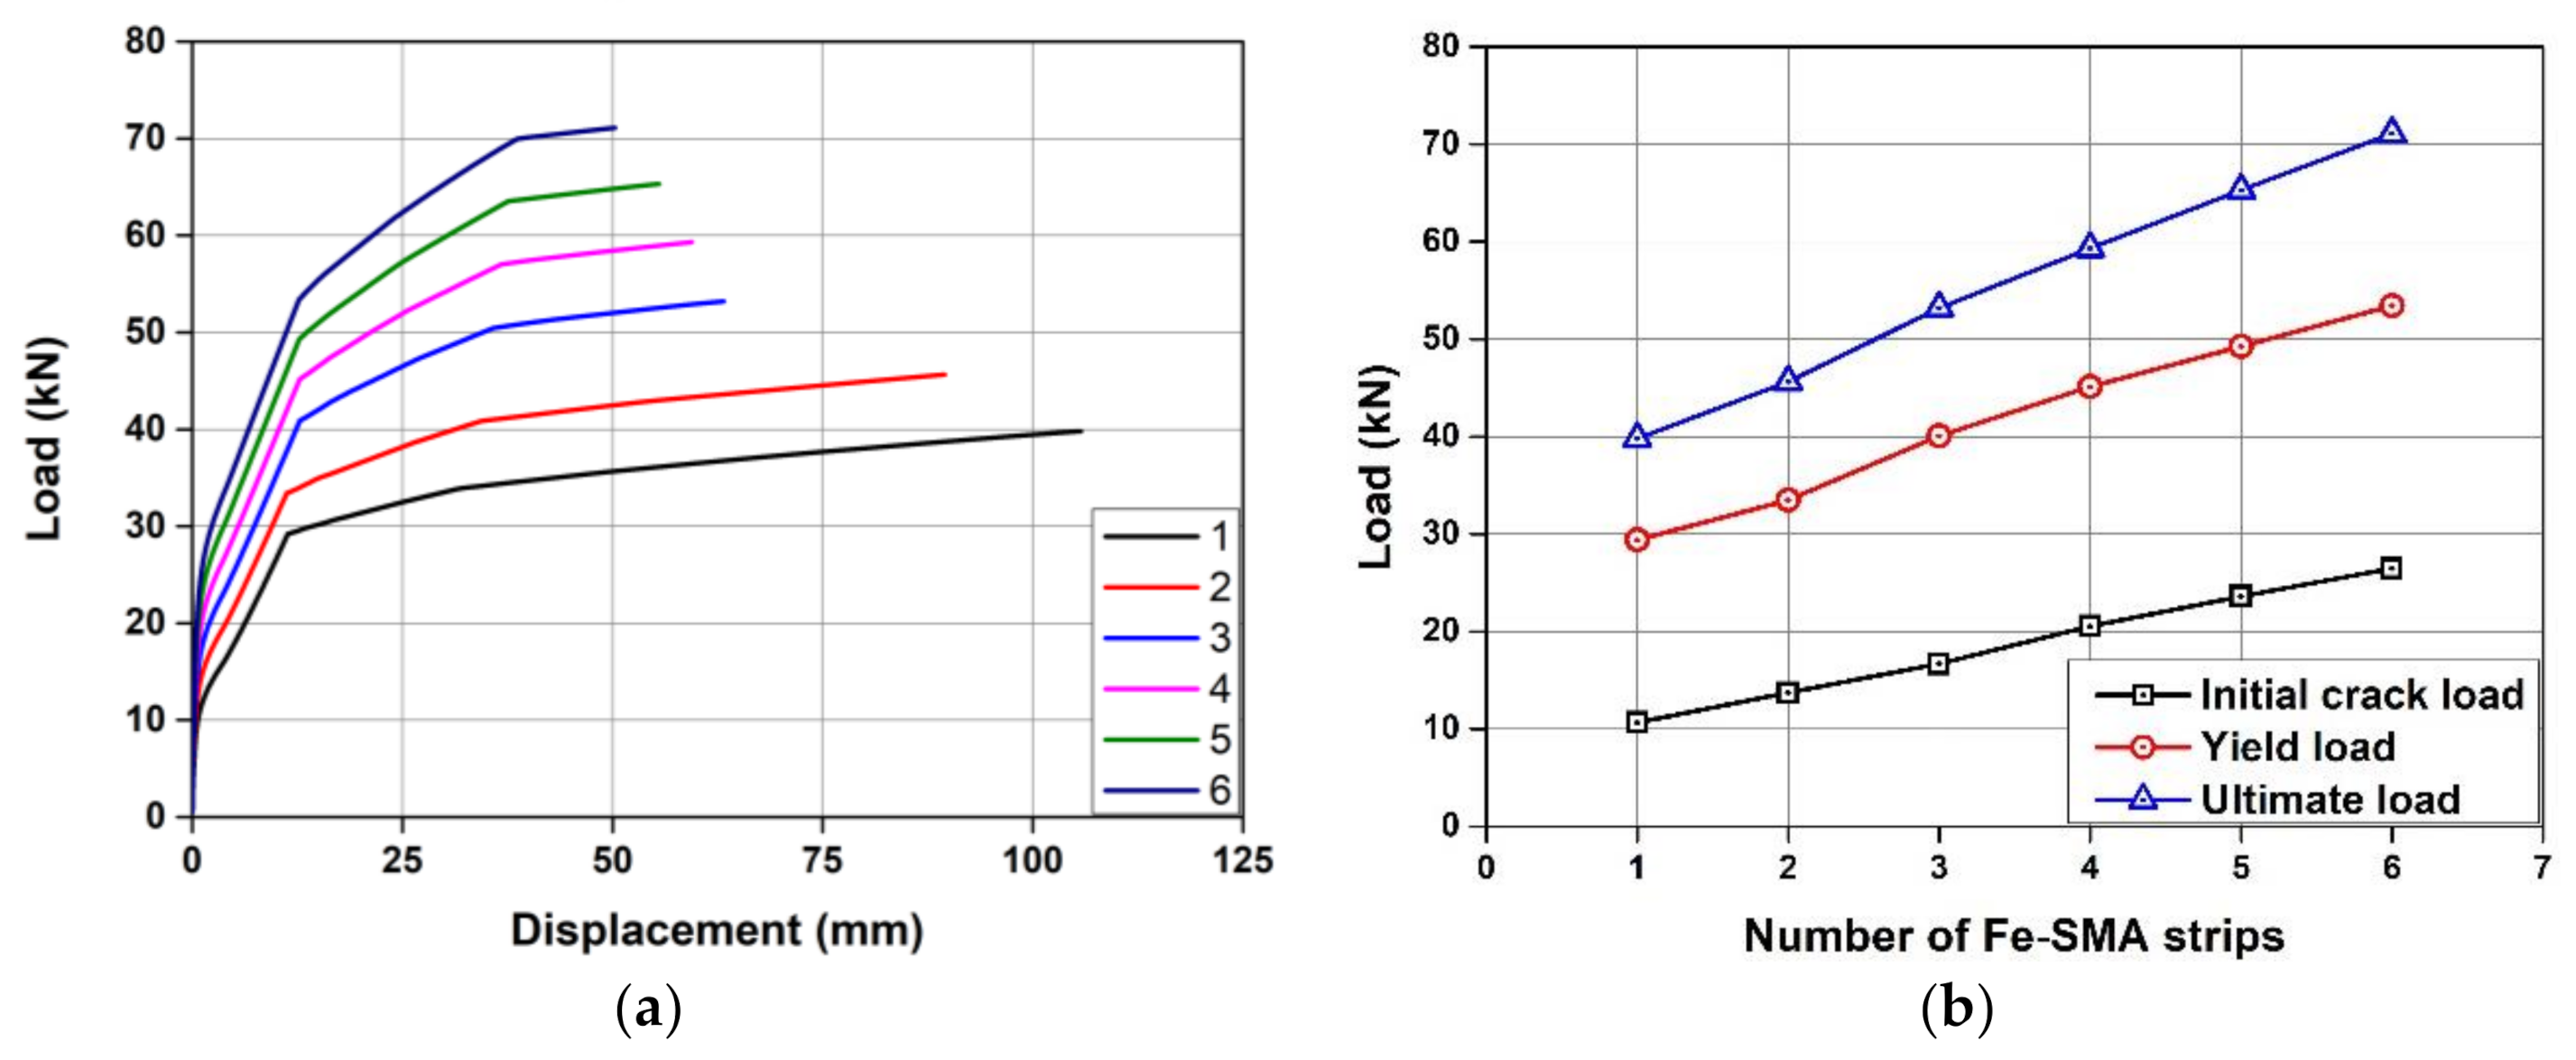
4.2.3. Effect of Amount of Fe-SMA Strip
Figure 15a shows the load-displacement curves for varying amounts of Fe-SMA strips on the RC beam strengthened with Fe-SMA, and Figure 15b shows the comparison of the initial crack load, yield load, and ultimate load of the RC beam against the amount of Fe-SMA strips. 30 mm2, 60 mm2, 90 mm2, 120 mm2, 150 mm2, and 180 mm2 of Fe-SMA strips were considered as parameters. As shown in Figure 15b, as the amount of Fe-SMA strips increased from 30 mm2 to 180 mm2, the initial crack load, yield load, and ultimate load increased significantly by 147.8%, 81.8%, and 78.6%, respectively. However, as the amount of Fe-SMA strip increased from 30 mm2 to 180 mm2, the displacement ductility index decreased by about 54.5%. With these results, it was determined that the amount of Fe-SMA strip has an inverse relationship to the serviceability of specimens.
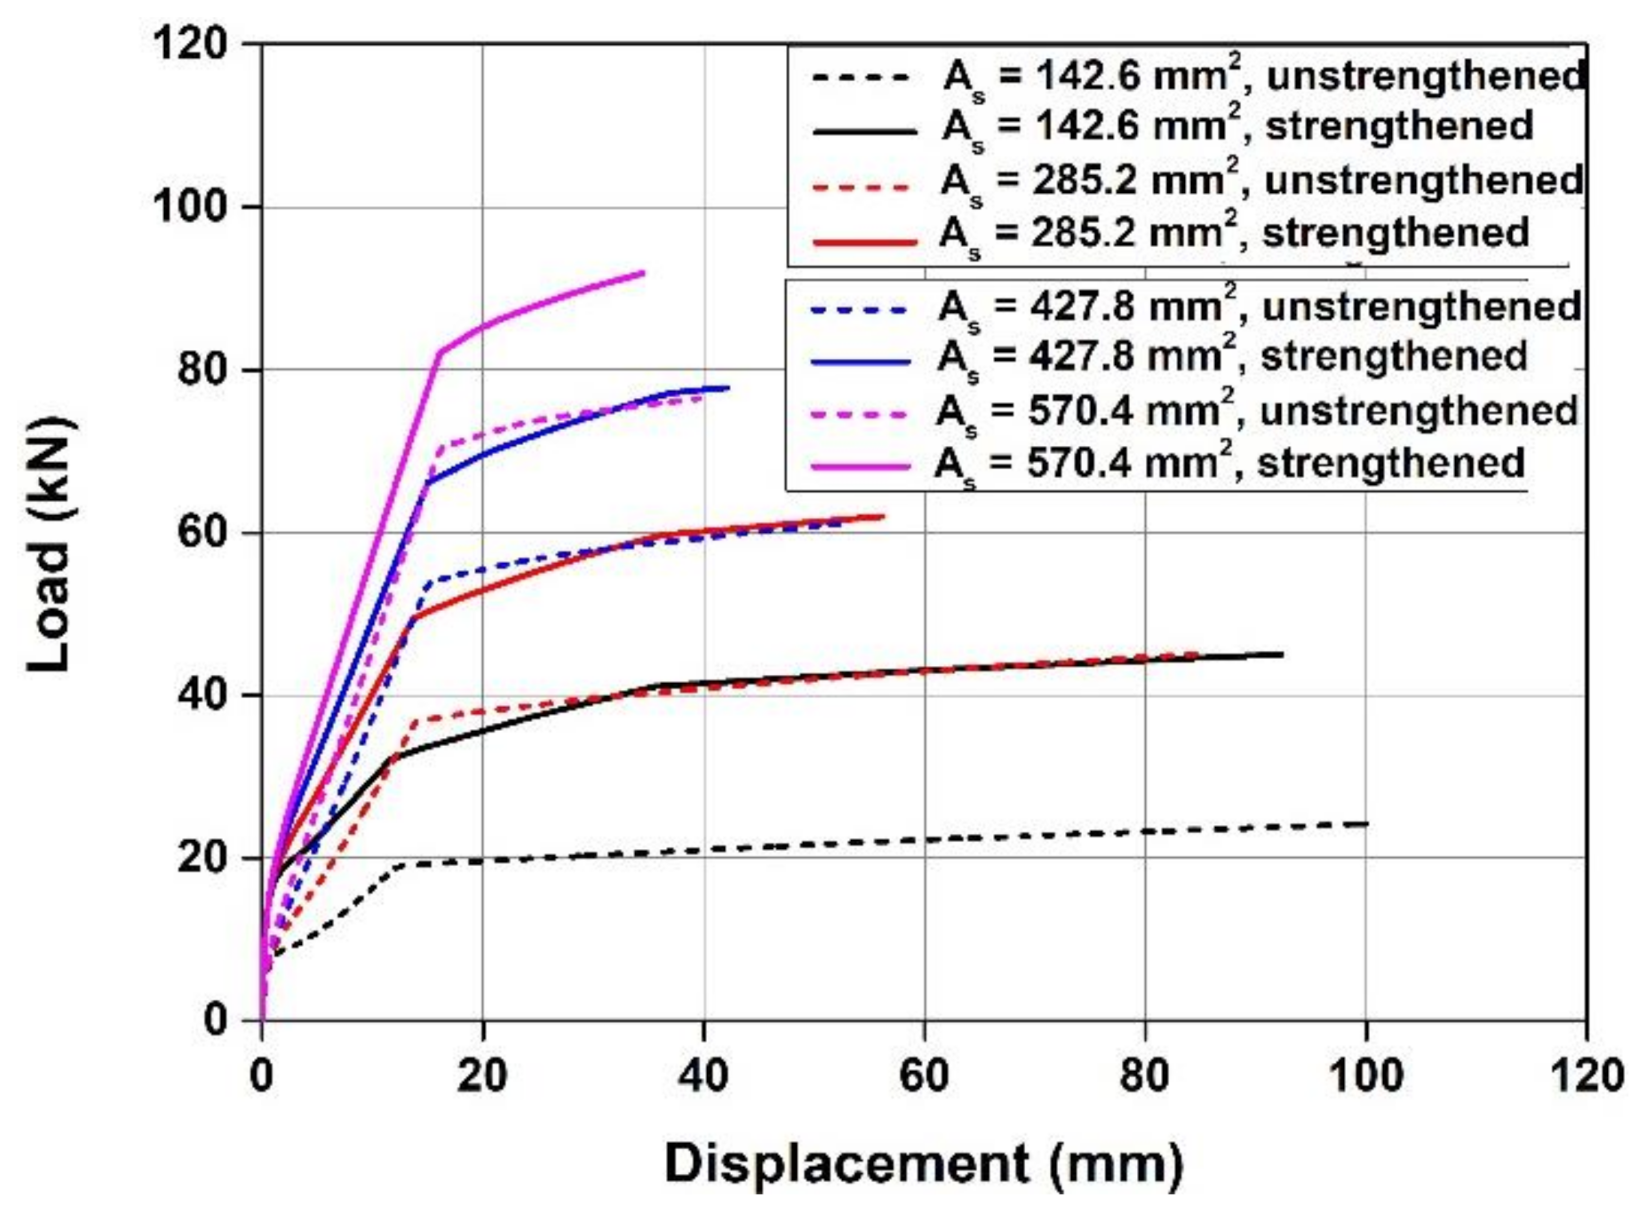
4.2.4. Effect of Tensile Reinforcement Ratio
Figure 16 shows the comparison of the load-displacement curves according to the change in the amount of tensile reinforcement in the RC beam strengthened with Fe-SMA strip. The solid and dotted lines in Figure 16 are the load-displacement curves of the specimen with and without the Fe-SMA strips, respectively.
As the parametric variable, the amount of tensile reinforcement was determined by considering the minimum reinforcement ratio () in ACI 318 [27] and the maximum reinforcement ratio () which satisfies the minimum allowable strain for the flexural behavior of the RC beams. The minimum reinforcement ratio and maximum reinforcement ratio are calculated in Equations (5) to (7). The maximum reinforcement ratio is expressed with net tensile strain in extreme tensile steel when the concrete strain reaches 0.003 of the strain in the extreme compression fiber of the concrete in accordance with ACI 318 [27]. The amount of tensile reinforcement considered were 142.6 mm2, 285.2 mm2, 427.8 mm2, and 570.4 mm2. The initial crack load, yield load, and ultimate load of the two cases (un-strengthened and strengthened with the Fe-SMA strips) are summarized in Table 2.
where, , represent the yield stress and yield strain of the steel reinforcement, respectively. is the ratio of depth of equivalent rectangular stress block to depth of neutral axis.
As shown in Table 2, the initial crack load slightly increased as the amount of reinforcement increased regardless of the installation of the Fe-SMA strip. In addition, the yield load and ultimate load increased by more than 300% in the un-strengthened cases and more than 200% in the strengthened cases when the amount of reinforcement increased from 142.6 mm2 to 570.4 mm2. It was observed that the flexural strength at the yield load and the ultimate load is governed by the steel reinforcement. However, as the amount of reinforcement increased, the ductility index decreased to a maximum of 69.65%, due to a decrease in vertical displacement at the ultimate load. At the ultimate load, the strengthening efficiency dropped from 85.92% to 20.14% when the amount of steel reinforcement increased from 142.66 mm2 to 570.4 mm2. This result shows that the NSM strengthening by the Fe-SMA strip is more effective for RC beams with a low reinforcement ratio.
5. Conclusions
In this study, a FE model was proposed for predicting the flexural behavior of RC beams strengthened with Fe-SMA strips using the NSM method. The reliability of this model was verified with experimental results reported in the literatures. Then, parameter analyses were conducted to determine which variable affected the flexural behavior of RC beams strengthened with Fe-SMA. The conclusions of this study are as follows:
- (1)
- The ratios of the numerical results to experimental results in terms of the initial crack load, yield load, and ultimate load were an average of 1.04, 1.01, and 1.01, respectively, and the standard deviations were 0.09, 0.03, and 0.07, respectively. It can be concluded that the proposed FE models accurately predicted the RC beams strengthened with the Fe-SMA strips using the NSM method.
- (2)
- The initial crack load, yield load, and ultimate load of the RC beam strengthened with Fe-SMA strip using the NSM method, when the compressive strength of concrete increased from 21 MPa to 35 MPa, increased by 8.98%, 1.72%, and 10.06%, respectively. In addition, when the compressive strength of concrete increased from 21 MPa to 35 MPa, the displacement ductility index of the specimen was improved by 66.8%. Therefore, the compressive strength of concrete effects on improving the ductility of the RC beams than on enhancing the load-bearing capacity of the RC beams.
- (3)
- As the recovery stress of the used Fe-SMA strip increased, the initial crack load and initial stiffness increased. However, the increase in the recovery stress of the Fe-SMA strip improved about 0.03% of the ultimate load. Those results concluded that the recovery stress of the Fe-SMA strip improves the initial stiffness and serviceability of the RC beam.
- (4)
- As the amount of Fe-SMA strip increased, the initial crack load, yield load, and ultimate load were all increased by more than 80%. However, as the amount of Fe-SMA strip increased, the displacement ductility of the RC beams decreased.
- (5)
- As the amount of tensile reinforcement increased, the yield and ultimate load of the RC beam strengthened with the Fe-SMA strip were greatly improved, but its ductility greatly decreased. In addition, it was observed that the smaller the amount of tensile reinforcement, the higher the strengthening efficiency of the Fe-SMA strip.
- (6)
- In this FE model, the constitutive models of concrete, steel reinforcement, and Fe-SMA strip were idealized for the simulation, and interfaces between concrete and steel reinforcement and between concrete and Fe-SMA strip were assumed to be perfectly bonded. For future research, to accurately predict the flexural behavior of RC beams strengthened with Fe-SMA, more elaborated constitutive material models and bonding interface model between concrete and steel materials need to be employed.
Author Contributions
Conceptualization, Y.-M.Y. and K.-N.H.; Data curation, Y.-M.Y. and S.-W.J.; Investigation, Y.-M.Y. and S.L.; Supervision, K.-N.H.; Writing—original draft, Y.-M.Y. and K.-N.H.; Writing—review & editing, S.L. and S.-W.J. All authors have read and agreed to the published version of the manuscript.
Funding
This research was funded by the National Research Foundation of Korea (NRF) grant funded by the Korea government (MSIT) grant number 2020R1A2C1003197.
Acknowledgments
This work was supported by the National Research Foundation of Korea (NRF) grant funded by the Korea government (MSIT) (2020R1A2C1003197).
Conflicts of Interest
The authors declare no conflict of interest.
References
- Gribniak, V.; Ng, P.L.; Tamulenas, V.; Misiunatite, I.; Norkus, A.; Sapalas, A. Strengthening of fiber reinforced concrete elements: Synergy of the fibres and external sheet. Sustainability 2019, 11, 4456. [Google Scholar] [CrossRef] [Green Version]
- Lee, H.H.; Koo, E.S. A study on the strength and the deformation capacity of RC beams strengthened with aramid fiber sheet. J. Korea Concr. Inst. 1998, 10, 151–158. [Google Scholar]
- Triantafillou, T.C.; Papanicolau, C.G. Shear strengthening of reinforced concrete members with textile reinforced mortar(TRM). Mater. Struct. 2006, 39, 93103. [Google Scholar]
- Yang, D.S.; Park, S.K.; Lee, Y.H. Flexural behavior of RC beams strengthened with steel strand and carbond fiber sheet. J. Korea Concr. Inst. 2002, 14, 216–222. [Google Scholar]
- Hong, S.N. Evaluation of Bond and Flexural Behavior in RC Beams Strengthened with Prestressed NSM (Near Surface Mounted) CFRP Reinforcement. PhD. Thesis, Sungkyunkwan University, Seoul, Korea, 2010. [Google Scholar]
- Rosenboom, O.; Rizkalla, S. Behavior of prestressed concrete strengthened with various CFRP systems subjected to fatigue loading. J. Compos. Constr. 2006, 10, 492–502. [Google Scholar] [CrossRef] [Green Version]
- Jeong, Y.; Kim, W.S.; Gribniak, V.; Hui, D. Fatigue behavior of concrete beams prestressed with partially bonded CFRP bats subjected to cyclic loads. Materials 2019, 12, 3352. [Google Scholar] [CrossRef] [Green Version]
- Chung, W.Y.; Han, M.Y.; Kim, D.B. Reinforcement methods by external prestressing. J. Korea Concr. Inst. 2004, 16, 65–72. [Google Scholar]
- Rojob, H.; El-Hacha, R. Self-prestressing using iron-based shape memory alloy for flexural strengthening of reinforced concrete beams. Aci. Struct. J. 2017, 114, 523–532. [Google Scholar] [CrossRef]
- Lee, W.J.; Weber, B.; Leinenbach, C. Recovery stress formation in a restrained Fe–Mn–Si-based shape memory alloy used for prestressing or mechanical joining. Mater. Sci. Eng. A 2015, 95, 600–610. [Google Scholar] [CrossRef]
- Janke, L.; Czaderski, C.; Motavalli, M.; Ruth, J. Applications of shape memory alloys in civil engineering structures—Overview, limits and new ideas. Mater. Struct. 2005, 38, 578–592. [Google Scholar]
- Czaderski, C.; Shahverdi, M.; Bronnimann, R.; Leinenbach, C.; Motavalli, M. Feasibility of iron-based shape memory alloy strips for prestressed strengthening of concrete structures. Constr. Build. Mater. 2014, 56, 94–105. [Google Scholar] [CrossRef]
- Sato, A.; Chishima, E.; Soma, K.; Mori, T. Shape memory effect in γ⇄ ϵ transformation in Fe-30Mn-1Si alloy single crystals. Acta Metall. 1982, 30, 1177–1183. [Google Scholar] [CrossRef]
- Hong, K.N.; Yeon, Y.M.; Shim, W.B.; Kim, D.H. Recovery behavior of Fe-based shape memory alloys under different restraints. App. Sci. 2020, 10, 3441. [Google Scholar] [CrossRef]
- Joo, J.; Kang, M.; Shin, D.; Seo, E.; Kim, D.; Yeon, Y.; Hong, K.; Lee, W.; Lee, J. Corrosion resistance of shape recoverable Fe-17Mn-5Si-5Cr alloy in concrete structures. Materials 2020, 13, 5531. [Google Scholar] [CrossRef]
- Shahverdi, M.; Michels, J.; Czaderski, C.; Motavalli, M. Iron-based shape memory alloy strips for strengthening RC members: Material behavior and characterization. Constr. Build. Mater. 2018, 173, 586–599. [Google Scholar] [CrossRef]
- Michels, J.; Shahverdi, M.; Czaderski, C.; Schranz, B.; Motavalli, M. Iron based shape memory alloy strips, part 2: Flexural strengthening of RC beams. In Proceedings of the 4th International Conference on Smart Monitoring, Assessment and Rehabilitation of Civil Structures (SMAR 2017), Zurich, Switzerland, 13–15 September 2017. [Google Scholar]
- Hong, K.N.; Lee, S.G.; Yeon, Y.M.; Jung, K.S. Flexural response of reinforced concrete beams strengthened with near-surface-mounted Fe-based shape-memory alloy strips. IJCSM 2018, 12, 651–663. [Google Scholar] [CrossRef]
- Dolatabadi, N.; Shahverdi, M.; Ghassemieh, M.; Motavalli, M. RC structures strengthened by an iron-based shape memory alloy embedded in a shotcrete layer—Nonlinear finite element modeling. Materials 2020, 13, 5504. [Google Scholar] [CrossRef] [PubMed]
- Abouali, S.; Shahverdi, M.; Ghassemieh, M.; Motavalli, M. Nonlinear simulation of reinforced concrete beams retrofitted by near surface mounted iron-based shape memory alloy. Eng. Struct. 2019, 187, 133–148. [Google Scholar] [CrossRef]
- Ruiz-Pinilla, J.G.; Montoya-Coronado, L.A.; Ribas, C.; Cladera, A. Finite element modeling of RC beams externally strengthened with ironbased shape memory alloy (Fe-SMA) strips, including analytical stress-strain curves for Fe-SMA. Eng. Struct. 2020, 223, 111152. [Google Scholar] [CrossRef]
- Hong, K.N.; Lee, S.G.; Han, S.H.; Yeon, Y.M. Evaluation of Fe-Based Shape Memory Alloy (Fe-SMA) as Strengthening Material for Reinforced Concrete Structures. Appl. Sci. 2018, 8, 730. [Google Scholar] [CrossRef] [Green Version]
- Spacone, E.; Filippou, F.C.; Taucer, F.F. Fibre beam-column model for nonlinear analysis of R/C frames: Part I. Earthq. Eng. Struct. Dyn. 1996, 25, 711–725. [Google Scholar] [CrossRef]
- Feng, Y.; Kowalsky, M.J.; Nau, J.M. Fiber-based modeling of circular reinforced concrete bridge columns. J. Earthq. Eng. 2014, 18, 714–734. [Google Scholar] [CrossRef]
- Kashani, M.M.; Lowes, L.N.; Crewe, A.J.; Alexander, N.A. Nonlinear fibre element modelling of RC bridge piers considering inelastic buckling of reinforcement. Eng. Struct. 2016, 116, 163–177. [Google Scholar] [CrossRef] [Green Version]
- Su, J.; Dkakal, R.P.; Wang, J. Fiber-based damage analysis of reinforced concrete bridge piers. Soil Dyn. Earthq. Eng. 2017, 96, 13–34. [Google Scholar] [CrossRef]
- ACI. Building Code Requirements for Structural Concrete; ACI 318-08; ACI: Farmington Hills, MI, USA, 2008. [Google Scholar]
- Won, D.Y. Failure behaviour and shear strength equations of reinforced concrete deep beams. J. Korea Concr. Inst. 2013, 25, 683–691. [Google Scholar] [CrossRef] [Green Version]
- Shahverdi, M.; Czaderski, C.; Motavalli, M. Iron-based shape memory alloys for prestressed near-surface mounted strengthening of reinforced concrete beams. Constr. Build. Mater. 2016, 112, 28–38. [Google Scholar] [CrossRef]
Figure 1.
Details of experimental specimen: (a) SL-CTRL; (b) SL-30S-4; (c) SL-60S-4; (d) SL-90S-4 [18].
Figure 1.
Details of experimental specimen: (a) SL-CTRL; (b) SL-30S-4; (c) SL-60S-4; (d) SL-90S-4 [18].

Figure 2.
Stress-strain curve of Fe-SMA with recovery stress [22].
Figure 2.
Stress-strain curve of Fe-SMA with recovery stress [22].

Figure 3.
A half of the FE model for RC beams strengthened by Fe-SMA strips: (a) SL-CTRL; (b) SL-30S-4; (c) SL-60S-4; (d) SL-90S-4.
Figure 3.
A half of the FE model for RC beams strengthened by Fe-SMA strips: (a) SL-CTRL; (b) SL-30S-4; (c) SL-60S-4; (d) SL-90S-4.

Figure 4.
Constitutive model for concrete material.

Figure 5.
Constitutive model for steel rebar.

Figure 6.
Constitutive model for Fe-SMA with recovery stress.

Figure 7.
Comparison of load-displacement curves for SL-CTRL.

Figure 8.
Comparison of load-displacement curves for SL-30S-4.

Figure 9.
Comparison of load-displacement curves for SL-60S-4.

Figure 10.
Comparison of load- displacement curves for SL-90S-4.

Figure 11.
Comparison of load- displacement curves for B2 & B6: (a) B2; (b) B6.

Figure 12.
Comparison of experimental and numerical prediction results.

Figure 13.
Effect of concrete compressive strength (MPa): (a) Comparison of load- displacement curves; (b) Comparison of load stages for the number of Fe-SMA strips.
Figure 13.
Effect of concrete compressive strength (MPa): (a) Comparison of load- displacement curves; (b) Comparison of load stages for the number of Fe-SMA strips.

Figure 14.
Effect of prestressing level (MPa): (a) Comparison of load- displacement curves; (b) Comparison of load stages for the number of Fe-SMA strips.
Figure 14.
Effect of prestressing level (MPa): (a) Comparison of load- displacement curves; (b) Comparison of load stages for the number of Fe-SMA strips.

Figure 15.
Effect of the number of Fe-SMA strips: (a) Comparison of load- displacement curves; (b) Comparison of load stages for the number of Fe-SMA strips.
Figure 15.
Effect of the number of Fe-SMA strips: (a) Comparison of load- displacement curves; (b) Comparison of load stages for the number of Fe-SMA strips.

Figure 16.
Comparison of load-displacement curves for the different amount of steel reinforcement.


Table 1.
Comparison of experimental and numerical results.
| Specimen ID | Experiment | FEM | FEM/Experiment | ||||||
|---|---|---|---|---|---|---|---|---|---|
| Initial Crack Load (kN) | Yield Load (kN) | Ultimate Load (kN) | Initial Crack Load (kN) | Yield Load (kN) | Ultimate Load (kN) | Initial Crack Load | Yield Load | Ultimate Load | |
| SL-CTRL | 7.42 | 23.79 | 29.59 | 7.53 | 25.04 | 33.64 | 1.01 | 1.05 | 1.14 |
| SL-30S-4 | 9.42 | 28.48 | 36.78 | 10.68 | 29.38 | 39.81 | 1.13 | 1.03 | 1.08 |
| SL-60S-4 | 13.46 | 34.02 | 46.64 | 13.70 | 33.47 | 45.63 | 1.02 | 0.98 | 0.98 |
| SL-90S-4 | 14.04 | 41.42 | 55.41 | 16.68 | 40.90 | 53.20 | 1.19 | 0.99 | 0.96 |
Table 2.
Summary of numerical results for varying amounts of steel reinforcement.
| Amount of Steel Reinforcement (mm2) | Unstrengthened | Strengthened | ||||
|---|---|---|---|---|---|---|
| Initial Crack Load (kN) | Yield Load (kN) | Ultimate Load (kN) | Initial Crack Load (kN) | Yield Load (kN) | Ultimate Load (kN) | |
| 142.6 | 7.05 | 19.11 | 24.22 | 16.07 | 32.15 | 45.03 |
| 285.2 | 8.27 | 36.80 | 45.15 | 17.20 | 49.40 | 61.99 |
| 427.8 | 9.03 | 53.46 | 61.18 | 17.85 | 66.13 | 77.80 |
| 570.4 | 9.42 | 70.19 | 76.46 | 17.86 | 77.80 | 91.86 |
Publisher’s Note: MDPI stays neutral with regard to jurisdictional claims in published maps and institutional affiliations. |
© 2021 by the authors. Licensee MDPI, Basel, Switzerland. This article is an open access article distributed under the terms and conditions of the Creative Commons Attribution (CC BY) license (https://creativecommons.org/licenses/by/4.0/).
Share and Cite
MDPI and ACS Style
Yeon, Y.-M.; Hong, K.-N.; Lee, S.; Ji, S.-W. Numerical Study of RC Beams Strengthened with Fe-Based Shape Memory Alloy Strips Using the NSM Method. Appl. Sci. 2021, 11, 6809. https://doi.org/10.3390/app11156809
AMA Style
Yeon Y-M, Hong K-N, Lee S, Ji S-W. Numerical Study of RC Beams Strengthened with Fe-Based Shape Memory Alloy Strips Using the NSM Method. Applied Sciences. 2021; 11(15):6809. https://doi.org/10.3390/app11156809
Chicago/Turabian StyleYeon, Yeong-Mo, Ki-Nam Hong, Sugyu Lee, and Sang-Won Ji. 2021. "Numerical Study of RC Beams Strengthened with Fe-Based Shape Memory Alloy Strips Using the NSM Method" Applied Sciences 11, no. 15: 6809. https://doi.org/10.3390/app11156809
Note that from the first issue of 2016, this journal uses article numbers instead of page numbers. See further details here.