
BIM-Based Digital Twin and XR Devices to Improve Maintenance Procedures in Smart Buildings: A Literature Review


Abstract
:1. Introduction
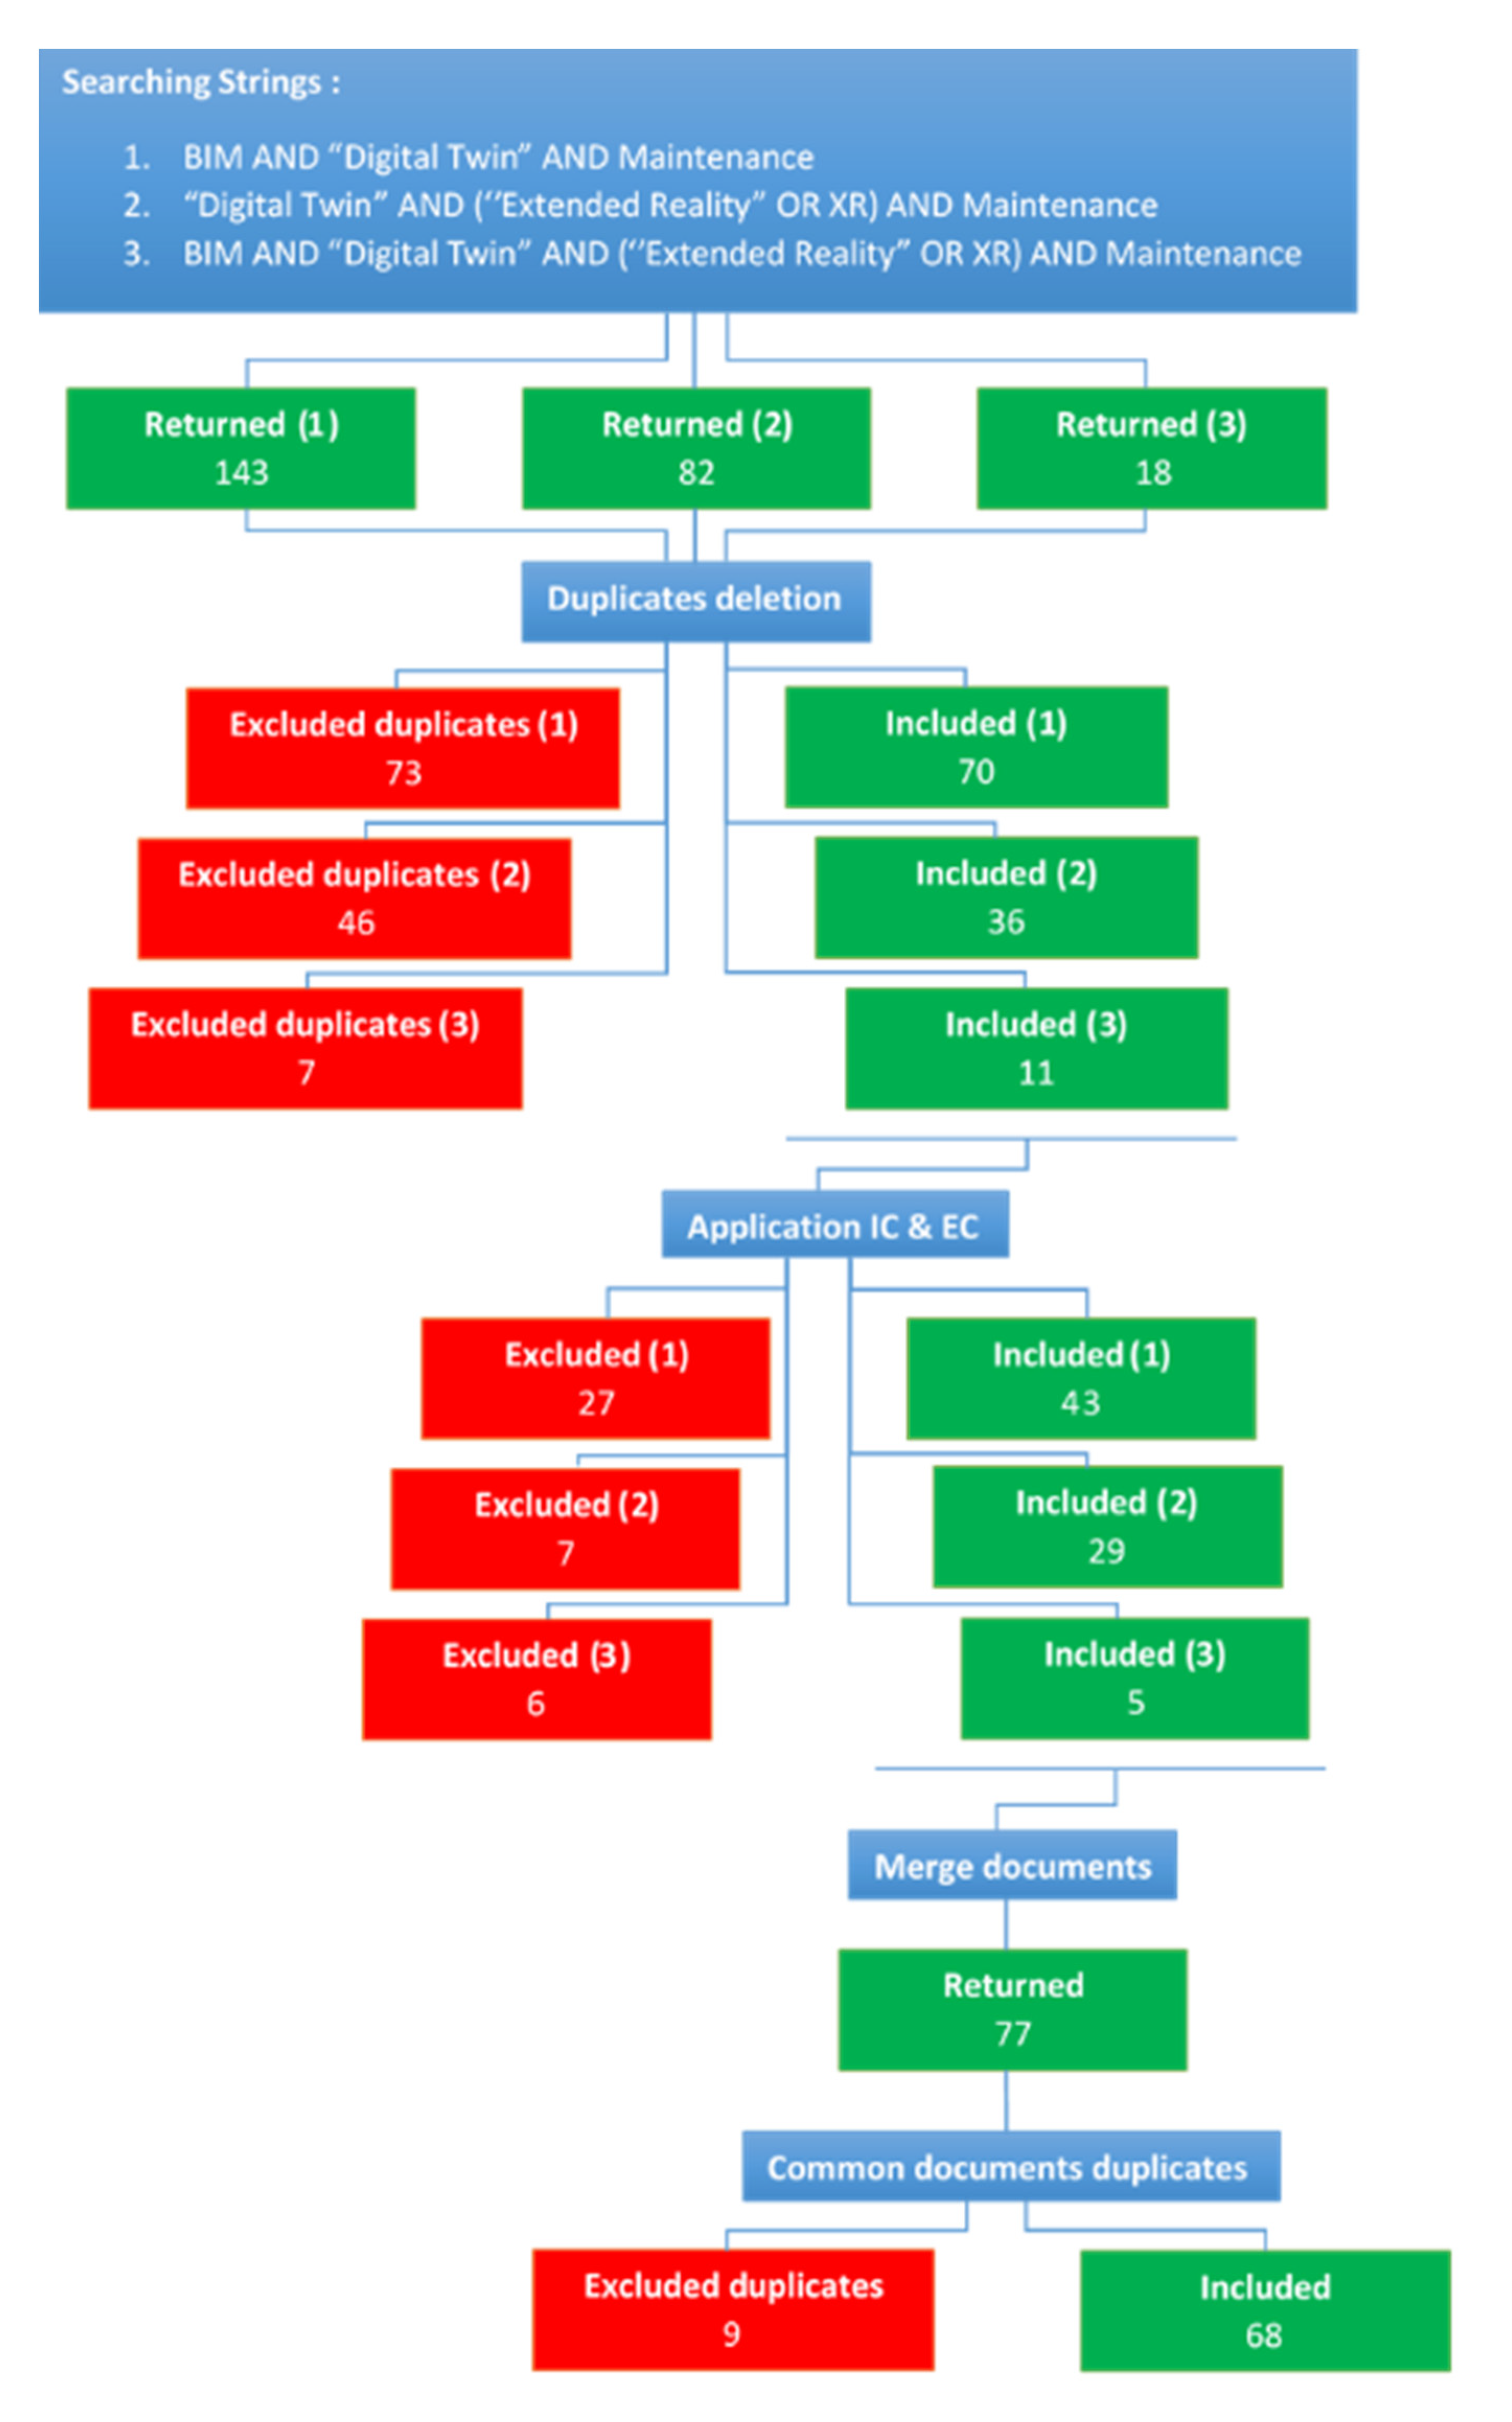
2. Methodology
- ScienceDirect (https://www.sciencedirect.com/) (accessed on 5 February 2021)
- Google Scholar (https://scholar.google.fr/) (accessed on 5 February 2021)
- WebOfKnowledge (https://www.webofknowledge.com/) (accessed on 5 February 2021)
- Scopus (https://www.scopus.com/) (accessed on 5 February 2021)
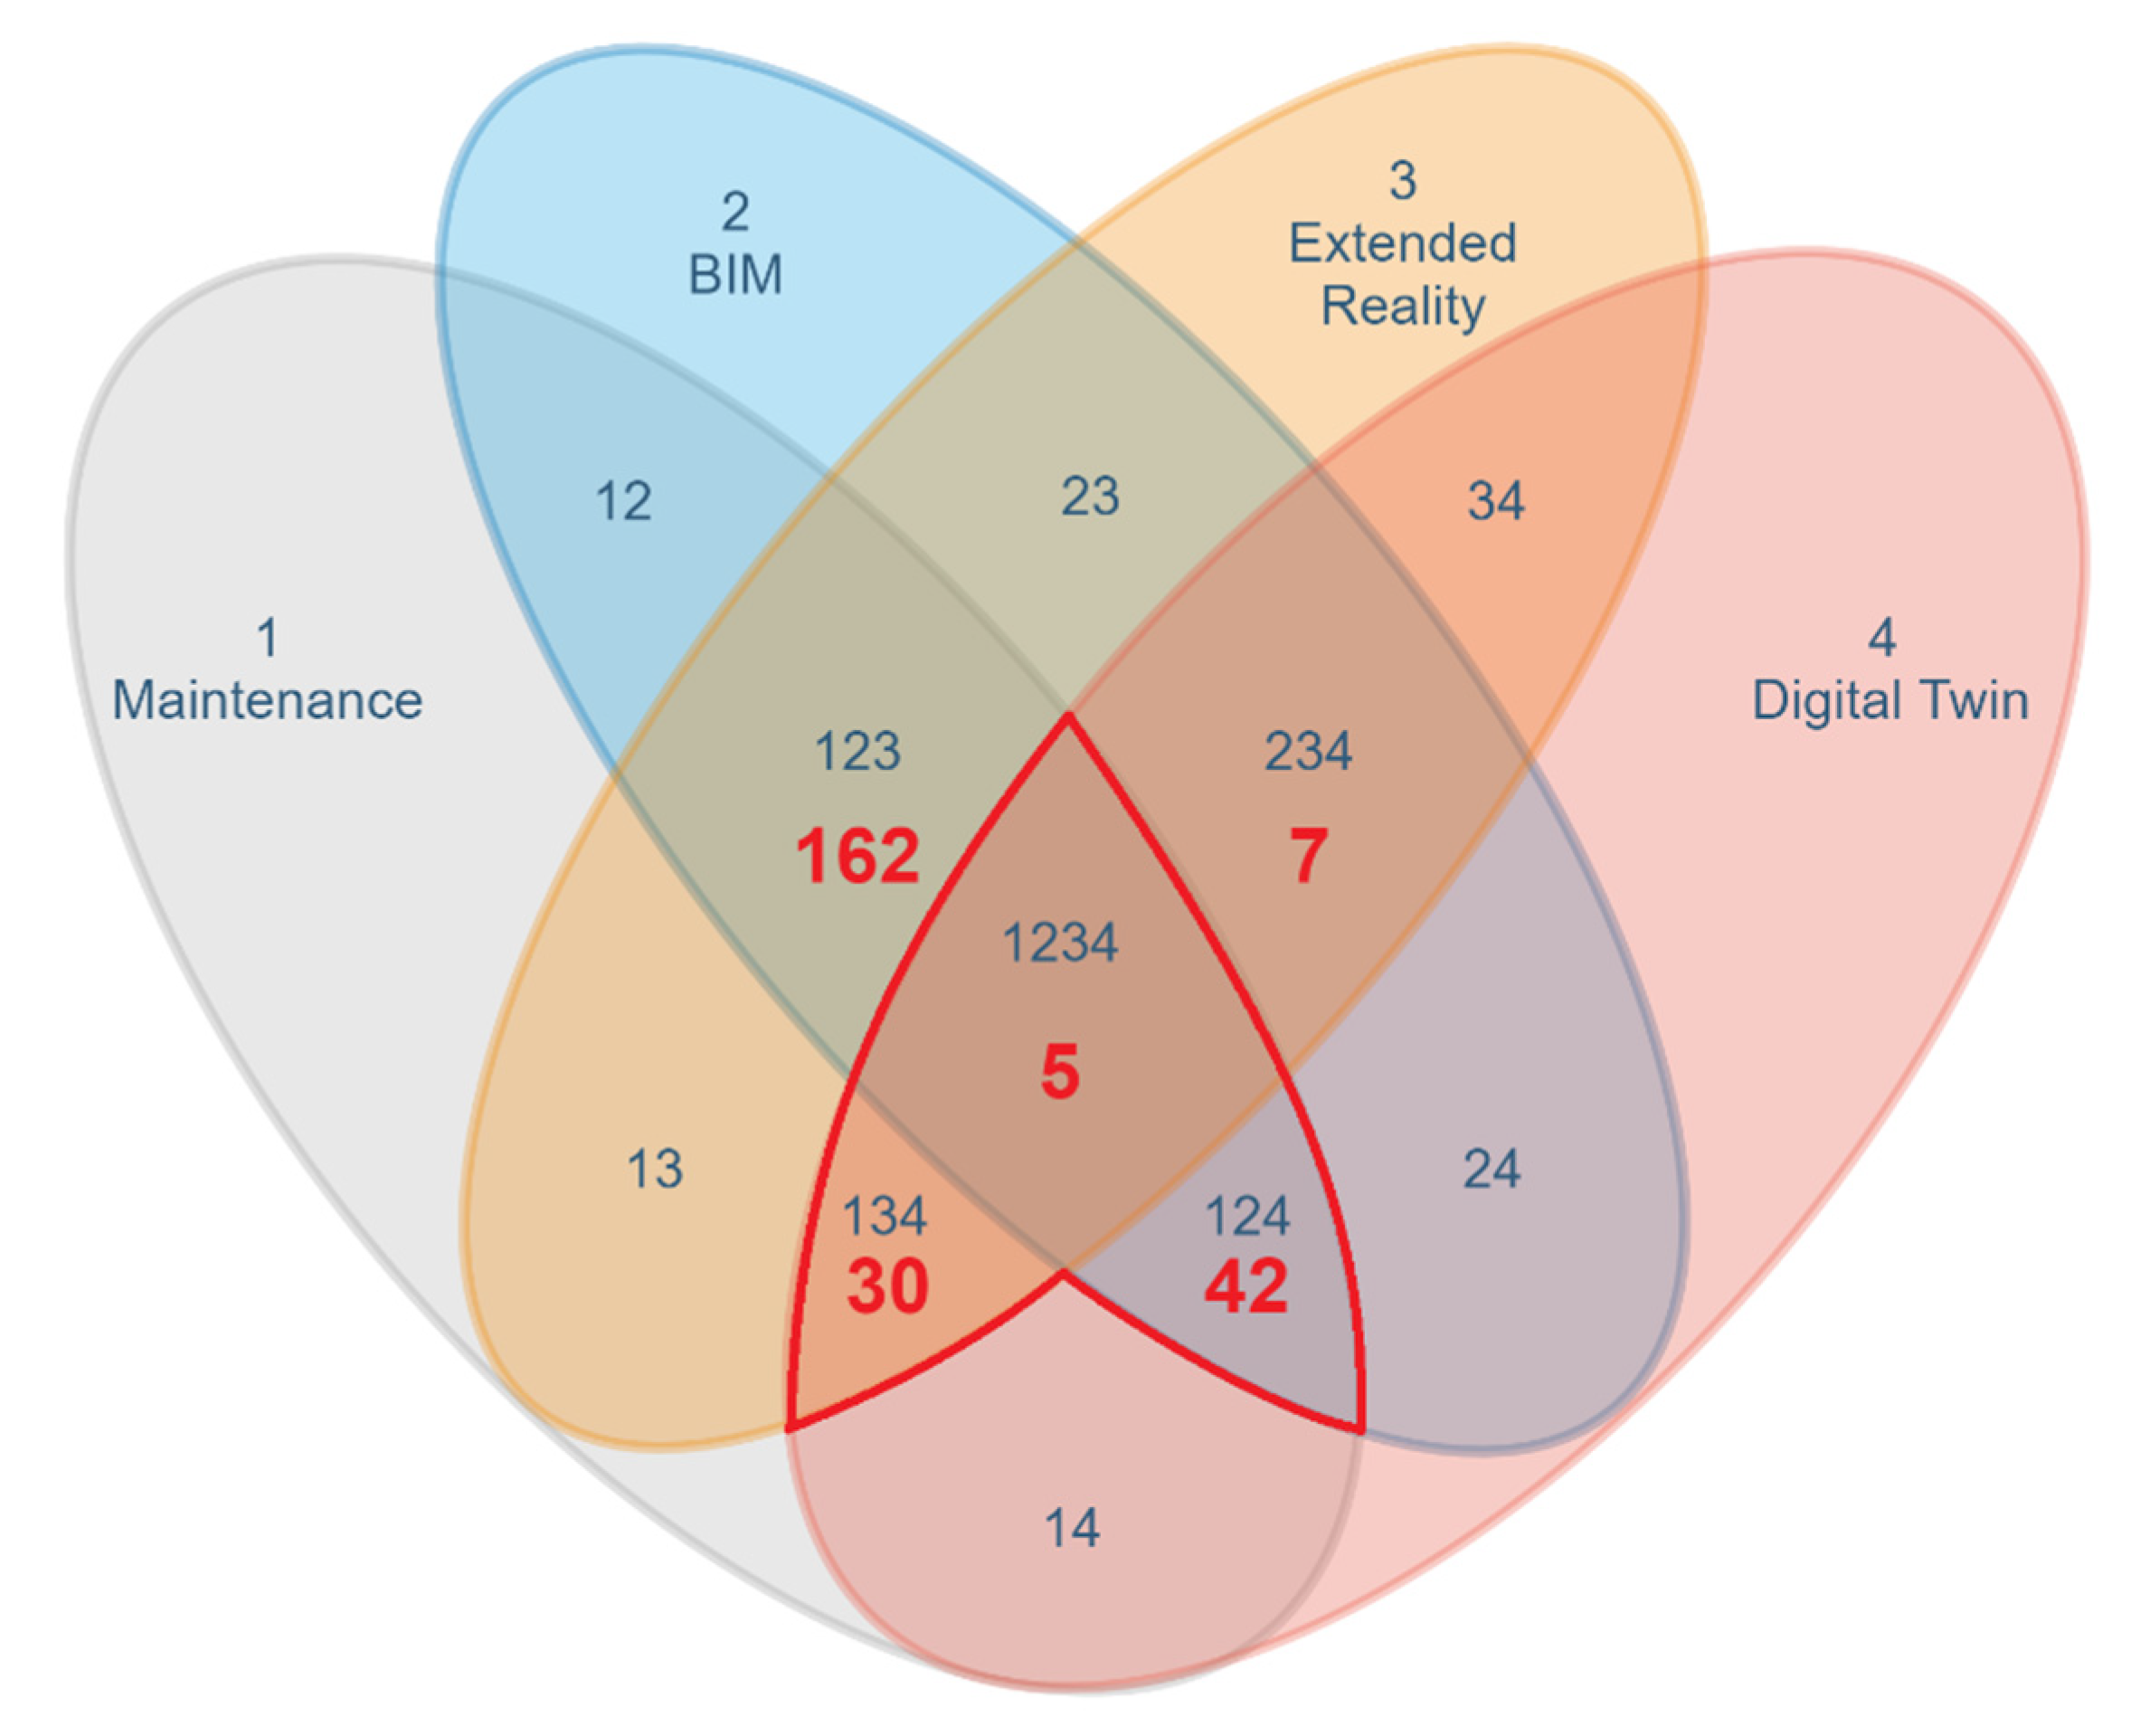
- “BIM” AND “Digital Twin” AND Maintenance (combination “124” in Figure 2). This combination represents 42 papers.
- “Digital Twin” AND (“Extended Reality” OR XR) AND Maintenance (combination “134” in Figure 2). This combination represents 30 papers.
- “BIM” AND “Digital Twin” AND (“Extended Reality” OR XR) AND Maintenance (combination “1234” in Figure 2). This combination represents 5 papers.
3. Benefits of a BIM-Based DT
3.1. Help to Create a DT
3.2. Usage in Lifecycle Management
3.3. Improvement for Managing Data
3.4. Existing Challenges
4. Maintenance Improvements Bring by DT into O&M Phase
4.1. Improvements for Monitoring
4.2. Improvements for Inspection
4.3. Improvements for Planning
4.4. Updating of the DT through Maintenance Operations
5. DT Improvements Brought about by eXtended Reality Technologies
5.1. Management and Data Visualisation
5.2. Main Devices Used for Visualisation
5.3. Interaction with the Model
5.4. Model Update and Collaboration
6. Maintenance Improvement Brought about by DT with XR Devices
6.1. Maintenance Improvements
6.2. Synchronous and Asynchronous Collaboration during Maintenance Procedures
7. Discussion and Challenges
7.1. General Observations
7.2. Future Usage: DT Interaction and Enhanced Maintenance Operations
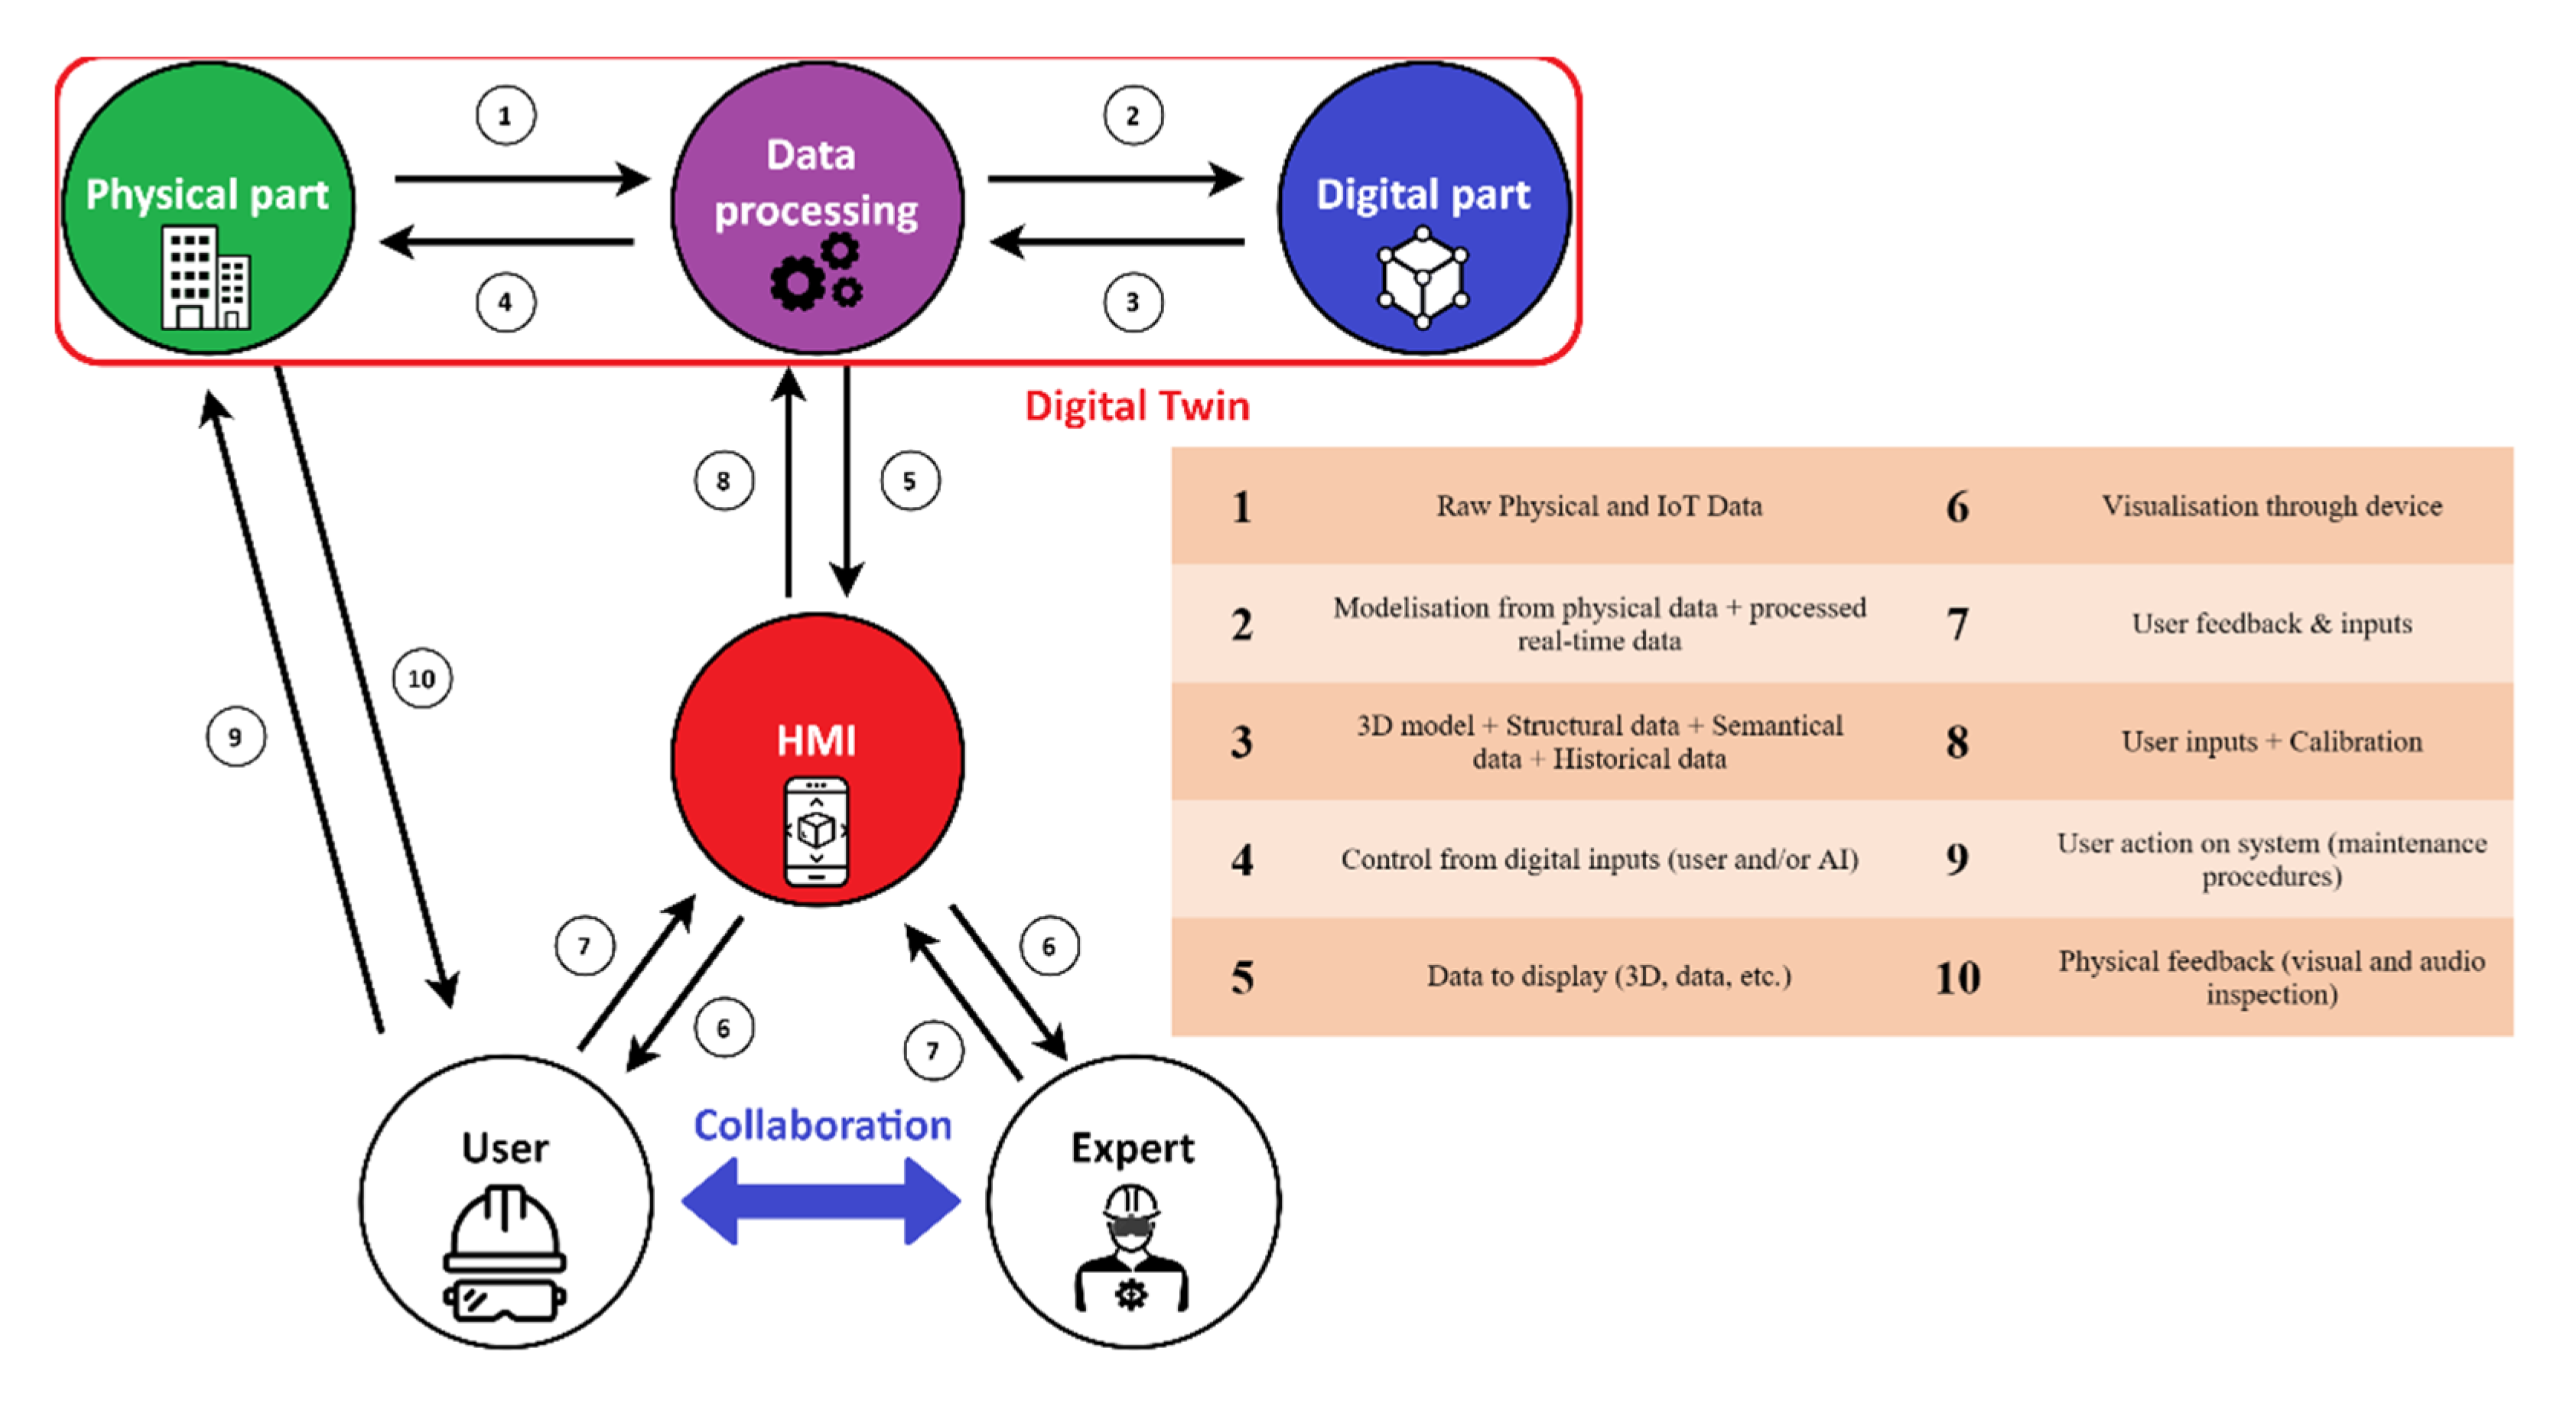
- The Digital Twin is represented by three parts:
- ○
- Physical part: This represents the physical asset of the DT (e.g., equipment, building or equipment). Data can be sent from and to this part thanks to the data processing part. However, if on-site, the User can also interact directly with it, especially during maintenance operations or visual inspections.
- ○
- Digital part: This is the digital representation of the asset, with the semantic and real-time data gathered with smart sensors and processed by the data processing part. The data can then be linked to the 3D representation of the asset and then displayed to the user once processed in the appropriate language.
- ○
- Data processing: This contains all the communication protocols allowing exchanges between physical and digital parts, and the algorithms that process the raw data before sending it to the digital part. It also contains the decision and prediction algorithms as well as the ones allowing the transmission of the user’s commands to the digital part to display information and to the physical part for the control of the real system.
- HMI: The human–machine interface (HMI) part represents the communication interface between the user/expert and the DT (e.g., Information displayed and equipment’s controls). This interface can either represent an XR device or a classic computer software allowing 3D information to be visualised thanks to the data processing part that translates the commands into the appropriate language. It can also represent VR training applications using BIM-based DT to train the user on realistic situations through an immersive environment and collected data from real-life situations [78,89].
- User/Expert: The on-site user can interact with the DT thanks to both the HMI part and direct interaction with the Physical part, especially during maintenance operations. On the other hand, the remote expert can interact with the DT only by using an HMI, as the distance prevents any direct interaction with the Physical part. The blue two-way arrow represents the collaboration that can happes between the on-site user and the remote expert when needed, either using the HMI part (such as a specific MR application) or with an external device (such as a phone call).
7.3. Challenges
7.3.1. Organisational, Human and Economic Changes
7.3.2. Data Management
7.3.3. Challenges in Using XR Devices
8. Conclusions and Perspectives
8.1. Conclusions
8.2. Perspectives
Author Contributions
Funding
Informed Consent Statement
Acknowledgments
Conflicts of Interest
References
- Wahlster, W.; Lukas, L.-D.; Kagermann, H. Industrie 4.0: Mit Dem Internet der Dinge auf dem Weg zur 4. Industriellen Revolution—Ingenieur.de. Available online: https://www.ingenieur.de/technik/fachbereiche/produktion/industrie-40-mit-internet-dinge-weg-4-industriellen-revolution/ (accessed on 13 May 2021).
- Oliveira, M.; Afonso, D. Industry Focused in Data Collection: How Industry 4.0 Is Handled by Big Data. ACM Int. Conf. Proc. Ser. 2019, 12–18. [Google Scholar] [CrossRef] [Green Version]
- McKinsey Digital America Full Report December 2015. Pdf. Available online: https://www.mckinsey.com/~/media/McKinsey/Industries/Technology%20Media%20and%20Telecommunications/High%20Tech/Our%20Insights/Digital%20America%20A%20tale%20of%20the%20haves%20and%20have%20mores/Digital%20America%20Full%20Report%20December%202015.pdf (accessed on 8 February 2021).
- Schober, K.-S.; Hoff, P. Digitization in the Construction Industry: Building Europe’s Road to “Construction 4.0.”; Roland Berg. GMBH: Munich, Germany, 2016; p. 16. [Google Scholar]
- Gartner Top 10 Strategic Technology Trends for 2020. Available online: //www.gartner.com/smarterwithgartner/gartner-top-10-strategic-technology-trends-for-2020/ (accessed on 21 October 2020).
- Gartner Top 10 Strategic Technology Trends for 2019. Available online: //www.gartner.com/smarterwithgartner/gartner-top-10-strategic-technology-trends-for-2019/ (accessed on 21 October 2020).
- Mourtzis, D.; Zogopoulos, V.; Vlachou, E. Augmented Reality Application to Support Remote Maintenance as a Service in the Robotics Industry. Procedia CIRP 2017, 63, 46–51. [Google Scholar] [CrossRef]
- Agnusdei, G.P.; Elia, V.; Gnoni, M.G. A Classification Proposal of Digital Twin Applications in the Safety Domain. Comput. Ind. Eng. 2021, 154, 107137. [Google Scholar] [CrossRef]
- Jasiulewicz-Kaczmarek, M.; Legutko, S.; Kluk, P. Maintenance 4.0 Technologies—new opportunities for sustainability driven maintenance. Manag. Prod. Eng. Rev. 2020, 11, 74–87. [Google Scholar] [CrossRef]
- McKinsey Unlocking the Potential of the Internet of Things | McKinsey. Available online: https://www.mckinsey.com/business-functions/mckinsey-digital/our-insights/the-internet-of-things-the-value-of-digitizing-the-physical-world (accessed on 8 February 2021).
- Eastman, C.; Fisher, D.; Lafue, G.; Lividini, J.; Stoker, D.; Yessios, C. An Outline of the Building Description System. University of Pittsburgh Carnegie-Mellon: Pittsburgh, PA, USA, Research Report No.50; 1974. [Google Scholar]
- Heaton, J.; Parlikad, A.K.; Schooling, J. Design and Development of BIM Models to Support Operations and Maintenance. Comput. Ind. 2019, 111, 172–186. [Google Scholar] [CrossRef]
- Motawa, I.; Almarshad, A. A Knowledge-Based BIM System for Building Maintenance. Autom. Constr. 2013, 29, 173–182. [Google Scholar] [CrossRef]
- Motawa, I.; Almarshad, A. Case-Based Reasoning and BIM Systems for Asset Management. Built Environ. Proj. Asset Manag. 2015, 5, 233–247. [Google Scholar] [CrossRef]
- Cheng, J.C.P.; Chen, W.; Chen, K.; Wang, Q. Data-Driven Predictive Maintenance Planning Framework for MEP Components Based on BIM and IoT Using Machine Learning Algorithms. Autom. Constr. 2020, 112, 103087. [Google Scholar] [CrossRef]
- Tchana, Y.; Ducellier, G.; Remy, S. Designing a Unique Digital Twin for Linear Infrastructures Lifecycle Management. Procedia CIRP 2019, 84, 545–549. [Google Scholar] [CrossRef]
- Grieves, M.; Vickers, J. Digital Twin: Mitigating Unpredictable, Undesirable Emergent Behavior in Complex Systems. In Transdisciplinary Perspectives on Complex Systems; Kahlen, F.-J., Flumerfelt, S., Alves, A., Eds.; Springer International Publishing: Cham, Switzerland, 2017; pp. 85–113. ISBN 978-3-319-38754-3. [Google Scholar]
- Glaessgen, E.H.; Stargel, D.S. The Digital Twin Paradigm for Future NASA and U.S. Air Force Vehicles. Struct. Dyn. 2012, 14. [Google Scholar] [CrossRef] [Green Version]
- Errandonea, I.; Beltrán, S.; Arrizabalaga, S. Digital Twin for Maintenance: A Literature Review. Comput. Ind. 2020, 123, 103316. [Google Scholar] [CrossRef]
- Singh, M.; Fuenmayor, E.; Hinchy, E.P.; Qiao, Y.; Murray, N.; Devine, D. Digital Twin: Origin to Future. ASI 2021, 4, 36. [Google Scholar] [CrossRef]
- Kritzinger, W.; Karner, M.; Traar, G.; Henjes, J.; Sihn, W. Digital Twin in Manufacturing: A Categorical Literature Review and Classification. IFAC-Pap. 2018, 51/11, 1016–1022. [Google Scholar] [CrossRef]
- Aheleroff, S.; Xu, X.; Zhong, R.Y.; Lu, Y. Digital Twin as a Service (DTaaS) in Industry 4.0: An Architecture Reference Model. Adv. Eng. Inform. 2021, 47, 101225. [Google Scholar] [CrossRef]
- Caudell, T.P.; Mizell, D.W. Augmented Reality: An Application of Heads-up Display Technology to Manual Manufacturing Processes. In Proceedings of the Twenty-Fifth Hawaii International Conference on System Sciences; IEEE: Kauai, HI, USA, 1992; Volume 2, pp. 659–669. [Google Scholar]
- Kishino, F.; Milgram, P. A Taxonomy of Mixed Reality Visual Displays. IEICE Trans. Inf. Syst. 1994, 77, 1321–1329. [Google Scholar]
- Prouzeau, A.; Wang, Y.; Ens, B.; Willett, W.; Dwyer, T. Corsican Twin: Authoring In Situ Augmented Reality Visualisations in Virtual Reality. In Proceedings of the International Conference on Advanced Visual Interfaces, Island of Ischia, Italy, 24 September 2020. [Google Scholar]
- Autiosalo, J.; Ala-Laurinaho, R.; Mattila, J.; Valtonen, M.; Peltoranta, V.; Tammi, K. Towards Integrated Digital Twins for Industrial Products: Case Study on an Overhead Crane. Appl. Sci. 2021, 11, 683. [Google Scholar] [CrossRef]
- Derigent, W.; Mcfarlane, D.; BRIL EL-HAOUZI, H. Intelligent Products through a SOHOMA Prism. In Proceedings of the 10th Workshop on Service Oriented, Holonic and Multi-Agent Manufacturing Systems for Industry of the Future, SOHOMA 2020, Paris, France, 21 November 2020. [Google Scholar]
- Bolshakov, N.; Badenko, V.; Yadykin, V.; Celani, A.; Fedotov, A. Digital Twins of Complex Technical Systems for Management of Built Environment. IOP Conf. Ser. Mater. Sci. Eng. 2020, 869. [Google Scholar] [CrossRef]
- Jakobi, M.; Kunath, L.; Witzig, A. BIM Use-Case: Model-Based Performance Optimization. In Proceedings of the Ises Eurosun 2018 Conference—12th International Conference on Solar Energy for Buildings and Industry, Rapperswil, Switzerland, 10–13 September 2018; pp. 1395–1402. [Google Scholar] [CrossRef] [Green Version]
- Yan, J.; Zlatanova, S.; Aleksandrov, M.; Diakite, A.A.; Pettit, C. Integration of 3D Objects and Terrain for 3D Modelling Supporting the Digital Twin. ISPRS Ann. Photogramm. Remote Sens. Spat. Inf. Sci. 2019, 4, 147–154. [Google Scholar] [CrossRef] [Green Version]
- Cureton, P.; Dunn, N. Digital Twins of Cities and Evasive Futures. In Shaping Smart for Better Cities; Academic Press: London, UK; San Diego, CA, USA; Cambridge, MA, USA; Oxford, UK, 2021; pp. 267–282. [Google Scholar] [CrossRef]
- Kaewunruen, S.; Lian, Q. Digital Twin Aided Sustainability-Based Lifecycle Management for Railway Turnout Systems. J. Clean. Prod. 2019, 228, 1537–1551. [Google Scholar] [CrossRef]
- Lu, Q.; Xie, X.; Heaton, J.; Parlikad, A.K.; Schooling, J. From BIM Towards Digital Twin: Strategy and Future Development for Smart Asset Management. Serv. Oriented Holonic Multi-Agent Manuf. Syst. Ind. Future 2020, 853, 392–404. [Google Scholar] [CrossRef]
- Moretti, N.; Xie, X.; Merino, J.; Brazauskas, J.; Parlikad, A.K. An OpenBIM Approach to IoT Integration with Incomplete As-Built Data. Appl. Sci. 2020, 10, 8287. [Google Scholar] [CrossRef]
- Peng, Y.; Zhang, M.; Yu, F.; Xu, J.; Gao, S. Digital Twin Hospital Buildings: An Exemplary Case Study through Continuous Lifecycle Integration. Adv. Civ. Eng. 2020, 2020, 8846667. [Google Scholar] [CrossRef]
- Prušková, K. BIM Technology and Changes in Traditional Design Process, Reliability of Data from Related Registers. IOP Conf. Ser. Mater. Sci. Eng. 2020, 960, 032049. [Google Scholar] [CrossRef]
- Kaewunruen, S.; Xu, N. Digital Twin for Sustainability Evaluation of Railway Station Buildings. Front. Built Environ. 2018, 4, 77. [Google Scholar] [CrossRef] [Green Version]
- Kaewunruen, S.; Peng, S.; Phil-Ebosie, O. Digital Twin Aided Sustainability and Vulnerability Audit for Subway Stations. Sustainability 2020, 12, 7873. [Google Scholar] [CrossRef]
- Angjeliu, G.; Coronelli, D.; Cardani, G. Development of the Simulation Model for Digital Twin Applications in Historical Masonry Buildings: The Integration between Numerical and Experimental Reality. Comput. Struct. 2020, 238. [Google Scholar] [CrossRef]
- Khajavi, S.H.; Motlagh, N.H.; Jaribion, A.; Werner, L.C.; Holmstroem, J. Digital Twin: Vision, Benefits, Boundaries, and Creation for Buildings. IEEE Access 2019, 7, 147406–147419. [Google Scholar] [CrossRef]
- Oliveira, P.P. Digital Twin Development for Airport Management. J. Airpt. Manag. 2020, 14, 246–259. [Google Scholar]
- Weichenberger, F.P.; Schwaiger, C.; Höfer-Öllinger, G. From Geological Mapping to Representation in BIM. Geomech. Tunn. 2020, 13, 199–211. [Google Scholar] [CrossRef]
- Xie, X.; Lu, Q.; Rodenas-Herraiz, D.; Parlikad, A.K.; Schooling, J.M. Visualised Inspection System for Monitoring Environmental Anomalies during Daily Operation and Maintenance. ECAM 2020, 27, 1835–1852. [Google Scholar] [CrossRef]
- Sofia, H.; Anas, E.; Faiz, O. Mobile Mapping, Machine Learning and Digital Twin for Road Infrastructure Monitoring and Maintenance: Case Study of Mohammed VI Bridge in Morocco. In Proceedings of the 2020 IEEE International Conference of Moroccan Geomatics, MORGEO, Casablance, Morocco, 11–13 May 2020. [Google Scholar] [CrossRef]
- Nahangi, M.; Kim, M. Use Cases for Subcontractors and Fabricators. Infrastruct. Comput. Vis. 2019, 315–361. [Google Scholar] [CrossRef]
- Grabe, M.; Ullerich, C.; Wenner, M.; Herbrand, M. SmartBridge Hamburg—Prototypische Pilotierung Eines Digitalen Zwillings. Bautechnik 2020, 97, 118–125. [Google Scholar] [CrossRef]
- Joy, D.; Smith, D. Processing Asset Data at the Intelligent Edge: Implementation of an Industrial IoT Architecture to Drive Business Value. Proc. SPE Annu. Tech. Conf. Exhib. 2019, 2019. [Google Scholar] [CrossRef]
- Lu, Q.; Xie, X.; Parlikad, A.K.; Schooling, J.M. Digital Twin-Enabled Anomaly Detection for Built Asset Monitoring in Operation and Maintenance. Autom. Constr. 2020, 118. [Google Scholar] [CrossRef]
- Lu, Q.; Parlikad, A.K.; Woodall, P.; Ranasinghe, G.D.; Heaton, J. Developing a Dynamic Digital Twin at a Building Level: Using Cambridge Campus as Case Study. In Proceedings of the International Conference on Smart Infrastructure and Construction 2019 (ICSIC); ICE Publishing: Cambridge, UK, 2019; pp. 67–75. [Google Scholar]
- Poli, T.; Mainini, A.G.; Speroni, A.; Blanco Cadena, J.D.; Moretti, N. The Effect of Real-Time Sensing of a Window on Energy Efficiency, Comfort, Health and User Behavior. In Digital Transformation of the Design, Construction and Management Processes of the Built Environment; Daniotti, B., Gianinetto, M., Della Torre, S., Eds.; Research for Development; Springer International Publishing: Cham, Switzerland, 2020; pp. 291–296. ISBN 978-3-030-33569-4. [Google Scholar]
- Varé, C.; Morilhat, P. Digital Twins, a New Step for Long Term Operation of Nuclear Power Plants. Lect. Notes Mech. Eng. 2020, 96–103. [Google Scholar] [CrossRef]
- Lu, Q.; Parlikad, A.K.; Woodall, P.; Ranasinghe, G.D.; Xie, X.; Liang, Z.; Konstantinou, E.; Heaton, J.; Schooling, J. Developing a Digital Twin at Building and City Levels: Case Study of West Cambridge Campus. J. Manag. Eng. 2020, 36. [Google Scholar] [CrossRef]
- Longo, F.; Nicoletti, L.; Padovano, A. Ubiquitous Knowledge Empowers the Smart Factory: The Impacts of a Service-Oriented Digital Twin on Enterprises’ Performance. Annu. Rev. Control 2019, 47, 221–236. [Google Scholar] [CrossRef]
- Antonino, M.; Nicola, M.; Claudio, D.M.; Luciano, B.; Fulvio, R.C. Office Building Occupancy Monitoring through Image Recognition Sensors. Int. J. Saf. Secur. Eng. 2019, 9, 371–380. [Google Scholar] [CrossRef] [Green Version]
- Williams, R.; Erkoyuncu, J.A.; Masood, T.; Vrabic, R. Augmented Reality Assisted Calibration of Digital Twins of Mobile Robots. IFAC-Pap. 2020, 53, 203–208. [Google Scholar] [CrossRef]
- Anderson, S.; Sigve, B. Advanced Offshore Digital Inspection Methods. In Proceedings of the International Petroleum Technology Conference, IPTC, Dhahran, Saudi Arabia, 13–15 January 2020. [Google Scholar] [CrossRef]
- Dang, N.S.; Shim, C.S. Bridge Assessment for PSC Girder Bridge Using Digital Twins Model. Lect. Notes Civ. Eng. 2020, 54, 1241–1246. [Google Scholar] [CrossRef]
- Shim, C.; Kang, H.; Dang, N. Digital Twin Models for Maintenance of Cable-Supported Bridges. In Proceedings of the International Conference on Smart Infrastructure and Construction 2019 (ICSIS), Churchill College, Cambridge, UK, 8–10 July 2019; 6. [Google Scholar] [CrossRef] [Green Version]
- Shim, C.-S.; Dang, N.-S.; Lon, S.; Jeon, C.-H. Development of a Bridge Maintenance System for Prestressed Concrete Bridges Using 3D Digital Twin Model. Struct. Infrastruct. Eng. 2019, 15, 1319–1332. [Google Scholar] [CrossRef]
- Grosse, C.U. Monitoring and Inspection Techniques Supporting a Digital Twin Concept in Civil Engineering. In Proceedings of the 5th International Conference on Sustainable Construction Materials and Technologies (SCMT5), London, UK, 14–17 July 2019; p. 16. [Google Scholar]
- Tahmasebinia, F.; Fogerty, D.; Wu, L.O.; Li, Z.; Sepasgozar, S.M.E.; Zhang, K.; Sepasgozar, S.; Marroquin, F.A. Numerical Analysis of the Creep and Shrinkage Experienced in the Sydney Opera House and the Rise of Digital Twin as Future Monitoring Technology. Buildings 2019, 9, 137. [Google Scholar] [CrossRef] [Green Version]
- Jafari, M.A.; Zaidan, E.; Ghofrani, A.; Mahani, K.; Farzan, F. Improving Building Energy Footprint and Asset Performance Using Digital Twin Technology. IFAC-Pap. 2020, 53, 386–391. [Google Scholar] [CrossRef]
- Yu, G.; Zhang, S.; Hu, M.; Wang, Y.K. Prediction of Highway Tunnel Pavement Performance Based on Digital Twin and Multiple Time Series Stacking. Adv. Civ. Eng. 2020, 2020, 8824135. [Google Scholar] [CrossRef]
- Bevilacqua, M.; Bottani, E.; Ciarapica, F.E.; Costantino, F.; Donato, L.D.; Ferraro, A.; Mazzuto, G.; Monteriu, A.; Nardini, G.; Ortenzi, M.; et al. Digital Twin Reference Model Development to Prevent Operators’ Risk in Process Plants. Sustainability 2020, 12, 1088. [Google Scholar] [CrossRef] [Green Version]
- Carvalho, W.O. BIM and AM to Manage Critical and Relevant Water and Wastewater Utilities Assets. Lect. Notes Civ. Eng. 2021, 98, 697–720. [Google Scholar] [CrossRef]
- Kunnen, S.; Adamenko, D.; Pluhnau, R.; Loibl, A.; Nagarajah, A. System-Based Concept for a Mixed Reality Supported Maintenance Phase of an Industrial Plant. Procedia CIRP 2020, 91, 15–20. [Google Scholar] [CrossRef]
- Zhao, X.; Sun, Y. Augmented Reality Assembly Guidance Method Based on Situation Awareness. In Proceedings of the 2020 the 10th International Workshop on Computer Science and Engineering, WCSE 2020, Shanghai, China, 19–21 June 2020; pp. 165–173. [Google Scholar]
- Khalil, M.; Bergs, C.; Papadopoulos, T.; Wuchner, R.; Bletzinger, K.-U.; Heizmann, M. IIoT-Based Fatigue Life Indication Using Augmented Reality. IEEE Int. Conf. Ind. Inform. 2019, 2019, 746–751. [Google Scholar] [CrossRef]
- Rabah, S.; Assila, A.; Khouri, E.; Maier, F.; Ababsa, F.; Bourny, V.; Maier, P.; Mérienne, F. Towards Improving the Future of Manufacturing through Digital Twin and Augmented Reality Technologies. Procedia Manuf. 2018, 17, 460–467. [Google Scholar] [CrossRef]
- Damgrave, R.G.J.; Lutters, E. Smart Industry Testbed. Procedia CIRP 2019, 84, 387–392. [Google Scholar] [CrossRef]
- Corneli, A.; Naticchia, B.; Cabonari, A.; Bosché, F. Augmented Reality and Deep Learning towards the Management of Secondary Building Assets. In Proceedings of the 36th International Symposium on Automation and Robotics in Construction, ISARC 2019, Banff, AB, Canada, 21–24 May 2019; pp. 332–339. [Google Scholar]
- Utzig, S.; Kaps, R.; Azeem, S.M.; Gerndt, A. Augmented Reality for Remote Collaboration in Aircraft Maintenance Tasks. In Proceedings of the 2019 IEEE Aerospace Conference; IEEE: Big Sky, MT, USA, 2019; pp. 1–10. [Google Scholar]
- van Lopik, K.; Sinclair, M.; Sharpe, R.; Conway, P. Developing Augmented Reality Capabilities for Industry 4.0 Small Enterprises: Lessons Learnt from a Content Authoring Case Study. Comput. Ind. 2020. [Google Scholar] [CrossRef]
- Pileggi, P.; Lazovik, E.; Broekhuijsen, J.; Borth, M.; Verriet, J. Lifecycle Governance for Effective Digital Twins: A Joint Systems Engineering and IT Perspective. 2020 IEEE International Systems Conference (SysCon), Montreal, QC, Canada 24 August to 20 September 2020, 8. [Google Scholar] [CrossRef]
- Ke, S.; Xiang, F.; Zhang, Z.; Zuo, Y. A Enhanced Interaction Framework Based on VR, AR and MR in Digital Twin. Procedia CIRP 2019, 83, 753–758. [Google Scholar] [CrossRef]
- Prajapat, N.; Tiwari, A.; Tiwari, D.; Turner, C.; Hutabarat, W. A Framework for Next Generation Interactive and Immersive DES Models. In Proceedings of the 2019 IEEE 17th International Conference on Industrial Informatics (INDIN), Helsinki, Finland, 22–25 July 2019; pp. 671–676. [Google Scholar] [CrossRef]
- Dezen-Kempter, E.; Mezencio, D.L.; Miranda, E.D.M.; Pico de Sa, D.; Dias, U. Towards a Digital Twin for Heritage Interpretation. In Proceedings of the RE: Anthropocene, Design in the Age of Humans—Proceedings of the 25th International Conference on Computer-Aided Architectural Design Research in Asia, CAADRIA 2020, Bangkok, Thailand, 5–6 August 2020; Volume 2, pp. 183–191. [Google Scholar]
- Novack, J. Digital Twins and Industry 4.0: Videogamers Will Staff and Manage Industrial Projects in the near Future. In Proceedings of the Society of Petroleum Engineers—Abu Dhabi International Petroleum Exhibition and Conference 2019, ADIP, Abu Dhabi, United Arab Emirates, 11–14 November 2019. [Google Scholar] [CrossRef]
- Omer, M.; Margetts, L.; Mosleh, M.H.; Hewitt, S.; Parwaiz, M. Use of Gaming Technology to Bring Bridge Inspection to the Office. Struct. Infrastruct. Eng. 2019, 15, 1292–1307. [Google Scholar] [CrossRef] [Green Version]
- Zhu, Z.; Liu, C.; Xu, X. Visualisation of the Digital Twin Data in Manufacturing by Using Augmented Reality. Procedia CIRP 2019, 81, 898–903. [Google Scholar] [CrossRef]
- Stojanovic, V.; Trapp, M.; Richter, R.; Hagedorn, B.; Döllner, J. Towards the Generation of Digital Twins for Facility Management Based on 3D Point Clouds. In Proceedings of the 34th Annual ARCOM Conference, ARCOM, Belfast, UK, 3–5 September 2018; pp. 270–279. [Google Scholar]
- Microsoft HoloLens | Mixed Reality Technology for Business. Available online: https://www.microsoft.com/en-us/hololens (accessed on 22 April 2021).
- VIVE Pro Eye Office | VIVE Business United States. Available online: https://business.vive.com/us/product/vive-pro-eye-office/ (accessed on 28 June 2021).
- Joao, D.V.; Lodetti, P.Z.; Martins, M.A.I.; Almeida, J.F.B. Virtual and Augmented Reality Applied in Power Electric Utilities for Human Interface Improvement-A Study Case for Best Practices. In Proceedings of the 2020 IEEE Technology and Engineering Management Conference, TEMSCON, Novi, MI, USA, 3–6 June 2020. [Google Scholar] [CrossRef]
- GPS.Gov: GPS Accuracy. Available online: https://www.gps.gov/systems/gps/performance/accuracy/ (accessed on 3 June 2021).
- Cohen, Y.; Faccio, M.; Pilati, F.; Yao, X. Design and Management of Digital Manufacturing and Assembly Systems in the Industry 4.0 Era. Int. J. Adv. Manuf. Technol. 2019, 105, 3565–3577. [Google Scholar] [CrossRef] [Green Version]
- Iung, B. De La Maintenance Prédictive à La Maintenance Prescriptive: Une Évolution Nécessaire Pour l’industrie Du Futur. In Proceedings of the Conference on Complexity Analysis of Industrial Systems and Advanced Modeling, CAISAM 2019, Ben Guerir, Morocco, 22–27 April 2019. [Google Scholar]
- Gartner Top 10 Strategic Technology Trends for 2018. Available online: //www.gartner.com/smarterwithgartner/gartner-top-10-strategic-technology-trends-for-2018/ (accessed on 21 October 2020).
- Agnusdei, G.P.; Elia, V.; Gnoni, M.G. Is Digital Twin Technology Supporting Safety Management? A Bibliometric and Systematic Review. Appl. Sci. 2021, 11, 2767. [Google Scholar] [CrossRef]
- Love, P.E.D.; Matthews, J. The ‘How’ of Benefits Management for Digital Technology: From Engineering to Asset Management. Autom. Constr. 2019, 107, 102930. [Google Scholar] [CrossRef]
- Rødseth, H.; Eleftheriadis, R.; Lodgaard, E.; Fordal, J.M. Operator 4.0—Emerging Job Categories in Manufacturing. Lect. Notes Electr. Eng. 2019, 484, 114–121. [Google Scholar] [CrossRef]
- Venables, M. Future Maintenance: Transitioning from Digitalisation to Industry 4.0. Plant Eng. 2017, 2017, 10–12. [Google Scholar]
- Nyvlt, V. BIM within Current Building Facilities and Infrastructure. IOP Conf. Ser. Mater. Sci. Eng. 2020, 972. [Google Scholar] [CrossRef]
- Longo, F.; Padovano, A.; Umbrello, S. Value-Oriented and Ethical Technology Engineering in Industry 5.0: A Human-Centric Perspective for the Design of the Factory of the Future. Appl. Sci. 2020, 10, 4182. [Google Scholar] [CrossRef]
- Havard, V.; Jeanne, B.; Savatier, X.; Baudry, D. Inoovas—Industrial Ontology for Operation in Virtual and Augmented Scene: The Architecture. In Proceedings of the 2017 4th International Conference on Control, Decision and Information Technologies (CoDIT), Barcelona, Spain, 5–7 April 2017; pp. 300–305. [Google Scholar]
- Bodkhe, U.; Tanwar, S.; Parekh, K.; Khanpara, P.; Tyagi, S.; Kumar, N.; Alazab, M. Blockchain for Industry 4.0: A Comprehensive Review. IEEE Access 2020, 8, 79764–79800. [Google Scholar] [CrossRef]
- Gartner Top Strategic Technology Trends for 2021. Available online: //www.gartner.com/smarterwithgartner/gartner-top-strategic-technology-trends-for-2021/ (accessed on 21 October 2020).


| Inclusion criteria (IC) | Main subject is the use of DT (concept or use case) | Exclusion criteria (EC) | Older than 2005 |
| Not in informatics or engineering field | |||
| Use of BIM and/or XR technologies | Not related or applicable to building maintenance |
| Research Topics | Benefits | Reference |
|---|---|---|
| Usage of a BIM-based DT | Early optimisation of the building | [28,29,30] |
| Lifecycle management of the building | [16,31,32,33,34,35,36] | |
| Condition assessment | [37,38,39] | |
| Optimisation of existing operations | [39,40,41,42] | |
| Creation of a DT using a BIM | DT as an evolved BIM with real-time data | [29,32,35,37,38,39,40,42] |
| BIM provide geometrical data/3D model | [16,29,30,31,33,35,37,38,39,40,41,42] | |
| BIM contains static data | [28,35,40,42] | |
| Benefits of a BIM-based DT for lifecycle management | BIM mainly used in early stages of the lifecycle | [16,28,40] |
| Simulations/Predictions of building lifecycle | [28,29,31,41] | |
| Improve decision-making | [28,29,31,32,33,34,35,37,38,39,40,41,42] | |
| Improve operations | [32,33,36,40] | |
| Improvements for data management | Centralised source/Data sharing | [16,29,32,33,38,40,41] |
| Digital continuity/Interoperability | [16,28,29,32,34,35,36,37,40,41] | |
| Data linked to models | [32,33,34,37,41,43] |
| Challenge | Reference |
|---|---|
| Lack of standards | [16,28,31,33,35,36] |
| Lack of up-to-date data | [28,33] |
| Privacy issues | [29,31,35] |
| Lack of organisational strategy | [29,35,36,41] |
| Maintenance Step | Benefits | Reference |
|---|---|---|
| Monitoring | Better data access | [16,22,26,34,35,39,43,46,47,48,49,50,51,52,53] |
| Avoiding data silos | [22,33,34,35,51] | |
| Optimise consumption | [29,37,38,40,54,55] | |
| Collaboration | [26,34,44,51] | |
| Inspection | Damage assessment | [39,42,47,56,57,58,59] |
| Deviation assessment | [42,45,60] | |
| Planning | Early warning, prediction | [15,22,39,44,46,48,53,57,58,60,61,62,63,64] |
| Occupancy | [35,54] | |
| Collaboration | [51,65] | |
| Cost optimisation | [37,38,54,65] |
| Maintenance Type | Reference | |
|---|---|---|
| Proactive | Predictive | [15,22,37,40,43,44,46,47,49,52,55,63,64,66,67,68,69] |
| Preventive | [34,39,57,58,59,60,62,64,65,70] | |
| Reactive | [25,55,71,72,73] | |
| Functionalities and Technologies | Features | Reference |
|---|---|---|
| Management and data visualisation | Real-time and historical display | [26,43,53,55,64,67,68,70,72,73,77,78] |
| Situated display | [25,72] | |
| Asset highlight | [25,43,68,72,77] | |
| 3D visualisation | [43,53,67,68,69,70,72,75,76,79] | |
| Interaction with the model | Gesture and voice recognition | [25,26,53,73,80] |
| Standard inputs | [25,68,69,70,76,77,78] | |
| Position tracking | [25,75,76] | |
| Head/gaze tracking | [25,66,71,72,73] | |
| MR control | [26,55,80] | |
| Main devices used for visualisation | See-through HMD/ Smart-glasses (e.g., Hololens) (used for AR and MR) | [25,26,43,47,66,67,70,71,72,73,75,78,80] |
| Occluded HMD (e.g., HTC Vive) (used for VR) | [25,47,75,78,79] | |
| HHD (e.g., Tablet; Smartphone) (used for AR) | [22,47,53,55,68,69,75,77,81] | |
| Model update and collaboration | Update digital twin | [66,71,81] |
| Collaboration | [22,25,65,78] |
| Supported Activity | Features | Reference |
|---|---|---|
| Maintenance | Visual annotation | [25,43,47,55,64,67,68,69,72,73] |
| Track location | [47,55,72] | |
| Ease inspection | [22,43,53,55,66,72,79] | |
| Asset identification | [43,53,68,71] | |
| Collaboration during maintenance procedures | Shared reports | [22,72] |
| Connected systems | [43,64,70] | |
| Distant expert | [43,69,72] | |
| Telepresence | [70,72,78] | |
| Visualisation | Real-time, historical and documentation data | [22,25,43,47,53,55,68,70,71,72] |
| 3D model | [43,47,67,69,70,71,72,79] | |
| Filtered data | [43,47,68,72] |
| DT Type | Years | Total | ||||
|---|---|---|---|---|---|---|
| 2017 | 2018 | 2019 | 2020 | 2021 | ||
| Digital Model | 0.00% | 1.47% | 8.82% | 5.88% | 1.47% | 17.65% |
| Digital Shadow | 0.00% | 2.94% | 4.41% | 2.94% | 0.00% | 10.29% |
| Digital Twin | 0.00% | 1.47% | 20.59% | 27.94% | 4.41% | 54.41% |
| Undefined | 1.47% | 0.00% | 7.35% | 7.35% | 1.47% | 17.65% |
| Total | 1.47% | 5.88% | 41.18% | 44.12% | 7.35% | 100.00% |
| Category | Challenges | Reference |
|---|---|---|
| Organisational, human and economic changes | Implementation | [29,41,90] |
| Data selection | [25,29,33,35,36,47,91] | |
| Information on financial risks | [35,90] | |
| New technical skills | [78,86,91] | |
| Define roles | [36,47,92] | |
| Collaboration management | [16,22,25,29,32,33,38,40,41,65,69,70,72,78,79] | |
| Data management | Lack of data for DT creation and update | [21,32,37,38,49,61,74] |
| Lack of data standards | [28,33,34,35] | |
| Data ownership | [26,31,37,51,54,92] | |
| Data security | [31,35,46,54,64,72] | |
| Challenges in using XR devices | Ergonomic and physiological issues | [25,84] |
| Calibration | [25,26,53,66,71,72,77,80,81] |
Publisher’s Note: MDPI stays neutral with regard to jurisdictional claims in published maps and institutional affiliations. |
© 2021 by the authors. Licensee MDPI, Basel, Switzerland. This article is an open access article distributed under the terms and conditions of the Creative Commons Attribution (CC BY) license (https://creativecommons.org/licenses/by/4.0/).
Share and Cite
Coupry, C.; Noblecourt, S.; Richard, P.; Baudry, D.; Bigaud, D. BIM-Based Digital Twin and XR Devices to Improve Maintenance Procedures in Smart Buildings: A Literature Review. Appl. Sci. 2021, 11, 6810. https://doi.org/10.3390/app11156810
Coupry C, Noblecourt S, Richard P, Baudry D, Bigaud D. BIM-Based Digital Twin and XR Devices to Improve Maintenance Procedures in Smart Buildings: A Literature Review. Applied Sciences. 2021; 11(15):6810. https://doi.org/10.3390/app11156810
Chicago/Turabian StyleCoupry, Corentin, Sylvain Noblecourt, Paul Richard, David Baudry, and David Bigaud. 2021. "BIM-Based Digital Twin and XR Devices to Improve Maintenance Procedures in Smart Buildings: A Literature Review" Applied Sciences 11, no. 15: 6810. https://doi.org/10.3390/app11156810