
Specifics of MWD Data Collection and Verification during Formation of Training Datasets
by
 ,
,
Valentin Isheyskiy
1,* ,
,
Evgeny Martinyskin
2,
Sergey Smirnov
3,
Anton Vasilyev
4,
Kirill Knyazev
5 and
Timur Fatyanov
5 1
Blasting Design Department, Faculty of Mining Engineering, Saint Petersburg Mining University, 199106 Saint Petersburg, Russia
2
Blasting Operations Management Department, OOO “Altayvzryvservis”, 650000 Kemerovo, Russia
3
Department of Technical Management, OOO “Resurs”, 654004 Novokuznetsk, Russia
4
The Laboratory of Blasting Technology Problems, Faculty of Mining Engineering, Saint Petersburg Mining University, 199106 Saint Petersburg, Russia
5
Blasting Technical Department, OOO “Altayvzryvservis”, 650000 Kemerovo, Russia
*
Author to whom correspondence should be addressed.
Minerals 2021, 11(8), 798; https://doi.org/10.3390/min11080798
Submission received: 31 May 2021
/
Revised: 19 July 2021
/
Accepted: 20 July 2021
/
Published: 22 July 2021
(This article belongs to the Section Mineral Exploration Methods and Applications)
Abstract
:This paper presents a structured analysis in the area of measurement while drilling (MWD) data processing and verification methods, as well as describes the main nuances and certain specifics of “clean” data selection in order to build a “parent” training database for subsequent use in machine learning algorithms. The main purpose of the authors is to create a trainable machine learning algorithm, which, based on the available “clean” input data associated with specific conditions, could correlate, process and select parameters obtained from the drilling rig and use them for further estimation of various rock characteristics, prediction of optimal drilling and blasting parameters, and blasting results. The paper is a continuation of a series of publications devoted to the prospects of using MWD technology for the quality management of drilling and blasting operations at mining enterprises.
1. Introduction
All of the activities related to investigation, utilization and assessment of data on geological objects are characterized by a high degree of uncertainty regarding the properties, quality and structure of the rock mass [1].
Many researchers use this approach for various aspects of the mining industry: choice of mining equipment [2], assessment of geomechanical and geological properties of the rock mass [3,4,5], rock classification, determination of drilling and blasting parameters [6,7] and safety estimation of blasting operations [8,9], among others. A detailed review is presented in the paper [10].
The prediction of the particle size distribution of the muck pile based on the measurement while drilling (MWD) data is a relevant production task. Modern methods for predicting particle size distribution, based on theoretical and empirical models [7,11] and even machine learning methods [12,13], use only drilling and blasting parameters and existing rock classifications by strength and structural features, which sometimes cannot take into account unique structure and heterogeneity of the rock mass to be blasted. In contrast, MWD technology allows the collection of data from each drilled borehole and provides a dense sampling cloud for subsequent prediction of rock size distribution in the muck pile. A block model built on these data can take into account strength characteristics and all the structural faults found in the rock mass, which allows for a more detailed consideration of the effect that lithology and the state of the rock mass have on the final result. Other advantages of MWD technology include minimal disruption to the environment and enhanced safety during blasting [14,15].
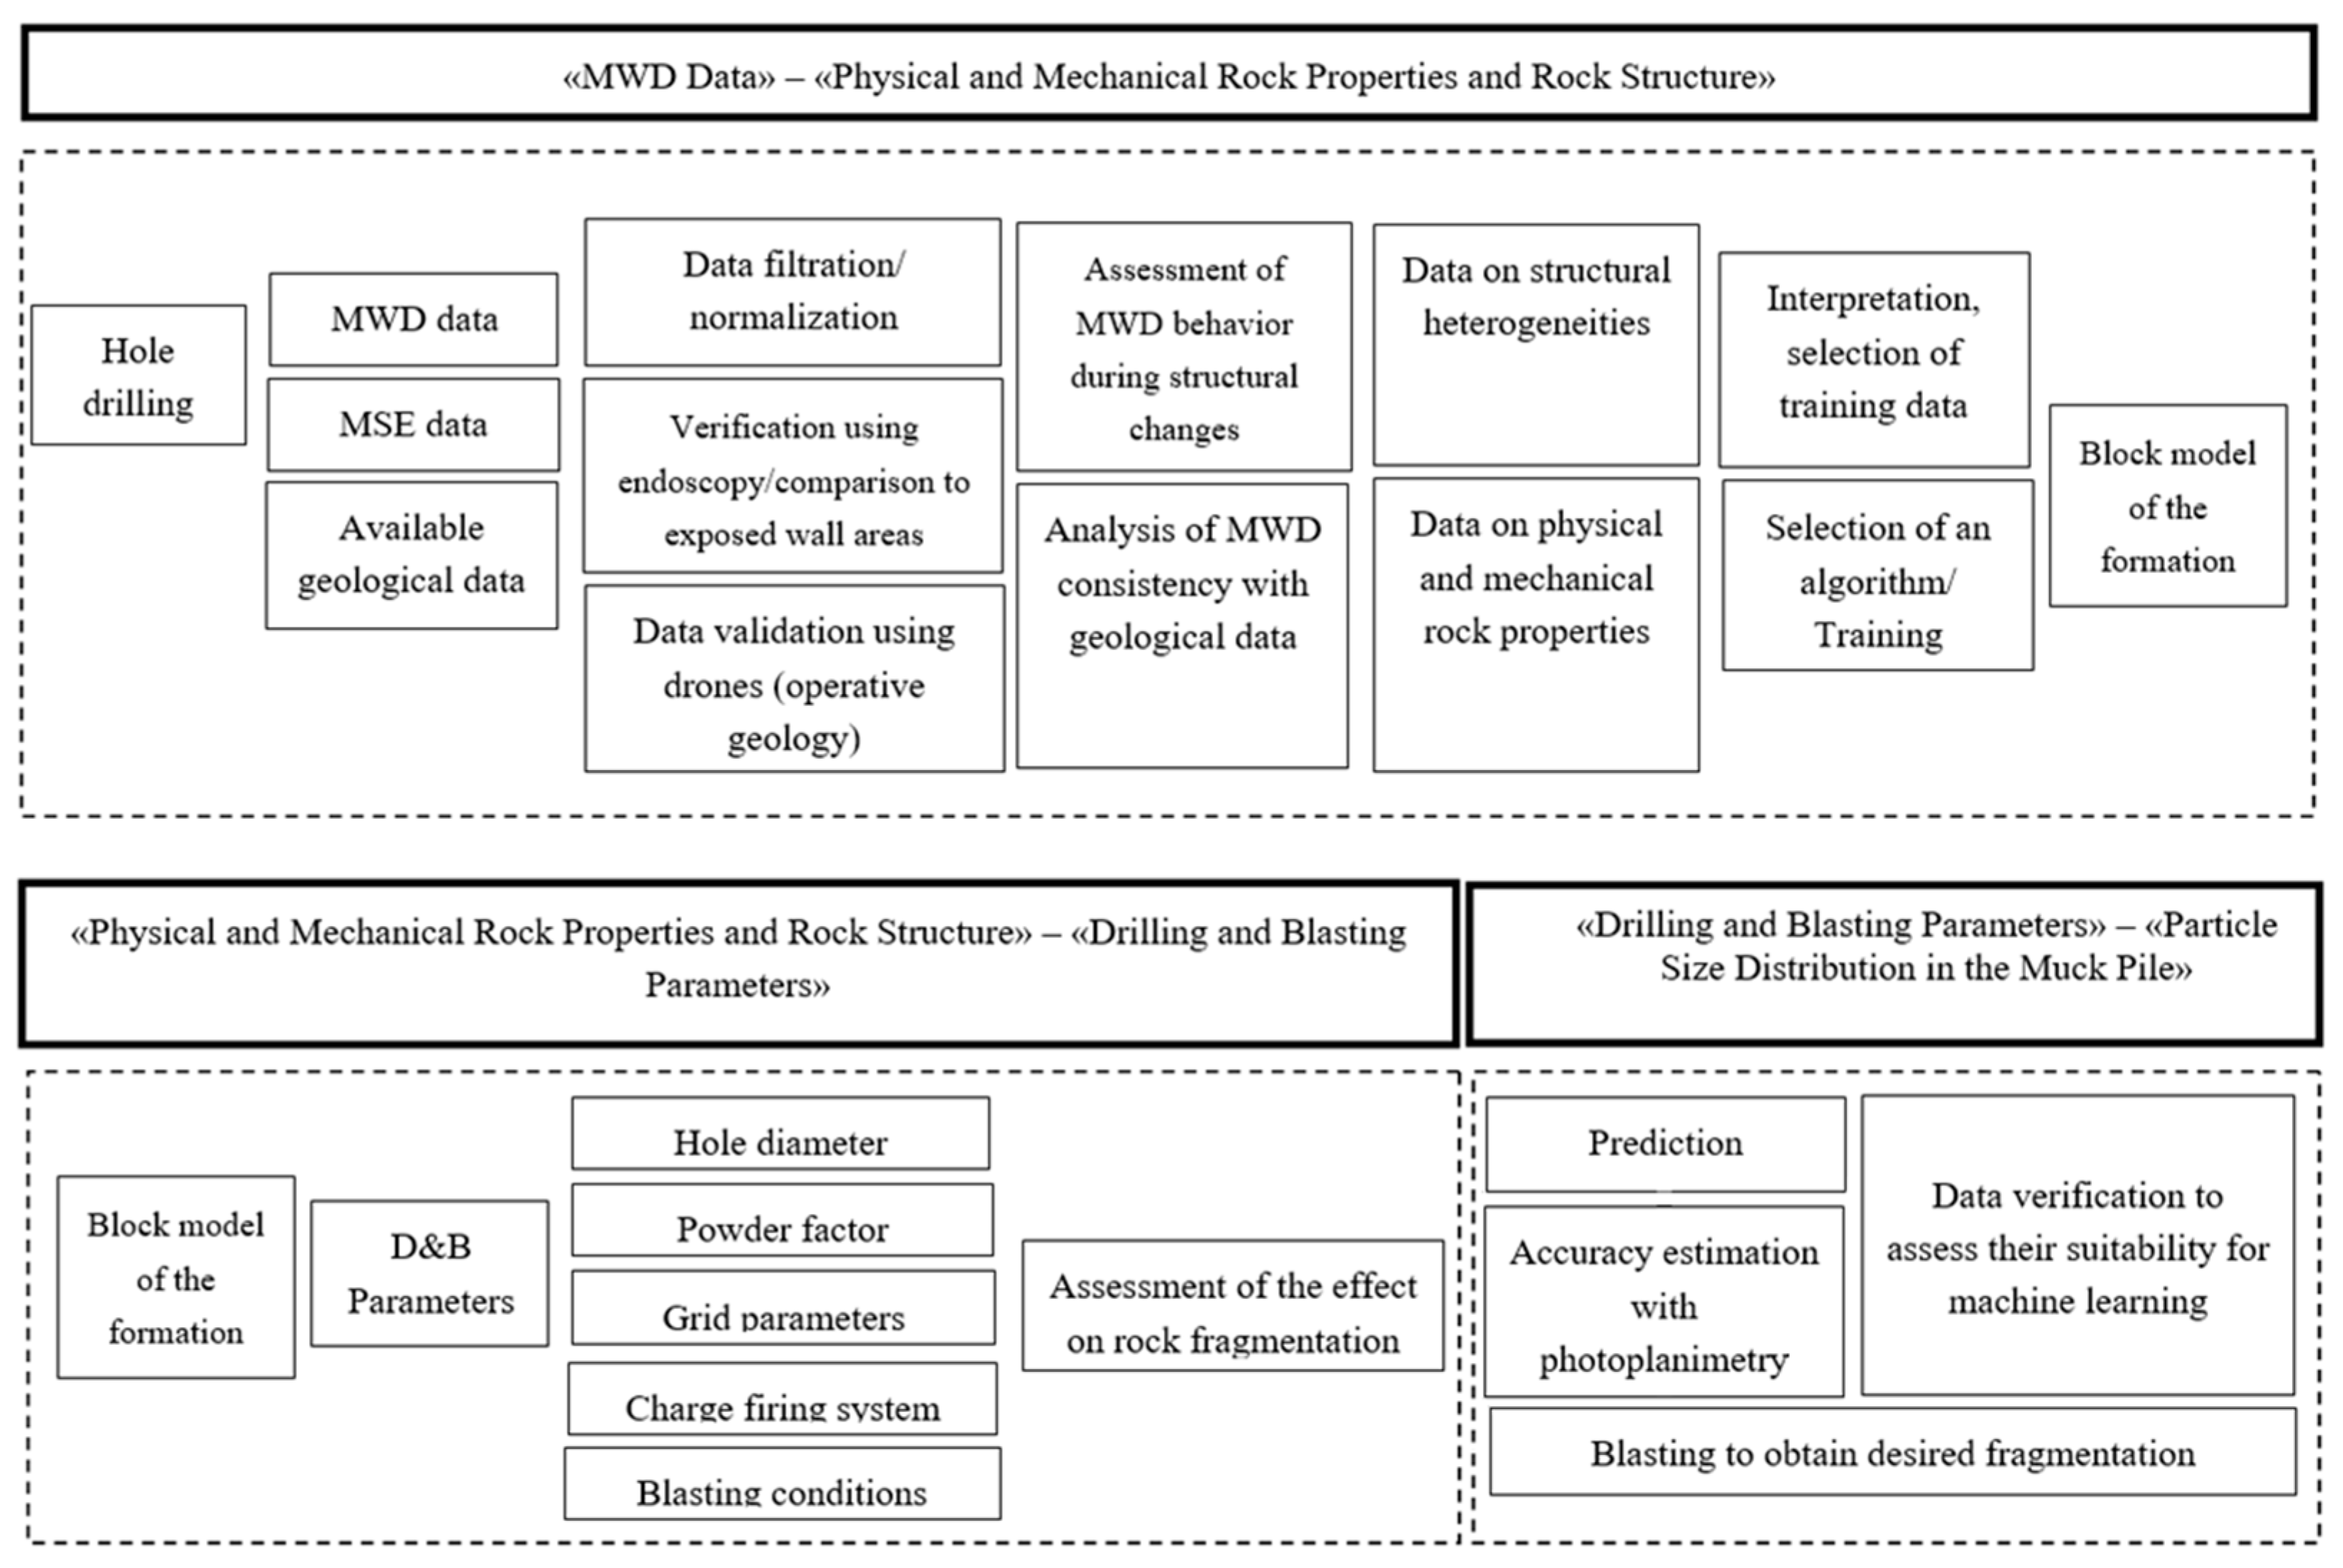
The problem solved in the current study can be formulated in the following sequence: “MWD Data”–“Physical and Mechanical Rock Properties and Rock Structure”–“Drilling and Blasting Parameters”–“Particle Size Distribution in the Muck Pile”, with direct quality assessment at each stage of the process. The paper addresses quality analysis of the input parameters in the block “MWD Data”–“Physical and Mechanical Rock Properties and Rock Structure”. The evaluation of accuracy and quality of machine learning algorithm performance, verification of obtained rock properties and particle size distribution are other important aspects of future research [16].
To overcome the difficulties associated with the uncertainty of geological data, the methods of artificial intelligence, machine learning [17,18], neural networks [12,13,19,20], fuzzy logic [21,22,23], etc., are gaining widespread use in the mining industry. Today there are numerous variations in the indicated methods and tools, which offer cutting-edge solutions to the problems of the mining industry in the presence of input data of different complexity [16,24].
The indicated methods are widely used for the analysis of geomechanical parameters [22], prediction of geological conditions of the rock mass [22,25], calculation of physical and mechanical parameters of the rocks [21], their classification, estimation and prediction of drilling and blasting parameters and indicators [12,13,18,19,20,21], etc. A detailed review of computing technology applications and the indicated methods in mining is presented in the paper [10].
However, in most cases, the input data are simple sets of parameters that include variously measured (directly or indirectly) and calculated values. On the other hand, the drilling dataset, collected with the use of MWD technology, is larger and has a more complex relationship between its constituent parameters as compared, e.g., to the same geological characteristics obtained with alternative methods. In this regard, the task of machine learning algorithms for data analytics becomes more complicated since it is necessary to take into account a large number of interrelated parameters that provide an actual response of drilling to changes in the rock mass [16].
In paper [26], the authors presented a comparative study of boosting [27], neural networks [28] and fuzzy logic [26], using data from blast hole drilling at an iron mine in Australia. The methods were analyzed in terms of their accuracy, ease of implementation and computational efficiency. To train the algorithm, the authors used a geological model obtained as a result of a geophysical survey and sampling of core and slurry in the study area. The main requirement for the use of machine learning methods was building a high-quality training dataset.
Although the results were encouraging, very detailed local data on the rock mass was required to calibrate the model, which is often unavailable due to the high labor intensity and high costs of such datasets. The disadvantages of using neural networks include the complexity of learning from high-quality input data, tendency to overfit to incorrect values and empirical nature of model development.
In this regard, the use of machine learning methods, neural networks, etc., requires that special attention be given to data verification when the obtained data are used as the main training set in the formation of a “parent” learning algorithm. When iterating over the dataset, the verified data laid as the foundation of the training process can seriously reduce the error rate and increase the “cleanness” and accuracy of predicted values.
The verification of data after their processing and normalization is a very important stage that determines subsequent results. In many cases, the verification of parameters measured by the MWD system confirms the reliability of the obtained data; however, despite the variety and high accuracy of data verification methods, including optical [29], mechanical [30] and geophysical [31] ones, there are problems associated with the comparison between the information obtained with these methods and the data collected by MWD systems. For example, parameters recorded by the measurement system can become distorted due to rod jamming, idle rotation or borehole deviation [32]. In most cases, the change (deviation) of the drilling speed and rotation pressure (torque) is directly proportional to the intensity of fracturing and disturbance of the rock mass; however, in the case of strong fracturing, a decline in drilling and rotational speeds is accompanied by an increase in torque due to jamming and clamping of the drilling instrument [32,33].
Due to distortion of one or several parameters, other dependent values will also be altered because of the automatic triggering of the drilling control system, thus leading to registration of incorrect parameters unrelated to changes in the rock mass [34].
Summarizing the above, a very important aspect of using machine learning tools and methods is the initial processing of the measured parameters, providing an actual response to changes in the rock mass instead of alterations in the technological process of drilling. Subsequently, such preparation will ensure the “cleanness” of data and serve as a basis for building a “parent” database in the block “MWD Data”–“Physical and Mechanical Rock Properties and Rock Structure” [16].
2. Background
In order to collect “clean” drilling data, it is necessary to make sure that the setting of the rig, on which the measuring equipment is installed, provides an actual response to changes in the type and structure of the rocks. Even rigs with different models of the same type of drilling instrument can produce different drilling results in the same rock mass. One of the leading coal mining enterprises OOO “Resurs” (Novokuznetsk, Kuzbass region, Russia), collected drilling data in the process of blast hole drilling at the sites of subsurface resources Kyrgaysky Sredniy (54°14′00.0″ N, 87°05′17.0″ E) and Novokazanksy 2 (54°13′55″ N, 87°16′32″ E) for subsequent analysis and verification (Figure 1).
In total, 478 boreholes were used to collect the data for this study: 245 boreholes from 17 blocks with no rock exposure (Novokazanksy 2 site); 233 boreholes from 13 blocks with rocks exposed by blasting (Kyrgaysky Sredniy site). For the purposes of this paper, the two sites mentioned above exemplify the procedure for collecting “clean data” to verify the performance of the developed block model and for comparing photogrammetric images of the pre-split holes to the available geological information, MWD data and drilling energy consumption. Hardness coefficients and drillability of the rocks are presented in Table 1.
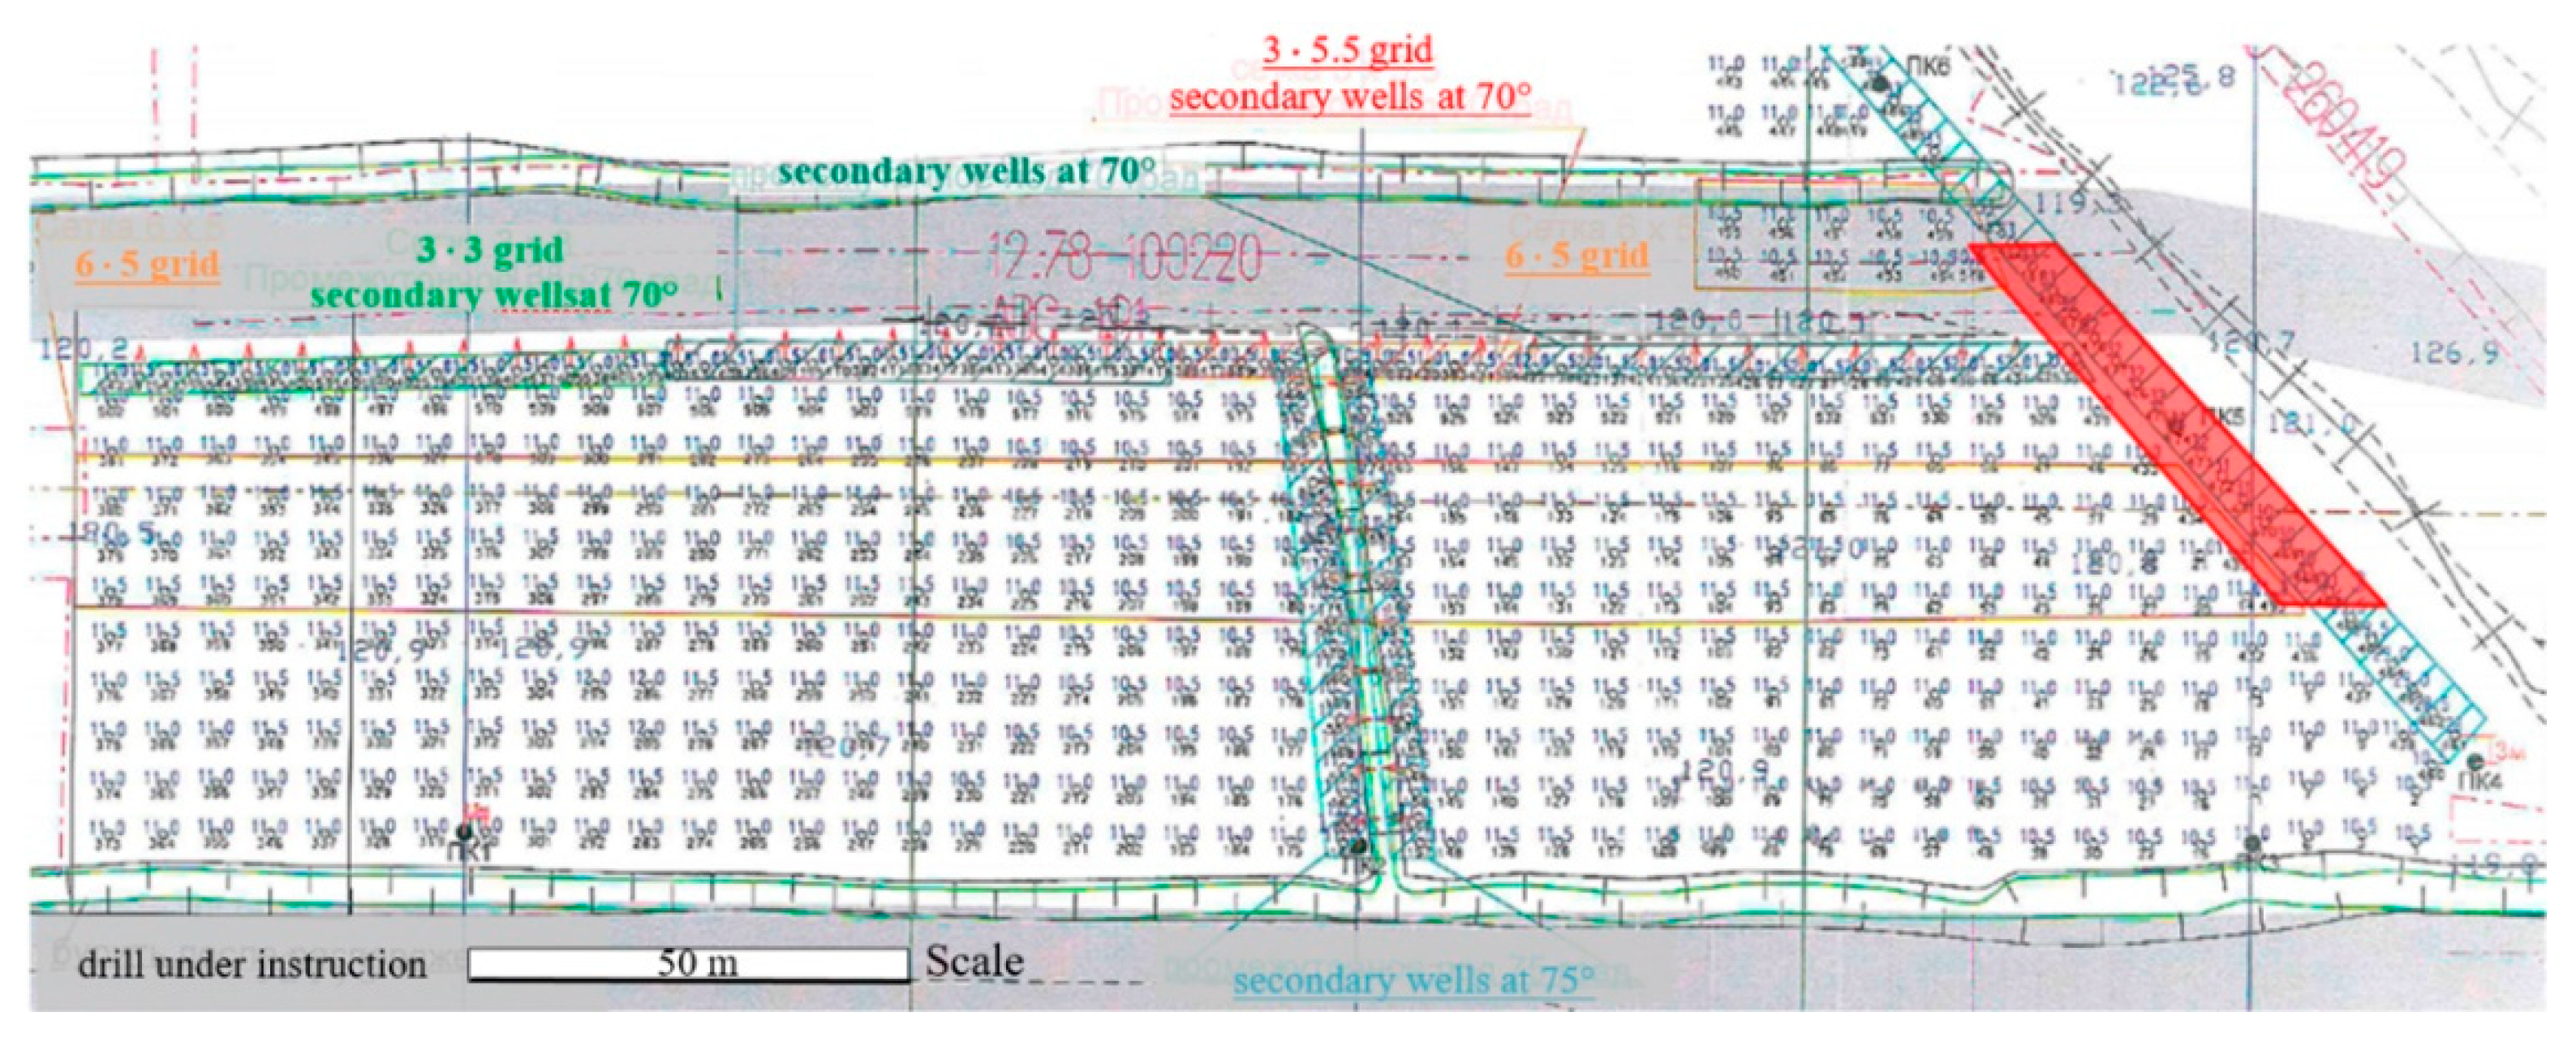
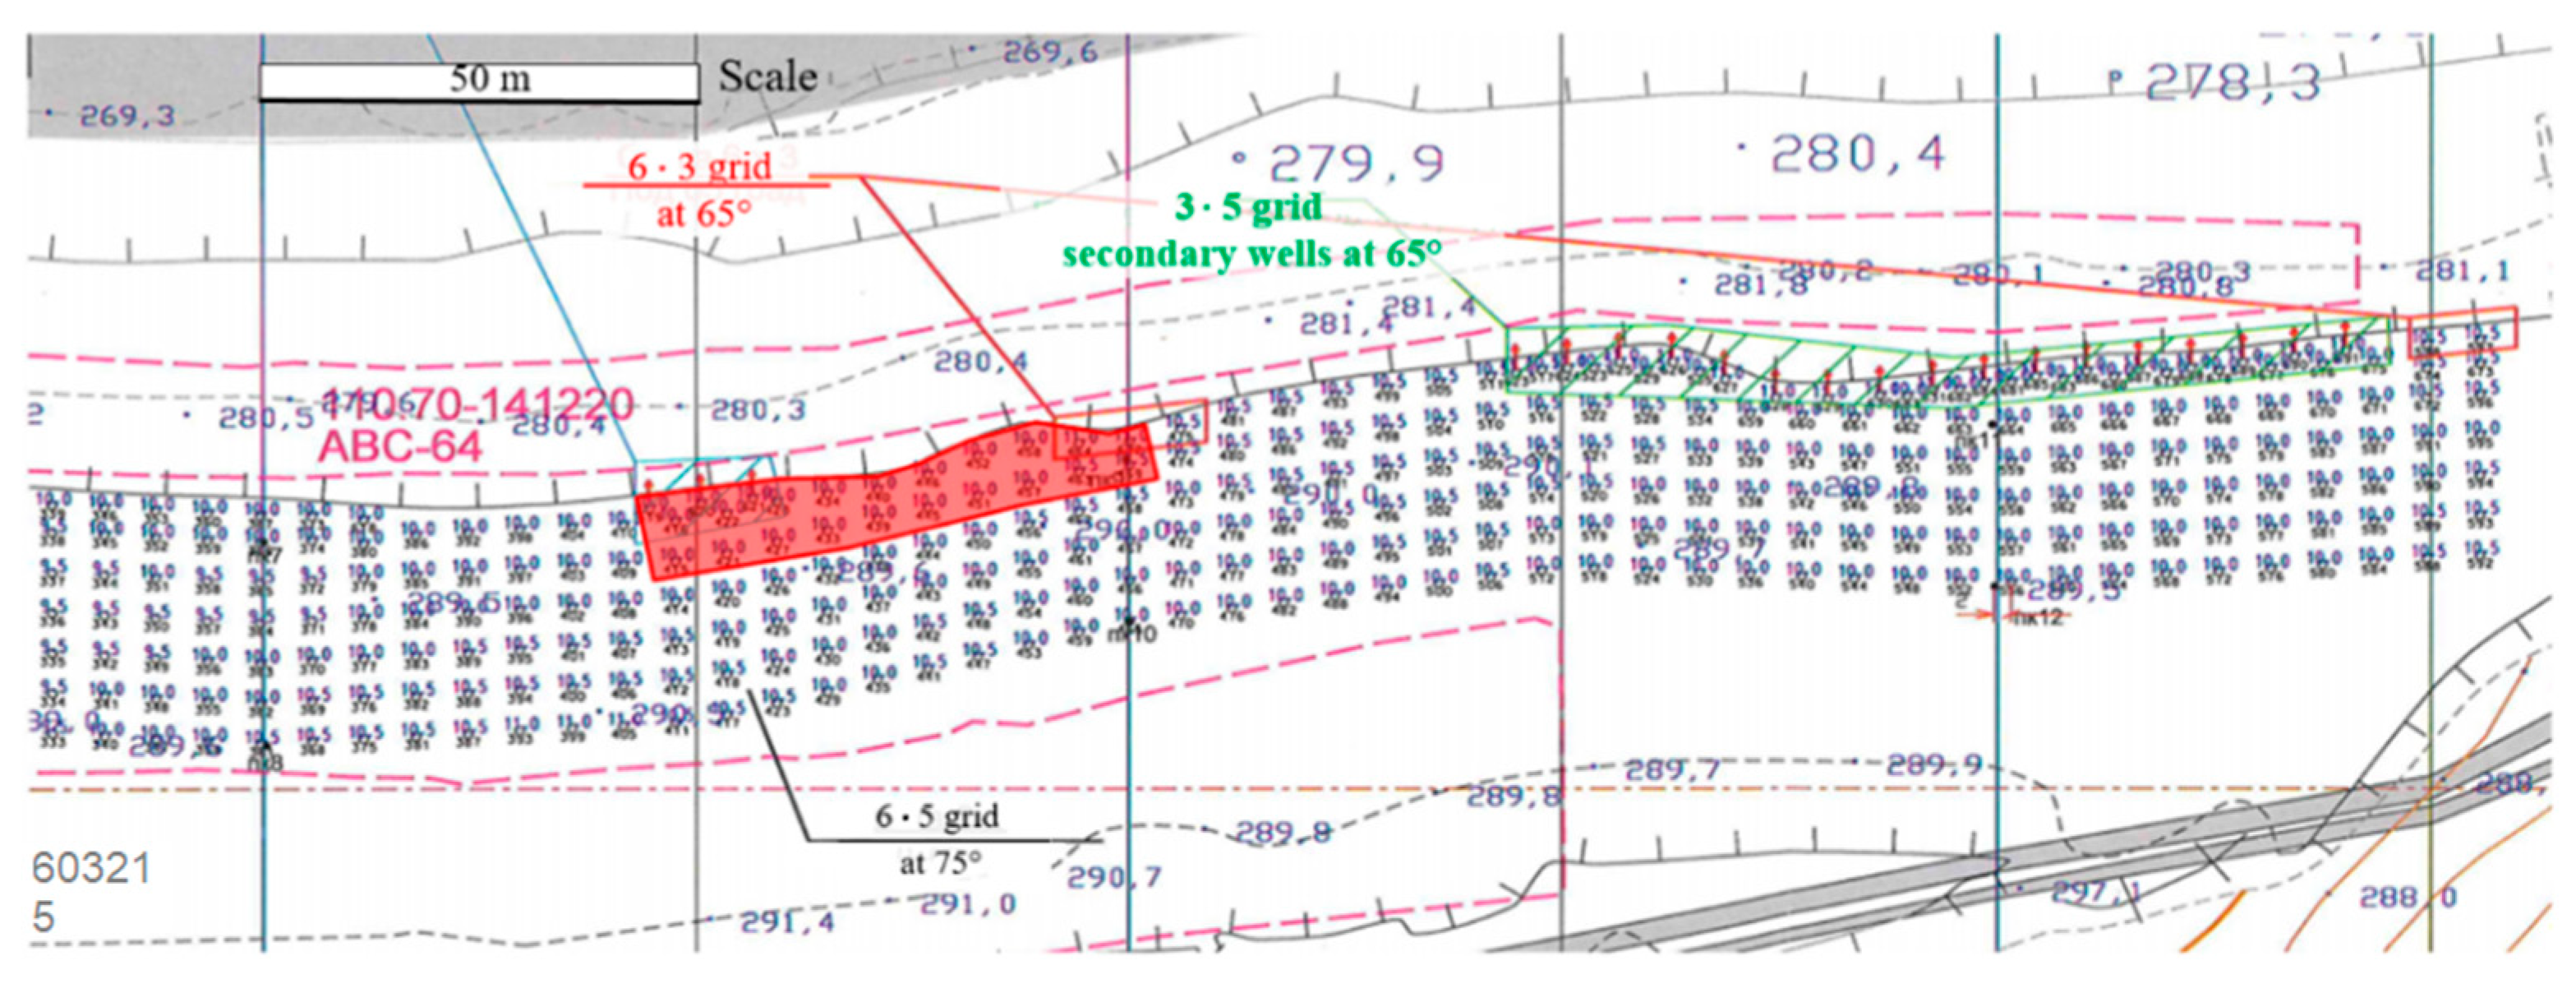
The pre-split row of boreholes was drilled to the depth of 33 m. For the study, boreholes No. 469–483 (highlighted in red in Figure 2) were selected from block No. K 67–78 in level +120.0–+121.0 at the Kurgaysky Sredniy site (Figure 1a), and boreholes No. 415–469 (highlighted in red in Figure 3) from block No. N 58–70 in level +285.8–+291.2 at the Novokazansky 2 site (Figure 1b). The production boreholes in the blocks to be blasted were drilled to a depth of 10.0 to 11.5 m. The borehole diameter was 0.17 m. The studied blocks, where the drilling data were collected, are presented in Figure 2 and Figure 3.
The analysis of pre-split holes after blasting allows to observe the zones of structural heterogeneities in the rock mass, understand the variation in lithology and compare obtained MWD data to the actual geological structure. It also allows identifying clearly visible half-casts of the blast holes with minimum blast-induced fractures. It is possible to improve our understanding of how MWD parameters respond to changes in the rock mass by comparing the paths of pre-split holes to changes in the rock mass as a function of depth. In the study, areas of the wall with good and poor rock conditions were specifically selected.
One of the main parameters used to characterize drilling energy consumption and specify rock characteristics is mechanical specific energy (MSE) [35]. This parameter allows understanding of what happens in the rock mass in the absence of rock exposure. It is calculated based on MWD data and adjusted to the wear of the drilling tool, hole cleaning operations, etc. [36,37,38,39,40].
The interpretation of MSE data, combined with available geological information and MWD data, can provide valuable insights into the actual geological structure of the formation. However, the reliability of obtained MSE values needs to be confirmed to eliminate the possibility of data distortions or measurement delays.
In this study, the feasibility of using MSE parameter for identification of lithologies and rock structures on the basis of existing geological reports was verified using two methods:
- Comparison of the block model based on MSE data to the results of UAV scanning of the bench wall after pre-spilt blasting (Kyrgaysky Sredniy site);
- Video endoscopy of the blast holes in the blocks without rock exposure (Novokazansky 2 site).
The information obtained was used to confirm the correlation between obtained MSE values and the actual known rock composition, as well as to form the basis for collecting real-time geological data to understand the MWD response to changes in the rock mass.
3. Materials and Methods
The procedure for data collection and analysis involved the following steps:
- (1)
- Collection and filtering of MWD data;
- (2)
- Scanning of the bench wall;
- (3)
- Estimation of MSE and development of the block model;
- (4)
- Conduction of borehole video endoscopy;
- (5)
- Comparison of the obtained results and analysis of the drilling response.
A more detailed description of the steps is presented below.
3.1. MWD Data
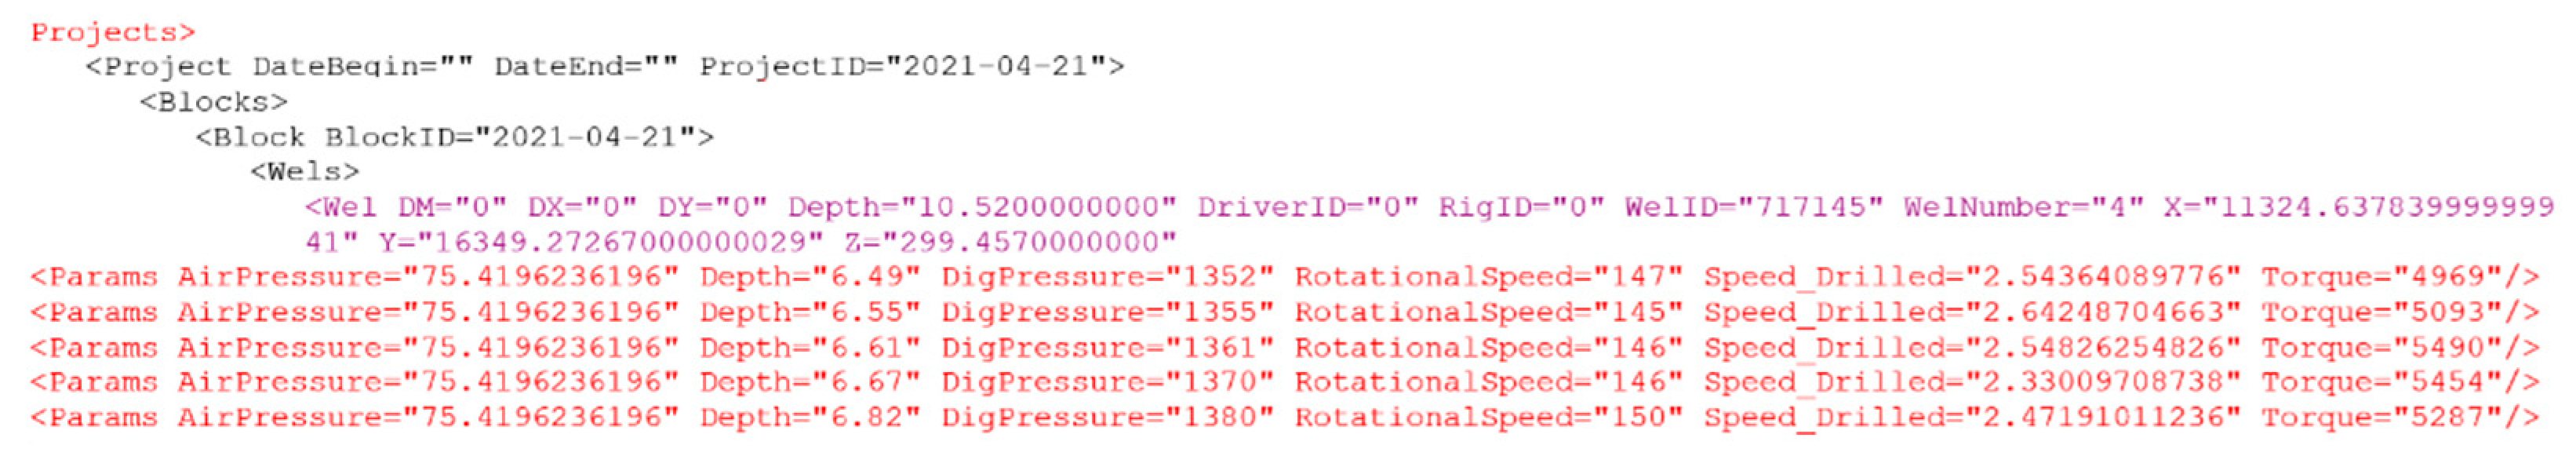
Data were collected from two types of boreholes (production and pre-split ones) from rotary drilling rigs Sandvik D50KS [41] and Epiroc DML LP-1200 [42], equipped with a drilling measurement system “VG Drill” [43] with high-precision positioning and guidance to the planned drilling trajectory. The drilling monitoring system “VG Drill” extracted and stored real-time MWD data in the “eXtensible Markup Language” format (hereinafter, XML) and then uploaded them to a specialized mining-and-geological information system GIS “Geomix” [44] for further data interpretation. Recorded data included drilling date, top of the borehole coordinates with an elevation mark and an ID number of the borehole according to the blast design plan, depth parameters (m), torque (lbf-ft), penetration rate (m/min), rotational speed (rpm), dig pressure (psi), air pressure (psi). The interval of sampling measured drilling parameters was set at 0.05 m. An example of output data, recorded in XML format, is presented in Figure 4.
Not all drilling data were used for the data analysis due to several reasons. For example, it is necessary to delete data recorded at the beginning of each borehole in the upper part of the bench (first 2 m), as in most cases, it is either disturbed and possibly covered with loose rock fragments or has weaker physical and mechanical properties due to the effect of previous blasts. As a rule, the drilling control system performs collaring of the borehole top with reduced supply pressure. Drilling parameters, recorded at the beginning of the borehole but unrelated to rock mass characteristics, are not subject to analysis, as they do not reflect the drilling response to actual changes in the rock mass. Data recorded from MWD systems in the process of drill rod replacement should also be excluded from analysis due to equipment-induced parameter changes. Incorrect and unrealistic data, such as negative or abnormally high values of drilling speed or pressure, are not representative and cannot be interpreted as a drilling response to changes in the rock mass. All the indicated data should be removed during analysis [45,46].
The “VG Drill” system provides a set of basic tools to avoid the inclusion of incorrect data and to filter input parameters in automatic mode (excludes measurements during put-out-of-hole operations, redrilling, no-load time, etc.).
Apart from that, the data sets also contained entries with values that were theoretically possible but seemed very unrealistic—their exclusion was a separate step of the filtration process. Based on frequency analysis and practical considerations, a conservative limit was imposed on every recorded parameter (see Table 2).
Conservative filtration limits excluded the major share of incorrect data. However, they could also delete some values that reflected the actual drilling response but rarely occurred in the data set. It should be noted that large amounts of collected MWD data guarantee that important geomechanical features will still be identified, even if several correct entries are filtered out.
All the sets of raw data were passed through the filter specified in Table 2. If at least one of the recorded parameters did not satisfy any of the imposed limitations, the entire entry of that measurement was deleted from the data set.
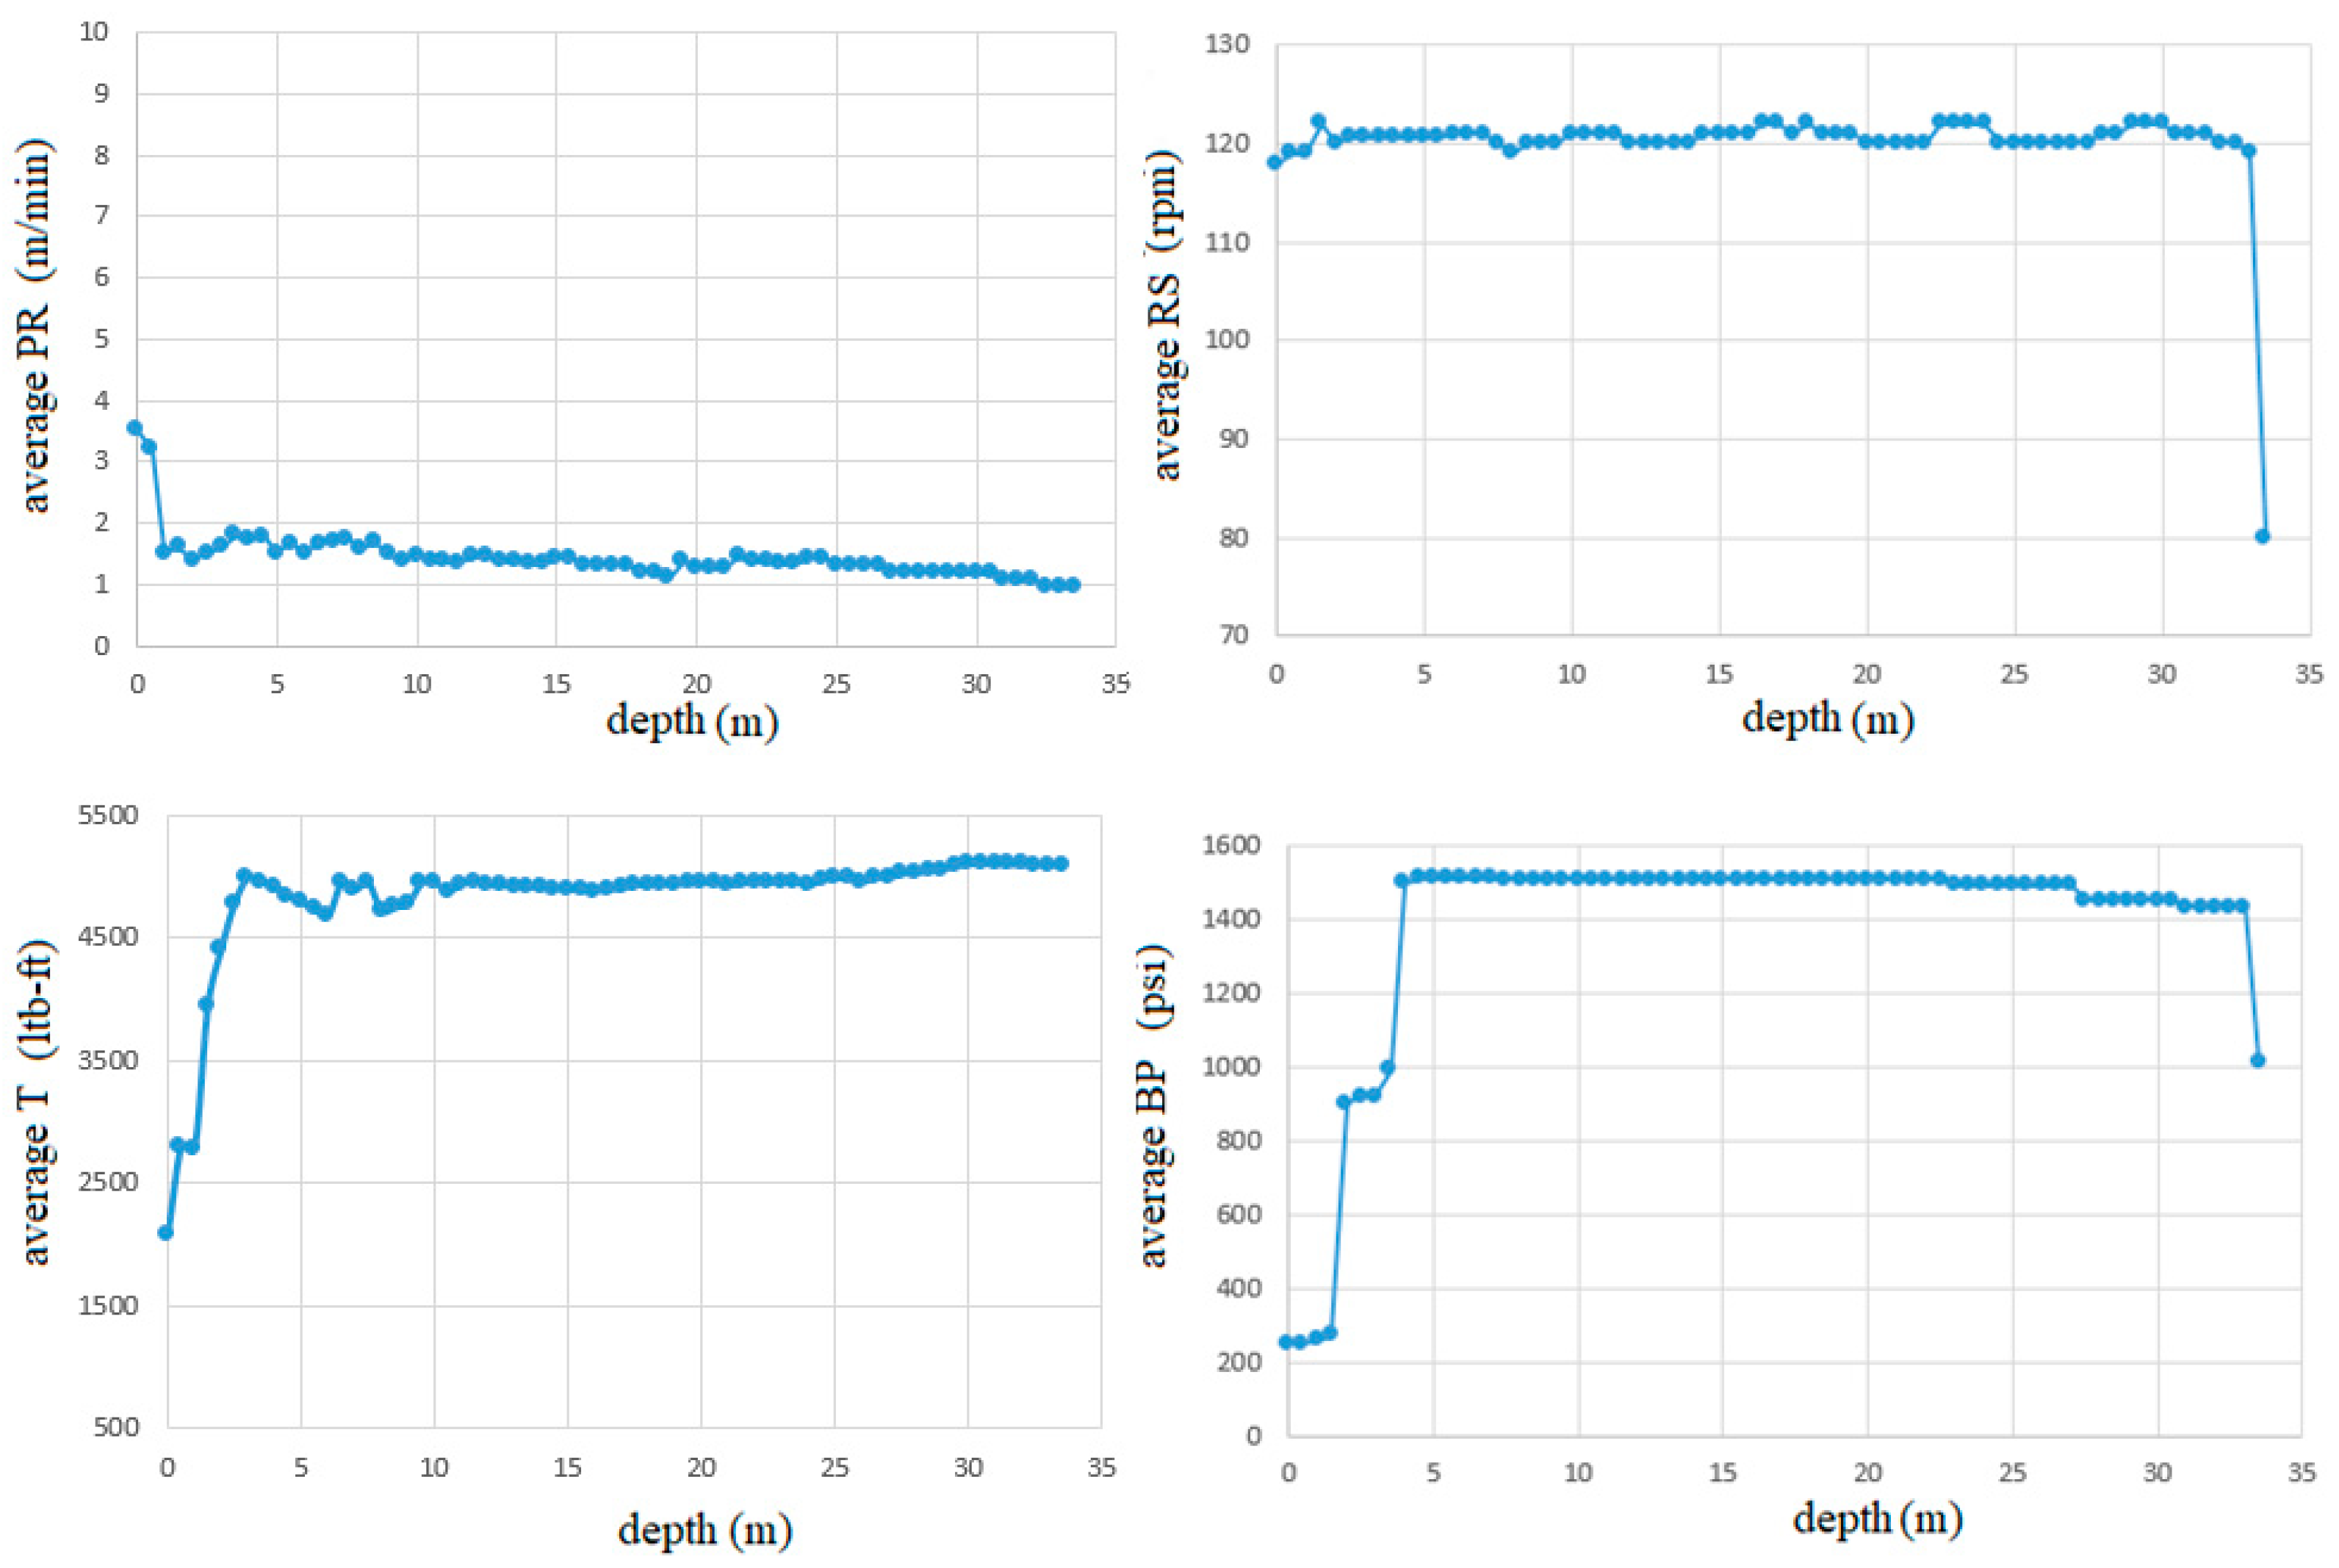
Figure 5 demonstrates average values of penetration rate (average PR), rotational speed (average RS), bottomhole pressure (average BP) and torque (average T), calculated at every 0.5 m of the borehole across the entire dataset. This analysis was carried out to determine the need to correct the recorded parameters with depth.
In the case of down-hole drilling, average signals of PR, RS and BP demonstrate only slight depth-dependent variations.
On the other hand, the values of average torque steadily increased with depth. From Figure 5, it can be seen that the addition of a new rod every 9 m of drilling depth leads to a step-change in the torque function, which can be explained by the need to increase pressure on the drilling tool to compensate for the additional energy, needed to perform its rotation due to increased mass of the tool. Depth-wise correction of the torque signal was performed in accordance with the following recommendations [47,48]:
where i indicates each measurement in a hole log; N is the number of measurements; Tfit is the polynomial fit with a hole depth of average torque. T1 is the intercept of the fit.
Tinorm = [Ti − Tifit] + T1fit with i = 1, 2…N
3.2. Bench Wall Scanning
An unmanned aerial vehicle (UAV) technology can be used to collect 2D images of the bench wall in order to build a 3D model and to perform structural mapping of the formation. Obtained data allow for accurate measurement of fracture orientation and length. Furthermore, the use of UAV makes it possible to cover a large study area, which in many cases (e.g., bench wall) is either too dangerous or altogether inaccessible for manual mapping [49].
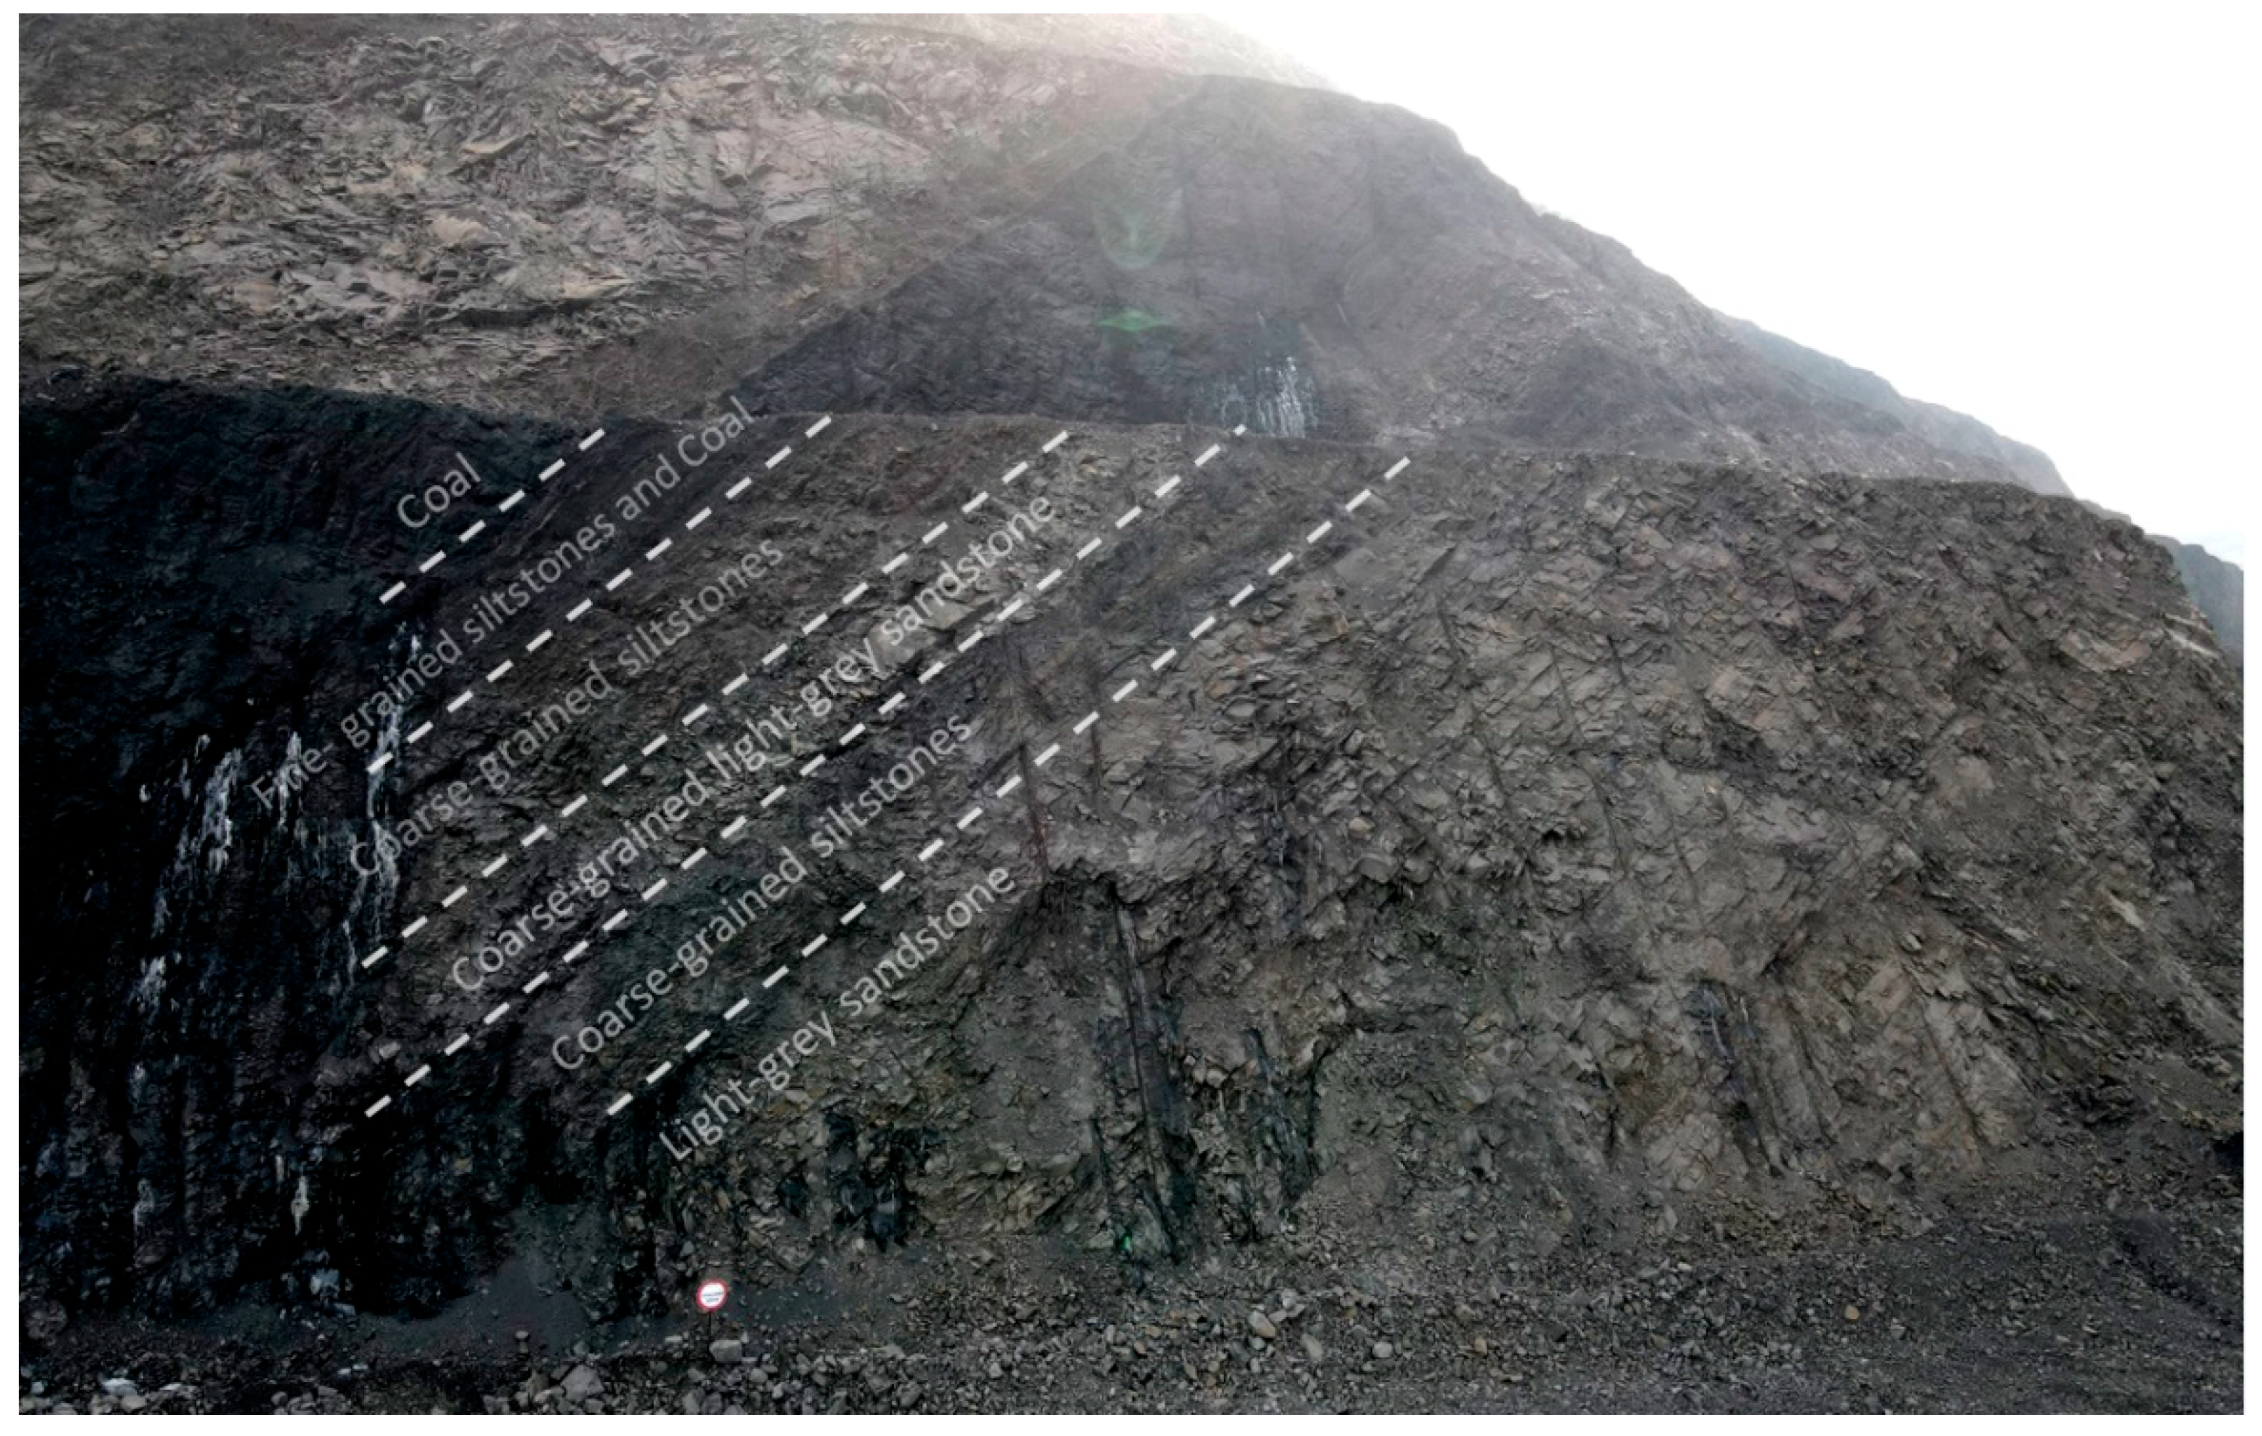
The boreholes of the pre-split row at Kyrgayskiy Sredniy site in block No. K 67–78 intersect several geological rock types. The presence of interbedded rock zones with well-defined limits can be observed in the exposure of the block wall, and then visual data can be compared to MSE values to analyze the drilling response to changes in the rock mass. Hence, this site is a valuable and very promising source for the analysis and collection of “clean” data, and for that reason, it was chosen as the main site.
In this study, digitization of the bench wall was carried out by means of the photogrammetric method [45,50] using the “DJI Mavic 2 Pro” drone [51]. This operation was important due to subsequent positioning of borehole trajectories, analysis of fractures and blocky structure of the studied site for each individual borehole in the pre-split row and comparing them to the available geological information.
Digital photogrammetry was performed using a Hasselblad L1D-20C camera with a 20 MP 1″ CMOS matrix, adjustable aperture of f/2.8–f/11, an integrated 35 mm lens (the equivalent of 24 mm, FOV: vertical 77°, horizontal 60°), maximum still image size 5472 × 3648.
At the beginning of each flight, camera settings and exposure values were selected and then locked using the camera’s built-in function. To survey pre-split blast holes and the structure of rock exposure, the camera was aligned horizontally, oriented straight to the wall. Obtained photographs were time-stamped and geo-referenced, which made it possible to analyze the generated 3D images. The accuracy of geo-referencing is critically important: if the cloud is located in the wrong area or has incorrect orientation, it can lead to erroneous results; however, if the relative accuracy is high, it can still be used for structural mapping [52]. UAV images are geo-referenced using onboard GPS, but in the air, it is difficult to obtain reliable positioning data. The problem can be solved by using ground control points (GCPs)—points of known location that can be identified in the captured images. The use of GCPs can improve the accuracy of geo-referencing in the known coordinates and allows an estimation of the error. In this study, geo-referencing was carried out according to the base points of the mine surveying system; geodetic tape measures were used to ensure scaling.
The distance from the target, camera orientation and its tilt are usually considered the key adjustable UAV parameters. The selection of a flight plan, sufficient for building a wall model, requires preliminary knowledge of geology and the rock structure in that area. In order to estimate ground sampling distance (GSD), it is especially important to understand the range of fracture sizes and dip angles—all this information should be taken from geological reports.
In the process of UAV scanning, the desired minimum joint size varied from 0.1 to 0.6 m. GSD accuracy ranged from 0.2 to 4.0 cm/pixel. The procedure for calculating the distance from the target, focal length, side and front spacing, as well as flight velocity, is described in great detail in [52,53].
The drone was assigned two flight paths in automatic survey mode to map the overall surface of the bench wall (Figure 6, route 1) and individual boreholes of the pre-split row for subsequent comparison of MWD data to rock exposures in the wall (Figure 6, route 2). The number of flight lines is always selected individually for each wall. In this study, the model was built using high- and medium-resolution images, depending on the intensity of fracturing and the presence of interlayers. For example, for the considered wall in the pre-split row of block No. K 67–78, 11 horizontal flight lines were set to survey a wall with a total area of 2840 m2. Each subsequent flight line was displaced in relation to the previous one in terms of height and distance to the wall, taking into account the known slope angle. Specialized software Agisoft Metashape was used for processing and analysis of the photographs [54].
Data obtained in the process of scanning laid the foundation for checking the response of the drilling instrument to changes in the rock mass and were used as a benchmark for the assessment of data “cleanness” and compared with the wall (Figure 7).
3.3. MSE Calculation
The concept of MSE was introduced by Teale [35] as the work required to drill a unit volume of rock. For rotary drilling, the work is performed by both bit thrust and torque. R. Teale had derived an equation for MSE, which was subsequently used by many researchers in their works [36,37,38,39,40].
Taking into account measurement units of the parameters obtained by the rotary drilling rig, MSE can be described as follows:
where F—load on the drilling bit, lbf; S—borehole cross section, in2; N—drilling bit rotation speed, rpm; T—bit torque, lbf-ft; PR—drilling rate, m/min; F/S = Psi (Psi data are obtained from sensors).
In the case of hydraulic and electric rotary drilling rigs, formula (2) requires some modifications, described in greater detail in papers [36,40].
Average values for intervals are calculated for 0.1 m depth increments based on an average value for a defined depth segment in the hole. The penetration rate for segments was calculated as:
where Sil—length of the segment, m; NiI—time intervals for N segments (min).
PR = Sil/(NiI/TiI)
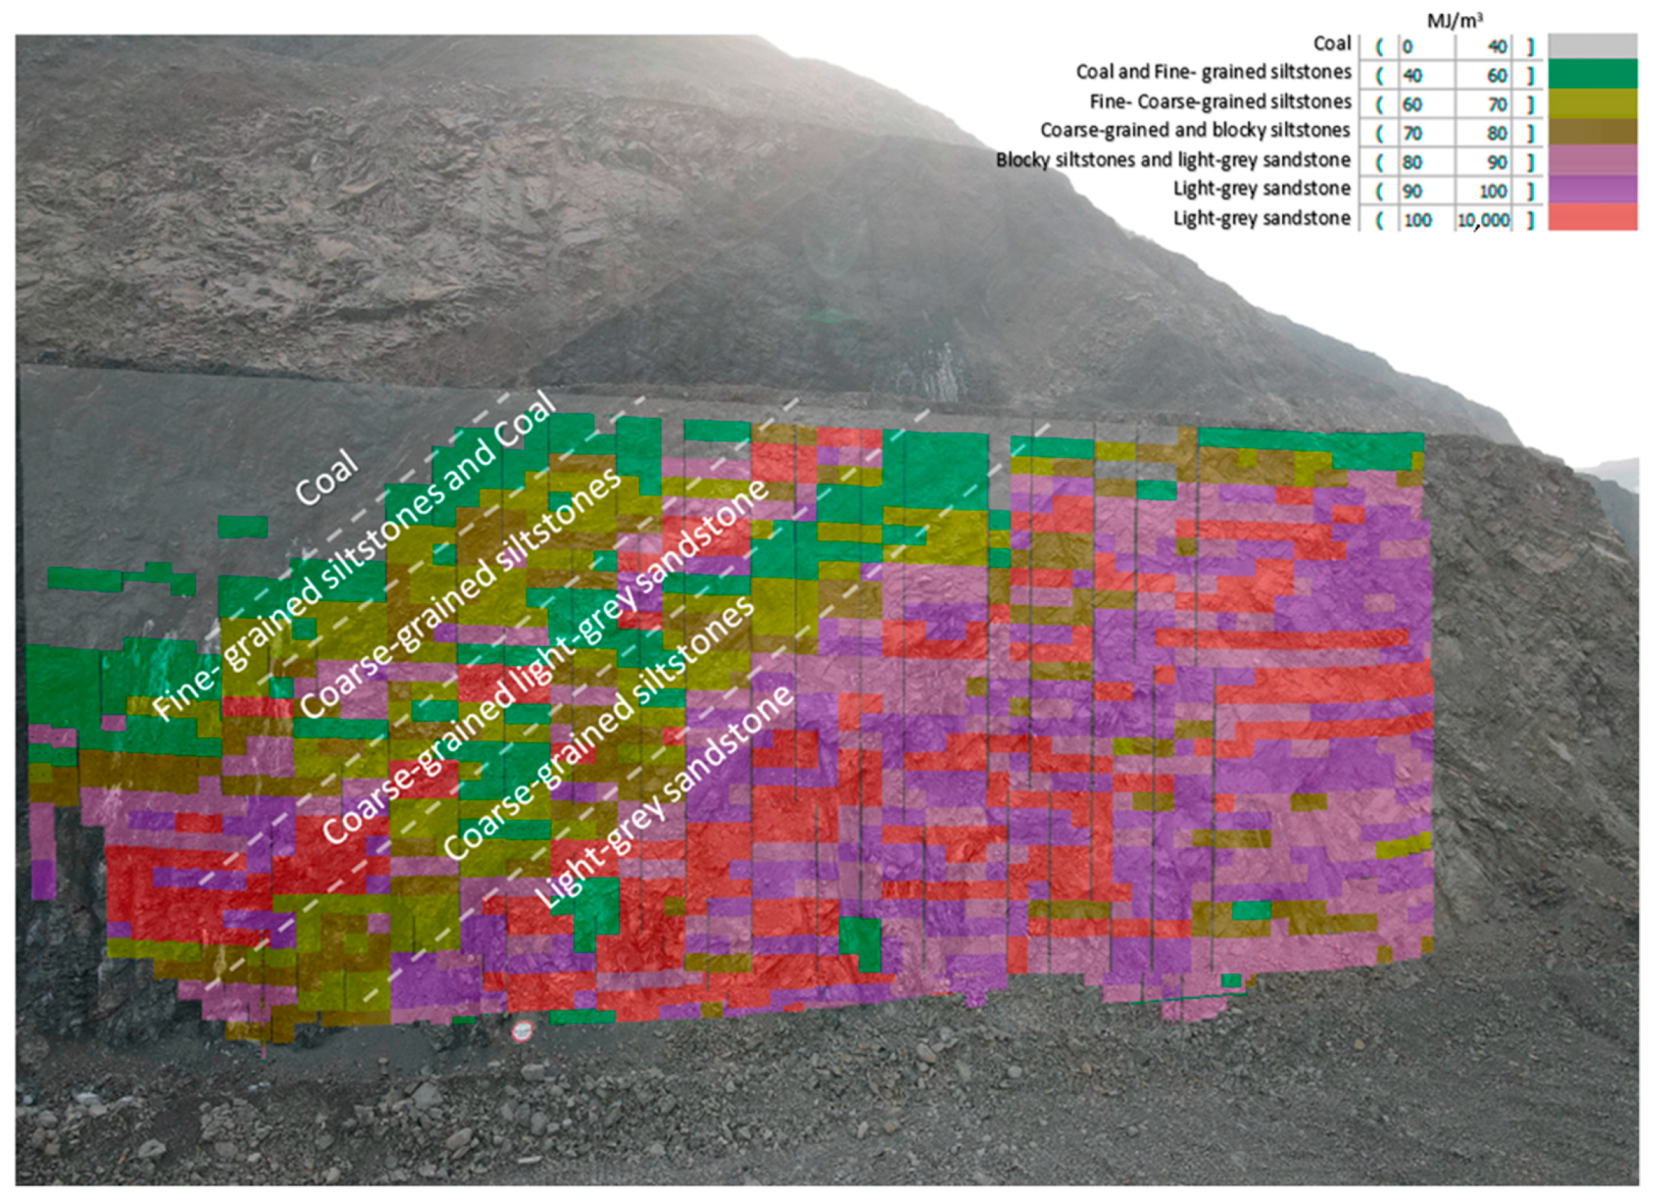
The coordinates of scan lines, top and borehole trajectories were matched against each other to compare the variations in geological and structural data with measured MWD indicators, MSE [42] (Figure 8) and the block model (Figure 9), built in the GIS “Geomix” software (ver. 5.3.222). The model was based on the results of MSE calculation along with the depth of the blast holes in the pre-split row. Then the sections between the holes and along their height were connected using the interpolation method and setting a preliminary grid for merging the data. After that, averaging of MSE indicators took place; a variable scale was selected to divide the averaged indicator into blocks, the coordinates were assigned and the block model was built.
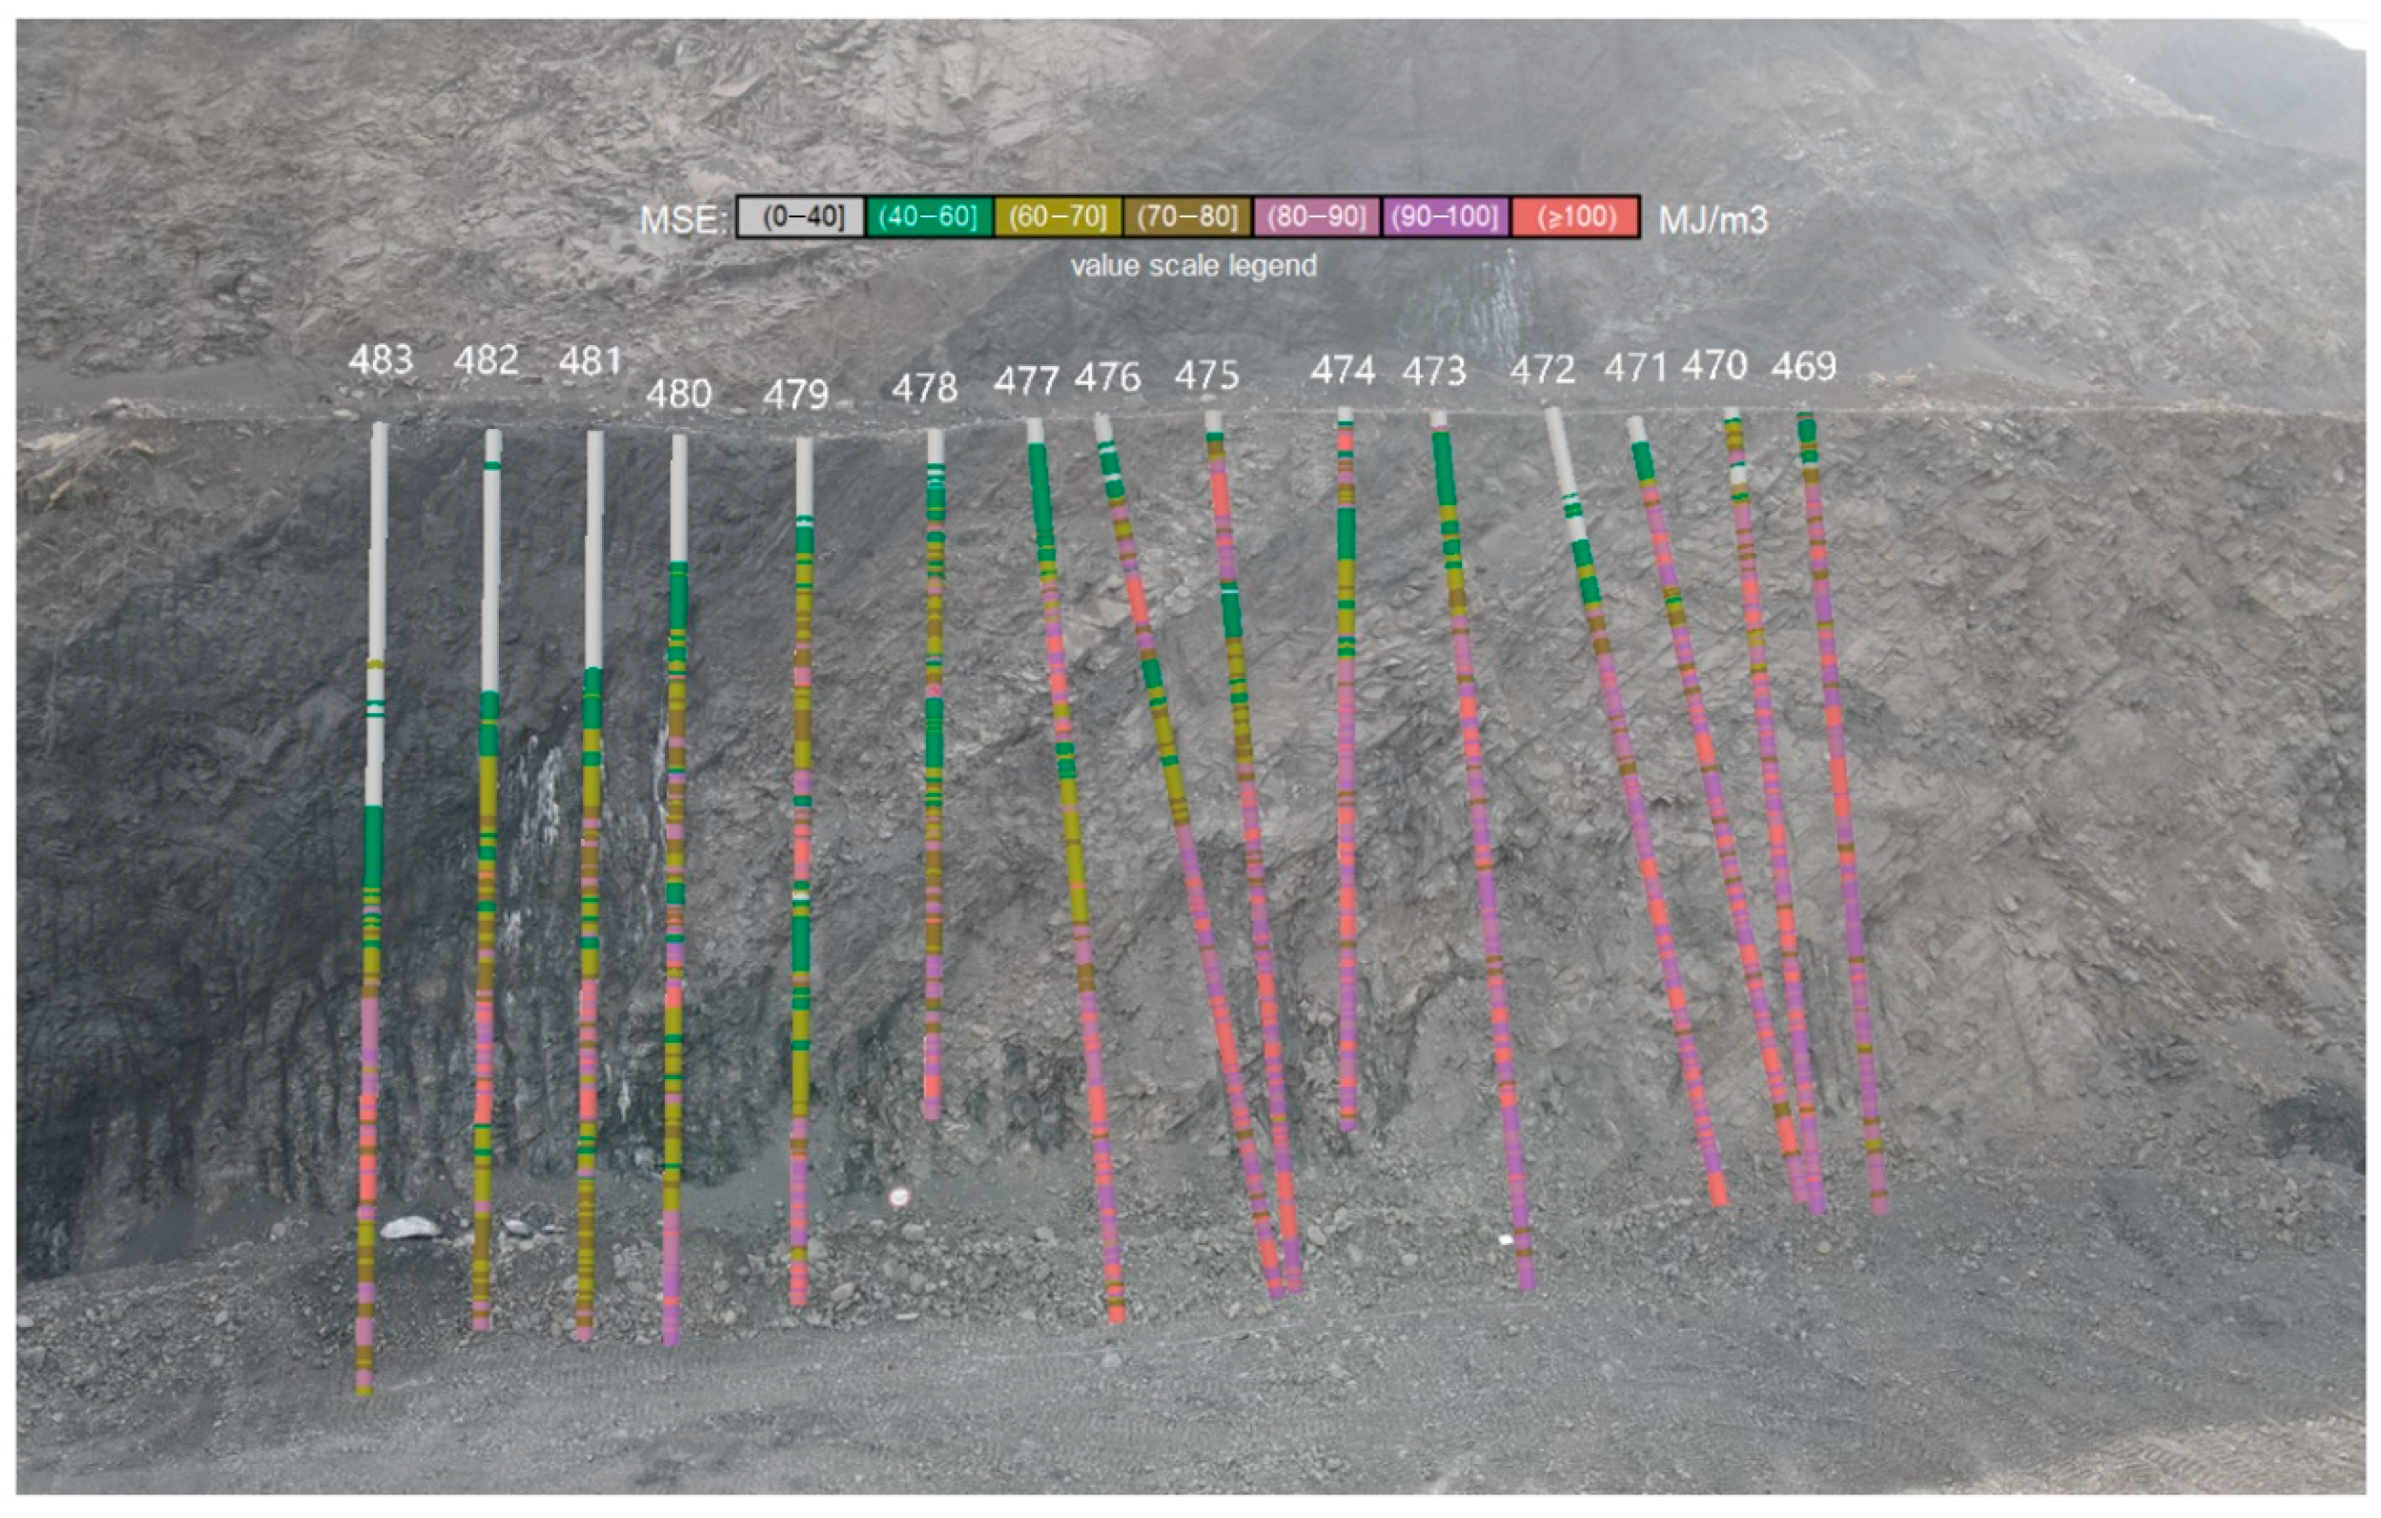
The data were plotted and compared to depth-dependent MWD data in order to reveal the actual drilling response, while areas showing similarities in the datasets were compared to wall scan results. The behavior of MWD data varied depending on the presence or absence of structural heterogeneities, interlayers and rock transitions [39]. Figure 8 shows an example of MSE distribution for boreholes No. 469–483 in the pre-split row of block No. K 67–78, compared to the photograph of the bench surface. An analysis of presented photographs allowed observation as the trajectories of boreholes No. 479–475 intersected a layer of siltstone. Boreholes No. 479, No. 477, No. 476 and No. 475 in the section of this interlayer were characterized by high MSE values, which were consistent with the rocks in this area.
The constructed block model fully reflected the dip direction of geological varieties and corresponded to the actual bedding of the rocks. This could clearly be seen when combining the block model with the scanned part of the wall.
3.4. Video Endoscopy
The block model was analyzed for a match with the actual drilling response and the absence of data measurement delays by means of surveying the blast boreholes using video endoscopy. In certain cases, video endoscopy helps to determine the presence of heterogeneities, disturbances and transitions in the rock mass [48,55].
Video endoscopy of the boreholes was performed using a “Wöhler VIS 350” device [56] with a flexible 30 m long push rod. The device was also equipped with a locator, which enabled accurate determination of the current position of the camera (Figure 10).
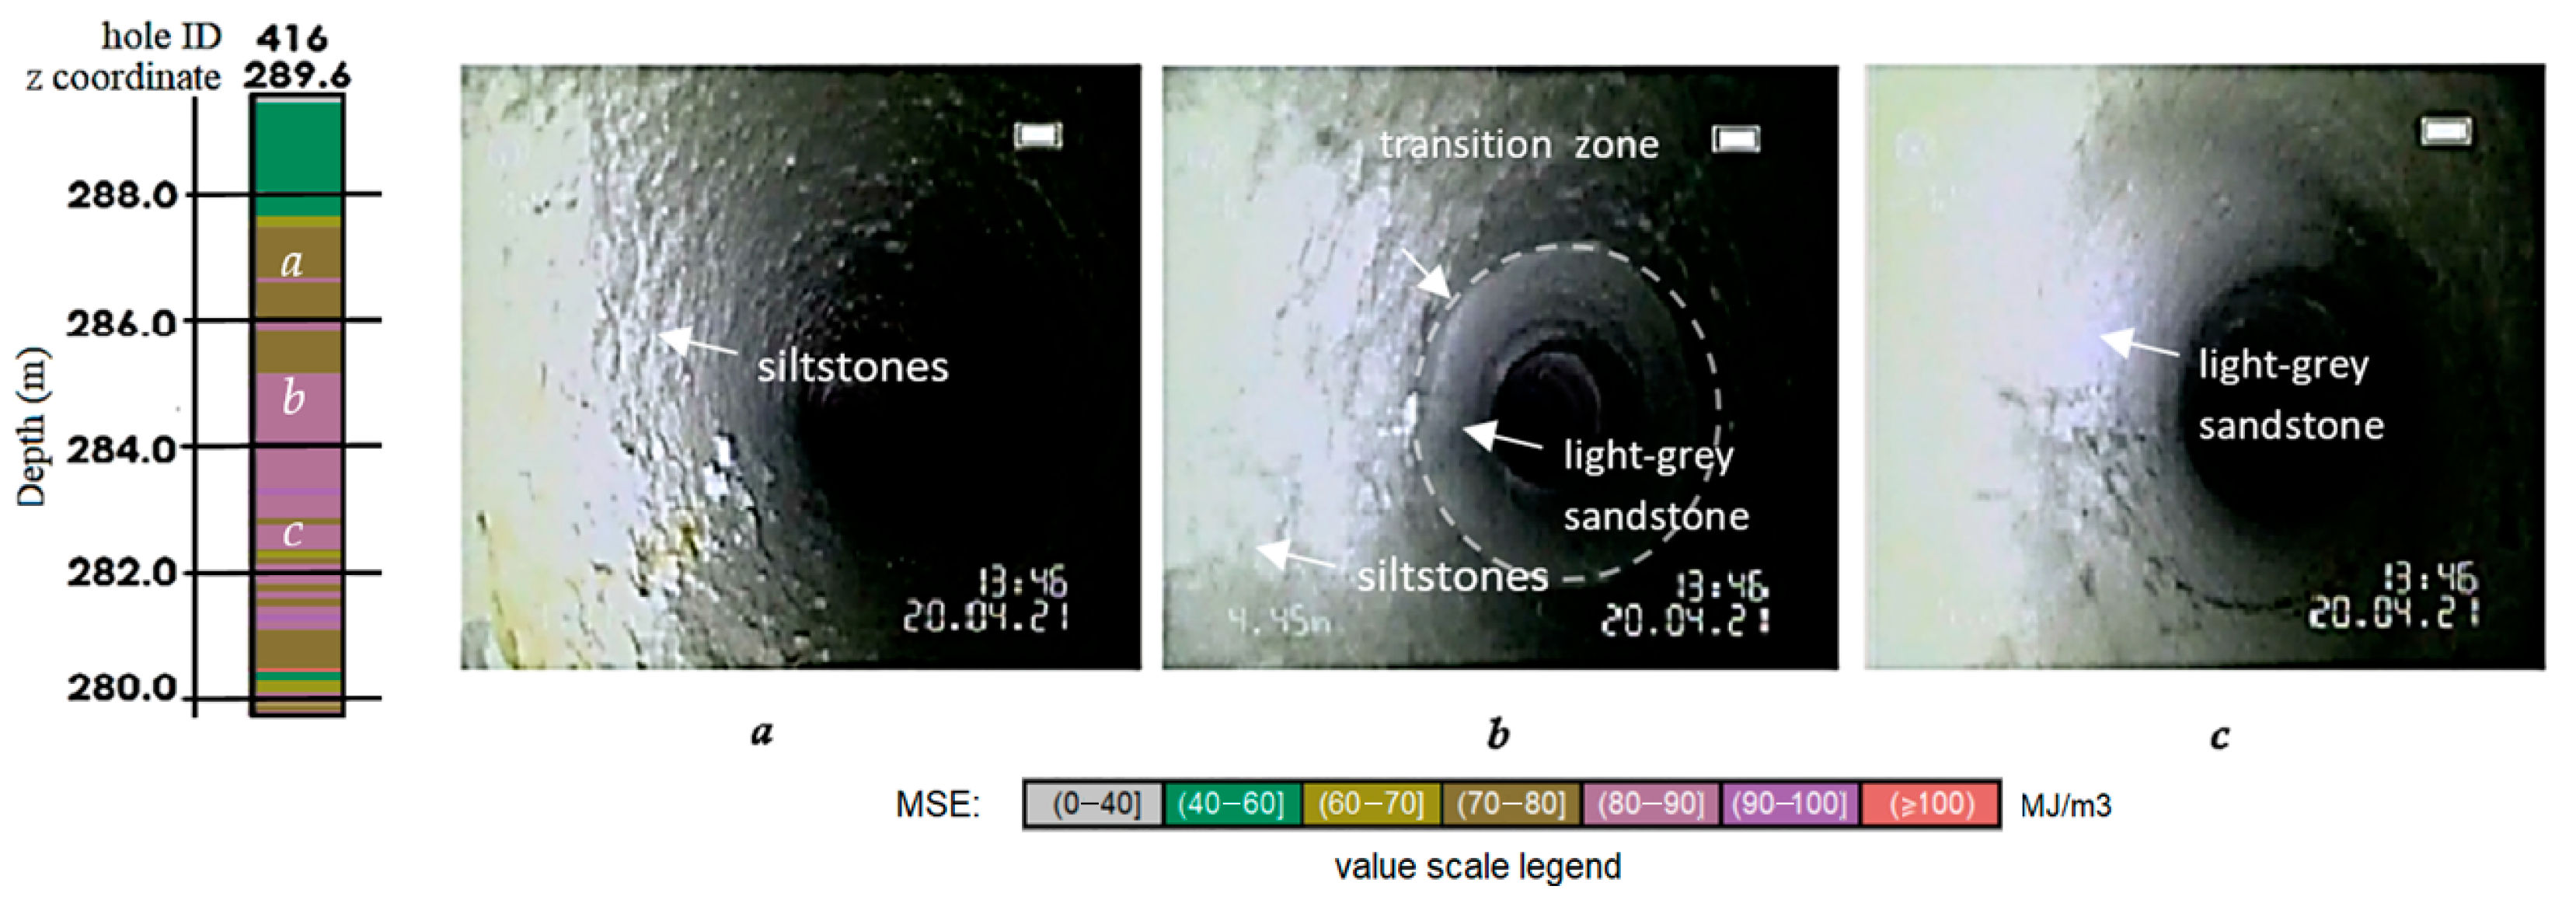
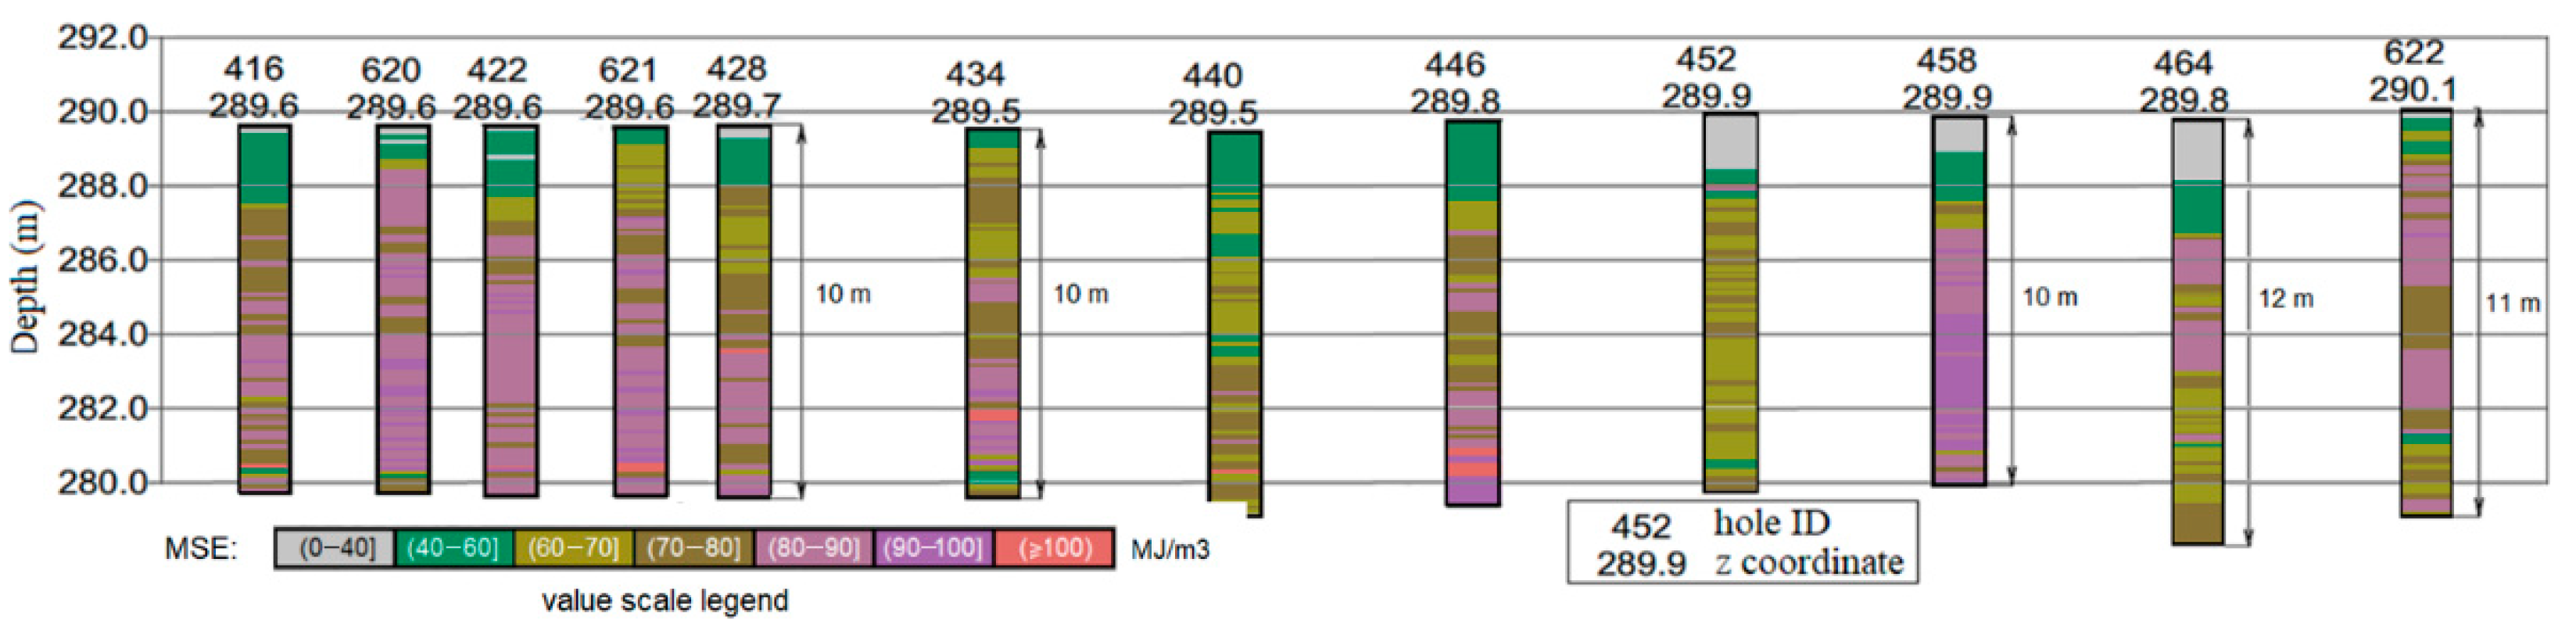
In the area of boreholes No. 415–469 in block No. N 58–70 at the Novokazansky 2 site, MSE data indicate a clear transition between different types of rocks. These boreholes were selected for endoscopic video survey in order to check the drilling response for the time lag and the lag to changes in geological rock types. The MSE data for block No. N 58–70 in level +285.8–+291.2 are presented in Figure 11.
As can be seen from the presented data, a clear transition in terms of MSE is observed in the area of boreholes No. 416–428. Rocks with relatively high MSE indicators are shown in violet.
An analysis of video endoscopy results and MSE data demonstrated an absence of delay in data transmission from the MWD system in the process of comparing measurement depths and the presence of an actual response to changes in the rock mass.
4. Analysis of Drilling Response to Changes in the Rock Mass and Discussion
The measured data were checked for their response to drilling rocks with open and partially open fractures. In the case of the drilling equipment under consideration, two of the most significant parameters for assessing the drilling response were penetration rate [57,58] and torque [59]. In their turn, penetration rate and torque can reflect both geological changes and the presence of zones with structural heterogeneities [60]. As a rule of thumb, in soft rocks, the penetration rate is quite high, and the torque is relatively low. In hard and very hard rocks, there is an opposite drilling response—the penetration rate is lower, and the torque is higher. Thus, zones of structural heterogeneities can be identified based on drilling data, depending on the duration and periodicity of a set of parameters. Some results of estimating the drilling response to changes in the rock mass are presented below.
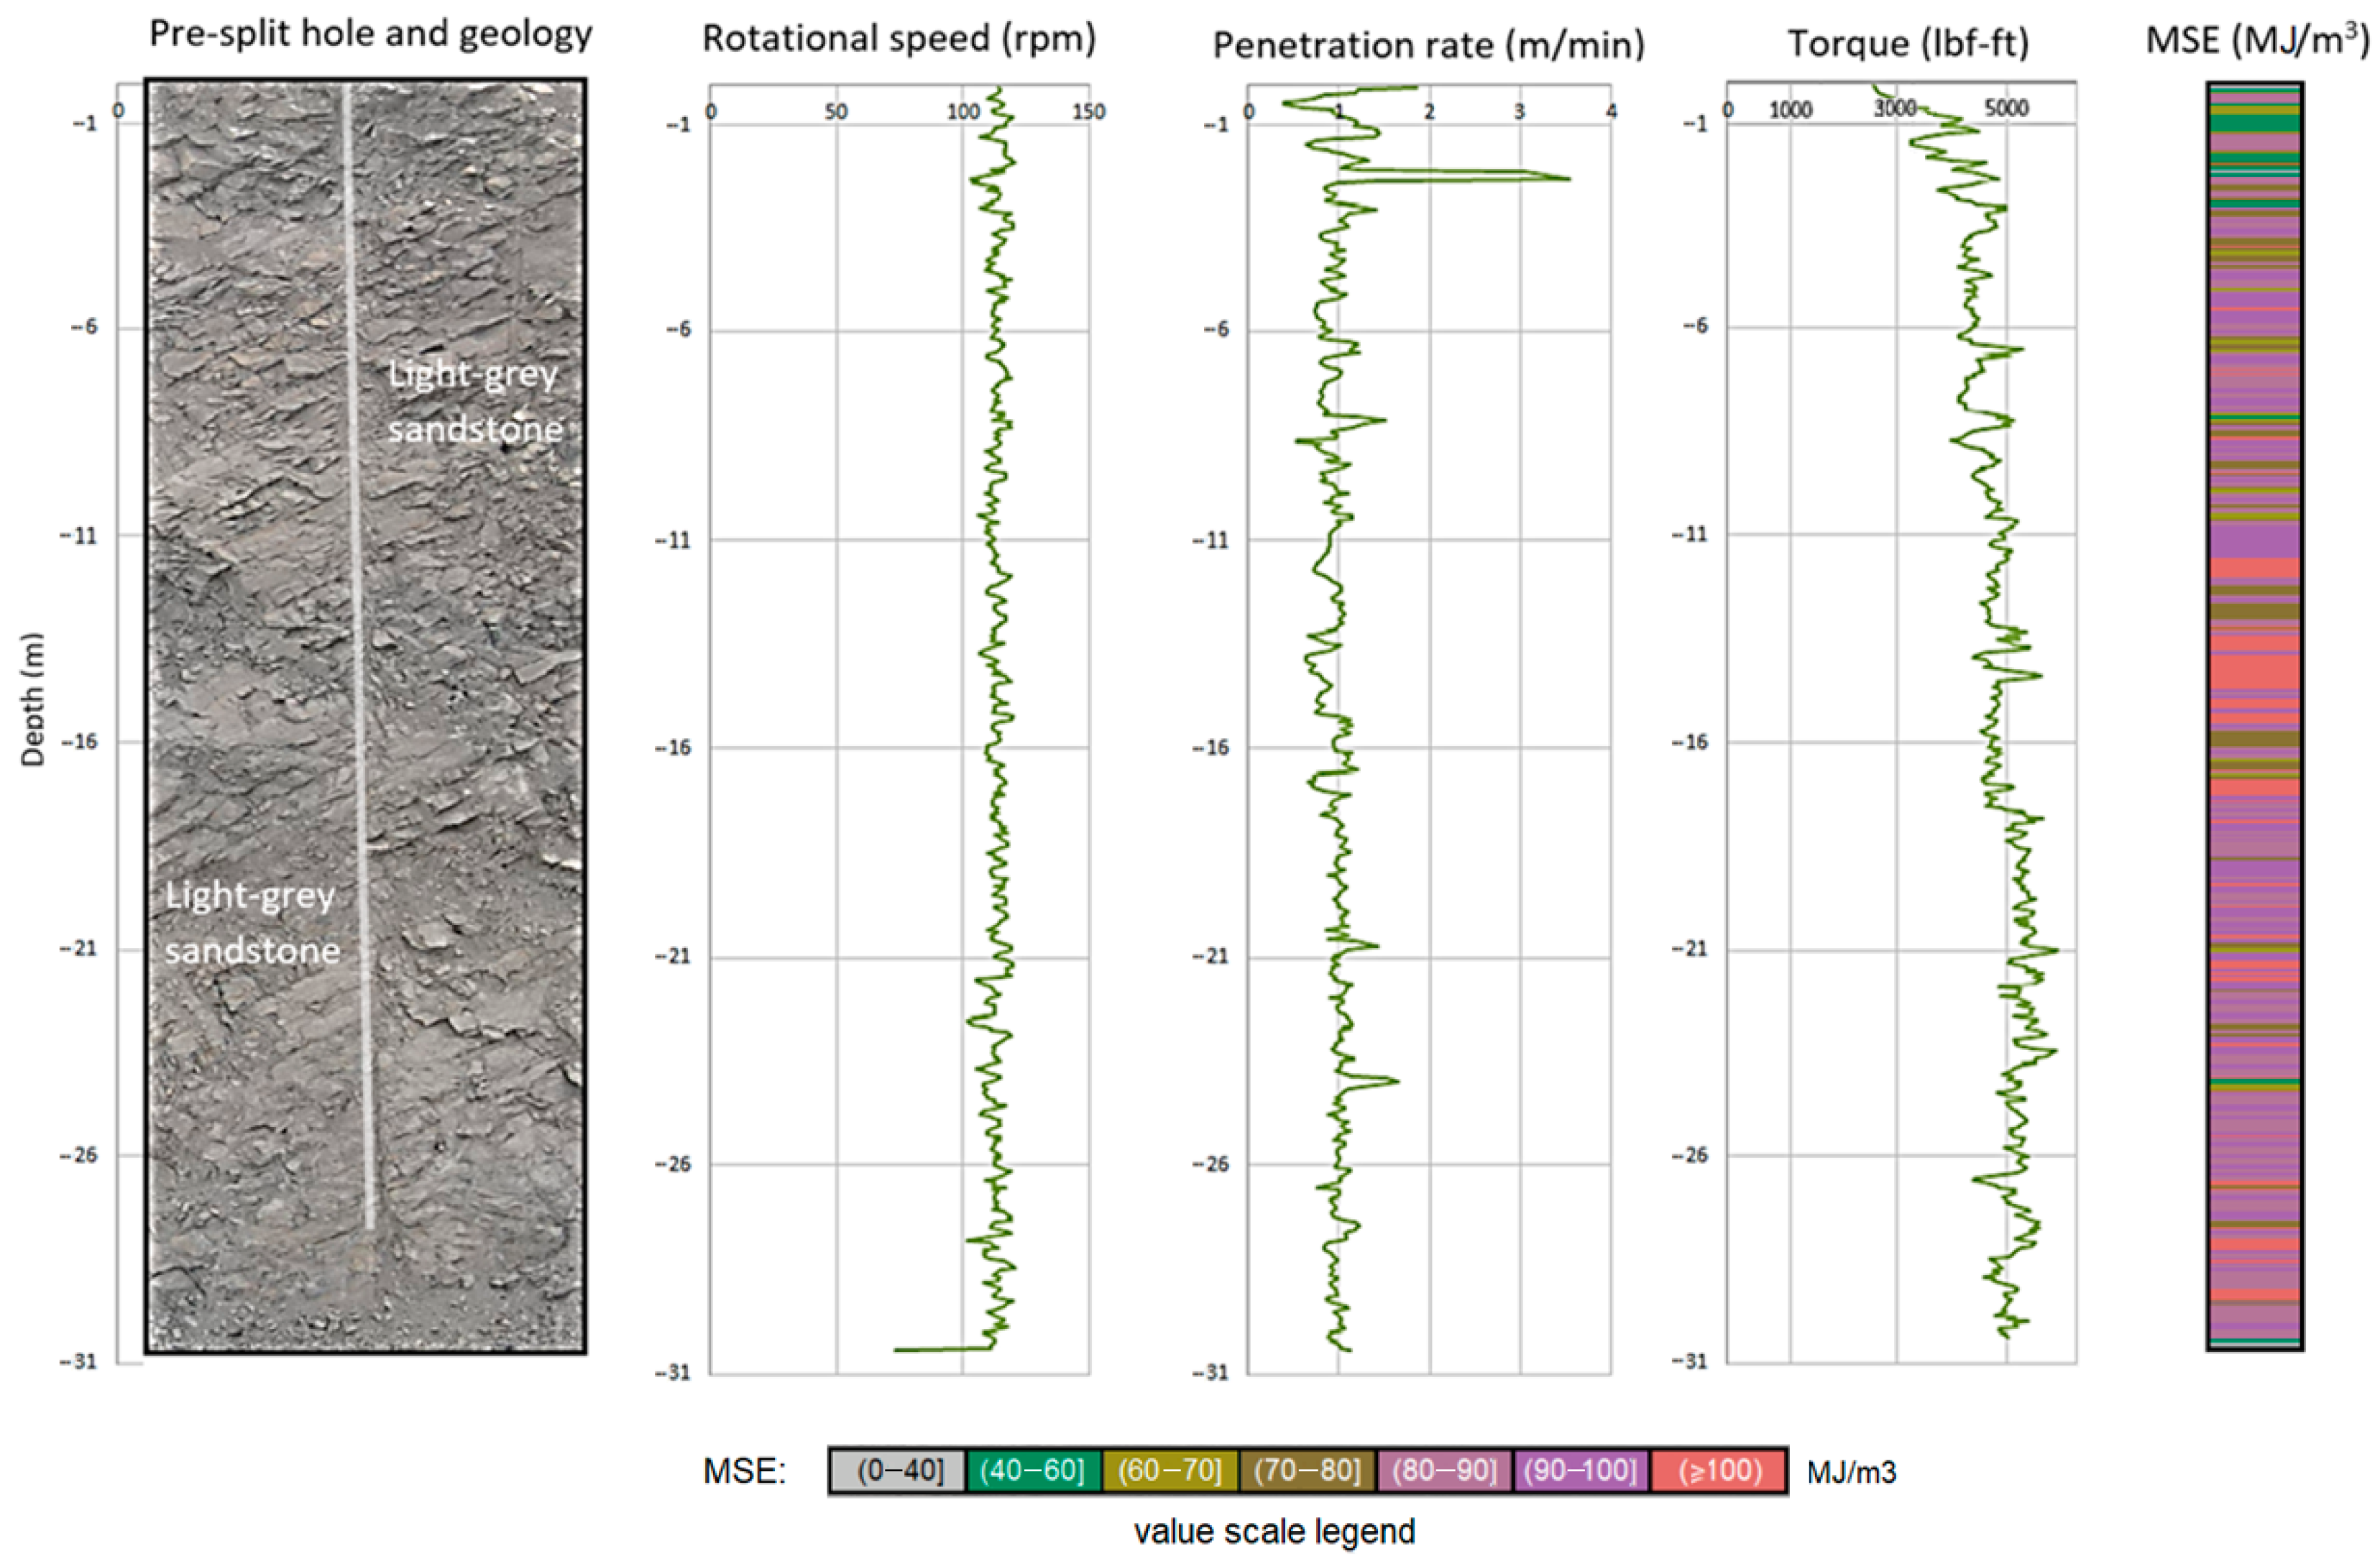
Figure 12 shows the behavior of MWD data when the borehole is drilled in the rocks with closed and small-aperture fractures. Under these conditions, penetration rate and rotation pressure produce a very weak response to fractures, dislocations and cavities intersecting the boreholes. When the above-mentioned disturbances are encountered during drilling, these parameters demonstrate a minor increase. Since the aperture of the indicated heterogeneities is not very apparent, an increase in the parameters is barely noticeable. The average penetration rate equals 1 m/min and reaches up to 1.5 m/min (a peak in the collaring stage is disregarded), as the borehole crosses some heterogeneities and interlayers. On the plot, there are practically no obvious changes in rotation pressure values.
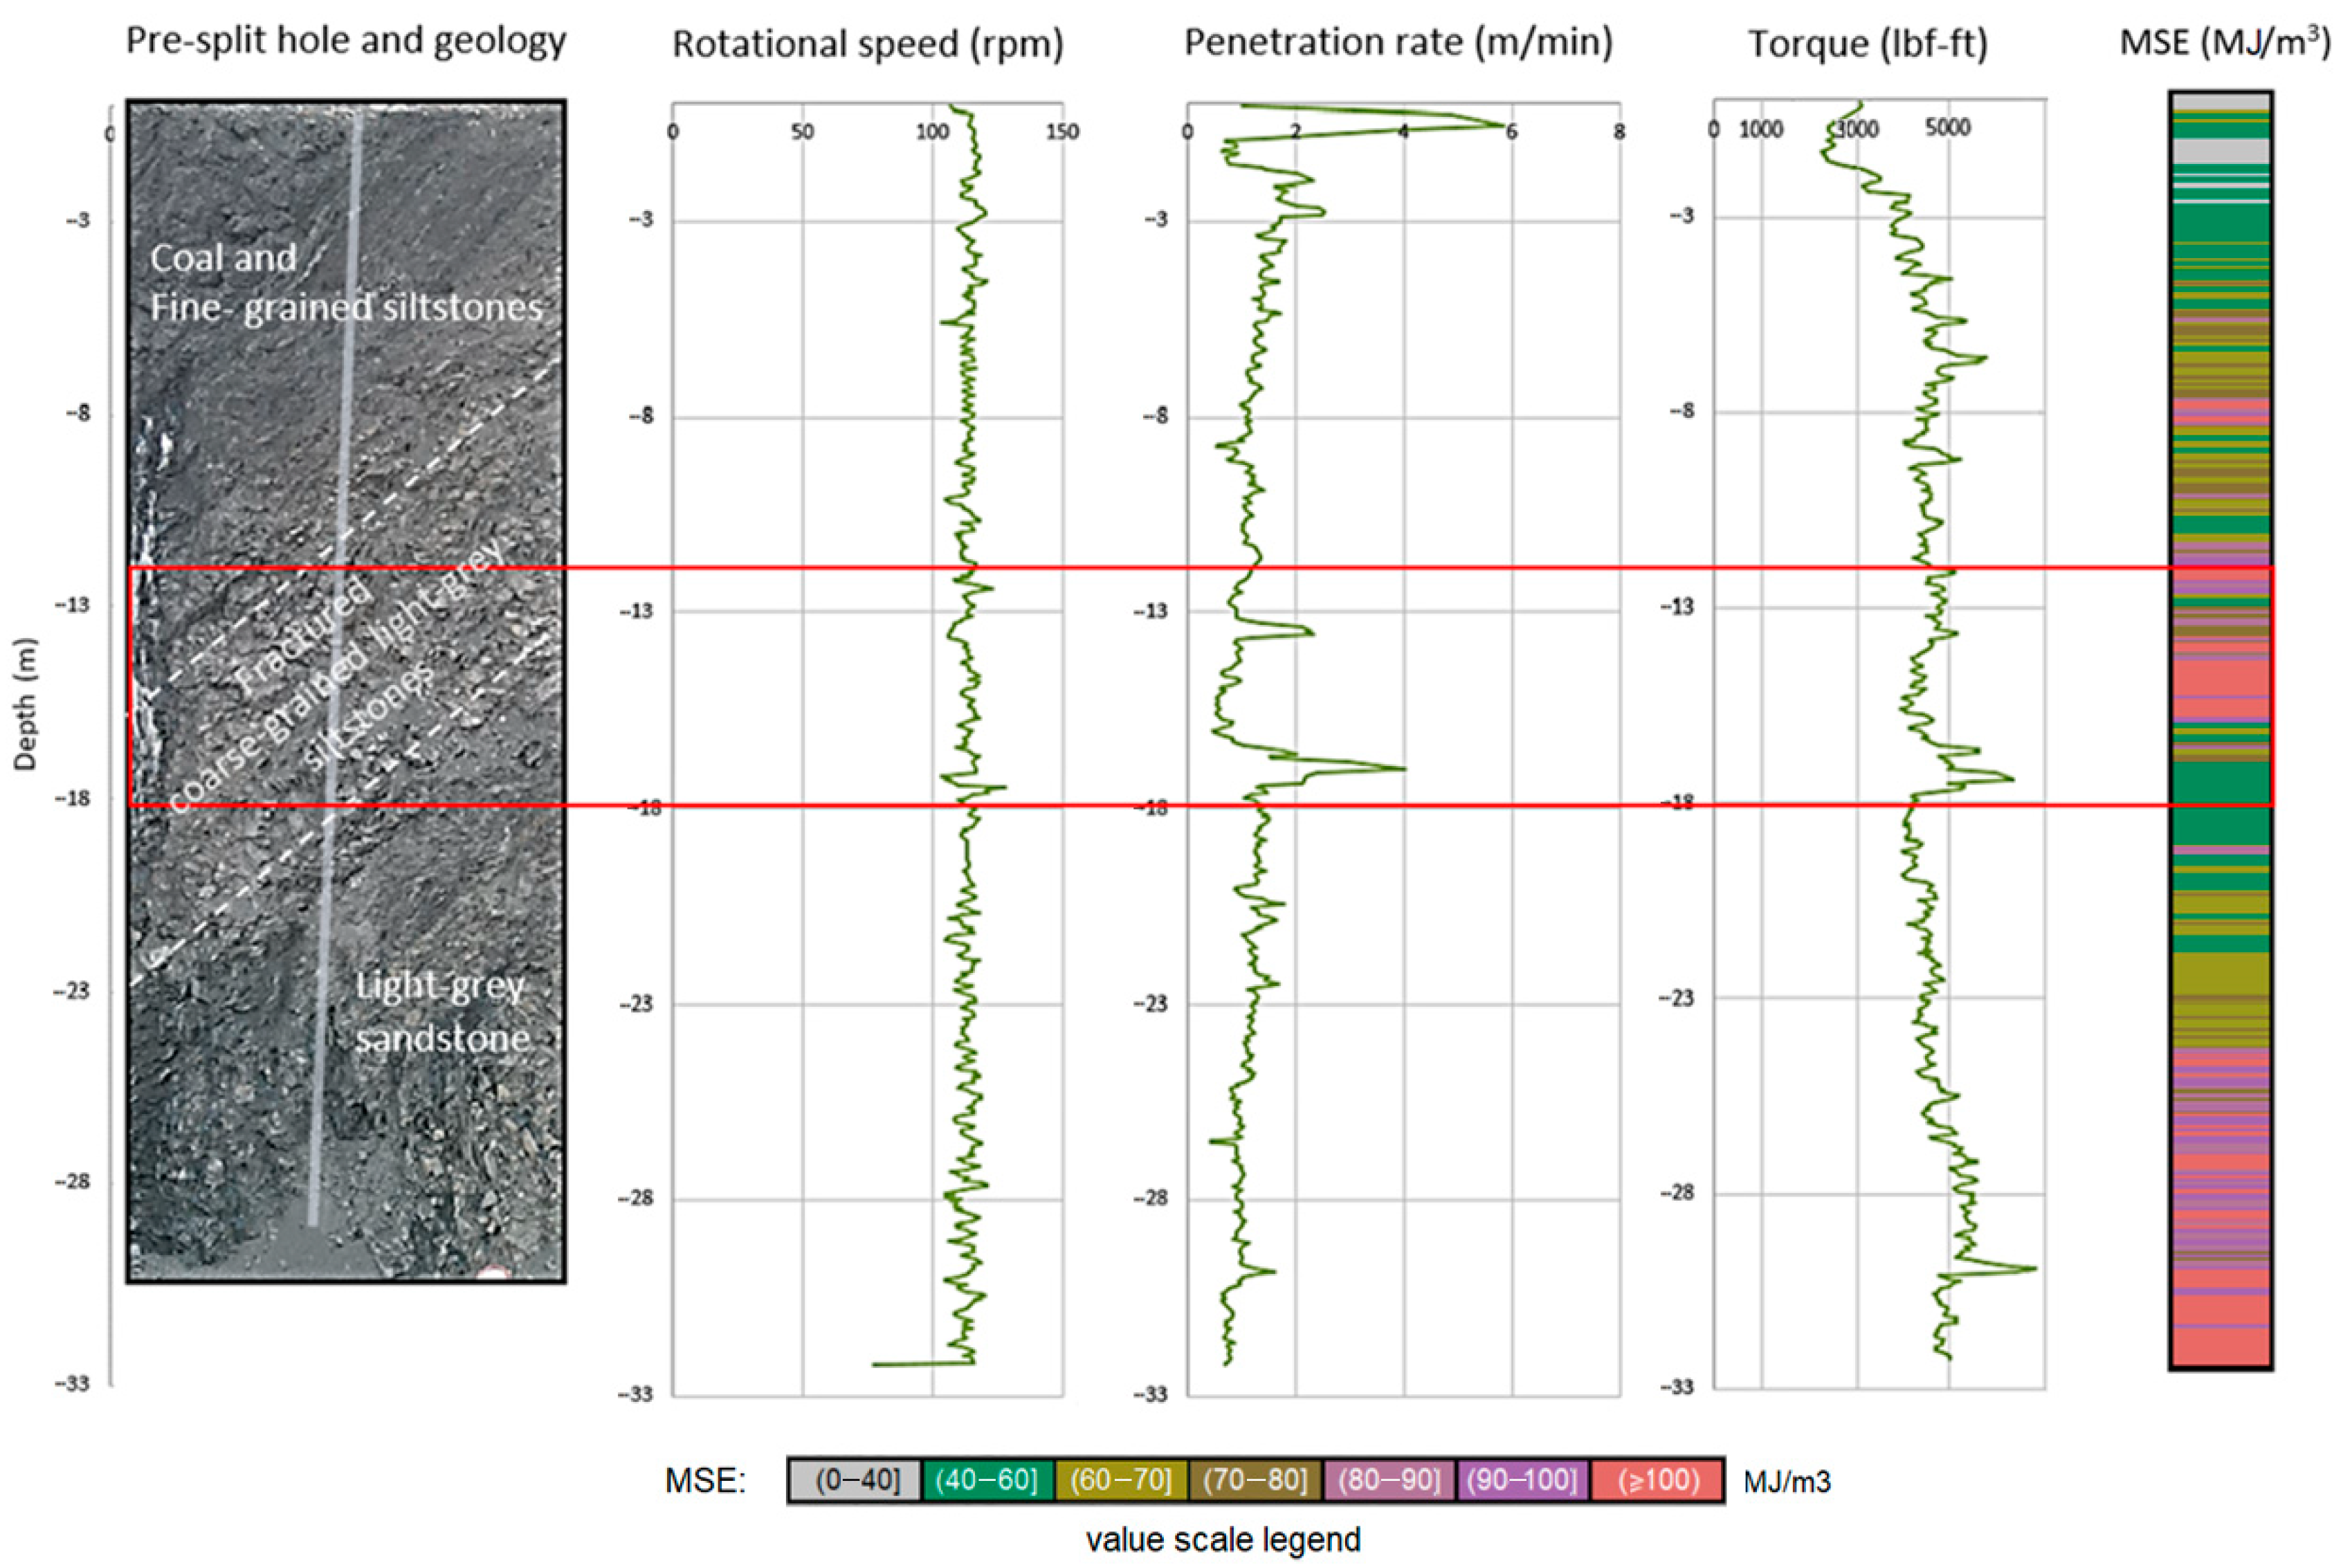
Figure 13 shows another type of MWD data response, indicated by an area of noisy data with fluctuations of all measured parameters. According to the plot, this occurs when the blast hole intersects zones of disturbance, fractures and cavities, as well as in places where there is no visible trace of the pre-split blast hole.
In this case, fluctuations of MWD data last longer than the ones associated with fractures or rock changes (borehole No. 479). This may result from the presence of fracture zones or highly disturbed rocks that make MWD data fluctuate so much. An analysis of MWD data for borehole No. 479, presented in Figure 13, shows that when the drilling tool moved into this zone, the value of torque increased. On the image of the wall (on the left), it is clearly visible that this interlayer has a high fracture density near the examined section of the borehole. This indicates that a low MSE value must be a response to fractured rock.
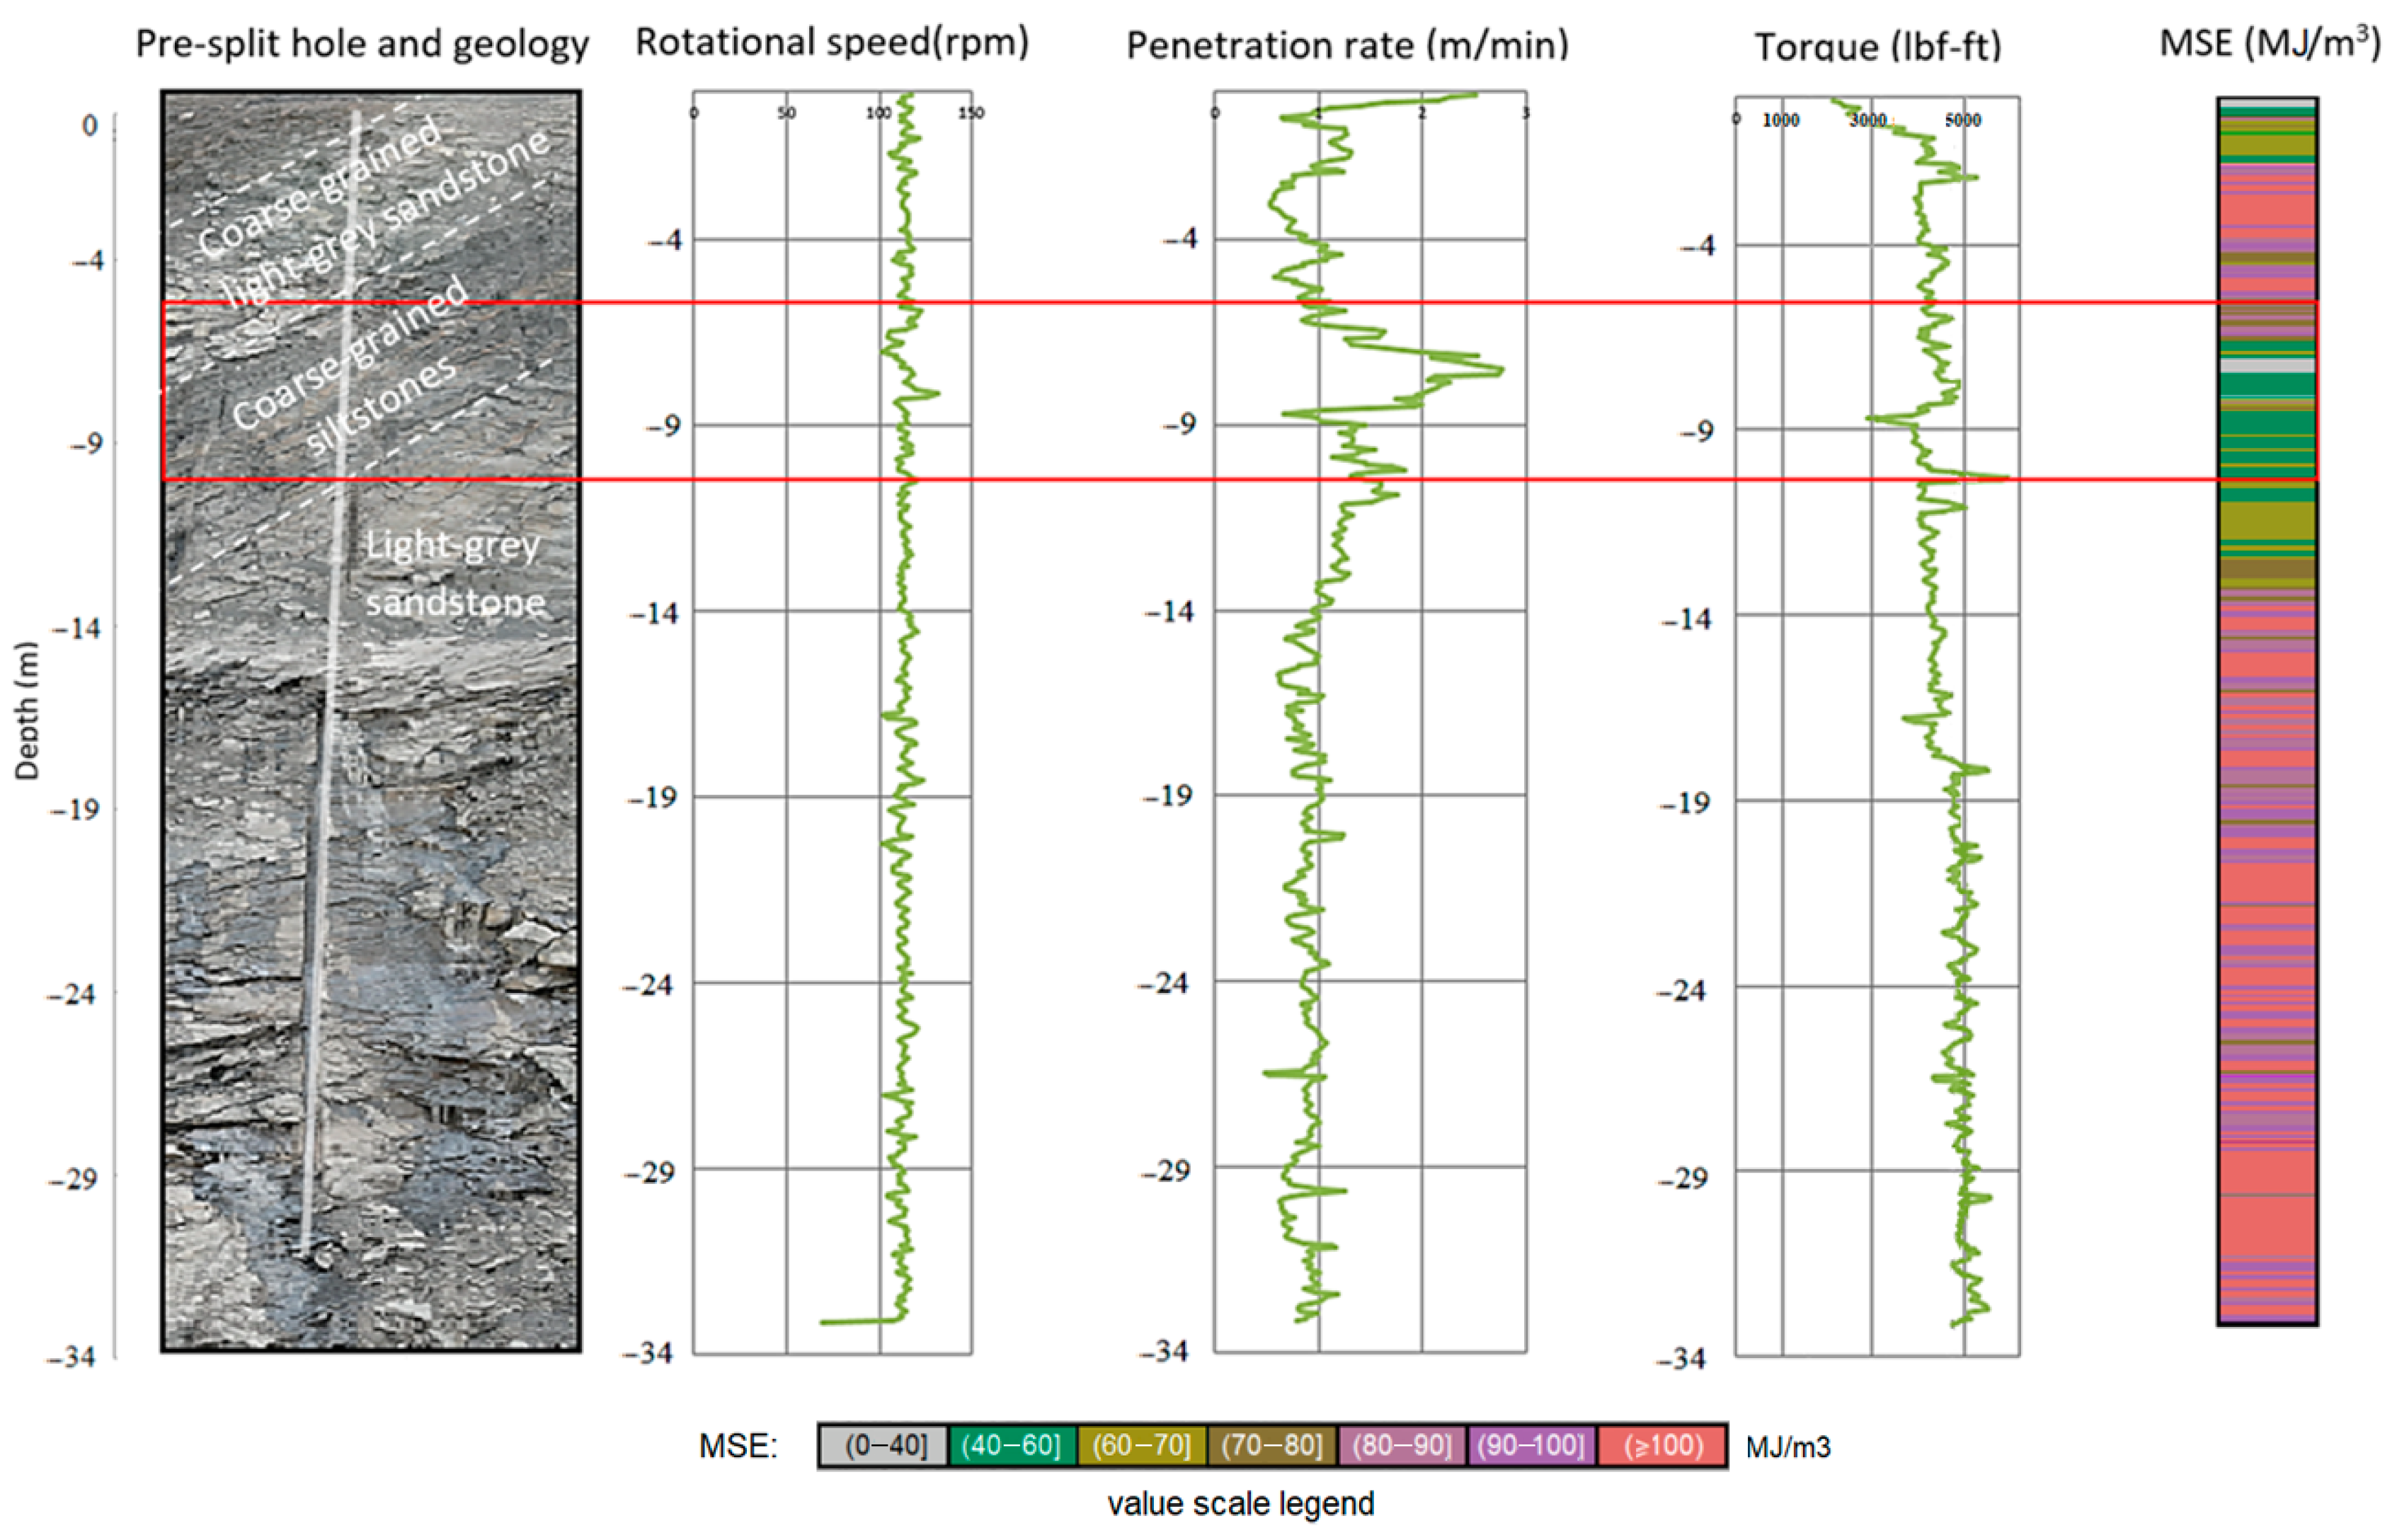
A third type of behavior, which characterizes MWD data, occurs when drilling is performed in stratified rocks or in the rock mass with closely spaced bedding planes (borehole No. 475). The plot shows an area of increased penetration rate for a section of the borehole (Figure 14). There is practically no increase in the torque value.
It can be seen from the plots presented in Figure 14 that heterogeneities do not cause sharp fluctuations in MWD data. There is a characteristic peak in the penetration rate as a result of drilling through the fractures/abutment joints, marked in red; however, the remaining area is characterized by the almost constant behavior of intersecting bedding planes. Statistically, the average value of penetration rate increases up to 3 m/min, which is indicative of low rock strength.
5. The Future Direction of Research
After the analysis of MWD data and their verification, it is possible to estimate the actual response of drilling equipment to changes and the possibility of collecting “clean” data in order to build a “parent” training database for machine learning algorithms. At the same time, special attention should be paid to zones of structural faults. Areas of such kind carry information about the state of the rock mass, namely, about its integrity. Their identification is crucial for a more detailed consideration of such zones in the process of building fragmentation models or calculating the parameters of drilling and blasting operations. It is possible to identify such zones using the MSE indicator combined with various methods of data verification, which allow for a deeper understanding of the drilling response to changes in the rock mass.
To develop the full picture regarding the presence of such zones in the formation, existing geological information can be verified and made more specific by means of its comparison and co-interpretation with MSE and MWD data. After that, it becomes possible to assess in which case parameter changes are caused by rock transitions and when they result from the presence or absence of fractures in the rock mass.
Subsequently, it becomes possible to rely on the obtained dependencies and conduct basic training of the machine learning algorithm, which in its own turn will allow developing block models of the studied rock mass, identifying rock transitions and fracture zones without the need for manual data analysis.
This paper presents results of data collection and verification associated with the block “MWD Data”–“Physical and Mechanical Rock Properties and Rock Structure”. The position of these results in the global context of the entire project can be seen in Figure 15. The recording of MWD parameters and their comparison to calculated MSE values demonstrate that co-interpretation of these data allows for a deeper understanding of geological changes and faults in the local massif.
Of course, it should be understood that at each stage collection of data for the training dataset should be accompanied by constant verification of obtained values. In this study, two verification methods are described: video endoscopy, which assesses the adequacy of the constructed MSE model, and UAV scanning of the bench wall, which provides geological information about lithology and rock structure.
Video endoscopy is a useful method for exploring zones of structural heterogeneities, and it is planned to continue its use in subsequent stages of the project. In the current paper, its results are presented only conceptually, as the man focus was on pre-split holes, which were already blasted, and their MWD data.
So far, the main purpose was to demonstrate the procedure for “clean” data collection. In the future, after collecting a large database with regular replenishment, assessing the rock mass on the basis of MWD data and verifying obtained zones by means of endoscopy, it is planned to use the predictions of a machine-learning algorithm to build a block model of structural heterogeneities based not only on MSE values but also on MWD data. This will allow making a transition to the following stages of the project, namely, to the blocks “Physical and Mechanical Rock Properties and Rock Structure”–“Drilling and Blasting Parameters”–“Particle Size Distribution in the Muck Pile”. These stages will also involve the collection of clean data, e.g., in order to compare model predictions to the actual particle size distribution, one can combine UAV data and the information obtained by photoplanimetry of shovel buckets, free faces, transportation vessels and conveyor belts. It should be noted that the presented list of MWD data (bottom hole pressure, rotational speed, penetration rate, torque) is not exhaustive; larger sets of MWD parameters can also be used to train machine learning algorithms and obtain high-accuracy models.
6. Conclusions
Measurement while drilling (MWD) is gaining widespread use in the mining industry all around the world. However, the use of MWD data to improve production processes is still not fully realized, as changes in MWD parameters and their relationship to the characteristics of the rock mass are not yet completely understood. The analysis used to describe rock behavior by means of traditional research methods or remote sensing techniques is mainly based on studying the exposed part of the rock mass. In case of proper application, MWD data can be used to significantly improve the description of rock behavior since the data allows to explore the rock mass from within.
An analysis of the data obtained during the research, including MWD parameters, photogrammetry of bench walls and video endoscopy of the boreholes, showed that the system of MWD provides an actual response to changes in the rock mass, such as rock transitions, the presence of fractures and disturbances, etc. Based on this, a conclusion can be made that it is advisable to use such systems in the mining industry to improve the quality of drilling and blasting operations.
However, due to heterogeneity of MWD data and their complexity—as the drilling equipment responds both to changes in the rock type and to the presence of heterogeneities in the rock mass—it is impossible to use only one indicator, e.g., MSE, to fully assess the state of the rock mass. For a more accurate assessment of the reasons behind the changes in parameter values, it is suggested to compare and co-interpret drilling energy intensity and MWD data.
The joint assessment of both indicators allows for the most accurate identification of the state and structure of rock mass. However, due to the high labor intensity of such analysis, it becomes impossible to perform it manually. In this regard, there is a need to use additional tools, such as neural networks and machine learning.
According to the latest research, machine learning methods used to predict various aspects of blasting operations are superior to traditional mathematical and statistical methods of forecasting not only in accuracy but also in computational speed. Combining this tool with real-time MWD data will reduce the cost of detailed exploration of mining and geological characteristics of the rock mass, increase the efficiency of drilling and blasting operations, and improve the quality of their implementation.
Author Contributions
Methodology, project administration, validation—V.I.; resources, data curation—E.M., S.S., K.K. and T.F.; supervision—S.S.; formal analysis, validation—A.V.; software, visualization—T.F.; writing—original draft preparation—V.I. and E.M.; writing—review and editing—V.I. All authors have read and agreed to the published version of the manuscript.
Funding
This research was funded by grant of the President of the Russian for state support of young Russian scientists-candidates of sciences (MK-3770.2021.4).
Data Availability Statement
The data presented in this study are available on request from the corresponding author. The data are not publicly available due to privacy.
Acknowledgments
We are very grateful to Oleg Kazanin for assistance and technical support, to Kseniya Sidirova for invaluable contribution in the field of methodological and documentary support.
Conflicts of Interest
The authors declare no conflict of interest.
References
- Nedosekin, A.O.; Antonova, I.V. Risk identification and analysis in a mining company using fuzzy logical methods. In Proceedings of the 19th International Conference on Soft Computing and Measurements, SCM, St. Petersburg, Russia, 25–27 May 2016; pp. 540–541. [Google Scholar]
- Kuvshinkin, S.Y.; Ivanova, P.V. Developing a methodology for estimation of excavation techniques for given operating conditions. IOP Conf. Ser. Earth Environ. Sci. 2019, 378, 012121. [Google Scholar] [CrossRef]
- Glazunov, V.V.; Gorodnova, E.V.; Efimova, N.N.; Kulikov, A.I.; Kulikova, N.V. Geophysical Monitoring of Changes in the Condition of the Embankment Base of a Road by Soil Stabilization Using Explosion Energy. In Proceedings of the 14th Engineering and Mining Geophysics Conference, Almaty, Kazakhstan, 23–27 April 2018; pp. 1–9. [Google Scholar]
- Protosenya, A.G.; Verbilo, P.E. Research of compression strength of fissured rock mass. J. Min. Inst. 2017, 223, 51–57. [Google Scholar]
- Chebyshev, I.; Legkokonets, V.; Lukin, S. Specifics of mechanical and strength rock properties estimation for wells drilling and exploitation. Procedia Struct. Integr. 2017, 6, 252–258. [Google Scholar]
- Kholodilov, A.N.; Gospodarikov, A.P. Modeling Seismic Vibrations under Massive Blasting in Underground Mines. J. Min. Sci. 2020, 56, 29–35. [Google Scholar] [CrossRef]
- Vokhmin, S.A.; Kurchin, G.S.; Shevnina, E.V.; Kirsanov, A.K.; Kostylev, S.S. Granulometric composition predicting models after explosion in open-pit mining. News High. Inst. Min. J. 2020, 1, 14–24. (In Russian) [Google Scholar] [CrossRef]
- Nguyen, H.; Bui, X.N.; Tran, Q.H.; Van Hoa, P.; Nguyen, D.A.; Hoa, L.T.T.; Le, Q.T.; Do, N.H.; Bao, T.D.; Bui, H.B.; et al. A comparative study of empirical and ensemble machine learning algorithms in predicting air over-pressure in open-pit coal mine. Acta Geophys. 2020, 68, 325–336. [Google Scholar] [CrossRef]
- Gospodarikov, A.P.; Morozov, K.V.; Revin, I.E. A method of data interpretation in seismicity and deformation monitoring in underground mining in terms of the Kukisvumchorr deposit of Apatit company. Miab. Min. Inf. Anal. Bull. 2019, 8, 157168. (In Russian) [Google Scholar] [CrossRef]
- Jang, H.; Topal, E. Areview of soft computing technology applications in several mining problems. Appl. Soft Comput. 2014, 22, 638–651. [Google Scholar] [CrossRef]
- Ouchterlony, F.; Sanchidrián, J.A. A review of development of better prediction equations for blast fragmentation. J. Rock Mech. Geotech. Eng. 2019, 11, 1094–1109. [Google Scholar] [CrossRef]
- Kulatilake, P.; Qiong, W.; Hudaverdi, T.; Kuzu, C. Mean particle size prediction in rock blast fragmentation using neural networks. Min. Geol. Eng. 2010, 114, 298–311. [Google Scholar] [CrossRef]
- Bahrami, A.; Monjezi, M.; Goshtasbi, K.; Ghazvinian, A. Prediction of rock fragmentation due to blasting using artificial neural network. Eng. Comput. 2011, 27, 177–181. [Google Scholar] [CrossRef]
- Segui, J.; Higgins, M. Blast design using measurement while drilling parameters. Fragblast 2002, 6, 287–299. [Google Scholar] [CrossRef]
- Vezhapparambu, V.S.; Ellefmo, S.L. Change point analysis of MWD-data to detect the broken ground thickness in open pit mining. In Proceedings of the International Association for Mathematical Geosciences (IAMG), Perth, Australia, 2–9 September 2017. [Google Scholar]
- Isheyskiy, V.; Sanchidrián, J.A. Prospects of Applying MWD Technology for Quality Management of Drilling and Blasting Operations at Mining Enterprises. Minerals 2020, 10, 925. [Google Scholar] [CrossRef]
- Manoj, K.; Monjezi, M. Prediction of flyrock in open pit blasting operation using machine learning method. Int. J. Min. Sci. Technol. 2013, 23, 313–316. [Google Scholar] [CrossRef]
- Vezhapparambu, V.S.; Eidsvik, J.; Ellefmo, S.L. Rock classification using multivariate analysis of measurement while drilling data: Towards a better sampling strategy. Minerals 2018, 8, 384. [Google Scholar] [CrossRef] [Green Version]
- Zou, B.; Wang, J.; Luo, Z.; Hu, L. Intelligent Control of Smooth Blasting Quality in Rock Tunnels Using BP-ANN, ENN, and ANFIS. Geofluids 2021, 2021, 1–24. [Google Scholar]
- Rosales-Huamani, J.A.; Perez-Alvarado, R.S.; Rojas-Villanueva, U.; Castillo-Sequera, J.L. Design of a Predictive Model of Rock Breakage by Blasting Using Artificial Neural Networks. Symmetry 2020, 12, 1405. [Google Scholar] [CrossRef]
- Azimi, Y.; Osanloo, M.; Aakbarpour-Shirazi, M.; Aghajani Bazzazi, A. Prediction of the blast ability designation of rock masses using fuzzy sets. Int. J. Rock Mech. Min. Sci. 2010, 47, 1126–1140. [Google Scholar] [CrossRef]
- Jalalifar, H.; Mojedifar, S.; Sahebi, A.A. Prediction of rock mass rating using fuzzy logic and multivariable RMR regression model. Int. J. Min. Sci. Technol. 2014, 24, 237–244. [Google Scholar] [CrossRef]
- Aydin, A. Fuzzy set approaches to classification of rock masses. Eng. Geol. 2004, 74, 227–245. [Google Scholar] [CrossRef]
- Yegireddi, S.; Uday Bhaskar, G. Identification of coal seam strata from geophysical logs of borehole using adaptive neuro-fuzzy inference system. J. Appl. Geophys. 2009, 67, 9–13. [Google Scholar] [CrossRef]
- Manoj, K.; Monjezi, M. Prediction of backbreak in open-pit blasting operations using the machine learning method. Rock Mech Rock Eng. 2013, 46, 389–396. [Google Scholar]
- Kadkhodaie-Ilkhchi, A.; Monteiro, S.T.; Ramos, F.; Hatherly, P. Rock recognition from MWD data: A comparative study of boosting, neural networks, and fuzzy logic. IEEE Geosci. Remote Sens. Lett. 2010, 7, 680–684. [Google Scholar] [CrossRef]
- Yang, L.; Jin, R.; Mummert, L.; Sukthankar, R.; Goode, A.; Zheng, B.; Hoi, S.C.; Satyanarayanan, M. A boosting framework for visuality-preserving distance metric learning and its application to medical image retrieval. IEEE Trans. Pattern Anal. Mach. Intell. 2010, 32, 30–44. [Google Scholar] [CrossRef] [Green Version]
- Wong, P.; Bruce, A.; Gedeon, T. Confidence bounds of petrophysical predictions from conventional neural networks. IEEE Trans. Geosci. Remote Sens. 2002, 40, 1440–1444. [Google Scholar] [CrossRef]
- Navarro, J.; Segarra, P.; Sanchidrián, J.A.; Castedo, R.; Pérez Fortes, A.P.; Natale, M.; Lopez, L.M. Application of an in-house MWD system for quarry blasting. In Proceedings of the 12th International Symposium on Rock Fragmentation by Blasting, Fragblast 12, Luleå, Sweden, 11–13 June 2018; pp. 203–207. [Google Scholar]
- Van Eldert, J. Analysis of Excavation Damage, Rock Mass Characterization and Rock Support Design Using Drilling Monitoring. Ph.D. Thesis, University of Technology, Luleå, Sweden, 2019. [Google Scholar]
- Khorzoughi, M.B. Use of Measurement while Drilling Techniques for Improved Rock Mass Characterization in Open-Pit Mines. Master’s Thesis, University of British Columbia, Vancouver, BC, Canada, 2013. [Google Scholar]
- Schunnesson, H. Drill Process Monitoring in Percussive Drilling for Location of Structural Features, Lithological Boundaries and Rock Properties, and for Drill Productivity Evaluation. Ph.D. Thesis, Luleå University of Technology, Luleå, Sweden, 1997. [Google Scholar]
- Schunnesson, H. RQD Predictions Based on Drill Performance Parameters. Int. J. Tunn. Undergr. Spacetechnol. 1996, 11, 345–351. [Google Scholar] [CrossRef]
- Brown, E.T.; Barr, M.V. Instrumented Drilling as an Aid to Site Investigations. In Proceedings of the 3rd International Congress of the International Association of Engineering Geology, Madrid, Spain, 4–8 September 1978; pp. 21–28. [Google Scholar]
- Teale, R. The Concept of Specific Energy in Rock Drilling. Int. J. Rock Mech. Min. Sci. Geomech. Abstr. 1965, 2, 57–73. [Google Scholar] [CrossRef]
- Tangaev, I.A. Drillability and Blastability of Rocks; Subsoil: Moscow, Russia, 1978; 184p. (In Russian) [Google Scholar]
- Kosolapov, A.I. Modern Methods and Tools for Determining Drillability and Blastability of Rocks. IOP Conf. Ser. Earth Environ. Sci. 2020, 459, 022097. [Google Scholar] [CrossRef]
- Zharikov, S.N. About how to Study the Properties of Soil to Improve the Efficiency of Drilling and Blasting. Bull. Kuzbass State Tech. Univ. 2016, 6, 3–6. [Google Scholar]
- Regotunov, A.S.; Sukhov, R.I. The Results of Studies of Strength Properties of Local Arrays in the Drilling Process using software and hardware complex. Subsoil Use Probl. 2016, 4, 121–129. [Google Scholar]
- El-Biblawi, M.; Sayed, M.; Mohamed, M.; EL-Rawy, W. Some drilling parameters as a tool to predict different categories of rocks. J. Eng. Sci. 2007, 35, 995–1008. [Google Scholar] [CrossRef]
- Sandvik Mining and Rock Technology. Available online: https://go.rocktechnology.sandvik/l/490131/2019-03-14/2h7vt5 (accessed on 29 April 2021).
- Epiroc. Available online: https://www.epiroc.com/content/dam/epiroc/rotary-blasthole-drill-rigs/russian-brochures/Epiroc%20DML.pdf (accessed on 1 May 2021).
- Zifra (Vistgroup). Available online: https://vistgroup.ru/upload/iblock/34f/VG_Drill_RUS.pdf (accessed on 26 August 2020).
- GEOMIX. IT-Solutions for Mining. Available online: https://geomix.ru (accessed on 5 May 2021).
- Manzoor, S.; Liaghat, S.; Gustafson, A.; Johansson, D.; Schunnesson, H. Establishing relationships between structural data from close-range terrestrial digital photogrammetry and measurement while drilling data. Eng. Geol. 2020, 267, 105480. [Google Scholar] [CrossRef]
- Van Eldert, J.; Schunnesson, H.; Saiang, D.; Funehag, J. Improved filtering and normalizing of Measurement-While-Drilling (MWD) data in tunnel excavation. Tunn. Undergr. Space Technol. 2020, 103, 103467. [Google Scholar] [CrossRef]
- Navarro, J. The Use of Measure while Drilling for Rock Mass Characterization and Damage Assessment in Blasting. Ph.D. Thesis, Universidad Politécnica de Madrid—E.T.S.I. Minas y Energía (UPM), Madrid, Spain, 2018. [Google Scholar]
- Navarro, J.; Seidl, T.; Hartlieb, P.; Sanchidrián, J.A.; Segarra, P.; Couceiro, P.; Schimek, P.; Godoy, C. Blastability and Ore Grade Assessment from Drill Monitoring for Open Pit Applications. Rock Mech. Rock Eng. 2021, 54, 3209–3228. [Google Scholar] [CrossRef]
- Bamford, T.; Medinac, F.; Esmaeili, K. Continuous Monitoring and Improvement of the Blasting Process in Open Pit Mines Using Unmanned Aerial Vehicle Techniques. Remote Sens. 2020, 12, 2801. [Google Scholar] [CrossRef]
- Assali, P.; Grussenmeyer, T.; Villemin, N.; Pollet, F. Viguier Surveying and modeling of rock discontinuities by terrestrial laser scanning and photogrammetry: Semi-automatic approaches for linear outcrop inspection. J. Struct. Geol. 2014, 66, 102–114. [Google Scholar] [CrossRef]
- DJI—Official Website. Available online: https://www.dji.com/ru/mavic-2 (accessed on 5 May 2021).
- Menegoni, N.; Giordan, D.; Perotti, C.; Tannant, D.D. Detection and geometric characterization of rock mass discontinuities using a 3D high-resolution digital outcrop model generated from RPAS imagery-Ormea rock slope, Italy. Eng. Geol. 2019, 252, 145–163. [Google Scholar] [CrossRef]
- Langford, M.; Fox, A.; Smit, R.S. Using different focal length lenses, camera kits. In Langford’s Basic Photography; Elsevier: Amsterdam, The Netherlands, 2010; pp. 92–113. [Google Scholar]
- Agisoft Metashape. Available online: https://www.agisoft.com (accessed on 14 June 2021).
- Ghosh, R. Assessment of Rock Mass Quality and Its Effects on Chargeability Using Drill Monitoring Technique. Ph.D. Thesis, University of Technology, Luleå, Sweden, 2017. [Google Scholar]
- Wöhler Technik GmbH. Available online: https://www.woehler-international.com/shop/products/inspection-systems (accessed on 27 April 2021).
- Akun, M.E.; Karpuz, C. Drillability studies of surface-set diamond drilling in Zonguldak region sandstones from Turkey. Int. J. Rock Mech. Min. 2005, 42, 473–479. [Google Scholar] [CrossRef]
- Kahraman, S.; Balci, C.; Yazici, S.; Bilgin, N. Prediction of the penetration rate of rotary blast hole drills using a new drillability index. Int. J. Rock Mech. Min. 2000, 37, 729–743. [Google Scholar] [CrossRef]
- LaBelle, D. Lithological Classification by Drilling; Robotics Institute, Carnegie Mellon University: Pittsburgh, PE, USA, 2001. [Google Scholar]
- Khorzoughi, M.B.; Hall, R.; Apel, D. Rock fracture density characterization using measurement while drilling (MWD) techniques. Int. J. Min. Sci. Technol. 2018, 28, 859–864. [Google Scholar] [CrossRef]
Figure 1.
Studied sites of subsurface resources: (a)—Kyrgaysky Sredniy, block No. K 67–78; (b)—Novokazansky 2, block No. N 58–70.
Figure 1.
Studied sites of subsurface resources: (a)—Kyrgaysky Sredniy, block No. K 67–78; (b)—Novokazansky 2, block No. N 58–70.

Figure 2.
Arrangement of the studied boreholes No. 469–483 in the pre-split row (highlighted in red) of block No. K 67–78 in level +120.0–+121.0 at Kyrgaysky Sredniy site.
Figure 2.
Arrangement of the studied boreholes No. 469–483 in the pre-split row (highlighted in red) of block No. K 67–78 in level +120.0–+121.0 at Kyrgaysky Sredniy site.

Figure 3.
Arrangement of the studied boreholes No. 415–469 (highlighted in red) of block No. N 58–70 in level +285.8 to +291.2 at Novokazansky 2 site.
Figure 3.
Arrangement of the studied boreholes No. 415–469 (highlighted in red) of block No. N 58–70 in level +285.8 to +291.2 at Novokazansky 2 site.

Figure 4.
Content of the XML file with output parameters of the borehole drilling process.

Figure 5.
Average signals with depth for MWD data.

Figure 6.
Patterns of scanning boreholes No. 469–483 of the pre-split row in the block No. K 67–78. in level +120.0–+121.0.
Figure 6.
Patterns of scanning boreholes No. 469–483 of the pre-split row in the block No. K 67–78. in level +120.0–+121.0.

Figure 7.
A comparison between scanned results and available geological data.

Figure 8.
MSE distribution for blast holes in the pre-split row. Constructed borehole paths were based on the observed half-casts.
Figure 8.
MSE distribution for blast holes in the pre-split row. Constructed borehole paths were based on the observed half-casts.

Figure 9.
The block model of MSE for blast hole in the pre-split row, built-in GIS “Goemix” software based on measured drilling parameters.
Figure 9.
The block model of MSE for blast hole in the pre-split row, built-in GIS “Goemix” software based on measured drilling parameters.

Figure 10.
Video endoscopy results for borehole No. 416 of block No. N 58–70 in level +285.8 –+291.2 at Novokazansky 2 site, compared to MSE profile, where: (a) is the zone of prevailing siltstones; (b) is the zone of transition between sandstones and siltstones; (c) is the zone of prevailing sandstones.

Figure 11.
MSE profile in the area of boreholes No. 416–428 in block No. N 58–70 with depth positioning.
Figure 11.
MSE profile in the area of boreholes No. 416–428 in block No. N 58–70 with depth positioning.

Figure 12.
A dependence plot of MWD data on borehole depth for the borehole No. 469 in block No. K 67–78.
Figure 12.
A dependence plot of MWD data on borehole depth for the borehole No. 469 in block No. K 67–78.

Figure 13.
A dependence plot of MWD data on borehole depth for the borehole. No. 479 in block No. K 67–78.
Figure 13.
A dependence plot of MWD data on borehole depth for the borehole. No. 479 in block No. K 67–78.

Figure 14.
A dependence plot of MWD data on borehole depth for the borehole No. 475 in the block No. K 67–78.
Figure 14.
A dependence plot of MWD data on borehole depth for the borehole No. 475 in the block No. K 67–78.

Figure 15.
Research concept and future direction of research.


Table 1.
Hardness coefficients and drillability of the rocks.
| Typical Examples of Rocks | Category of Rocks According to a “Unified Classification” | Hardness Coefficient According to M. M. Protodyakonov (f) | ||
|---|---|---|---|---|
| Coal | Fine- and Coarse-Grained Siltstones | Coarse-Grained Light-Grey Sandstone | ||
| Kyrgaysky Sredniy | VIII–X | 3 | 5–6 | 6 |
| Novokazansky 2 | III–IV | |||
Table 2.
Intervals for filtering data.
| Recorded Parameters | Units | Range of Recorded Data | Filter Limits |
|---|---|---|---|
| Bottom hole pressure | psi | (0, 1987) | (200, 1850) |
| Rotational speed | rpm | (0, 169) | (0, 161) |
| Penetration rate | m/min | (−0.2, 18.7) | (0.1, 6) |
| Torque | lbf-ft | (0, 8901) | (500, 6880) |
Publisher’s Note: MDPI stays neutral with regard to jurisdictional claims in published maps and institutional affiliations. |
© 2021 by the authors. Licensee MDPI, Basel, Switzerland. This article is an open access article distributed under the terms and conditions of the Creative Commons Attribution (CC BY) license (https://creativecommons.org/licenses/by/4.0/).
Share and Cite
MDPI and ACS Style
Isheyskiy, V.; Martinyskin, E.; Smirnov, S.; Vasilyev, A.; Knyazev, K.; Fatyanov, T. Specifics of MWD Data Collection and Verification during Formation of Training Datasets. Minerals 2021, 11, 798. https://doi.org/10.3390/min11080798
AMA Style
Isheyskiy V, Martinyskin E, Smirnov S, Vasilyev A, Knyazev K, Fatyanov T. Specifics of MWD Data Collection and Verification during Formation of Training Datasets. Minerals. 2021; 11(8):798. https://doi.org/10.3390/min11080798
Chicago/Turabian StyleIsheyskiy, Valentin, Evgeny Martinyskin, Sergey Smirnov, Anton Vasilyev, Kirill Knyazev, and Timur Fatyanov. 2021. "Specifics of MWD Data Collection and Verification during Formation of Training Datasets" Minerals 11, no. 8: 798. https://doi.org/10.3390/min11080798
Note that from the first issue of 2016, this journal uses article numbers instead of page numbers. See further details here.