
Influence of Sea Sand on Sintering of V–Ti–Fe Concentrate—A Case Study from Indonesia


School of Metallurgy and Materials Engineering, Chongqing University of Science and Technology, Chongqing 401331, China
*
Authors to whom correspondence should be addressed.
Minerals 2021, 11(8), 793; https://doi.org/10.3390/min11080793
Submission received: 10 May 2021
/
Revised: 15 July 2021
/
Accepted: 19 July 2021
/
Published: 22 July 2021
(This article belongs to the Special Issue Ferroalloy Minerals Processing and Technology)
Abstract
:This study explores the feasibility of Indonesian sea sand in replacing V–Ti–Fe concentrate for sintering. The influence of different additive proportions of Indonesian sea sand on sintering index and sinter properties is examined in a laboratory by adjusting the substitution proportion from 5% to 40%. Results imply that vertical sintering speed and utility factor show an apparent decreasing trend, but drum strength, finished product rate and returned fine rate are not significantly affected with the increase in the proportion of Indonesian sea sand and with the decrease in the proportion of V–Ti–Fe concentrate. With the increase in the proportion of sea sand, the reduction degradation index of sinter at low temperatures declines sharply from 65% to 31%, the grade of sinter and content of TiO2 changes slightly, and the reduction degradation and degree decline. Unlike V–Ti–Fe concentrate, Indonesian sea sand does not perform well in sintering, and the substitution proportion should not exceed 35%.
1. Introduction
Generally, heavy mineral sands are deposits of dense minerals that accumulate with sand, silt, and clay in coastal plains [1]. Sea sand is a type of heavy sand mine; its source is not only basalt lava flushed by sea water, but also the weathering of igneous and metamorphic rocks. It is mainly distributed in New Zealand, Indonesia, the Philippines and Malaysia. As a low-to-medium-grade titanic iron ore-contained resource, the grade of Indonesian sea sand is lower than 58%, but the TiO2 content reaches over 9%, and mainly includes titanohematite, titanomagnetite, ilmenite (FeTiO3), limonite, pyroxene and other minerals [2,3]. Although sea sand has abundant reserves, stable iron content, is easily mined, and has low mining and transportation costs, sea sand contains high vanadium and titanium content, compact structure, high hardness, and high melting point, and it has not yet been effectively used on a large scale [4,5,6]. Therefore, sea sand is regarded as a new vanadium and titanium resource, and some scholars have proposed using sea sand instead of high-quality iron ore for sintering production to reduce production costs [7,8,9].
Sintering is an oxidative process where particles can be fused to form a solid form by heating at temperatures that are below the melting point [10,11,12]. In the metallurgical industry, sintering is a pre-treatment for iron ores before they are sent to a blast furnace for further refining to produce metallic iron [13]. The quality of sinter is closely related to the normal production of blast furnace, so the intensive investigation for the application of sea sand for sintering has been investigated by researchers. The effect of sea sand on sintering and sinter quality has been studied, and the results show that sinter reducibility improves moderately but the low temperature reduction degradation index (RDI) worsens with the increase in the proportion of sea sand in the mixture. Research findings also reveal that the proportion of sea sand in the mixture should not exceed 20% [14,15,16,17,18,19]. A study by Gao et al. [4] showed that when the basicity (R) increased from 1.4 to 2.3, the coefficient of sintering effectiveness decreased from 1.63 t/(m2·h) to 1.44 t/(m2·h) and the rate of finished products after sintering decreased from 78.5% to 75.3%. Cheng et al. [20] investigated the effects of high proportion unground sea sand ore on the preparation process and reduction performance of oxidized pellets. The results showed that when the amount of unground sea sand ore used was 40%, pellets can still be used as a blast furnace burden material. Previous studies are mainly focused on the influence of adding sea sand in common iron ore fines on sintering and sinter quality. These studies overlooked that the composition of Indonesian sea sand is very close to that of V–Ti–Fe concentrate; the particle size of Indonesian sea sand is much coarser than that of V–Ti–Fe concentrate, while the uniformity of the former is better than that of the latter.
In this study, the authors conducted a sinter-pot test to explore the effect of Indonesian sea sand on sintering and sinter metallurgical properties when used to replace V–Ti–Fe concentrate. The authors also probe into the feasibility of adding Indonesian sea sand during sintering of V–Ti–Fe concentrate, thereby offering an empirical prediction and technical support for properly using Indonesian sea sand during sintering.
2. Materials and Methods
2.1. Materials
The iron ores used in this study include V–Ti–Fe concentrate, sea sand, 6 types of iron ores (ores A–F) and returned fines. The V–Ti–Fe concentrate is defined and comes from Panzhihua, Southwest China’s Sichuan province. The coke and other raw materials for sintering were obtained from Chongqing Iron & Steel Co., Ltd. of China.
2.2. Ore Blending Scheme
Table 1 illustrates the ore blending scheme. By increasing sea sand and decreasing V–Ti–Fe concentrate, this study analyzes sinter quality based on the additive proportion of sea sand (0%, 5%, 15%, 25%, 35% and 45%). The binary basicity of sinter is controlled at R = 2.00, the water content in mixture at 6.8%, and the coke percentage at 4.10%.
2.3. Methods
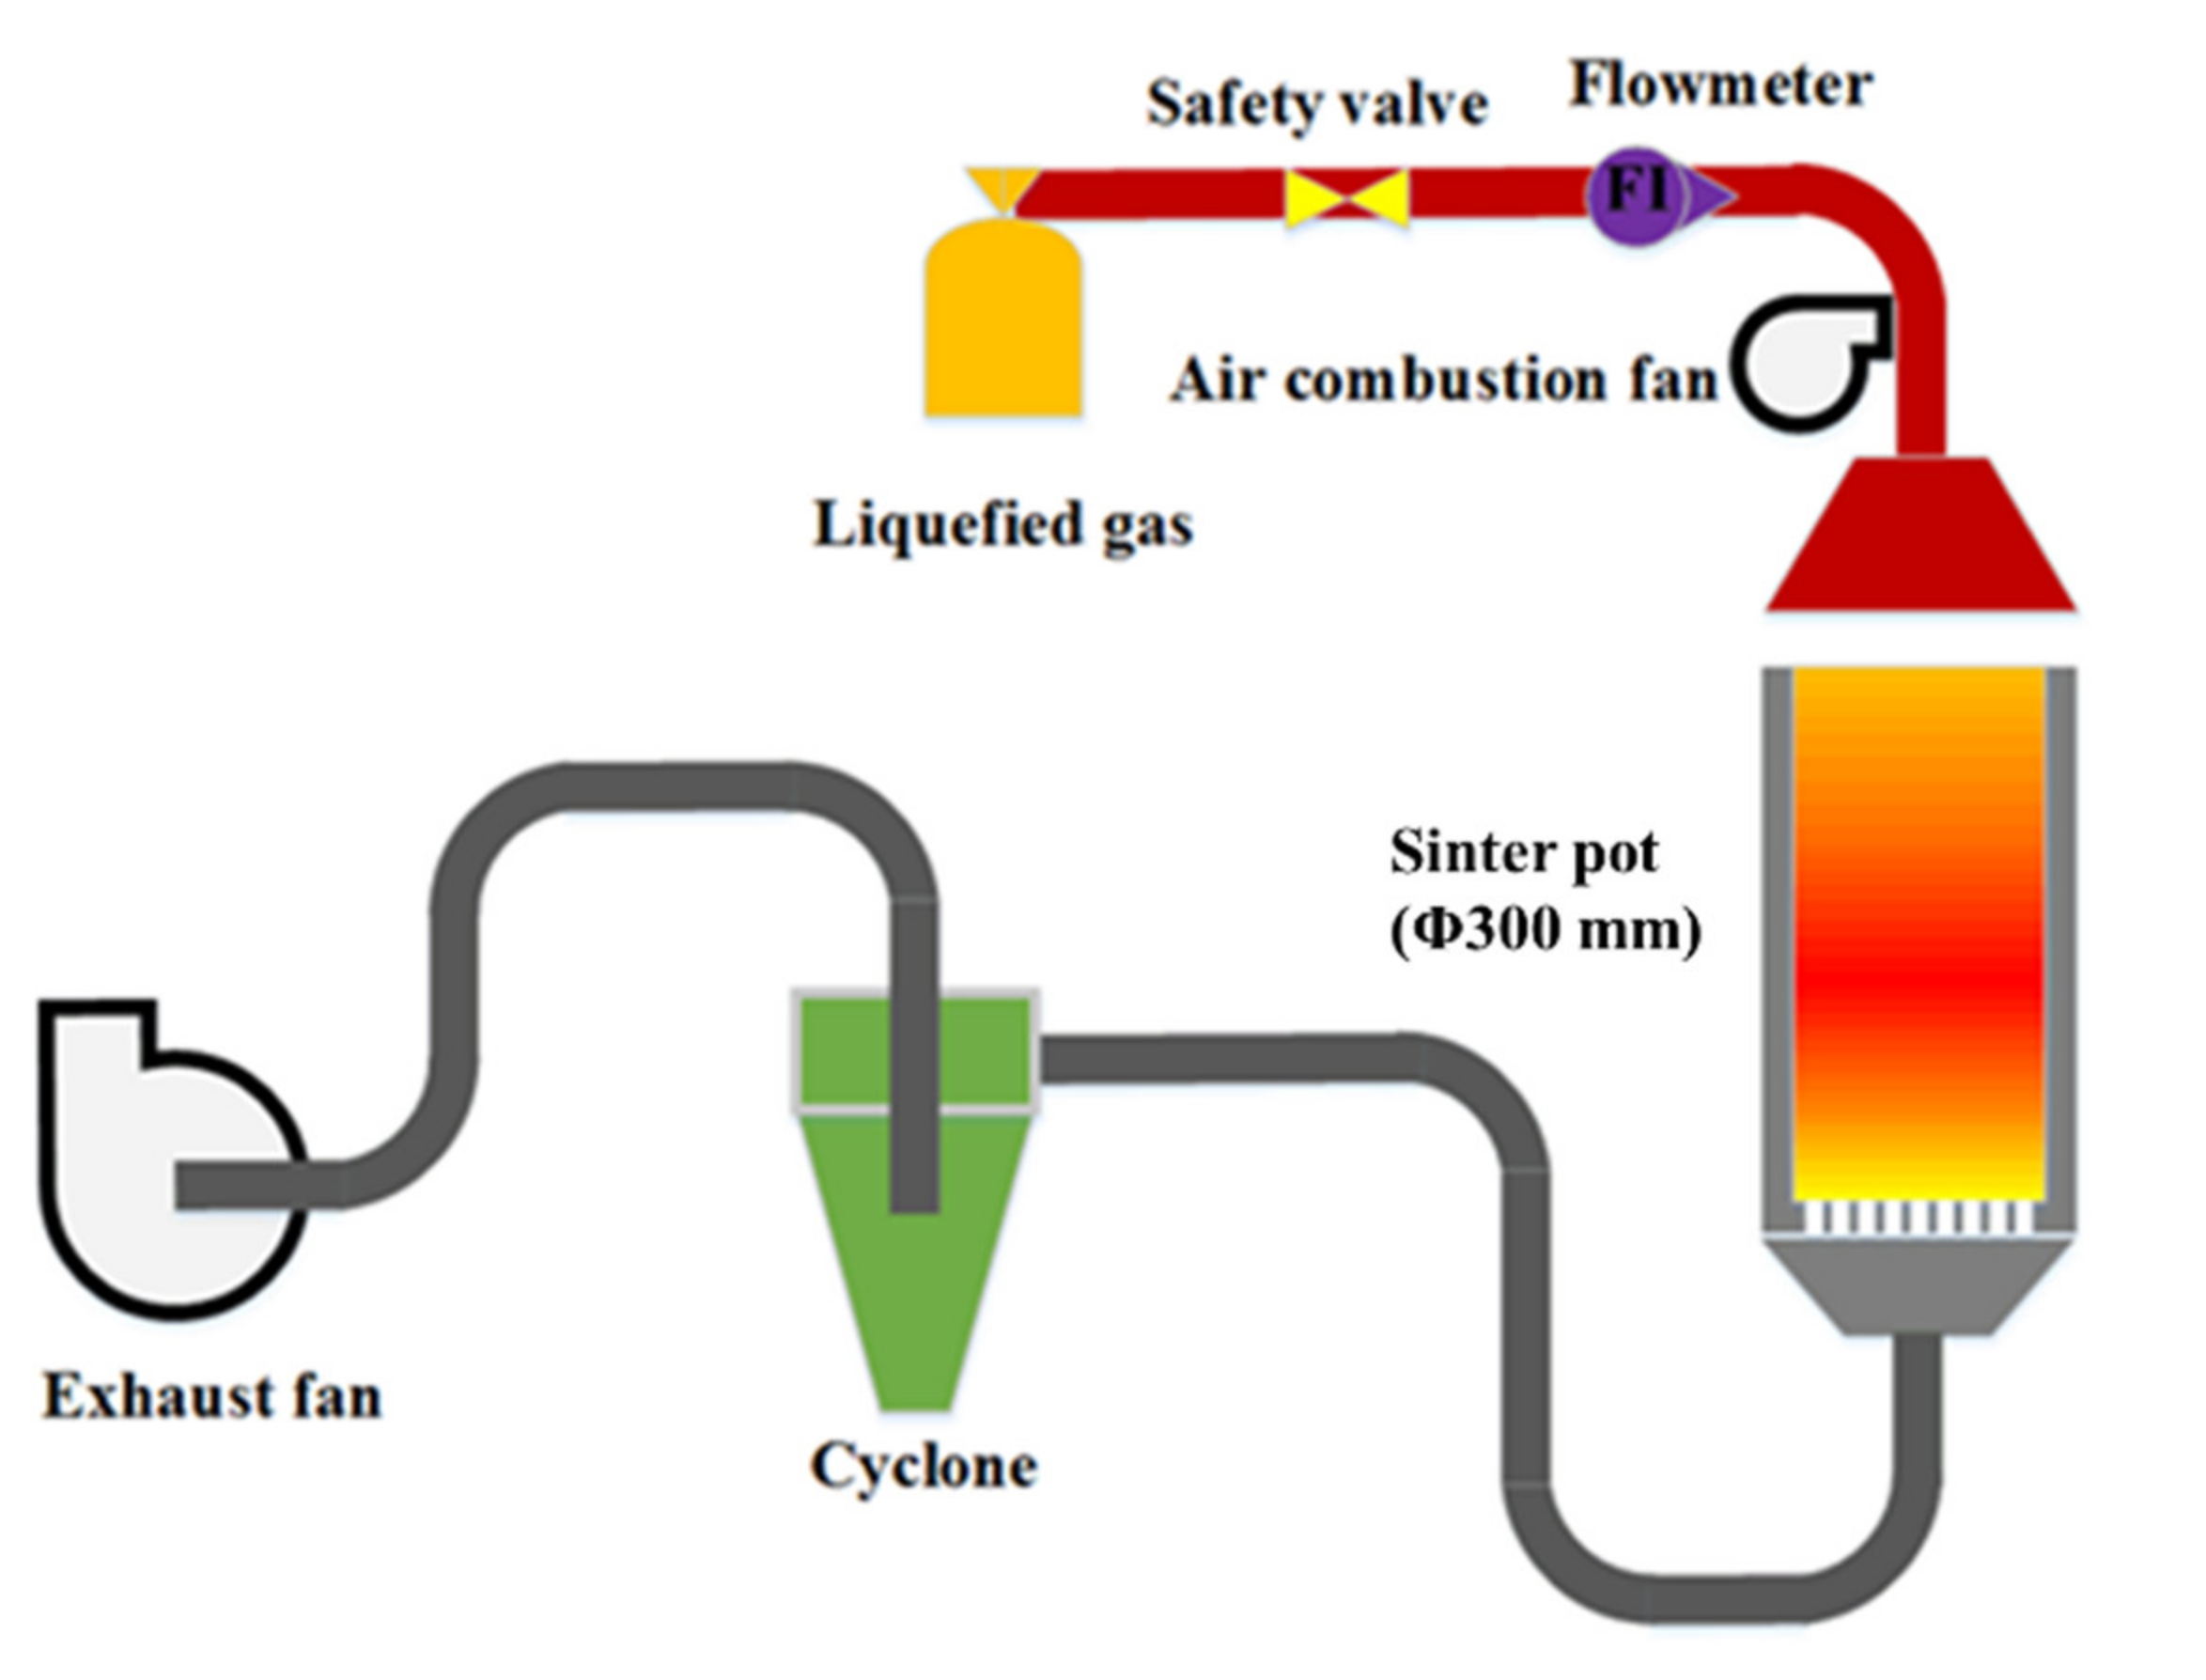
In this study, a laboratory sinter pot was employed to investigate the influence of Indonesian sea sand on sintering and sinter metallurgical property. Figure 1 shows the device used for the sinter-pot test, and Table 2 lists the process parameters for the test. The size of the sinter pot was 300 mm × 680 mm, and the thickness of the sinter bed was 650 mm. In order to improve air flow between ore particles in the pot and protect stainless steel mesh at the bottom of the sinter pot, 2 kg sinter (particle size: 6~10 mm) was added into the sinter pot before introduction into the sinter mixture. The sinter ignition temperature was controlled at 1050 °C, the negative pressure for ignition was at 8 kPa, and the negative pressure for the air draft was at 16 kPa. Following sintering, the sinter was screened at 40 mm, 25 mm, 16 mm, 10 mm, and 5 mm. The +5 mm fractions were ‘product sinter’, and the −5 mm fractions were termed as ‘sinter return’. The product sinter was then tested to determine the chemical composition, mineralogical analysis, and physical and metallurgical properties. The property parameters of sinter are defined as follows [21]:
- Finished product rate—the proportion of sinters in the total produced sinter mixtures.
- Yield (P) rate—the ratio of the mass of product sinter (i.e., +5 mm sinter) to the total mass of sinter produced.
- Sintering speed—the average speed value obtained by dividing the thickness of the sintering mixture bed by the sintering time.
- Drum strength (T)—15 kg of product sinter is placed in a drum device and sieved after 200 revolutions (Chinese Industrial Standard, GB 8209-87). The proportion of samples with a particle size greater than 6.3 mm in the total is the drum strength.
- Utility factor—the output of sintered ore per hour per unit of effective exhaust area.
- Return rate—the ratio of the mass of sinter return to the total mass of sinter produced.
- The reduction degree (RI)—the RI of sinter was tested by Chinese Industrial Standard (GBT 13241-2017), and requires 500 g of 10–12.5 mm sinter that was put into a reduction tube, and heated to 900 °C under the protection of N2. After the temperature became stable, the reduction gas (CO 30%, N2 70%) was introduced into the reduction tube with a flow rate of 15 L/min. The sample was reduced for 180 min at 900 °C, the mass was recorded every 3 min, and the quality at first 20 min, then every 10 min, followed by introducing N2 to protect the sample cooled down to ambient temperature.
- The low temperature reduction degradation index (RDI)—the RDI was tested by GBT 13242-2017. First, 500 g of 10.0–12.5 mm sinter is reduced at 500 °C for 60 min; the standard flow rate of the reducing gas (CO 20%, CO2 20%, N2 60%) is 15 L/min. The sinter was then loaded into a drum (130 mm × 200 mm) and rotated at a speed of 30 r/min for 10 min, followed by screening. The ratio of the mass +3.15 mm fractions to the total mass of sinter was used for the test.
The chemical composition or elements of iron ores and sinter were determined by X-ray fluorescence spectrometer (XRF). In order to study the difference in particle size distribution of the two raw materials, 100 g of samples were selected and placed in mesh sieves of different meshes for sieving, and finally the mass of samples with different particle sizes was weighed. Mineralogical analysis of samples was performed by a Zeiss Axioskop 40 optical mineralogical microscope, which was characterized with a LEICA Q500 image analyzer. Furthermore, the microstructures of sea sand and V–Ti–Fe concentrate sample were examined using a scanning electron microscope (SEM; TESCAN VEGAII) in back scattered electron (BSE) mode.
3. Results and Discussion
3.1. Characteristics of Iron Ores
Table 3 lists the chemical compositions of sea sand, V–Ti–Fe concentrate and other raw materials used in the test. Table 4 shows the comparative analysis of particle size between sea sand and V–Ti–Fe concentrate. As can be seen from Table 3, the TFe content (TFe refers to the total content of iron elements existing in various forms in iron ore, namely total Fe) in sea sand is slightly higher than that in V–Ti–Fe concentrate, i.e., 55.00%, but the TiO2 content of sea sand is relatively low, which is approximately 9.95%. The CaO and MgO contents in sea sand are lower than those in V–Ti–Fe concentrate, but the SiO2 content and loss on ignition (LOI) in the former are basically the same as those in the latter. In comparing the particle size between sea sand and V–Ti–Fe concentrate, 80% of sea sand features a particle size within 100 µm–1 mm (16–160 mesh), indicating that sea sand exhibits a uniform particle size, although coarser than that of V–Ti–Fe concentrate.
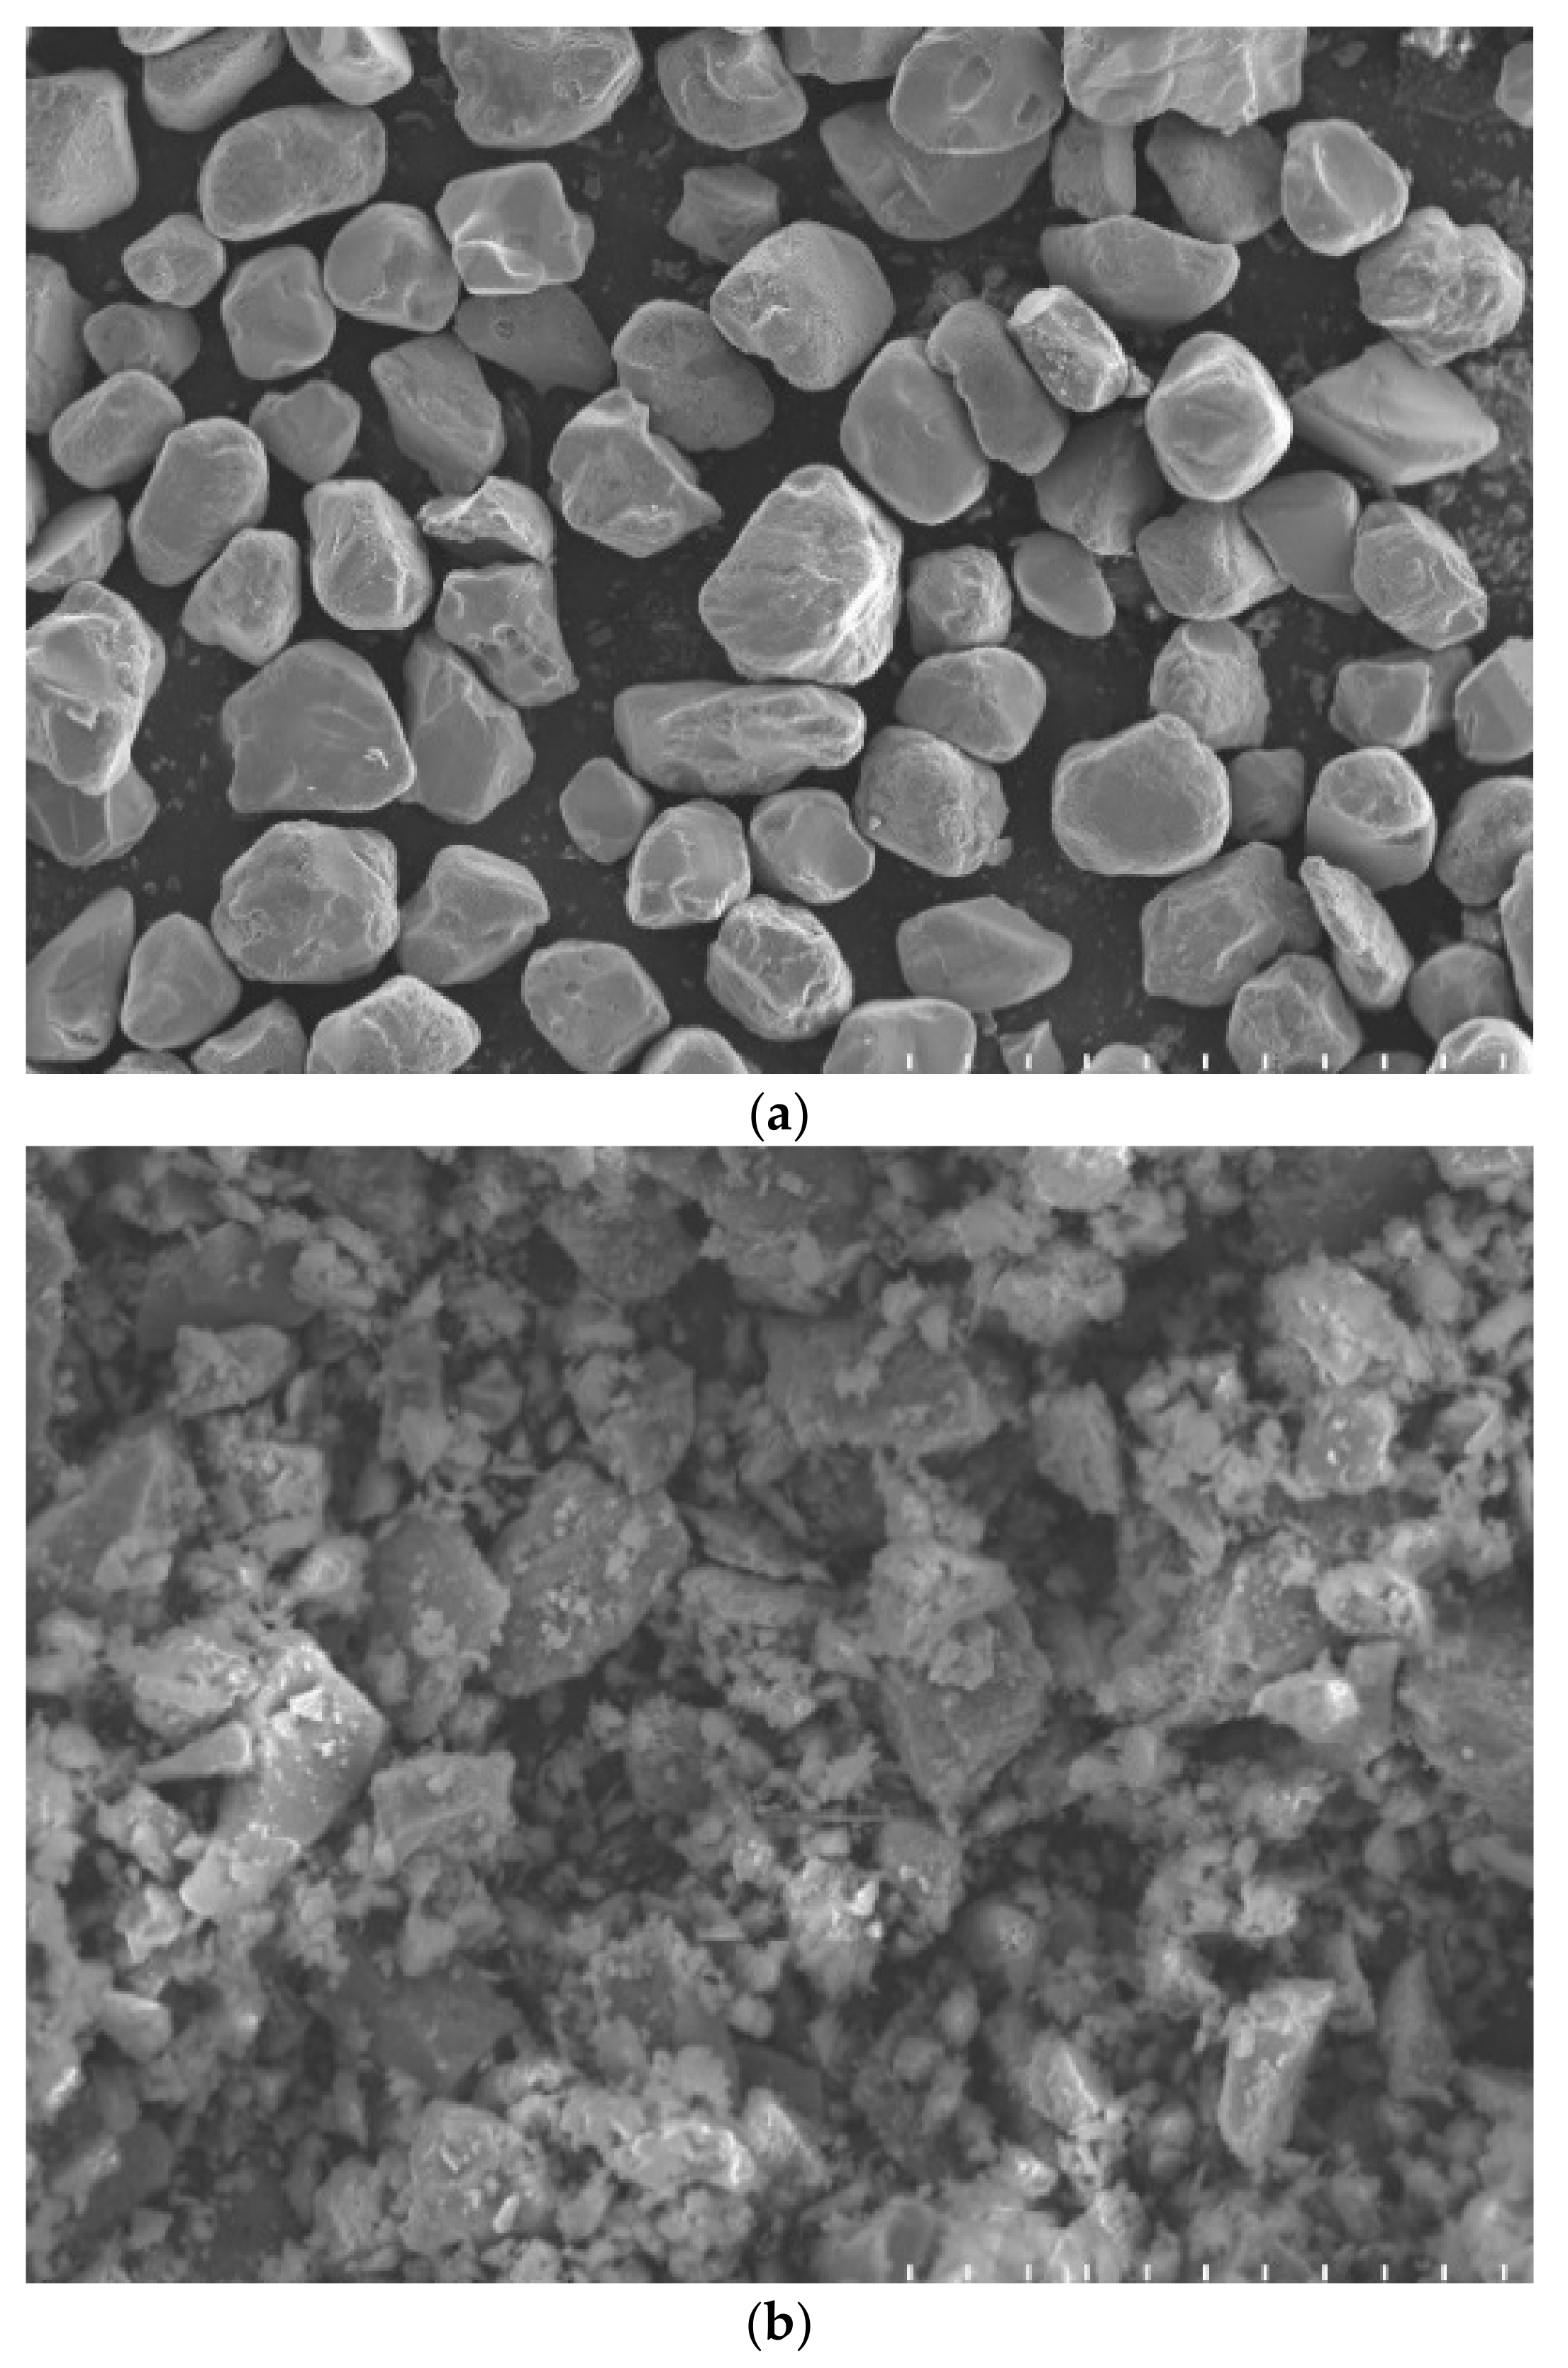
Figure 2 shows the SEM results of sea sand and V–Ti–Fe concentrate. Sea sand is characterized by a smooth surface and uniform particle size, and the average particle size is big, reaching 213 µm, w extremely going against pelletizing. By contrast, the V–Ti–Fe concentrate is characterized by a finer particle size and lower uniformity.
3.2. Influence of the Additive Proportion of Sea Sand on Sintering
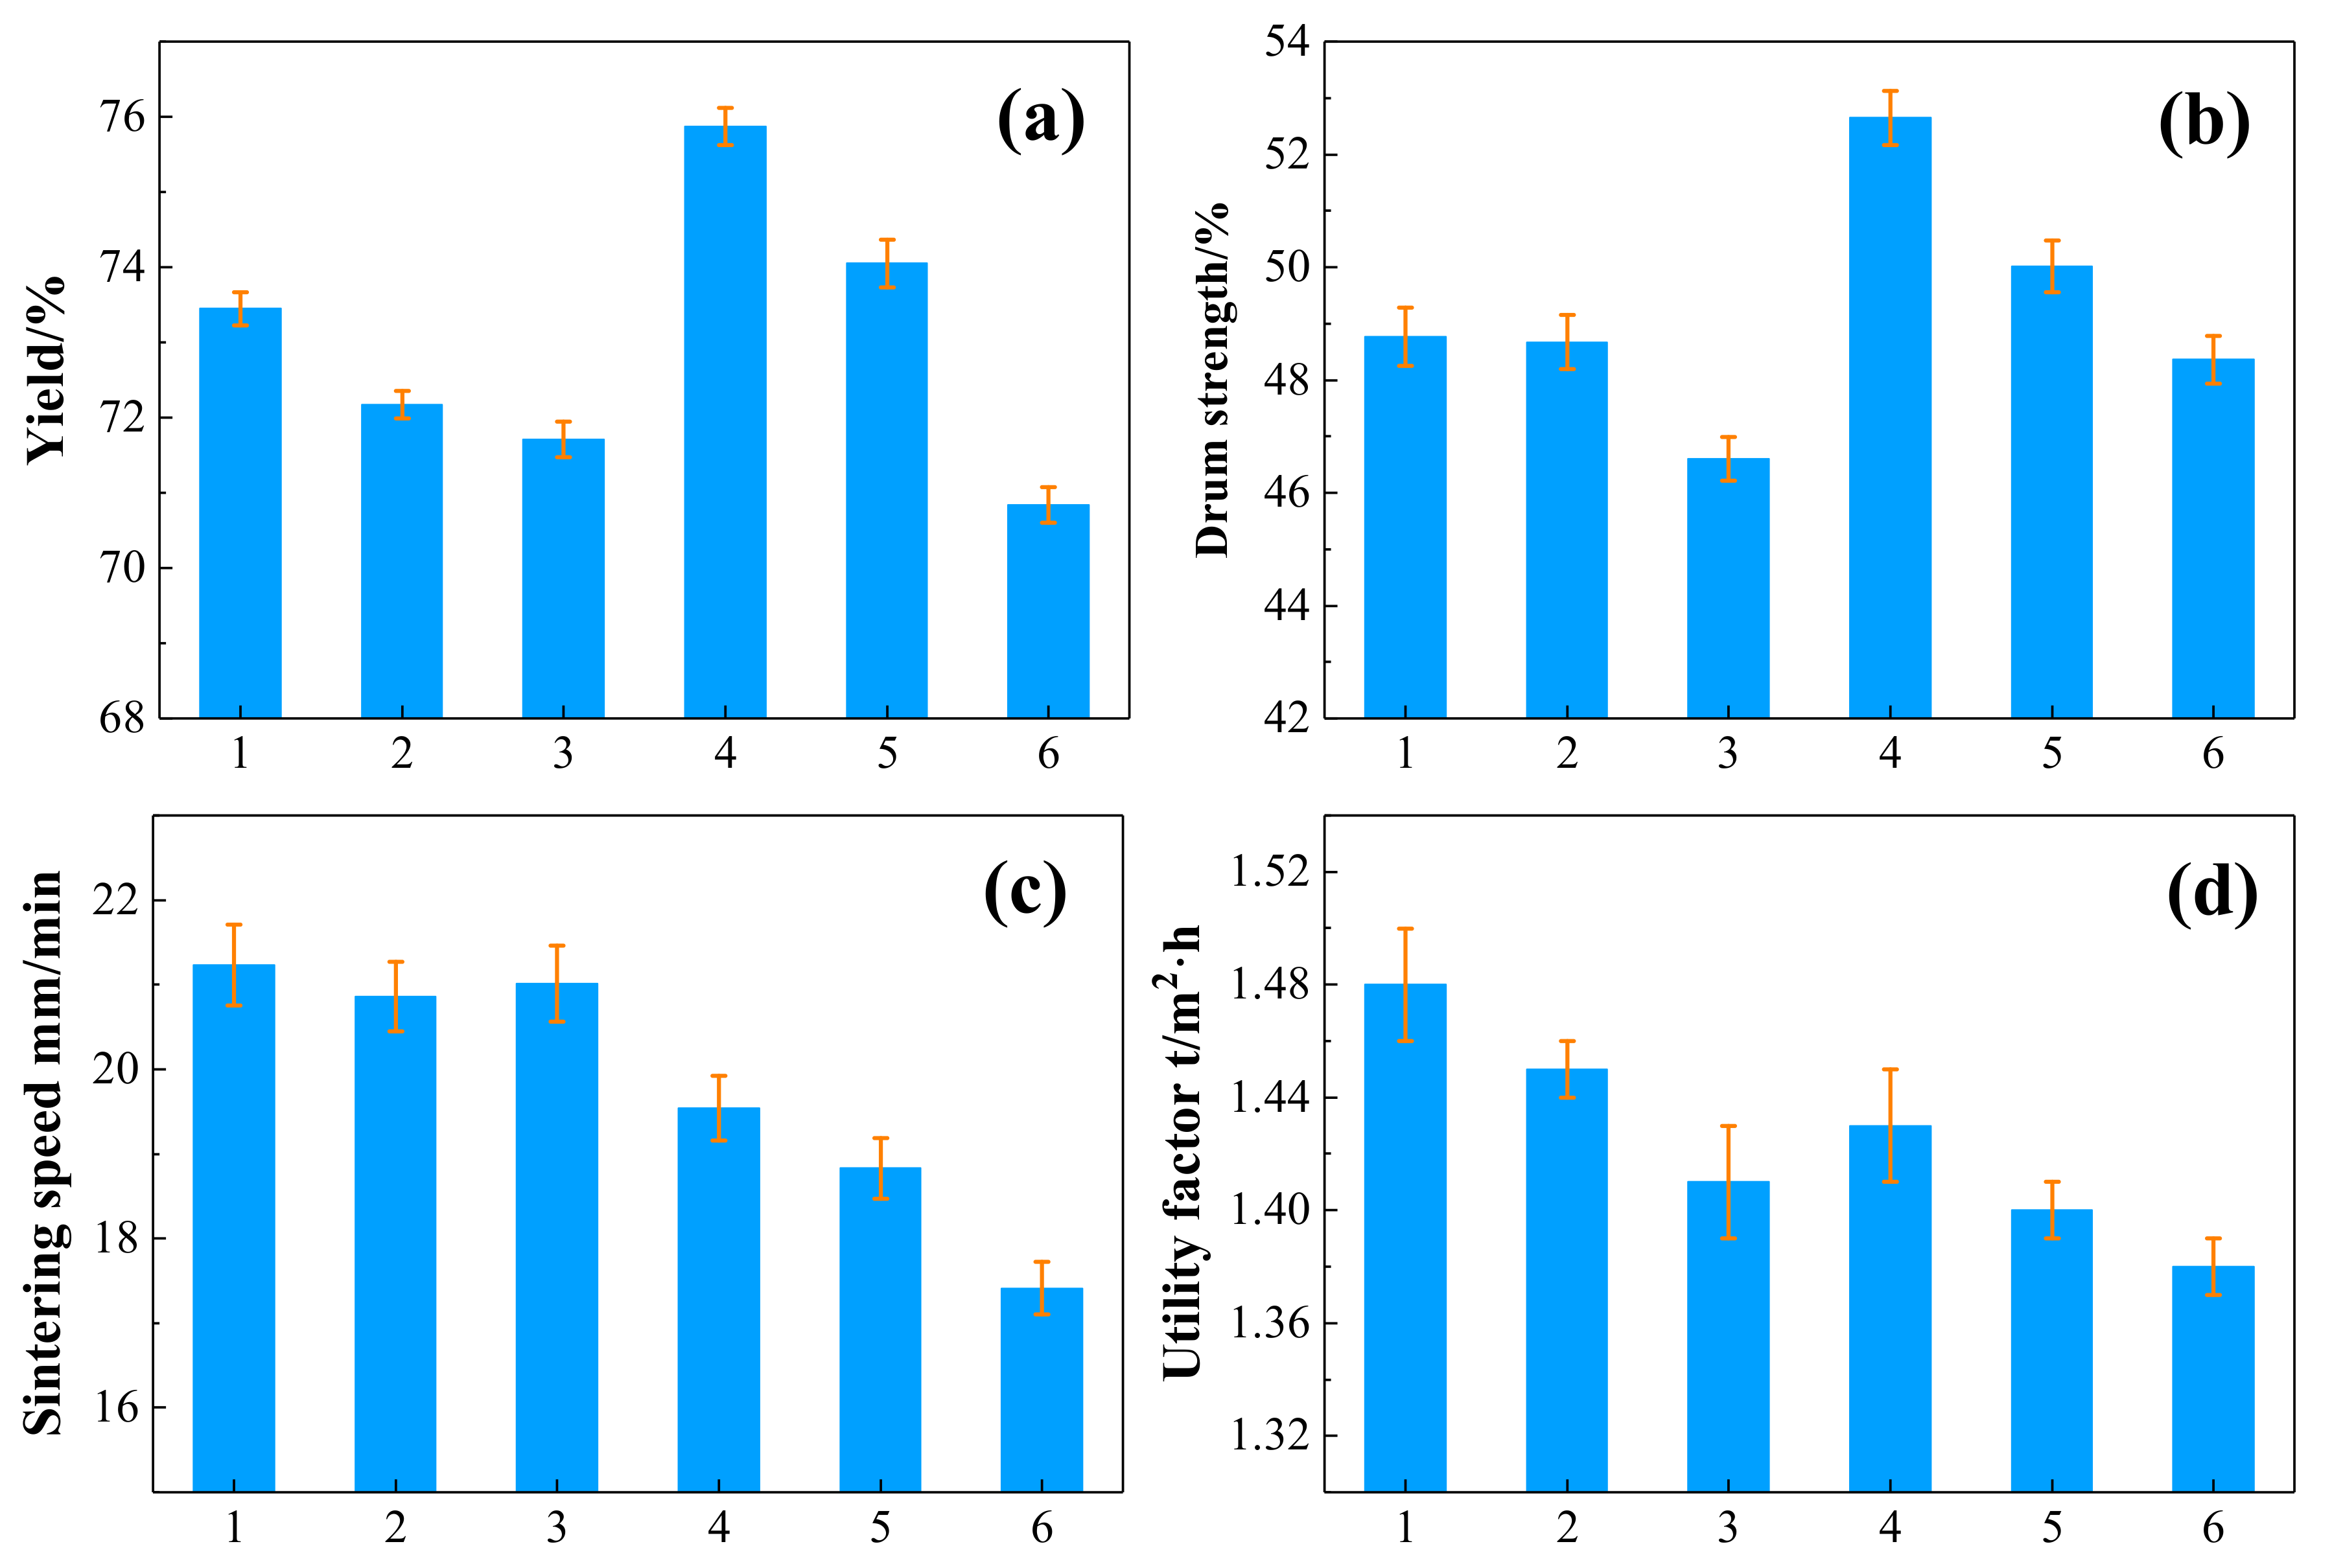
Table 5 shows the major technical index of the sinter-pot test including yield, finished product rate, sintering speed, drum strength, utility factor, and return rate. Figure 3 shows the influence of the additive proportion of sea sand on sintering. Figure 3a illustrates that the finished product rate initially shows a trend of first increasing, and then decreasing with the increase in the additive proportion of sea sand. When the additive proportion is less than 25%, the finished product rate shows an obvious declining trend. Figure 3b illustrates that the drum strength first shows a declining and then rising trend, and it peaks when the additive proportion is 52.65%. Figure 3c indicates that the vertical sintering speed decreases remarkably with the increase in the additive proportion of sea sand. The major reason is that sea sand particles are coarse and exhibit poor pelletizing properties, resulting in a worsening air permeability of the sinter bed, which leads to prolonged sintering time. The sintering speed decreases rapidly when the proportion of sea sand exceeds 15%. When the proportion of sea sand reaches 45%, sintering becomes very slow. Therefore, this problem should be given attention if a large proportion of sea sand is used. Figure 3d demonstrates that sintering is prolonged because of low vertical sintering speed, and the utility factor decreases obviously with the increase in the proportion of sea sand, indicating the worsening air permeability of the sinter bed. Therefore, adding sea sand significantly affects the utility factor and vertical sintering speed. Efforts must be made to intensify pelleting and increase the air permeability of the sinter bed when a large proportion of sea sand is added to speed up vertical sintering and increase utility factor. Returned fine rate rises first and then declines. These changes in returned fine rate tend to be stable when the proportion of sea sand exceeds 15%.
The drum strength on the production site is usually 1.2–1.3 times that in the laboratory. With the gradual increase in the proportion of sea sand, drum strength rises first and then declines, followed by a rise again when the proportion of sea sand exceeds 15%. No obvious change was observed in drum strength, ranging from 47–51% on average. The overall drum strength is low, which is consistent with the features of V–Ti–Fe concentrate sinter because the V–Ti–Fe concentrate is characterized by high TiO2 and Al2O3 contents and low SiO2 content. Given these properties, the liquid phase amount of silicate generated is small, and, thus, the total liquid phase amount of V–Ti sinter is 10–15% less than common sinter. Roughly, the drum index of V–Ti sinter is 5–10% less that of the common sinter at the same conditions, resulting in a relatively high returned fine rate in V–Ti sinter. Sea sand is the high Ti V–Ti magnetite that is similar with the V–Ti magnetite found in Chengde. When the total proportion of V–Ti is kept at 35%, no significant effect on the drum strength of V–Ti sinter was found with the increase in the proportion of sea sand.
3.3. Influence of the Additive Proportion of Sea Sand on Sinter’s Quality
Table 6 presents the chemical composition of the sinter obtained from the sinter-pot test. With the increase in the proportion of Indonesian sea sand, the sinter grade initially shows a rising and then declining trend. The SiO2 content in sinter decreases slightly, and the TiO2 content does not change much. The binary basicity increases slightly, which is basically consistent with the burdening basicity. The FeO content in sinter shows a decreasing trend, and the TFe content fluctuates within a small range.
Table 7 shows the analysis of the sinter metallurgical properties with the Chinese Industrial Standard (GBT 13241-2017, GBT 13242-2017, GBT 34211-2017). With the increase in the proportion of Indonesian sea sand, the RDI+3.15 of sinter drops dramatically, and the RI changes slightly. Under the same conditions, the initial softening temperature (Ta) shows a declining trend, the softening end temperature (Ts) demonstrates first a rising and then declining trend, the soft melting interval (ΔTsa) increases first and then declines, while the initial dropping temperature exhibits a rising trend. The major reason is that the content of high melting substances, such as TiO2, MgO and Al2O3 in V–Ti sinter is large, although the phase quantity of low melting silicate is small. As a result, the initial softening temperature and softening end temperature of V–Ti sinter is higher than those of sea sand. Since no obvious difference was observed in the softening–melting properties the two types of fine ores, the height and thickness of the soft melting zone does not differ significantly during blast-furnace smelting. However, the position of the sea sand soft melting zone is slightly higher than that of V–Ti bearing magnetite, and thicker than the latter, leading to a relatively poor permeability of the charge column. Therefore, attention must be paid to the adjustment of the blast furnace if sea sand is used. The dropping temperature of sea sand is apparently higher than that of V–Ti–Fe concentrate, and the high dropping temperature can facilitate the utilization of gas in the lower-middle part of the blast furnace.
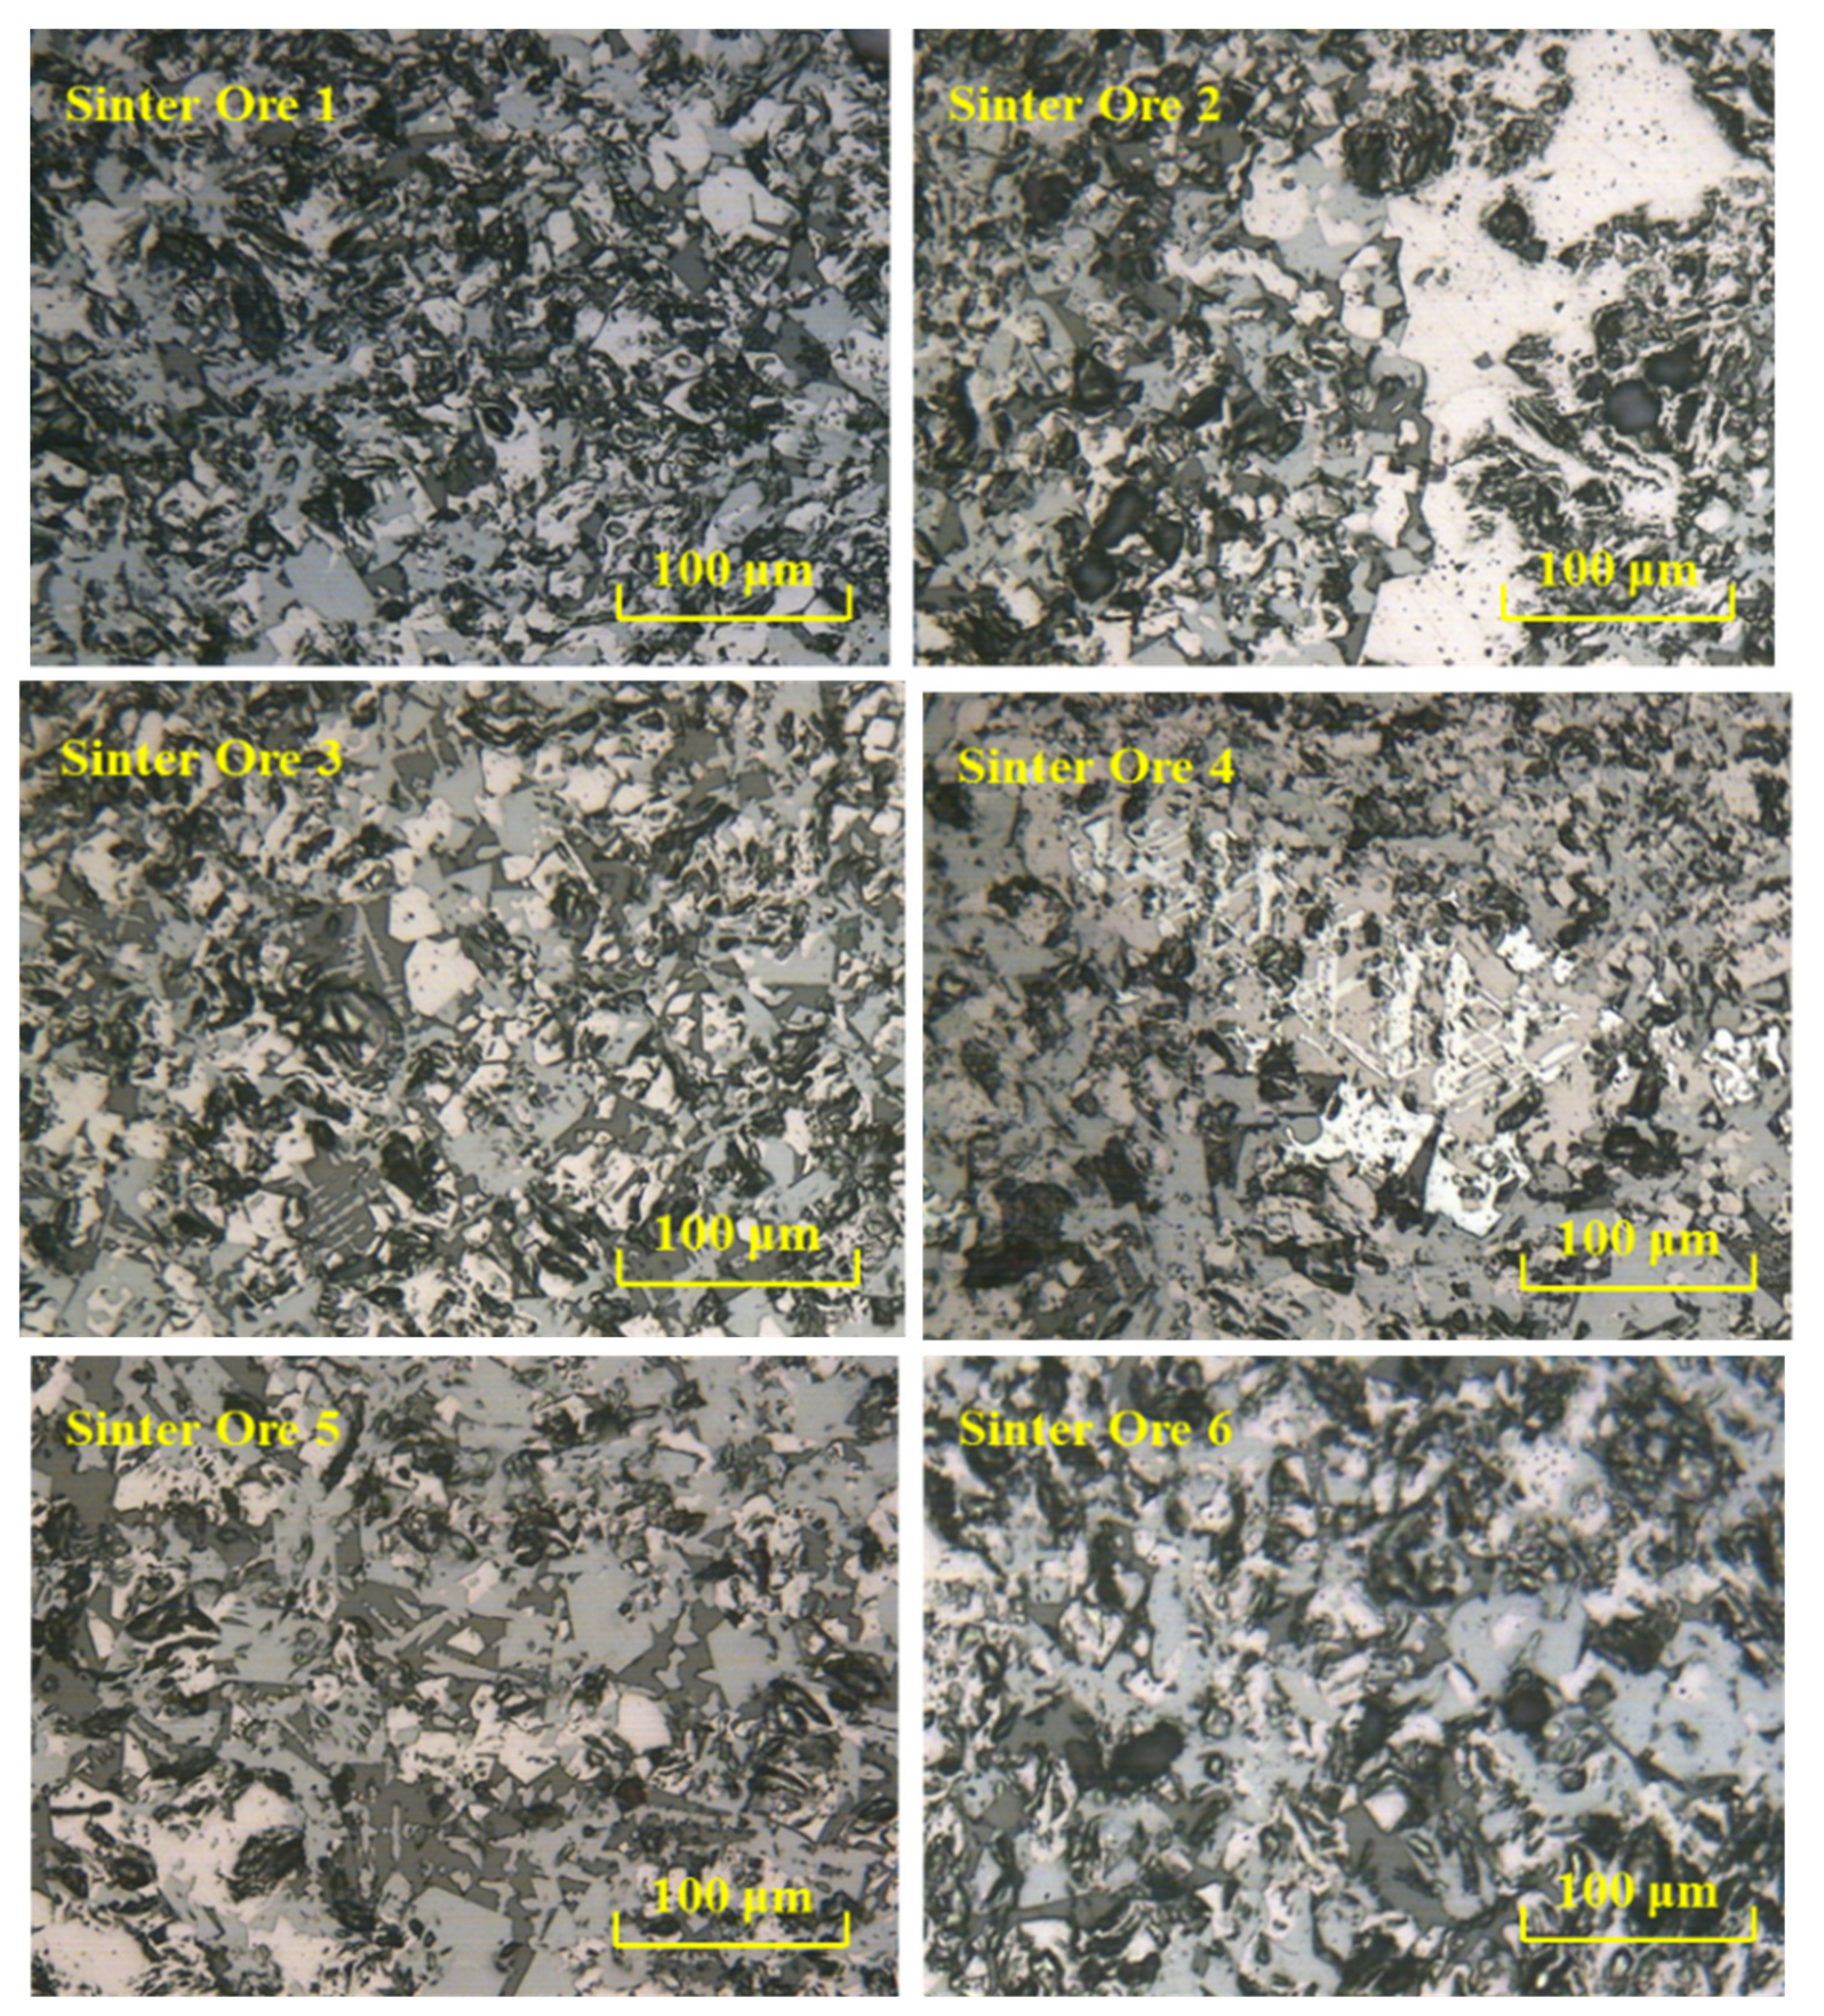
The optical microscopy observation of the cross section of the sinter ore with a different diameter was examined using a metallographic microscope. Figure 4 shows the ore phase features of the sinter obtained from different ore blending schemes. The ore phase of the sinter samples is complicated with an inhomogeneous structure, and most of the samples feature a granular, skeletal or partial melting corrosion structure. The hematite and magnetite are always cemented with perovskite, dicalcium silicate, and a small amount of calcium ferrite and vitreous to form a granular structure. By contrast, some parts are cemented with columnar calcium ferrite, dicalcium silicate and perovskite to form the melting corrosion structure. The autotype and allotype hematite and a small amount of ferrite calcium and perovskite are found in 35% of the sinter samples of V–Ti–Fe concentrate. Magnesium ferrite with a high strength also appears in local parts, enhancing the strength of sinter. Several fine pores and skeletal hematite are found in 35% of sea sand, and the pore structure in sea sand sinter takes up a large volume fracture. The pore diameter is small, but the number of pores is large. The skeletal crystalline hematite may generate around the pores easily. The vitreous mineral distributed among the hematite plays a weak connecting role, leading to many cracks. The crystal transfer and volume expansion after reducing skeletal crystalline sinter may also lead to plenty of cracks. Therefore, this is the major reason the low temperature reduction degradation index of sea sand sinter is high. In addition, the quantity of pilotaxitic structure formed by acicular calcium ferrite and the iron-bearing mineral in the sea sand sinter is small, with a weak capacity to restrict the expansion of the cracks after reducing hematite, which probably leads to a much severer reduction degradation. Moreover, the melting corrosion structure of V–Ti sinter contains minerals with different dilatation coefficients, which go against the improvement of the reduction degradation properties at low temperatures.
4. Conclusions
Sea Sand, with its special characteristics of abundant reserves, stable iron content, low mining and transportation costs, and high vanadium and titanium content, are considered a new vanadium and titanium resource. This study presents using Indonesian sea sands to replace V–Ti–Fe concentrate for sintering. The results showed that when the proportion of sea sand increased from 5% to 40%, the vertical sintering speed and utility factor show an apparent decreasing trend, while the drum strength, finished product rate and returned fine rate are not significantly affected. Secondly, the reduction degradation index of sinter at low temperatures decreases sharply from 65% to 31%. By comparing the metallurgical properties between the sinter samples obtained based on 35% V–Ti–Fe concentrate and the sinter sample obtained based on 35% sea sand, the replacement of V–Ti–Fe concentrate with sea sand does not affect sinter reduction or melting and dropping property greatly. Furthermore, the proportion of coke power should not exceed 4.5% and the high content of FeO may lead to the decline of sinter reducibility. As above, Indonesian sea sand can be used as a sinter material to replace V–Ti–Fe concentrate to expand the source of sinter iron ore and reduce production costs.
Author Contributions
Conceptualization, Y.Q. and H.L.; methodology, Y.Q.; software, K.Z.; validation, Q.L., Y.Q. and K.Z.; formal analysis, Y.Q.; investigation, H.L.; resources, H.L.; data curation, H.L.; writing—original draft preparation, Y.Q.; writing—review and editing, K.Z. All authors have read and agreed to the published version of the manuscript.
Funding
This research was funded by the National Natural Science Foundation of China (No. 51974054), Natural Sciences Foundation of Chongqing, China (No. cstc2020jcyj-msxmX0229), and the Provincial and Ministerial Co-constructive of Collaborative Innovation Center for MSW Comprehensive Utilization (No. shljzyh2021-17).
Data Availability Statement
Not applicable.
Conflicts of Interest
The authors declare no conflict of interest.
References
- Van Gosen, B.S.; Fey, D.L.; Shah, A.K.; Verplanck, P.L.; Hoefen, T.M. Deposit Model for Heavy-Mineral Sands in Coastal Environments; Scientific Investigations Report 2010–5070–L; U.S. Geological Survey: Washington, DC, USA, 2014.
- Suratman, S. Distributon characteristics of ferro-titanium oxide mineral on low grade iron sand. Indones. Min. J. 2007, 20, 49–58. [Google Scholar]
- Hong, B.X.; Zhang, W.F.U. Research on Material Composition of Vanadium Titanium Magnetite of a Beach Placer in Indonesia. Mult. Min. Res. 2012, 35, 44–49. [Google Scholar]
- Gao, Q.J.; Wei, G.; Liu, C.S.; Shen, F.M. Effect of Binary Basicity on Sintering Process and Quality of Indonesia Vanadium Titanium Magnetite. J. Northeast. Univ. 2016, 37, 1727–1730. [Google Scholar]
- Wang, Z.Y.; Zhang, J.L.; Liu, Z.J.; Zhang, L.M. Ball-Milling Micro-dissociation of Ironsand and Magnetic Force at Fine Level. J. Northeast. Univ. 2016, 37, 712–715. [Google Scholar]
- Jin, H.Q.; Yang, H. Status and problem of China’s iron ore imports and counter measures. Globalization 2014, 5, 97–106. [Google Scholar]
- Zou, L.L.; Lv, Q.; Chen, S.J.; Li, F.C.; Bai, G.R. Best ratio of Indonesian sea sand by using weighted grey relational analysis. China Met. 2014, 24, 6–9. [Google Scholar]
- Samanta, S.; Goswami, M.C.; Baidya, T.K.; Mukherjee, S.; Dey, R. Mineralogy and carbothermal reduction be-haviour of vanadium-bearing titaniferous magnetite ore in Eastern India. Int. J. Miner. Metall. Mater. 2013, 20, 917–924. [Google Scholar] [CrossRef]
- Yang, S.; Zhou, M.; Jiang, T.; Xue, X. Study on Sintering Characteristics of Ultra-Poor Vanadium-Titanium Magnetite. Minerals 2021, 11, 515. [Google Scholar] [CrossRef]
- Van den Berg, T.; de Villiers, J.; Cromarty, R. Variation of the redox conditions and the resultant phase assemblages during iron ore sintering. Int. J. Miner. Proc. 2016, 150, 47–53. [Google Scholar] [CrossRef] [Green Version]
- Nicol, S.; Chen, J.; Qi, W.; Mao, X.; Jak, E.; Hayes, P.C. Measurement of Process Conditions Present in Pilot Scale Iron Ore Sintering. Minerals 2019, 9, 374. [Google Scholar] [CrossRef] [Green Version]
- Ji, Z.; Zhao, Y.; Gan, M.; Fan, X.; Chen, X.; Hu, L. Microstructure and Minerals Evolution of Iron Ore Sinter: In-fluence of SiO2 and Al2O2. Minerals 2019, 9, 449. [Google Scholar] [CrossRef] [Green Version]
- Gao, Q.; Wei, G.; Jiang, X.; Zheng, H.; Shen, F. Effect of Indonesia vanadium ilmeno-magnetite on fluidity of blast furnace slag in Jiangsu Shasteel. J. Mater. Met. 2016, 15, 88–91. [Google Scholar]
- Lü, Q.; Wang, W.S.; Jin, Y.C.; Li, F.; Gao, F. Influence of New Zealand Sea sand proportioning ratio on metallurgical properties of vanadium titanium bearing sinter of Cheng steel. Iron Steel Vanadium Titan. 2010, 31, 80. [Google Scholar]
- Hu, B.S.; Liu, H.; Li, L.; Wang, L.; Li, W.D. Influence of proportioning sea sand iron ore on sintering processing. J. Sinter. Pelletizing 2006, 31, 16–20. [Google Scholar]
- Wang, Z.Y.; He, M.J. Study on the influence of the Indonesian sea sand on sinter output and quality. Zhejiang Met. 2013, 1, 41. [Google Scholar]
- Matsumura, M.; Hoshi, M.; Kawaguchi, T. Improvement of Sinter Softening Property and Reducibility by Controlling Chemical Compositions. ISIJ Int. 2005, 45, 594–602. [Google Scholar] [CrossRef] [Green Version]
- Yong, Z.; Mi, Z.; Chu, M.S.; Xue, X.X. Sintering experiments of high-Cr vanadium and titanium magnetite. J. Northeast. Univ. 2013, 34, 383–387. [Google Scholar]
- Gao, B.H.; Wang, H.J.; Yuan, Q.U.; Li, L. Experimental Research on Extracting Iron from Beach Placer Concen-trate in Indonesia by Direct Reduction-Grinding-Magnetic Separation. J. Min. Metall. Eng. 2012, 32, 44–46. [Google Scholar]
- Cheng, G.-J.; Xing, Z.-X.; Yang, H.; Xue, X.-X. Effects of High Proportion Unground Sea Sand Ore on the Prepara-tion Process and Reduction Performance of Oxidized Pellets. Minerals 2021, 11, 87. [Google Scholar] [CrossRef]
- Chen, C.; Lu, L.; Jiao, K. Thermodynamic Modelling of Iron Ore Sintering Reactions. Minerals 2019, 9, 361. [Google Scholar] [CrossRef] [Green Version]
Figure 1.
Devices for sinter-pot test.

Figure 2.
SEM results of sea sand and V–Ti–Fe concentrate ((a): sea sand; (b): V–Ti–Fe concentrate).
Figure 2.
SEM results of sea sand and V–Ti–Fe concentrate ((a): sea sand; (b): V–Ti–Fe concentrate).

Figure 3.
Influence of the additive proportion of sea sand on sintering. (a) Yield; (b) drum strength; (c) sintering speed; (d) utility factor (1, sea sand 0%; 2, sea sand 5%; 3, sea sand 15%; 4, sea sand 25%; 5, sea sand 35%; 6, sea sand 45%).
Figure 3.
Influence of the additive proportion of sea sand on sintering. (a) Yield; (b) drum strength; (c) sintering speed; (d) utility factor (1, sea sand 0%; 2, sea sand 5%; 3, sea sand 15%; 4, sea sand 25%; 5, sea sand 35%; 6, sea sand 45%).

Figure 4.
Ore phase features of sinter under different ore blending schemes (Sinter Ore 1, sea sand 0%; Sinter Ore 2, sea sand 5%; Sinter Ore 3, sea sand 15%; Sinter Ore 4, sea sand 25%; Sinter Ore 5, sea sand 35%; Sinter Ore 6, sea sand 45%).
Figure 4.
Ore phase features of sinter under different ore blending schemes (Sinter Ore 1, sea sand 0%; Sinter Ore 2, sea sand 5%; Sinter Ore 3, sea sand 15%; Sinter Ore 4, sea sand 25%; Sinter Ore 5, sea sand 35%; Sinter Ore 6, sea sand 45%).


Table 1.
Proportion of components in different mixtures (wt%).
| Scheme | V–Ti–Fe Concentrate | Sea Sand | Ore A | Ore B | Ore C | Ore D | Ore E | Ore F | Returned Fines |
|---|---|---|---|---|---|---|---|---|---|
| Mixture 1 | 35.0 | 0.0 | 10.0 | 4.0 | 5.0 | 7.0 | 10.0 | 1.0 | 28.0 |
| Mixture 2 | 30.0 | 5.0 | 10.0 | 4.0 | 5.0 | 7.0 | 10.0 | 1.0 | 28.0 |
| Mixture 3 | 20.0 | 15.0 | 10.0 | 4.0 | 5.0 | 7.0 | 10.0 | 1.0 | 28.0 |
| Mixture 4 | 10.0 | 25.0 | 10.0 | 4.0 | 5.0 | 7.0 | 10.0 | 1.0 | 28.0 |
| Mixture 5 | 0.0 | 35.0 | 10.0 | 4.0 | 5.0 | 7.0 | 10.0 | 1.0 | 28.0 |
| Mixture 6 | 0.0 | 45.0 | 7.0 | 4.0 | 5.0 | 6.0 | 9.0 | 0.0 | 24.0 |
Table 2.
Process parameters of sinter-pot test.
| Parameters | Value | Parameters | Value |
|---|---|---|---|
| Bed thickness | 650 mm | Diameter of sinter pot | 300 mm |
| Negative pressure for ignition | 8 kPa | Negative pressure for air draft | 16 kPa |
| Ignition temperature | 1050 °C | Thickness of hearth layer | 25 mm |
| Ignition time | 2 min | Pelleting time of mixture | 3 min |
Table 3.
Chemical composition of raw materials (wt%).
| Type of Ore | TFe | SiO2 | CaO | Al2O3 | MgO | TiO2 | S | P | LOI |
|---|---|---|---|---|---|---|---|---|---|
| V-Ti-Fe concentrate | 53.44 | 4.80 | 1.58 | 3.30 | 4.20 | 11.20 | 0.35 | 0.05 | 2.60 |
| Sea sand | 55.00 | 4.90 | 1.00 | 3.60 | 3.50 | 9.95 | 0.00 | 0.00 | 2.60 |
| Ore A | 62.50 | 4.70 | 0.10 | 1.78 | 0.10 | 0.13 | 0.02 | 0.05 | 2.21 |
| Ore B | 40.00 | 7.30 | 25.00 | 2.33 | 2.64 | 3.00 | 0.50 | 0.05 | 5.00 |
| Ore C | 61.77 | 3.57 | 0.15 | 2.42 | 0.13 | 0.20 | 0.02 | 0.09 | 6.20 |
| Ore D | 51.36 | 2.50 | 6.20 | 0.09 | 3.55 | 0.12 | 0.06 | 0.22 | 6.93 |
| Ore E | 58.96 | 3.35 | 3.89 | 1.44 | 1.79 | 2.01 | 0.55 | 0.09 | 1.10 |
| Ore F | 62.00 | 4.41 | 1.79 | 0.94 | 1.61 | 0.53 | 0.30 | 0.03 | 1.00 |
| Returned fines | 50.00 | 5.30 | 11.90 | 2.30 | 2.22 | 4.50 | 0.06 | 0.04 | 1.20 |
Table 4.
Particle size distribution of raw materials (mesh).
| Ore | >16 | 16–100 | 100–160 | 160–200 | <200 |
|---|---|---|---|---|---|
| V–Ti–Fe concentrate | 10.70 | 23.60 | 18.00 | 14.50 | 33.20 |
| Sea sand | 0.50 | 25.65 | 56.50 | 10.35 | 7.00 |
Table 5.
Major technical index of sinter-pot test.
| Sample | Yield % | Drum Strength % | Sintering Speed mm/min | Utility Factor t/m2·h | Finished Product Rate % | Return Rate % |
|---|---|---|---|---|---|---|
| 1 | 73.45 ± 0.22 | 48.77 ± 0.52 | 21.23 ± 0.48 | 1.48 ± 0.02 | 95.81 ± 0.12 | 26.55 ± 0.18 |
| 2 | 72.17 ± 0.18 | 48.67 ± 0.48 | 20.86 ± 0.41 | 1.45 ± 0.01 | 94.86 ± 0.14 | 27.83 ± 0.16 |
| 3 | 71.71 ± 0.24 | 46.60 ± 0.39 | 21.01 ± 0.45 | 1.41 ± 0.02 | 94.65 ± 0.11 | 28.29 ± 0.18 |
| 4 | 75.87 ± 0.25 | 52.65 ± 0.48 | 19.54 ± 0.38 | 1.43 ± 0.02 | 94.87 ± 0.13 | 24.13 ± 0.15 |
| 5 | 74.05 ± 0.32 | 50.02 ± 0.46 | 18.83 ± 0.36 | 1.40 ± 0.01 | 94.20 ± 0.11 | 25.95 ± 0.16 |
| 6 | 70.84 ± 0.24 | 48.36 ± 0.42 | 17.41 ± 0.31 | 1.38 ± 0.01 | 94.11 ± 0.12 | 29.16 ± 0.14 |
Table 6.
Chemical composition of sinter ore (wt%).
| Sample | TFe | SiO2 | CaO | Al2O3 | MgO | TiO2 | FeO | R2 (CaO/SiO2) |
|---|---|---|---|---|---|---|---|---|
| 1 | 50.44 | 5.37 | 11.31 | 2.62 | 2.94 | 5.09 | 8.20 | 1.94 |
| 2 | 50.50 | 5.38 | 11.28 | 2.64 | 2.92 | 5.04 | 8.51 | 1.91 |
| 3 | 51.11 | 5.17 | 10.89 | 2.66 | 2.86 | 5.27 | 7.97 | 2.00 |
| 4 | 50.90 | 5.29 | 11.14 | 2.68 | 2.81 | 5.00 | 8.69 | 2.00 |
| 5 | 50.72 | 5.41 | 11.35 | 2.70 | 2.75 | 4.73 | 7.20 | 2.11 |
| 6 | 50.27 | 5.46 | 11.49 | 2.85 | 2.90 | 5.31 | 7.20 | 2.21 |
Table 7.
Metallurgical properties of sinter ore.
| Sample | RDI+3.15/% | RI/% | Ta/°C | Ts/°C | ΔTsa/°C | Tm/°C |
|---|---|---|---|---|---|---|
| 1 | 55.05 ± 0.21 | 75.13 ± 0.26 | 1072 | 1223 | 151 | 1397 |
| 2 | 53.49 ± 0.34 | 75.46 ± 0.36 | 1077 | 1225 | 148 | 1398 |
| 3 | 51.44 ± 0.25 | 74.38 ± 0.19 | 1068 | 1230 | 162 | 1388 |
| 4 | 50.78 ± 0.32 | 75.90 ± 0.34 | 1069 | 1221 | 152 | 1405 |
| 5 | 49.98 ± 0.22 | 75.89 ± 0.28 | 1070 | 1235 | 165 | 1420 |
| 6 | 45.50 ± 0.18 | 75.45 ± 0.24 | 1063 | 1218 | 155 | 1443 |
Publisher’s Note: MDPI stays neutral with regard to jurisdictional claims in published maps and institutional affiliations. |
© 2021 by the authors. Licensee MDPI, Basel, Switzerland. This article is an open access article distributed under the terms and conditions of the Creative Commons Attribution (CC BY) license (https://creativecommons.org/licenses/by/4.0/).
Share and Cite
MDPI and ACS Style
Qin, Y.; Ling, Q.; Zhang, K.; Liu, H. Influence of Sea Sand on Sintering of V–Ti–Fe Concentrate—A Case Study from Indonesia. Minerals 2021, 11, 793. https://doi.org/10.3390/min11080793
AMA Style
Qin Y, Ling Q, Zhang K, Liu H. Influence of Sea Sand on Sintering of V–Ti–Fe Concentrate—A Case Study from Indonesia. Minerals. 2021; 11(8):793. https://doi.org/10.3390/min11080793
Chicago/Turabian StyleQin, Yuelin, Qingfeng Ling, Ke Zhang, and Hao Liu. 2021. "Influence of Sea Sand on Sintering of V–Ti–Fe Concentrate—A Case Study from Indonesia" Minerals 11, no. 8: 793. https://doi.org/10.3390/min11080793
Note that from the first issue of 2016, this journal uses article numbers instead of page numbers. See further details here.