the Creative Commons Attribution 4.0 License.
the Creative Commons Attribution 4.0 License.
 | 20 Jul 2021
A new perspective and explanation for the formation of plasmaspheric shoulder structures
Guangshuai Peng
Chao Shen
Yewen Wu
Over the hours of 05:00–09:00 UT on 8 June 2001, the extreme ultraviolet (EUV) instrument on board the IMAGE satellite observed a shoulder-like formation in the morning sector and a post-noon plume-like structure. The plasmapause formation is simulated using the test particle model (TPM), based on a drift motion theory, which reproduces various plasmapause structures and evolution of the shoulder feature. The analysis indicates that the shoulder is created by sharp reduction and spatial non-uniformity in the dawn–dusk convection electric field intensity. The TPM-modeled event is found to develop an initial pre-dawn asymmetric bulge that becomes a shoulder as a result of increased “corotation” rate with an increasing L-shell that is preceded by localized outward convection. The shoulder structure rotates sunward and develops into a single- or double-plume structure during an active time period in simulation.


The plasmasphere is an important region in the inner magnetosphere, surrounding the Earth and extending to 5 Earth radii (RE), which contains dense (10–10 000 cm−3) and cold plasma (below 1 eV). The plasmapause is formed by a superposition of corotation and convection electric field in the inner magnetosphere (Nishida, 1966; Chen and Wolf, 1972). The formation and size of plasmapause vary with a geomagnetic activity level. Generally, as the disturbance level increases, the plasmapause position moves closer to the Earth and the shape deviates from circle in the equatorial plane (Grebowsky, 1970). Atypical plasmapause structures, such as “bulge” and plume, occur often in both whistler and in situ data (Carpenter and Anderson, 1992). There are many theoretical research studies to explain the formation of plumes (Grebowsky, 1970; Pierrard and Lemaire, 2004; Zhang et al., 2013), and Pierrard and Cabrera (2006) firstly simulated a double plume but did not explain the origin of the second plume.
The extreme ultraviolet (EUV) instrument on board the IMAGE satellite was launched in March 2000, which provided a global perspective of the plasmasphere. A plume, finger, notch and shoulder, and so on were observed by EUV (Sandel et al., 2001). As one of the plasmaspheric structures, shoulder has been less studied in previous papers than plume. However, the shoulder may play an important role in a loss mechanism for ring current (Burch et al., 2001). So, it is important to study the formation mechanism of the shoulder.
At present, there are no convincing explanations for the dynamic formation of shoulder. Goldstein et al. (2002) firstly proposed an explanation, based on the magnetospheric specification model (MCM) simulation output, for the formation of shoulder. They proposed that the shoulder is created by a sudden decrease of dusk–dawn electric field. As the interplanetary magnetic field (IMF) turns northward from southward, it triggers anti-sunward flow of plasma in the predawn sector, to produce an asymmetric bulge called shoulder. Later, based on the physical mechanism of interchange instability and a Kp-dependent E5D electric field model, Pierrard and Lemaire (2004) suggested that the shoulder is not the result of radial outflow of plasma, same as the presentation of Goldstein et al. (2002), but is an inward plasma drift in post-midnight sector.
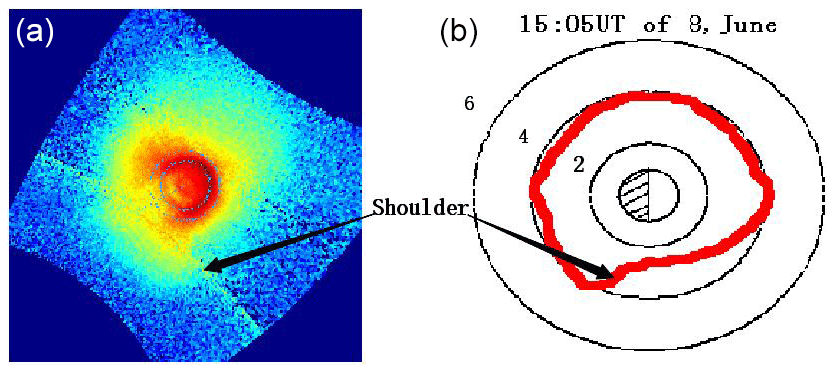
Figure 1Snapshot of plasmasphere (a) by the EUV instrument, at 15:05 UT of 8 June 2001, Sunlight is an incident from the upper right. Earth is in the center of panels and shoulder is observed and labeled in the snapshot. Panel (b) is plasmapause that is extracted from the left plasmaspheric image.
Then, fewer papers about dynamical formation of the shoulder are delivered than of the plume. In this paper, we used the test particle model (TPM) to simulate dynamical formation of the shoulder, using Weimer's statistical E-field (Weimer, 2001; Zhang et al., 2012), which is both spatially nonuniform and dynamically responsive to change geomagnetic and solar wind conditions. To drive the TPM model, several inputs are used: Dst, solar wind (SW), and interplanetary magnetic field (IMF) data sets. The authors make an attempt to propose a new convincing explanation for the formation of the shoulder-like structure, different from the previous explanations.
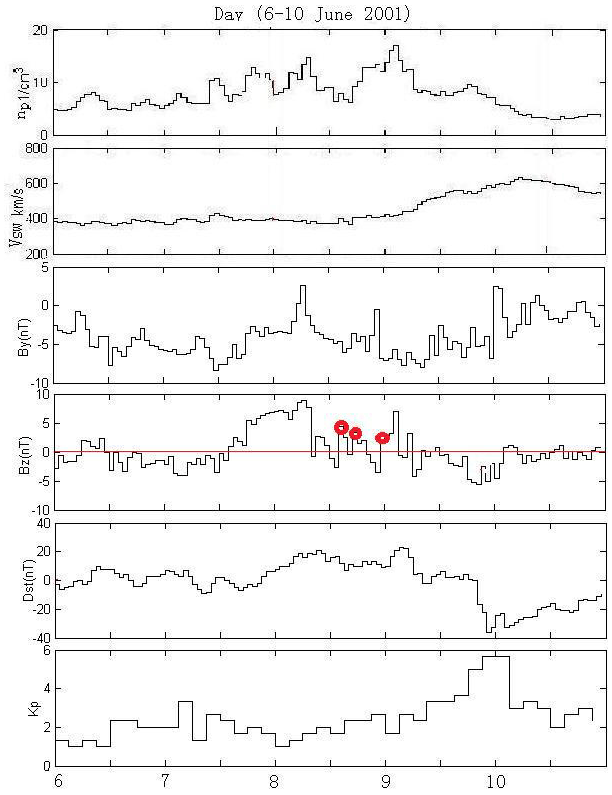
Figure 2Input parameters of the TPM model. The variation of the By and Bz component of the IMF, the Dst index, and Kp index, on 6–10 June 2001, is a typical substorm case.
Figure 1 illustrates the shoulder-like structure, a sharp radial plasmaspheric structure about 1 RE radial extension, in the post-midnight sector, which was viewed by the EUV imager on board the IMAGE satellite at 15:05 UT on 8 June 2001. The right panel illustrates the plasmapause extracted from the left panel in Fig. 1. The outer boundary of the plasmasphere is assumed to be 40 % of the maximum brightness of 30.4 nm He+ emission, where the intensity is the logarithm of the luminosity (Pierrard and Cabrera, 2006). Then, the shoulder-like is labeled and marked by arrows in the plot. Comparison of sequential observations with the simulation pictures shows the shoulder structure corotating with the main plasmaspheric body, which is shown in Fig. 3 and discussed in the next section. That means the outer edge of the shoulder corotates faster than the inner edge in development phase (Goldstein et al., 2002). Then, the shoulder moves eastward to the afternoon sector and evolves into the plume-like structure. Over the next few hours, the outer body of the plume flows sunward from the noon sector and results in the plume thinning out and disappearing (see the simulation in Fig. 3). In the next section, we take the case of the 8 June 2001 observation as an example, to discuss the simulation of the shoulder and the plume evolution based on the TPM method.
In the region of the plasmasphere occupied, charged particles are cold plasma (e.g., energy of particles is < 1 eV). So, we can assume that plasma elements have only drift motions (Li and Xu, 2005; Lejosne and Mozer, 2016). Here, the electric field intensity of the E-model is the superposition of the convection and corotation electric field. The electric field plays a key role in plasma drift motion and the formation of the plasmasphere (Pierrard et al., 2008). In the present paper, Weimer's electric field (Weimer, 2001) is mapped into the magnetosphere along magnetic lines to model the magnetospheric convection electric field (Zhang et al., 2012) and T96 magnetic field to model the background magnetic field.
In the simulation, the calculation region is a radial range of 2–7 RE and azimuthal span of 0–359∘. Dispersion by iso-spacing grids that correspond to the radial and azimuthal steps is equal to 0.1 RE and 1∘, respectively, in the magnetic equatorial plane. Ten particles are placed into each grid, so particle density is proportional to L−1, which is not consistent with the actual density in a saturation state (close to true density presumably is proportional to L−4), but is adequate to study the evolution of plasmaspheric morphology using a skeleton map of particles during a substorm period. The TMP runs 3 d under the low activity condition to obtain the boundary conditions for the simulation.
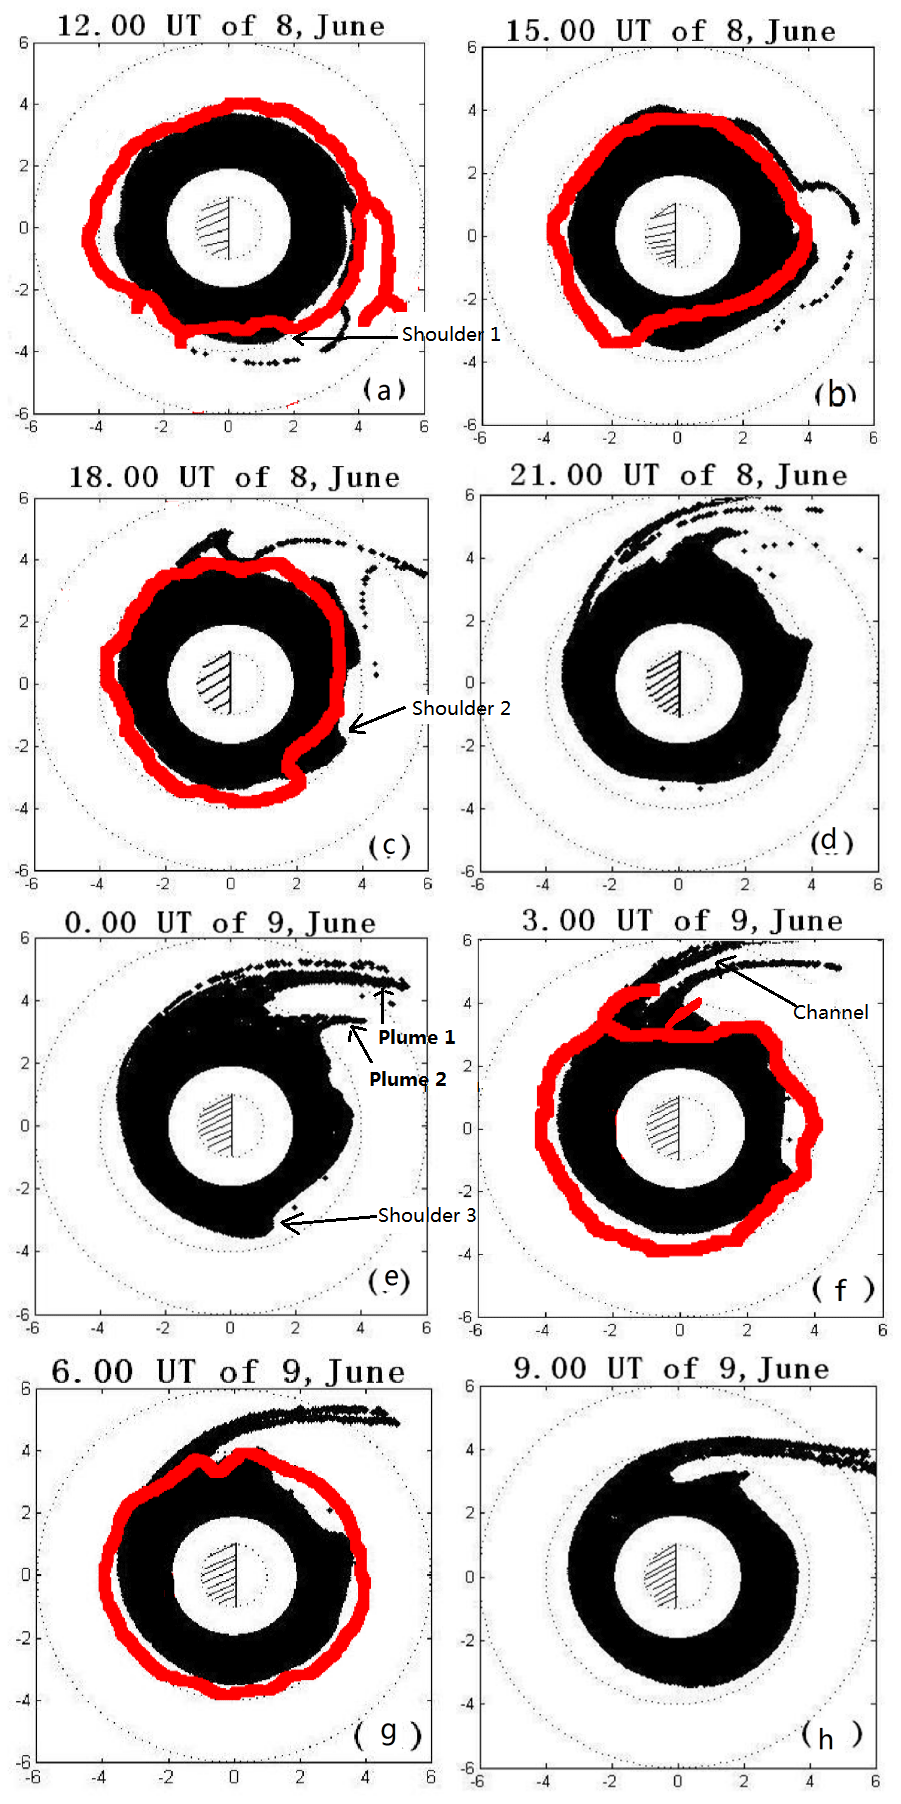
Figure 3The simulation of plasmaspheric morphology compared with EUV/IMAGE observation in the geomagnetic equatorial plane on 8–9 June 2001. The red irregular curves indicate plasmapause observation by EUV/IMAGE. Black contours are the plasmasphere simulated by the TPM model. White contours are the main plasmasphere (located at 1–2 RE region). The dotted circles on the panels correspond to L = 1, 2, 4 and 6.
The paper presents the case of 8–9 June 2001, to study the evolution of the shoulder and propose a hypothetical explanation produced by TPM simulation. During the geomagnetic substorm, all the TPM inputs are available. IMF and solar wind data are available in the ACE satellite data center, and Dst index can be seen in the World Data Center for Geomagnetism, Kyoto. Figure 2 shows the By and Bz components of the IMF, the Dst index, and the geomagnetic activity index Kp, observed from 6 to 10 June 2001. This is a typical substorm case where the Kp index gradually increases up to 5+ and then decreases. The TPM runs with 3 min time resolution from 6 June at 00:00 UT to 10 June at 12:00 UT. The results of the simulation are shown in Fig. 3, whose corresponding times are labeled on the title of each panel. The simulated plasmapause is a skeleton which consists of continuous particle distribution. Comparison of TPM simulation (black body) and EUV observation (red line) in Fig. 3 indicates that the simulated plasmapause positions correspond generally rather favorably with the EUV observations. The results of EUV observation show that the plasmapause is seldom smooth or irregular, due to the fluctuations in plasmapause region caused by successive particle injection during a disturbance period (Goldstein et al., 2002; Gallagher et al., 2005), in agreement with previous whistler observations (Carpenter and Anderson, 1992). In contrast, the simulation of plasmapauses by TPM is more smooth. So, observations and simulations are not identical, due to deviation in the extraction of the boundary from the EUV image and optical contamination of the image (Sandel et al., 2001; Zhang et al., 2013) and the limitation in the TPM model and the unrealistic Weimer electric field model.
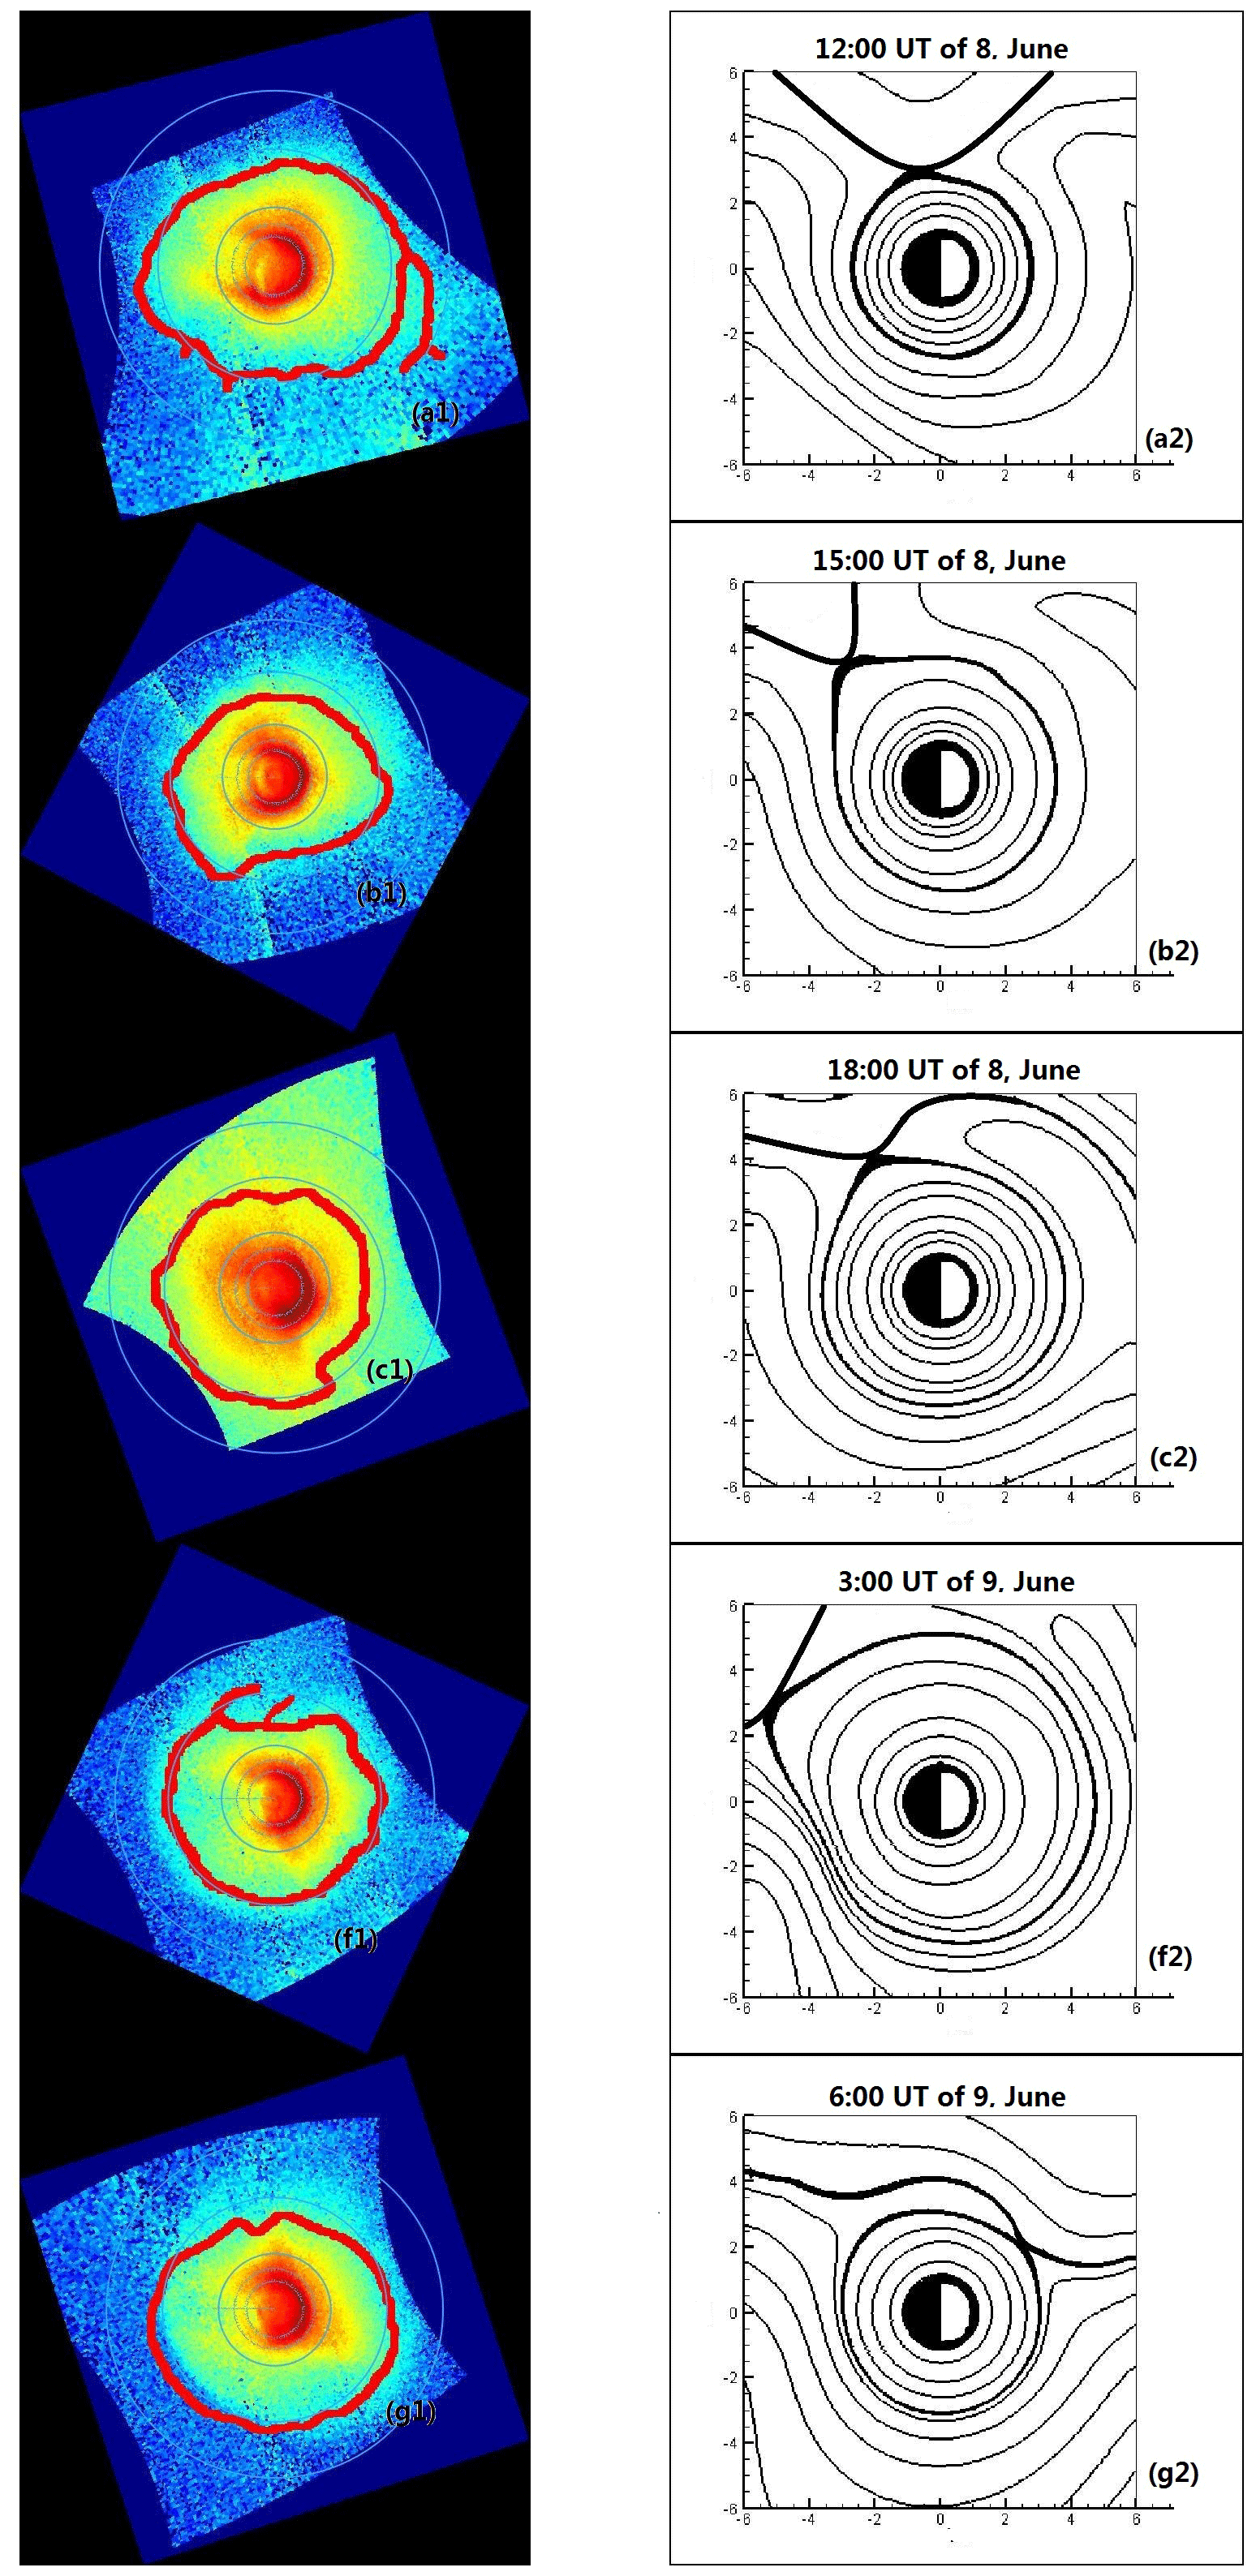
Figure 4The subscript of panels correspond to Fig. 3. The left column of panels shows original observation results by EUV/IMAGE; the blue circles on the panels correspond to L = 1, 2, 4, and 6. The right column of panels shows equipotential lines in the equatorial plane; the last closed equipotential (LCE) is the bold black curve.
Figure 3a–h illustrate the plasmasphere obtained on the interval from 12:00 UT on 8 June to 09:00 UT on 9 June 2001 with snapshots every 3 h. Figure 4 illustrates original observations by EUV/IMAGE and equipotential lines in the equatorial plane. When the Kp index increased, the last closed equipotential shifts closer to the Earth. The results of the simulation show the evolution and development of the features of the plasmapause, like shoulders and plumes. One can see that the plasmapause is closer to the Earth in the predawn sector. The reason is the increase of rotation velocity resulting in the plasmapause of inward flow in the predawn sector (Pierrard and Cabrera, 2006; Verbanac et al., 2018). At 15:05 UT on 8 June, the TMP simulation captures an infant shoulder-like structure in Fig. 3b and then corotates with the plasmasphere body moving eastward and further reproduces a mature shoulder formation in Fig. 3c. The overall agreement between TPM simulation and EUV observed is quite well, but the TPM shoulder is located ∼ 1.5 h earlier in magnetic local time (MLT), which probably originated from the convection electric field model (Goldstein et al., 2002; Pierrard and Cabrera, 2005; Zhang et al., 2013).
The EUV observation illustrated in Fig. 3f shows that a plume is indeed observed in the afternoon or the dusk sector. The results of the simulation also reproduce the formation and the evolution of the plumes, which derives from the shoulder structure in this case, illustrated in Fig. 3d–f. The simulation shows that the shoulders generate in the post-midnight sector (Verbanac et al., 2018) and then rotate eastward around the Earth to the afternoon sector (Goldstein et al., 2002). When the level of geomagnetic activity increases, the plasma element in the shoulder around the outer plasmasphere would convect outward and then into the dayside magnetopause (Li and Xu, 2005; Pierrard et al., 2008) and produce the plasmaspheric plume structure. Shoulder 1 firstly arises in Fig. 3a in the morning sector (at 12:00 UT, 8 June 2001) and then corotates with the main body of the plasmasphere to the afternoon sector in Fig. 3c (at 18:00 UT, 8 June 2001). During this period, the Kp index increases to 3+ from 1 (see Fig. 2), and magnetosphere convection is slightly enhanced, which triggers plasma elements in shoulder 1 towards sunward convection and then produces plume 1 at 21:00 UT on 8 June 2001 (see Fig. 3d). The mature shoulder 2, illustrated in Fig. 3b, corotates eastward with the Earth to the afternoon–dusk sector. During the period of 00:00–03:00 UT on 9 June, the Kp index gradually increases up to 5+, indicating that magnetospheric convection is enhanced and the convective electric field increases. The infantile plume 2, illustrated in Fig. 3e, derives from outflow of plasma elements in shoulder 2 and evolves into the mature plume 2 in Fig. 3f. Later, the double-plume formation that is extended from the plasmapause to the magnetosphere is presented in the simulation results in Fig. 3e and f.
The cavity in between the double plumes, or between plumes and the main body of plasmasphere, may be responsible for the formation of channel and notch structures (Gallagher et al., 2005). The base and the westward edge of the plume are connected with the main body of the plasmasphere. Moreover, there is a cavity topology, a low-density region, between the tail structure of the plasmasphere and the main body of the plasmasphere. That is the channel structure of the plasmasphere. The plume corotates with the Earth, becomes thinner, and finally disappears (Li and Xu, 2005). The results of simulation are reproduced in the channel structure in Fig. 3f. Gallagher et al. (2005) propose that notches and channels share the same origin, which derive from a low-density cavity in the dusk region during recovery at the base of the plasmaspheric plume. The absence of notch structure in this simulation event is due to the fact that the potential structure does not cause the inward flow of plasma in the afternoon sector, and the low disturbance time is not maintained for long enough.
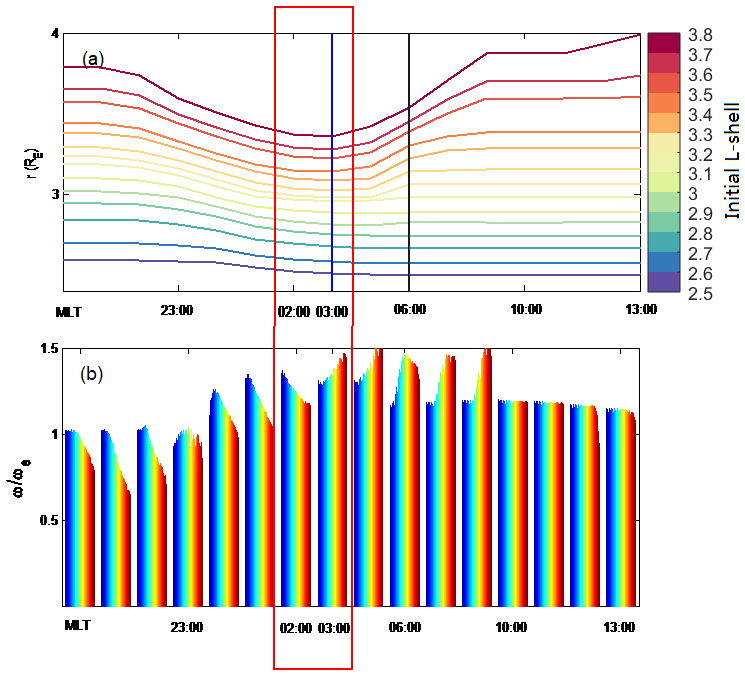
Figure 5The trajectory (upper plot) and the rotation rate (bottom plot) of 14 test particles corresponding to MLT (location-dependent) during a substorm. The legend indicates 14 test particles of various initial L-shell. The day is 8 June 2001.
By contrastive analysis (Figs. 2 and 3), the formation of the shoulder is produced during the intensity of the convection electric field suddenly decreasing (Goldstein et al., 2002; Pierrard and Lemaire, 2004), when IMF suddenly turns northward from southward. There are three shoulders reproduced during this substorm period, depicted in Fig. 3b–g. The time of the shoulder appearance is labeled by three red circles in Fig. 2, at 14:00, 17:00, and 23:00 UT on 8 June, respectively. At that moment, the Bz component of the IMF turns northward. But not all of the times could the Bz component of the IMF that turns northward produce the shoulder structure. One can see that no shoulders were reproduced in the results of the simulation, at 02:00, 05:00, and 08:00 UT on 9 June 2001, respectively. The Bz value of southward component must be less than the previous 24 h mean value. The intensity of the convection electric field is greater than the previous 24 h level. So the last closed equipotential line (LCE) would be closer to the Earth and result in the plasmapause of inward flow in the predawn sector (Zhang et al., 2013).
The physical explanation of shoulder formation is not yet understood. In the present section, we use the case of Fig. 1 as an example to investigate the physical mechanism of shoulder formation based on the TPM model. Fourteen test particles are placed in the range of 2.5 ≤ L ≤ 3.8, initial position located at 12:00 MLT, space step takes 0.1 RE, and then trace these particles' motion. Outputs are the trajectory (see Fig. 5a) and the rotation rate (see Fig. 5b) of these test particles corresponding to given magnetic local time illustrated in the bottom of Fig. 5.
The top panel shows that the outer part of plasmasphere (L > 3.3 RE) drifts inward before 02:00 MLT, and moves outward (could reach up to 3.9 RE position) in the predawn sector (after 03:00 MLT sector) (Verbanac et al., 2018). The radial motion of inner plasmasphere (L < 3.3) is negligible. The shoulder is forming across 03:00–06:00 MLT region (between blue vertical line and black vertical line in Fig. 5a). The outermost particle moves outward 0.7 RE, and the fourth particle moves outward 0.45 RE, from 03:00 to 08:00 MLT. So, the shoulder has a sharp eastern edge about 0.2 ∼ 0.3 RE in radial extension and across a narrow 3–5 h MLT region. Goldstein et al.(2002) proposed the shoulder formation by an outward radial motion of plasma in a narrow range and in the morning sector. The simulation of this paper verifies the conclusions of Goldstein et al. (2002) and Verbanac et al. (2018).
The lower panel shows the corotational angular velocity of test particles in the range of 2.5 < L < 4.0. The simulation results suggest that plasma element in plasmasphere region rotation speed varies significantly with radial distance (Galvan et al., 2010). The inner part of plasmasphere rotates faster than its outer part before 02:00 MLT sector, vice versa in a range of in the 03:00–08:00 MLT sector (Lejosne and Mozer, 2016). The previous researchers analyzed the EUV observation and proposed the shoulder structure has MLT sharpening in the angular direction. It indicates that the outer edge of the shoulder rotates faster than the inner edge, resulting in steepening of the MLT profile of the shoulder (Goldstein et al., 2002). The lower panel shows, with the increase of L, the rotation rate of the plasmasphere tends to slightly decrease on the dusk side and obviously increase on the dawn side.
Figure 5 indicates, in the region of 21:00–23:00 MLT, that the rotation rate is about corotation in the inner plasmasphere (L < 3), but it is the interval of 70 %–90 % of corotation in the outer plasmasphere (L > 3). The rotational value decreases with the increase of L (Galvan et al., 2010). Gallagher et al. (2005) investigate the drift rate of notches in the geomagnetic quite phase, and the results show that the average rotation rate of plasmasphere is about 90 % of the corotational rate, in agreement with the results of Lejosne and Mozer (2016). When the plasma elements rotate to the region of 23:00–02:00 MLT, the rotation rate in the outer plasmasphere reaches ∼ 130 % of corotation, and in the inner plasmasphere it is also close to the corotation rate. The results show that the rotation rate of plasmasphere is overall increasing in the region. In addition, the plasma elements in the outer plasmasphere rotate faster than the inner plasmasphere in this region. Figure 5b shows that the rotation rate in the outer plasmasphere reaches up to ∼ 140 % of corotation, and rotation rate in the inner plasmasphere is close to 110 % of corotation. So, we propose that the physical mechanism of the shoulder formation is plasma extrusion of outer plasmasphere in the predawn sector, due to the outer plasmasphere both drifting radially outward and rotating faster. In the present paper, the results show that the rotation rates of simulation are higher than the observations, not consistent with Huang et al. (2011) and Galvan et al. (2010). The first reason is that this is a substorm case, so the convection of magnetosphere is greater than the previous study articles of the geomagnetic quiet case (Galvan et al., 2010; Huang et al., 2011; Verbanac et al., 2018). The second reason is that the Weimer electric field model is larger in practice, which results in a larger total electric field value in calculation (Goldstein et al., 2002; Pierrard et al., 2008).
The dawn–dusk asymmetry of convective electric field is caused by the terminal conductivity gradient of the ionosphere. The subrotation of the ionosphere drives the subrotation of the plasmasphere, and the plasmaspheric drift is correlated with the phase of geomagnetic storm (Burch et al., 2004). The convection electric field of Weimer (2001) is obvious dawn–dusk asymmetry, which causes a smaller increase on the dawn side and a larger decrease on the dusk side, indicating that the subrotational effect of the plasmasphere is modulated by field-aligned current changes and conductance variations (Liemohn et al., 2004). The asymmetry of potential pattern causes the sunward convection in the magnetospheric nightside to be larger than that in the morning side, resulting in the subcorotational flow in the dark side (Gallagher et al., 2005).
In this paper, we simulated the case of a substorm on 8 June 2001 to investigate the physical mechanism of the shoulder formation based on TPM model that utilizes Weimer's electric field and the drift motion theory. We use the E-model and the B-model that are quasi-static background field and global averages. So, the results of simulation have some deviations with EUV observation. But we have satisfactorily reproduced the evolution and development of the features of the plasmapause, like the shoulders and plumes. And then, the physical mechanism of the shoulder formation has been investigated.
The formation of shoulder is associated with IMF northward turning in the predawn sector. And the physical mechanism of shoulder formation is the result of plasma extrusion in the predawn sector, caused by the fact that the outer plasmasphere drifts radially outward and rotates faster. The corotation rate in the midnight sector decreases with the increasing L-shell, while it increases in the pre-dawn sector. So, the shoulder forms across in the 03:00–06:00 MLT region.
The formation and evolution of plume and channel have also been reproduced in this case. One can see single or double plumes appear in the dusk or afternoon sector, then become thinner with time, and finally disappear.
In this model, we do not consider the refilling process of the ionosphere. In future work, the refilling process should be considered, and we expect to obtain more reasonable results. Also, the physical mechanisms of plasmaspheric features observed by EUV/IMAGE, like notches or channels, are to be investigated by the TPM model in future work, which is currently underway.
The codes and algorithms used in this work may be provided upon request via e-mail (289534957@qq.com).
Geomagnetic indexes and ACE satellite data are accessible from the following website: http://wdc.kugi.kyoto-u.ac.jp/wdc/Sec3.html (Pierrard and Cabrera, 2005). The dataset of EUV/IMAGE can be downloaded from the following website: http://euv.lpl.arizona.edu/euv/ (Galvan et al., 2010).
HZ conceptualized the project and wrote the original draft of the paper. GP modified the figures and coded the Fortran program. CS supervised the project and reviewed and edited the paper. YW gave some suggestions and drew Fig. 4 for the paper.
The authors declare that they have no conflict of interest.
Publisher's note: Copernicus Publications remains neutral with regard to jurisdictional claims in published maps and institutional affiliations.
This work was supported by the National Key R&D Program of China (grant no. 2018YFC1407304), the Natural Science Foundation of Jiangsu Province (grant no. BK20170952), the National Natural Science Foundation of China (grant no. 41874190), and the Stable Support Projects of Institutes for Basic Scientific Research (grant nos. A131901W14, A131902W03).
This paper was edited by Wen Li and reviewed by two anonymous referees.
Burch, J. L., Mende, S. B., Mitchell, D. G., Moore, T. E., Pollock, C. J., Reinisch, B. W., Sandel, B. R., Fuselier, S. A., and Gallagher D. L.: Views of Earth's magnetosphere with the IMAGE satellite, Science, 291, 691–624, https://doi.org/10.1126/science.291.5504.619, 2001.
Burch, J. L., Goldstein, J., and Sandel, B. R.: Cause of plasmasphere corotation lag, Geophys. Res. Lett., 31, L05802, https://doi.org/10.1029/2003GL019164, 2004.
Carpenter, D. L. and Anderson, R. R.: An ISEE/Whistler model of equatorial electron density in the magnetosphere, J. Geophys. Res., 97, 1097–1108, https://doi.org/10.1029/91JA01548, 1992.
Chen, A. J. and Wolf, R. A.: Effects on the plasmasphere of a time-varying convection electric field, Planet. Space Sci., 20, 483–509, https://doi.org/10.1016/0032-0633(72)90080-3, 1972.
Gallagher, D. L., Adrian, M. L., and Liemohn, M. W.: Origin and evolution of deep plasmaspheric notches, J. Geophys. Res., 110, A09201, https://doi.org/10.1029/2004JA010906, 2005.
Galvan, D. A., Moldwin, M. B., Sandel, B. R., and Crowley, G.: On the cause of plasmaspheric rotation variability: IMAGE EUV observation, J. Geophys. Res., 115, A01214, https://doi.org/10.1029/2009JA014321, 2010.
Goldstein, J., Spiro,R. W., Reiff, P. H., Wolf, R. A., Sandel, B. R., Freeman, J. W., and Lambour, R. L.: IMF-driven overshielding electric field and the origin of the plasmaspheric shoulder of May 24, 2000, Geophys. Res. Lett., 29, 1819, https://doi.org/10.1029/2001GL014534, 2002.
Grebowsky, J. M.: Model study of plasmapause motion, J. Geophys. Res., 75, 4329–4333, https://doi.org/10.1029/JA075i022p04329, 1970.
Huang Y., Xu, R. L., Shen, C., and Zhao H.: Rotation of the Earth's plasmasphere at different radial distances, Adv. Space. Res., 48, 1167–1171, https://doi.org/10.1016/j.asr.2011.05.028, 2011.
Lejosne, S., and Mozer, F. S.: Van Allen Probe measurements of the electric drift at Arecibo's L = 1.4 field line coordinate, Geophys. Res. Lett., 43, 6768–6774, https://doi.org/10.1002/2016GL069875, 2016.
Li, L. and Xu, R. L.: Model of the evolution of the plasmasphere during a geomagnetic storm, Adv. Space. Res., 36, 1895–1899. https://doi.org/10.1016/j.asr.2003.10.057, 2005.
Liemohn, M. W., Ridley, A. J., Gallagher, D. L., Ober, D. M., and Kozyra, J. U.: Dependence of plasmaspheric morphology on the electric field description during the recovery phase of the 17 April 2002 magnetic storm, J. Geophys. Res., 109, A03209, https://doi.org/10.1029/2003JA010304, 2004.
Nishida A.: Formation of plasmapause, or magnetospheric plasma knee, by the combined action of magnetospheric convection and plasma escape from the tail, J. Geophys. Res., 71, 5669–5679, https://doi.org/10.1029/JZ071i023p05669, 1966.
Pierrard, V. and Cabrera, J.: Comparisons between EUV/IMAGE observations and numerical simulations of the plasmapause formation, Ann. Geophys., 23, 2635–2646, https://doi.org/10.5194/angeo-23-2635-2005, 2005.
Pierrard, V. and Cabrera, J.: Dynamical simulations of plasmapause deformations, Space. Sci. Res., 122, 119–126, https://doi.org/10.1007/s11214-006-5670-3, 2006.
Pierrard V. and Lemaire, J. F.: Development of shoulders and plumes in the frame of the interchange instability mechanism for plamapause formation, Geophys. Res. Lett., 31, L05809, https://doi.org/10.1029/2003GL018919, 2004.
Pierrard, V., Khazanov, G. V., Cebrera, J., and Lemaire, J.: Influence of the convection electric field models on predicted plasmapause positions during magnetic storms, J. Geophys. Res., 113, A08212, https://doi.org/10.1029/2007JA012612, 2008.
Sandel, B. R., King, R. A., Forrester, W. T., Gallagher, D. L., Broadfoot, A. L., and Curtis, C. C.: Initial results from the IMAGE extreme ultraviolet imager, Geophys. Res. Lett., 28, 1439, https://doi.org/10.1029/2001GL012885, 2001.
Verbanac, G., Bandic, M., Pierrard, V., and Cho, J.: MLT plasmapause characteristics: Comparison between THEMIS observations and numerical simulations, J. Geophys. Res.-Space, 123, 2000–2007, https://doi.org/10.1002/2017JA024573, 2018.
Weimer, D. R.: An improved model of ionospheric electric potentials including substorm perturbations and application to the Geospace Environment Modeling November 24, 1996, event, J. Geophys. Res., 106, 407–416, https://doi.org/10.1029/2000JA000604, 2001.
Zhang, H., Xu, R. L., Zhao, H., and Shen, C.: The characteristics of the model of Weimer's electric field within the magnetosphere, Chinese J. Geophys., 55, 36–45, https://doi.org/10.6038/j.issn.0001-5733.2012.01.004, 2012.
Zhang, H., Xu, R. L., Shen, C., and Zhao, H.: The simulation of the plasmaspheric morphology during a magnetospheric disturbance event, Chinese J. Geophys, 56, 731–737, https://doi.org/10.6038/cjg20130302, 2013.