A Review of Recent and Emerging Approaches for the Clinical Application of Cerenkov Luminescence Imaging
 Benedict Mc Larney
 Magdalena Skubal1,2
  Jan Grimm
- 1Molecular Pharmacology Program, Memorial Sloan Kettering Cancer Center, New York, NY, United States
- 2Department of Radiology, Memorial Sloan Kettering Cancer Center, New York, NY, United States
- 3Department of Pharmacology, Weill Cornell Medical College, New York, NY, United States
- 4Department of Radiology, Weill Cornell Medical College, New York, NY, United States
Cerenkov luminescence is a blue-weighted emission of light produced by a vast array of clinically approved radioisotopes and LINAC accelerators. When β particles (emitted during the decay of radioisotopes) are present in a medium such as water or tissue, they are able to travel faster than the speed of light in that medium and in doing so polarize the molecules around them. Once the particle has left the local area, the polarized molecules relax and return to their baseline state releasing the additional energy as light (luminescence). This blue glow has commonly been used to determine the output of nuclear power plant cores and, in recent years, has found traction in the preclinical and clinical imaging field. This brief review will discuss the technology which has enabled the emergence of the biomedical Cerenkov imaging field, recent pre-clinical studies with potential clinical translation of Cerenkov luminescence imaging and the current clinical implementations of the method. Finally, an outlook is given as to the direction in which the field is heading.
Introduction
A luminescence from radioactive compounds was first mentioned by Marie Curie. She observed a faint blue glow from the bottles of radium she had isolated and stored in her home [1]. This observation was not pure Cerenkov luminescence (CL) as we now know but was due to the fluorescent excitation from alpha (α) particles emitted by radium of fluorescent impurities in the solution such as radium bromide and uranium chloride. Following this observation, the process by which CL is generated was outlined by Pavel Cerenkov and mathematically described by Frank and Tamm [2, 3]. These seminal works established the cornerstone for CL and have been integrated to measure the activity levels of the cores of nuclear power plants, where the faint blue glow is synonymous with fuel load [4]. Naturally, the levels of radioactivity in a power plant are orders of magnitude higher than those commonly used in clinical radiotherapy or radioisotope administration for the screening or treatment of cancers. The former allows for CL to be observed by the naked eye whilst the latter is only detectable using highly sensitive cameras. CL imaging (CLI) was first described in 2009, and since then has demanded the attention of the biomedical imaging field [5]. This brief review aims to highlight some of the recent developments in the field of CLI with a focus on current and potential clinical applications of CLI including screening, surgical resection and dosimetry.
Physical Principles of Cerenkov Luminescence
As the goal of this review is to highlight current and emerging pre- and clinical approaches of CL, the physics behind CL generation will be described in brief and cover the main aspects of the phenomenon. Radioactive isotopes have unstable atoms which decay in order to achieve stability. During this decay there is a release of radiation in the form of energy and a particle: alpha (α), beta (β) or gamma (γ). The majority of CL is generated by either positively (β+) or negatively (β−) charged β particles [5–10]. To date numerous studies have outlined the use of 12 β emitters for CLI [11]. Since these subatomic particles are charged they are capable of polarizing the medium they pass through. For linear accelerators (LINACs), this process is the same although in this case electrons pass through the tissue at two to three orders of magnitude higher kinetic energy [12]. As the charged particle travels through a dielectric medium, it rapidly polarizes the surrounding molecules, aligning them in a polarizing field surrounding the particle. In media such as water or tissue the speed of these particles is faster than the speed of light in that medium, an essential condition for CL generation. The high velocity of the particle results in the molecules being rapidly excited (polarized) followed by rapid return to their baseline energetic state as the subatomic particle has passed by, as shown in Figure 1I. The rapid relaxation causes the polarized molecules to release the acquired energy as blue weighted light (CL). The emitted light will travel as a wavefront in the direction of the particles travel at an angle (theta), as shown in Figure 1II. In this sense it is important to note that CL is in fact an indication of the response of a surrounding medium to radioactive decay or LINAC-generated radiation as opposed to detecting the particle itself. On average, a β particle from radioisotopes, is capable of travelling from 1 to 4 mm in a random fashion from the point of decay with increased travel distance, depending on the kinetic energy of the particles [13]. The CL released is heavily weighted to the blue end of the spectrum with most light being emitted in the U.V. and reducing at a rate of 1/λ2 towards the red end of the spectrum as shown in Figure 2 [11].
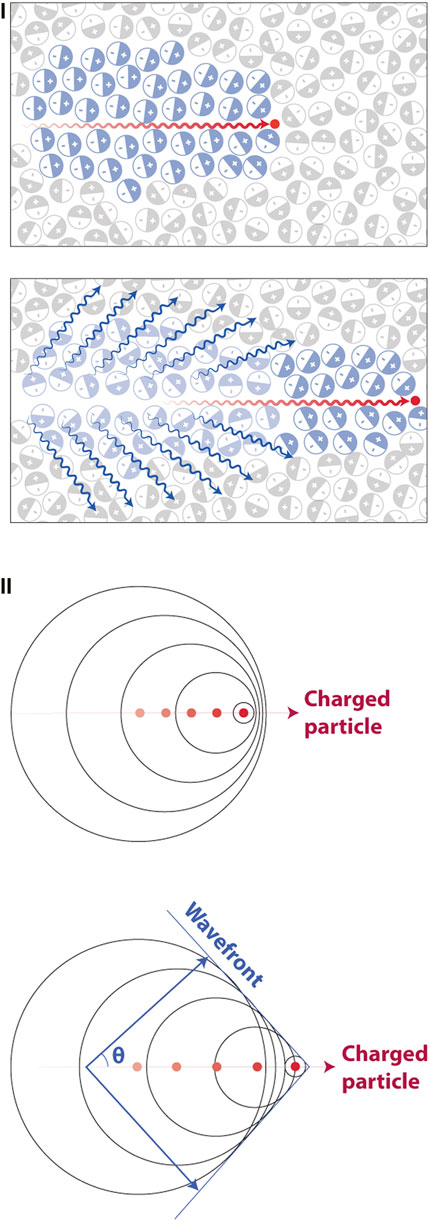
FIGURE 1. The process in which Cerenkov luminescence is generated. (I)Top, the particle travelling at a velocity faster than light in the dielectric medium e.g., water or tissue polarizes the surrounding molecules in the medium. Bottom, once the particle has passed, molecules return to their ground state and release blue weighted light (CL, blue wavy lines). (II) The produced waves are coherent in nature travelling as a wavefront of light in the same direction as the particles travel at a forward angle theta. Reproduced with permission from [14], © 2017 Springer Nature Limited.
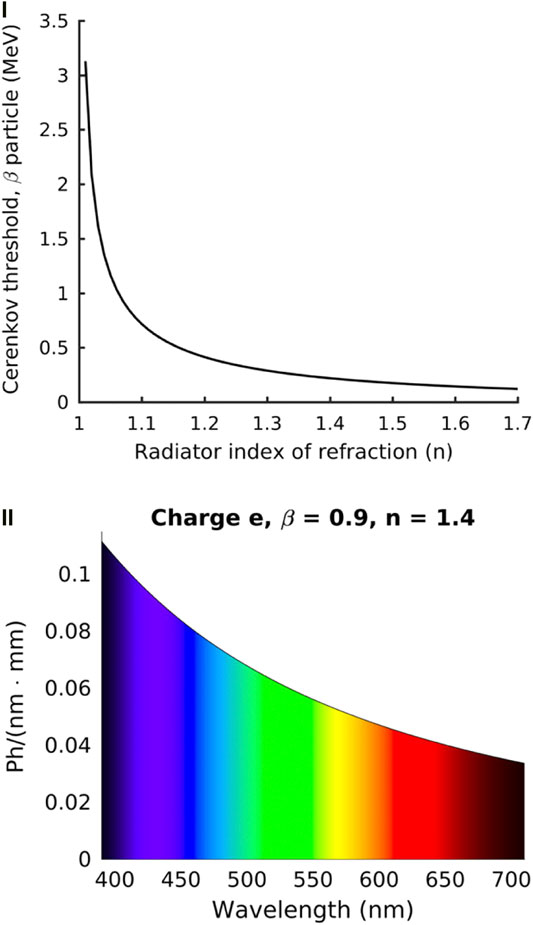
FIGURE 2. The energy limits for β particles to produce CL and the corresponding CL spectrum. (I) The refractive index has a direct effect on the kinetic energy required for a β particle to produce CL. This example assumes a β particle with a kinetic energy of 0.511 MeV. (II) The CL spectrum is blue weighted with the amount of light produced corresponding to the wavelength and path length. Representative of a particle with charge e and β = 0.9 in a dielectric medium with a refractive index of 1.4. Reproduced with permission under creative commons license (4.0) from [11], ©Ciarrocchi et al. 2017, BioMed Central Ltd.
Notably, the refractive index of the medium has a direct effect on the kinetic energy threshold needed for the particle to produce CL as shown in Figure 2I. In most tissues the minimum energy required for CL generation is 219 keV assuming an average refractive index of 1.4 (but may range from 1.35 to 1.7) and as shown in Figure 2I, this threshold decreases as the refractive index of the medium increases [11]. The resulting CL emission spectrum as a function of wavelength is shown in Figure 2II. Notably, numerous clinically approved radiotracers such as 18F-FDG, 131I and 68Ga readily produce β particles that reach or surpass the required energy levels to generate CL e.g., 18F undergoes a decay process resulting in β particles 96.9% of the time with a mean kinetic energy of 219 keV. Nevertheless, the CL emitted from radioisotopes is dimmer than ambient room light and requires dark, stray photon free conditions with highly sensitive optical equipment in order to be detected [5]. As a result, CL imaging of radioisotopes must be carried out in completely dark enclosures. In comparison to this, radiation therapy using LINACs (X-Ray based) is capable of producing bright CL that can be used to determine dosimetry and therapeutic location. In these situations, ambient room light does not pose as much of an issue as gating can be employed to capture only CL [12].
Preclinical Imaging
Positron emission tomography (PET) is a well-established technology both preclinically and clinically. PET provides nuclear imaging with high sensitivity and whole-body imaging but suffers from poor spatiotemporal resolution along with high establishment and acquisition costs. Optical imaging can achieve higher resolution than that seen with PET however, unlike PET this resolution depends on the wavelength and dramatically decreases with increased imaging depth in tissues [15]. Notably, the blue-weighted emission of CL is the most susceptible to tissue scattering and absorption reducing the effective resolution and achievable penetration depths. Unlike CLI, the resolution for PET imaging is predominantly uniform across the imaged area [16]. Whilst CLI is limited by the scattering and penetration depths of light it can provide higher resolution than PET at shallow depths (the ballistic regime of light, a few hundred microns in tissue), can utilize numerous compounds (mostly non-radioactive dyes) and is orders of magnitude cheaper than PET to establish and acquire [15]. Additionally, optical cameras have a much smaller footprint than the majority of PET systems, however there have been recent developments reducing the footprint of PET/CT (PET/computed tomography) scanners to the same range as optical scanners [17]. Highly sensitive charge coupled device (CCD) cameras have been developed and have become a commonplace piece of equipment in preclinical settings. The ability to electron multiply (EMCCD) the sensors has further increased their sensitivity to single photon levels where they have a wide range of applications from microscopy to whole-animal imaging. The technological developments of CCDs have developed sensors with extremely low read noise, an essential component for detecting CL where acquisition times often range in the order of seconds to minutes [18].
Radiotracer detection in small animals can be achieved on the order of tens of seconds with CLI as compared to tens of minutes for PET [19]. In the case of small animal imaging the limitations of PET are further exacerbated where the low resolution is undesirable in model organisms such as mice [20]. Optical imaging is therefore highly suited to small animal imaging. This is especially true for CLI where the smaller organism size allows generated CL to escape from the tissue and be detected [11]. Since the first demonstration of CLI, it has been rapidly adopted in preclinical imaging where many of the systems used for fluorescence imaging were already capable of detecting CL [21, 22]. This positions CLI as a cheaper, faster and higher resolution alternative to PET for shallow imaging depths with the ability to screen multiple animals simultaneously. The knock-on effect of this is that targeted radioisotopes or new radioisotope-based therapies can be quickly assessed using pre-clinical CLI reducing the time and cost needed to generate preclinical data that may translate to the clinic [8, 23, 24].
Cancer research has established numerous methods for xenograft generation, including patient derived tumors [25, 26]. Whilst clinical research is limited to FDA approved treatments, which is often a long and expensive process, preclinical research has so far undoubtedly been the driver for furthering the application of CLI and has often enabled the clinical translation of CLI. The most commonly administered β emitting radioisotope is 18F-FDG, which takes advantage of the Warburg effect (increased uptake in highly metabolic cells such as those found in tumors) [27, 28]. Due to its increased uptake in tumors 18F-FDG has been used in clinical imaging for decades and is widely produced using cyclotrons facilitating access to both researchers and hospitals [29]. The increasing availability of radioisotopes and affordability of optical imaging technologies has spurred an abundance of custom and off the shelf preclinical CLI systems. All of these systems are united by a common theme: a highly sensitive camera (usually EMCCD) is used in combination with a “fast” lens i.e., one with a low f number (e.g., 0.95) to ensure the most efficient collection of light. Lastly, the system and imaging are undertaken in an enclosed dark room or box where photons of light from non-Cerenkov sources e.g., room lights cannot interfere with tracer originating signals. Pixel binning (usually four or eight binning) is often performed in order to increase sensitivity along with longer acquisition times on the order of minutes (∼300s). The resulting image (molecular) is then corrected for gamma strikes using median filtering and overlaid onto a white light (anatomic) image captured using either the same optical setup or a secondary color camera [30]. Having established the optimum settings for acquisition the method has now been implemented in a variety of pre-clinical settings. With suitable phantoms and preliminary testing, the detected light intensity can further be used to calculate the level of radioactivity in the tissue [5, 31].
CLI is predominantly used to monitor radioisotope uptake from a host of β+, β−, and γ emitters, although the exact process of CL generation by γ emitters is unknown it is likely due to Compton electron interactions [11]. Preclinical CLI is often carried out using a system originally designed for bioluminescence and fluorescence imaging known as the IVIS® system [5, 32–34]. In comparison to PET, CLI has shown an up to 8 times decrease in workflow time with three orders of magnitude higher sensitivity to radioisotopes under suitable conditions [35, 36]. Due to the functional uptake of compounds like 18F-FDG in tumors due to the Warburg effect, CL is regularly used preclinically to perform surgical resection and biodistribution of tracers as well as tracking tumor development in vivo [32, 37]. CLI has further been used to assess the levels of ongoing apoptosis due to chemotherapy treatment of drug resistant gastric cancer [38]. In this example, the efficacy of vincristine and cisplatin were tested against SGC7901/VCR and SGC7901/WT. 68Ga-DOTA-Annexin V was used to determine apoptosis levels in the tumors with higher CL levels corresponding to higher levels of apoptosis. This may have direct implications for treatment choice based upon patient derived xenografts using CLI to track treatment effect [38].
Whilst the Warburg effect has proven to be robust and reliable for all levels of tumor imaging, it is in fact a non-specific way of delivering radioisotopes to tumor targets. As a result, antibody targeting in combination with radiotracers for both screening and therapy has seen a fast adoption in cancer research [39]. This rapid development has seen the FDA clinical approval of 31 cancer specific antibodies (at the time of writing), with targets ranging from gastric cancer to lymphoma and leukemia. The use of antibody conjugated radioisotopes has significant advantages over non-targeted radioisotopes with reduced off target effects and uptake. Naturally this has been employed in CLI, with the modality serving as a method for the screening and testing of novel PET radiotracers. One such example is the CLI of 64Cu-NODAGA-PSMA-IgG and 64Cu-NODAGA-PSMA-Mb, an intact and small-molecular-weight derivative minibody, as shown in Figure 3I [23]. In this case both the anti-PSMA antibody (huJ591, IgG; 150 kDa) and minibody (Mb; 80 kDa) were functionalized with the chelator 1,4,7-triazacyclononane-1-glutaric acid-4,7-diacetic acid (NODAGA) followed by radiolabelling with 64Cu. Here, CLI was capable of differentiating the uptake kinetics between both compounds with the results being validated with PET. Tumors could be readily identified in both modalities highlighting the applicability of CLI.
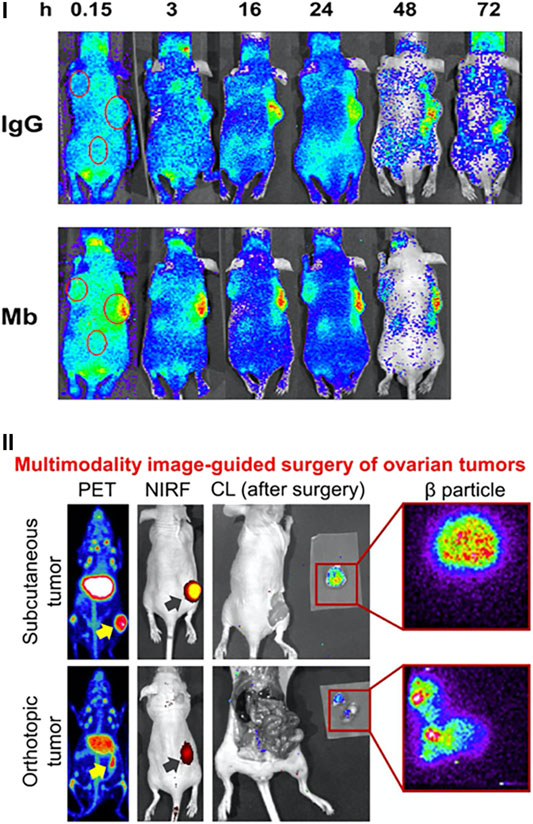
FIGURE 3. Preclinical applications of CLI. (I) CLI is used to determine the specificity of antibody-based targeting over time of 64Cu-NODAGA-PSMA-IgG (top) or 64Cu-NODAGA-PSMA-Mb (bottom). PSMA positive tumors are on the RHS with PSMA negative tumors on the LHS. Reproduced with permission from [23], © 2017 SNMMI. (II) CLI can readily act as a complementary modality to PET, NIRF and β imaging. Reproduced with permission from [42] under Creative Commons Licence, © Lee et al. 2019.
The wide availability of medical imaging methods further allows CLI to conveniently slot into multi-modality studies. One recent example is the investigation into dual labelled ICAM-1 (intercellular adhesion molecule 1, i.e. CD54, which is known to be produced in many cancer types) for the early detection of pancreatic cancer [40]. In this work ICAM-1 was conjugated to both 89Zr and 800CW for the in vivo detection of pancreatic cancer foci in tumor tissue. Mice bearing subcutaneous BXPC-3 and ASPC-1 tumors (human pancreatic adenocarcinoma cell lines), ICAM-1 expressing and non-expressing tumors, respectively, were administered 800CW/89Zr-ICAM-1. The distribution of the molecule was readily detected with PET, near-infrared fluorescence (NIRF), β particle imaging and Cerenkov with all modalities showing high uptake of the compound in BXCP-3 tumors as shown in Figure 3II [40]. A separate study also took advantage of multimodality imaging with CLI. In this case, ovarian cancer resection was achieved using pertuzumab (targets human epidermal growth factor receptor 2, HER2) labelled with 89Zr and again 800CW [41]. PET and NIRF imaging were performed on mice expressing subcutaneous and orthotopic SKOV3 tumors (human ovarian adenocarcinoma cell line) at 2, 6, 24, 48 and 72 h. At the final timepoint CLI was used both post operatively in combination with β particle imaging to ensure complete resection of the tumors [41]. These studies highlight the applicability of CLI for preclinical tracer development and provide an example of the pathway for direct clinical translation of CLI.
A current requirement for CLI is the need for imaging conditions as dark as possible where sources of ambient photons must be eliminated and no stray photon from ambient light is allowed. This poses difficulties for the screening of radioisotopes but places CL endoscopy (CLE) in a strong position that can be readily and quickly adapted for CLI. Naturally, ambient photons are dramatically reduced (if not completely eliminated) when imaging internal structures. Endoscopy is commonly employed in preclinical imaging and as such using a combination of suitable adapters and mounting current endoscopy systems on sensitive EMCCDs, researchers can render a state-of-the-art CLE system. It should be noted that these systems can readily double as highly sensitive fluorescence endoscopy setups by further incorporating suitable illumination sources and the appropriate optical filter sets. Numerous CLE systems have been produced with one such laparoscope based system achieving a spatial resolution of 62.5 µm, a field of view diameter of 10 mm and a sensitivity of 1.7 × 10⁻³ μCi/μl for 18F-FDG [30]. The system was capable of detecting and resecting both orthotopic and subcutaneous hepatocellular carcinomas in vivo with a potential for direct clinical translation.
Clinical Screening
The assessment of radiotracer distribution in preclinical settings has positioned CLI as a promising clinical tool for patient screening. Clinical screening introduces further complexities and scaling issues for CLI compared to preclinical CLI. These complexities are namely the complete removal of ambient photons with a human sized enclosure and the increased depths at which tumors can be located, reducing the amount of CL which can escape the tissue. Ambient photon removal has been achieved via the development of custom CL enclosures. Collection of CL which can escape the tissue is achieved via highly sensitive cameras (single photon detection) used in corporation with a high-speed lens (low f number e.g., 0.95) to allow maximum light collection efficiency. The first example of human CLI was reported in 2013 [43]. Similarly to many preclinical demonstrations, the systems sensitivity was first tested with 18F-FDG with and without chicken breast tissue [5, 43]. The setup was then used to detect orally administered 131I to a patient 24 h prior to imaging [43]. CLI could readily detect localized uptake in the thyroid as shown in Figure 4I [43]. The importance of CLI in this case is highlighted by the fact that 131I is a β− emitter and therefore cannot be detected with conventional nuclear imaging methods whilst simultaneously proving CLI could be carried out in humans. Following this, a second demonstration of CLI was published consisting of a cohort of six patients undergoing PET imaging for the detection of nodal disease [10]. The patients were intravenously administered 18F-FDG and imaged approximately 70 min post injection. Ipsi- and contralateral CL images were taken of suspected benign and diseased nodes in the head and neck of the patients as shown in Figure 4II. In this case the setup showed detection sensitivities in the nanocurie range, could differentiate between benign and diseased nodes and the CLI images could be readily correlated to PET images, the gold standard for such screening [10]. In both clinical screening examples imaging could only be carried out with the complete removal of ambient photons. This was achieved by placing the patient in a dark room with a light sealed door followed by an optical drape to ensure ambient photon removal. To date there have been no further publications progressing the clinical screening potential of CLI.
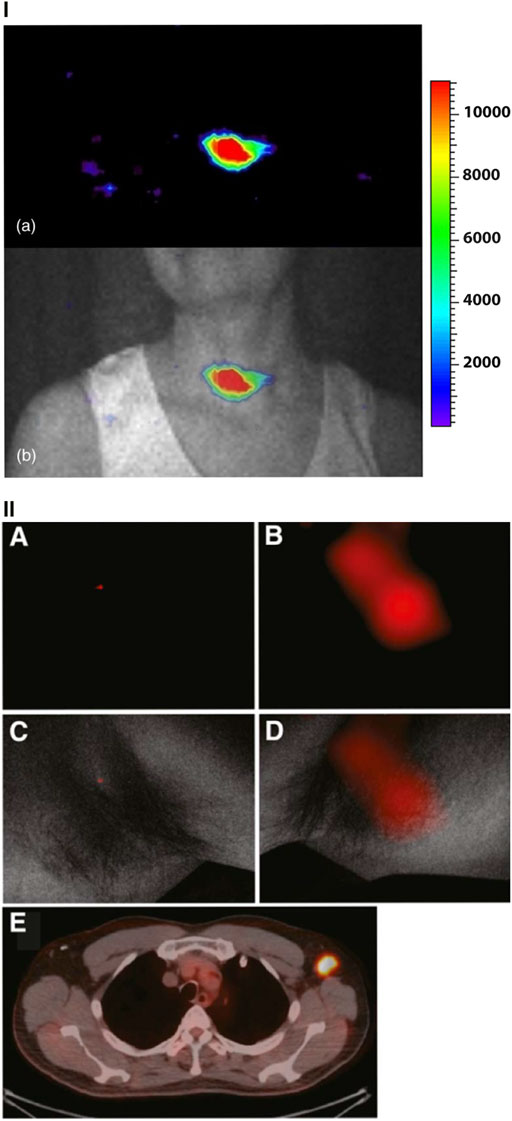
FIGURE 4. Clinical screening implementations of CLI. (I) (a) CLI of the thyroid gland in a patient 24 h post 131I administration. (b) Overlaying the CL image and the anatomical white light image reveal the CL image is well correlated with the anatomy and expected location of radioactivity uptake. Color scale is in arbitrary units. Reproduced with permission from [43] under creative commons licence, © Spinelli et al., 2013. (II) CL images along with corresponding PET/CT images from the same patient. (A, B) CL images of ipsi- and contralateral axillae. (C, D) The low CL signal from 18F-FDG negative lymph node and the high CL signal from the 18F-FDG positive lymph node. Both CL images are overlaid on the white light anatomical image. E, CL images are confirmed by the PET/CT scan. For clinical screening images are always taken in an enclosure devoid of ambient light (complete darkness). Reproduced with permission from [10], © 2014 SNMMI.
Clinical Boundary Determination
Complete resection of cancerous tissue ensuring no residual tumor margin is essential for patient recovery. A surgeon’s goal is to identify the extent and location of the tumor, which is mostly carried out through visual examination and palpation, and without compromising oncological safety completely remove the lesion with the least possible surrounding margin of healthy tissue. Due to the level of human error in these surgeries and non-specificity, there is a clear need for a more accurate technique to assess resection margins. Based on the uptake of FDA approved radioisotopes which produce CL, CLI has emerged as a rapidly deployed imaging modality for intraoperative tumor boundary determination. In one such example, CLI was used to provide guidance and tumor margin assessment using 18F-FDG and a back table imaging approach [44].
The feasibility, safety, and preliminary performance of 18F-FDG CLI in intraoperative margin assessment was also evaluated in breast-conserving surgery. Patients participating in the trial underwent wide local excision of grade 3, estrogen receptor–negative/Her-2–negative tumors with sentinel lymph node biopsy or axillary lymph node dissection. CLI permitted the assessment of tumor margins in 10 of the 12 patients with a significant correlation found between CLI and margin histopathology, as shown in Figure 5I A-D. Furthermore, the procedure was performed safely while preserving low radiation exposures to clinical staff [45]. 18F-FDG was also used for the first clinical application of endoscopic CLI. A novel back-table CLI system for “paraoperative” imaging of excised specimens was used to identify cancerous gastrointestinal lesions, where imaged patients received diagnostic doses of 18F-FDG. CL emitted by the imaging agent showed good correlation with clinical whole-body PET imaging and allowed for the quantification and differentiation of tumors from healthy tissue [46].

FIGURE 5. Intraoperative assessment of tumor resection boundaries in patients undergoing breast-conserving surgery and radical prostatectomy. (I) (A) Cerenkov image of a wide local excision of a grade 3, estrogen receptor–negative/human epidermal growth factor receptor 2–negative carcinoma. Filled white arrows indicate increased Cerenkov signal from the tumor, while outlined arrows indicate non-specific phosphorescent signal. (B) Grayscale photographic image overlaid with the Cerenkov image. Blue lines mark the 2 mm posterior margin, while green lines mark the 5 mm medial margin. (C) Specimen radiography image. (D) Histopathology image from two pathology slides where the posterior margin is visible at the bottom of image. Open arrows highlight the primary tumor. Reproduced from with permission from [45], © 2017 SNMMI. (II) CL images are overlaid onto grayscale photography images of prostate gland specimens from two patients. Incisions are marked by dotted lines. Dark and light blue marked regions of interest (ROIs) are used for background determination in the images. The pink and green ROIs highlight the increased CL signal that was correlated with histopathology to be cancerous. The orange ROI shows a non-cancerous area with increased CL signal. Reproduced with permission from [48], © 2020 SNMMI.
Most of the preclinical and clinical research in CLI has been restricted to the metabolic uptake of 18F-FDG. However, for prostate cancer that is hypometabolic and gathers smaller amounts of FDG, 18F-FDG is not a favorable imaging tool for both CLI and conventional nuclear methods on account of bladder signal accumulation. Due to the higher signal-to-noise ratio of 68Ga for CLI as a result of its higher β energy compared to 18F, it seemed to be better fit for positive surgical margin assessment with CLI for prostate cancer. Additionally, the 68Ga-Prostate-Specific Membrane Antigen (68Ga-PSMA) radiotracer significantly binds to the tissues with elevated PSMA expression i.e., prostate cancer cells [6]. 68Ga-PSMA was used for the first in man paraoperative 68Ga-PSMA CLI in prostate cancer for patients undergoing radical prostatectomy, ss shown in Figure 5II. The validated settings of 300 s exposure time, 8-pixel binning and acquisition without any optical spectral filters were found to favor tumor to background ratios. The tumor to background ratios were based on the intact prostate images and readily enabled positive surgical margin detection from negative surgical margins within an acceptable time and radiation exposure level to clinical staff. The CLI data from the cleaved prostate confirmed that the tumor had a higher radiance when compared to benign tissue. Both of these studies demonstrated that 68Ga-PSMA CLI is a promising tool for intraoperative margin assessment in prostate cancer [47, 48].
Internal radiation, such as brachytherapy involves positioning radioisotopes inside the body for cancer treatment. Previously, CLI had allowed the verification of the position and tilting of 106Ru plaques relative to melanin tumor phantoms in enucleated porcine eyes in vitro. Here, CLI was used for the assessment of 106Ru positive plaques in brachytherapy of uveal melanoma patients. Plaques were identified in the fundus of all the imaged patients. CLI allowed the assessment of plaque position relative to the tumor, which emerged as a darker area surrounded by CL. The CLI exposure time was adjusted to the degree of tumor pigmentation and plaque activity at the time of imaging. Heterogeneous tumor pigmentation, changes in melanin content, differences in tumor vascularization and hemoglobin content may lead to an emission pattern that differs from the shape of the tumor. This is especially relevant as melanin absorbs light at a wide range of wavelengths and can affect light emission [15]. CLI provided a view of the tumor and the plaque, which aided in the determination of the degree and direction of plaque displacement [49].
Clinical Dosimetry Monitoring
The energy achieved by β particles released by radioisotopes, especially those used in medical imaging such as 18F and 68Ga, is generally less than 1 MeV [50]. Whilst the CL production can be used to differentiate isotopes, the light levels are inherently weak, commonly requiring long acquisition times on the order of minutes [19, 51]. On the other hand, particles accelerated by a LINAC readily achieve energies on the order of 6–24 MeV [51]. Accordingly, the CL production by particles accelerated by LINACs is routinely up to six orders of magnitude brighter than that of isotopes, especially in comparison to standard doses of 18F [51]. The brightness of CL from LINACs has allowed for its rapid adoption to clinical settings to bridge a large gap in radiotherapy i.e., the real-time monitoring of delivered radiation dose to a patient from LINACs. In 2014, it was established that CL emission could provide accurate information on the radiotherapy dose building on previous work that established the potential for dosimetry via CLI [52, 53]. Following this the field rapidly developed and within a year video rate dosimetry via CLI had been established in the clinic with a typical CLI dosimetry setup as shown in Figure 6I [54]. By syncing the light acquisition to the pulses of the LINAC and recording the relevant background levels for subtraction, delivered radiotherapy to the patient was achieved without the need for ambient light removal [12]. In doing so the work established a method of CLI that eliminated one of its major limitations, the need for ambient photon removal. Patients could receive treatment whilst CLI was carried out in a non-obtrusive manner from afar. The method has since been employed to prove the phenomenon of flashing lights (phosphenes) reported by patients undergoing radiation therapy, as shown in Figure 6II [55]. The emission spectrum from the eye of a patient undergoing therapy corresponded to the known CL spectrum. Furthermore, the light intensity was reported to be twice the detectable limit of the human eye confirming the source of these flashes to be CL generated as charged particles travelled through the vitreous humor of the eye [55].
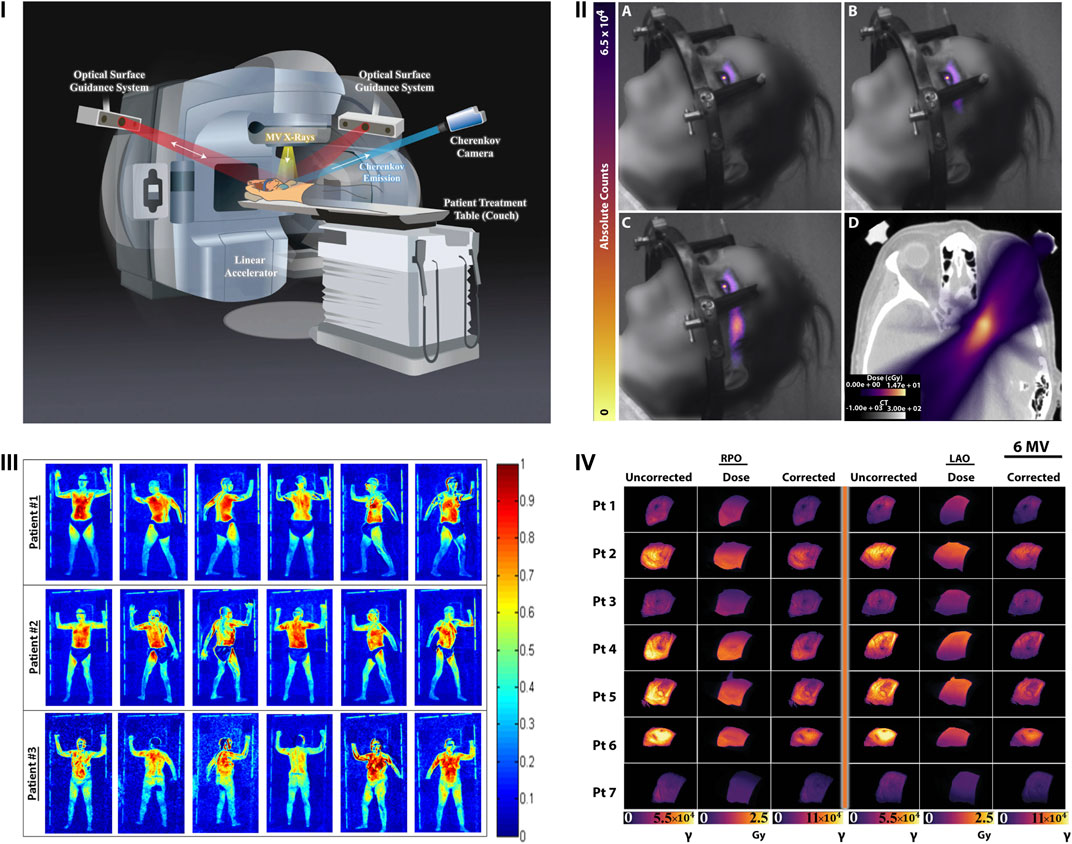
FIGURE 6. Clinical dosimetry monitoring with CLI. (I) The patient setup for dosimetry measurement with CLI during breast radiotherapy. The CLI camera is synced to the pulses of the LINAC to remove ambient light. Optical surface guidance systems aid in alignment of the patient prior to and tracking during treatment. Reproduced with permission under creative commons 4.0 from [58], © Hachadorian et al., 2017, Springer Nature Ltd. (II) A-C Cumulative CLI images of CL generated in the eye as a patient undergoes radiation therapy. D displays the planned cumulative dose (color) overlaid on a sample CT slice (grayscale). Reproduced with permission from [55] under creative commons licence 4.0, © Tendler et al., 2020. (III) Representative CLI images of three patients undergoing TSET as they progress through the six standard Stanford technique positions. Reproduced from with permission from [56], © 2016, American Association of Physicists in Medicine, John Wiley & Sons. (IV) Images captured using the setup in (I) representing the uncorrected, estimated dose and corrected CLI images from both right posterior oblique (RPO) and left anterior side (LAO) 6 MV beams from breast radiotherapy. Reproduced with permission under creative commons 4.0 from [58], © Hachadorian et al., 2017, Springer Nature Ltd.
CLI has also been applied to determine the uniformity of delivered dose from total skin electron beam therapy (TSET) [56]. In this example (Figure 6 III), the CLI device was setup to record planar visualizations of the 6 MeV TSET beam as it interacted with a plastic sheet. Recording of images whilst rotating the LINAC gantry angle 1° at a time from 239.5° to 300.5° allowed the determination of the optimum angle for treatment, 252.5° and 287.5° for this setup, providing uniform and optimized dose delivery to the patient area. The method highlights the potential variability with TSET treatment whilst demonstrating how CLI can provide a cost-effective method for optimum alignment delivering the best potential clinical treatment. It is likely that many TSET centers could benefit from such an alignment. This work has further been developed to verify how accurate CLI is in comparison to in vivo detectors (IVDs) the current standard of care for TSET dosimetry [57]. The authors used a combination of perspective and inverse square corrections to show a correlation of the CLI values to IVDs with an R2 of 0.99 for dose estimates at both the surface (0 mm) and at depth (6 mm) in the tissue. This further highlights the applicability of CLI for quantitative TSET measurements during treatment [57].
One of the current limitations for dosimetry based CLI is the ability to compensate for patient specific tissue properties and differences including but not limited to tissue composition (e.g., fibroglandular or adipose), skin color and radiation burn (erythema) [58]. As the recorded CL is inherently affected by the absorption and scattering of the tissue, accounting for these differences will enable CLI to accurately represent the deposited dose to the tissue. Considering that 50% of all breast cancer patients will undergo this treatment, accurate representation and recording of dose deposition is essential for improved patient care. Fortunately, the composition of breast tissue in terms of fibroglandular and adipose content can be readily discerned using CT. One such example took advantage of the CT Hounsfield units (HU) from treatment planning CT scans of patients to characterize and develop a correction factor for the recorded CL, as shown in Figure 6IV. The correction factor was first shown to qualitatively match the planned dose deposition and increased the quantitative similarity between CLI and the planned dose from an R2 of 0.67–0.85 for 6 MV beams and from 0.91 to 0.95 for 10 MV beams respectively [58]. The synergistic combination of CT and CLI provided a robust method for quantification of delivered dose in vivo, confirming the success of the planned radiation dose to the breast. Establishment of this correction factor provides a significant step in the application of CLI for quantitative dosimetry measurements that are in good agreement with the planned patient treatment.
Limitations and Outlook
The main limitation for CLI is undoubtedly tied to its reliance upon imaging of light within the visible spectrum. As previously mentioned, the CL intensity is brightest in this region of light, and the technology to capture these wavelengths is well developed. This has allowed single photon sensitivity for CLI at cost-effective prices. However, the absorption and scattering of light at these wavelengths is a detrimental limiting factor to the achievable penetration depths, on the order of a few hundred μm to a mm from the source [15, 59]. It is likely that the majority of CLI detection in fact comprises of wavelengths which can escape tissue in the first optical window, above 600 nm, especially in clinical imaging [12, 51]. Fortunately, β particles can travel a few mm in tissue producing CL along this path as long as they have sufficient energy [13]. The long travel lengths (mm’s) of β particles likely assists in the detection of deep-seated tumors with CL production close or at the skin surface but simultaneously reduce the effective CLI resolution and localization of tumors. Furthermore, capturing visible light with single photon sensitivity requires complete removal of ambient photons from all sources requiring light-tight enclosures. The construction and sealing of such enclosures have undoubtedly slowed the clinical adoption of CLI for both patient screening and resection.
The visible spectrum limitations for CLI have been sought to be overcome in a myriad of ways. Many have tried FRET/CRET/SCIFI to convert the visible spectrum to longer red wavelengths, particularly in the case of radioisotopes [14, 60, 61]. In the case of LINAC based CLI, impressive engineering has synced the acquisition of the camera with the LINAC pulse, allowing the complete removal of ambient room light [12]. Further work has aimed to carry out CLI in the region of light at shortwave infrared (SWIR) wavelengths where absorption, scattering and autofluorescence are orders of magnitude reduced compared to visible wavelengths. This has been achieved with both quantum dots to upconvert the visible CL to SWIR wavelengths and direct observation of SWIR CL emission from LINACs [62, 63].
Conclusion
Considering its preclinical applications, current clinical implementations, relative ease and cost-effective setup CLI is positioned to be a rapidly adopted modality in clinical settings. The advent of single photon sensitive cameras has accelerated this adoption. Further developments will ensure CLI is capable of quantitative clinical measurements of radiation in the case of both medical radioisotopes and dosimetry.
Author Contributions
All authors listed have made a substantial, direct, and intellectual contribution to the work and approved it for publication.
Funding
This work was funded by NIH R01 CA183953 (JG). This work was also funded in part through the NIH/NCI Cancer Center Support Grant P30 CA008748.
Conflict of Interest
The authors declare that the research was conducted in the absence of any commercial or financial relationships that could be construed as a potential conflict of interest.
Publisher’s Note
All claims expressed in this article are solely those of the authors and do not necessarily represent those of their affiliated organizations, or those of the publisher, the editors and the reviewers. Any product that may be evaluated in this article, or claim that may be made by its manufacturer, is not guaranteed or endorsed by the publisher.
References
2. Čerenkov P. Visible Light from Pure Liquids under the Impact of γ-rays. CR (Dokl.) Acad Sci URSS (1934) 8:455–7. doi:10.3367/UFNr.0093.196710n.0385
4. Arkani M, Gharib M. Reactor Core Power Measurement Using Cherenkov Radiation and its Application in Tehran Research Reactor. Ann Nucl Energ (2009) 36(7):896–900. doi:10.1016/j.anucene.2009.03.009
5. Robertson R, Germanos MS, Li C, Mitchell GS, Cherry SR, Silva MD. Optical Imaging of Cerenkov Light Generation from Positron-Emitting Radiotracers. Phys Med Biol (2009) 54(16):N355–N365. doi:10.1088/0031-9155/54/16/n01
6. Olde Heuvel J, de Wit-van der Veen BJ, Vyas KN, Tuch DS, Grootendorst MR, Stokkel MPM, et al. Performance Evaluation of Cerenkov Luminescence Imaging: a Comparison of 68 Ga with 18 F. EJNMMI Phys (2019) 6(1):17. doi:10.1186/s40658-019-0255-x
7. Yamamoto S, Watabe T, Ikeda H, Kanai Y, Watabe H, Ogata Y, et al. Ultrahigh-resolution Cerenkov-Light Imaging System for Positron Radionuclides: Potential Applications and Limitations. Ann Nucl Med (2014) 28(10):961–9. doi:10.1007/s12149-014-0892-z
8. Balkin ER, Kenoyer A, Orozco JJ, Hernandez A, Shadman M, Fisher DR, et al. In Vivo localization of 90Y and 177Lu Radioimmunoconjugates Using Cerenkov Luminescence Imaging in a Disseminated Murine Leukemia Model. Cancer Res (2014) 74(20):5846–54. doi:10.1158/0008-5472.can-14-0764
9. Spinelli AE, Boschi F, D’Ambrosio D, Calderan L, Marengo M, Fenzi A, et al. Cherenkov Radiation Imaging of Beta Emitters: In Vitro and In Vivo Results. Nucl Instr Methods Phys Res Section A: Acc Spectrometers, Detectors Associated Equipment (2011) 648:S310–S312. doi:10.1016/j.nima.2010.11.038
10. Thorek DLJ, Riedl CC, Grimm J. Clinical Cerenkov Luminescence Imaging of 18F-FDG. J Nucl Med (2014) 55(1):95–8. doi:10.2967/jnumed.113.127266
11. Ciarrocchi E, Belcari N. Cerenkov Luminescence Imaging: Physics Principles and Potential Applications in Biomedical Sciences. EJNMMI Phys (2017) 4(1):1–31. doi:10.1186/s40658-017-0181-8
12. Glaser AK, Zhang R, Davis SC, Gladstone DJ, Pogue BW. Time-gated Cherenkov Emission Spectroscopy from Linear Accelerator Irradiation of Tissue Phantoms. Opt Lett (2012) 37(7):1193–5. doi:10.1364/ol.37.001193
13. Mitchell GS, Gill RK, Boucher DL, Li C, Cherry SR. In Vivo Cerenkov Luminescence Imaging: a New Tool for Molecular Imaging. Phil Trans R Soc A (2011) 369(1955):4605–19. doi:10.1098/rsta.2011.0271
14. Shaffer TM, Pratt EC, Grimm J. Utilizing the Power of Cerenkov Light with Nanotechnology. Nat Nanotech (2017) 12(2):106–17. doi:10.1038/nnano.2016.301
15. Jacques SL. Optical Properties of Biological Tissues: a Review. Phys Med Biol (2013) 58(11):R37–R61. doi:10.1088/0031-9155/58/11/r37
16. Seidel J, Vaquero JJ, Green MV. Resolution Uniformity and Sensitivity of the NIH ATLAS Small Animal PET Scanner: Comparison to Simulated LSO Scanners without Depth-Of-Interaction Capability. IEEE Trans Nucl Sci (2003) 50(5):1347–50. doi:10.1109/tns.2003.817282
17. Berg E, Zhang X, Bec J, Judenhofer MS, Patel B, Peng Q, et al. Development and Evaluation of Mini-EXPLORER: a Long Axial Field-Of-View PET Scanner for Nonhuman Primate Imaging. J Nucl Med (2018) 59(6):993–8. doi:10.2967/jnumed.117.200519
18. Tamura R, Pratt EC, Grimm J. Innovations in Nuclear Imaging Instrumentation: Cerenkov Imaging. In: Seminars in Nuclear Medicine. Elsevier (2018).
19. Ruggiero A, Holland JP, Lewis JS, Grimm J. Cerenkov Luminescence Imaging of Medical Isotopes. J Nucl Med (2010) 51(7):1123–30. doi:10.2967/jnumed.110.076521
20. Vaquero JJ, Kinahan P. Positron Emission Tomography: Current Challenges and Opportunities for Technological Advances in Clinical and Preclinical Imaging Systems. Annu Rev Biomed Eng (2015) 17:385–414. doi:10.1146/annurev-bioeng-071114-040723
21. Spinelli AE, Kuo C, Rice BW, Calandrino R, Marzola P, Sbarbati A, et al. Multispectral Cerenkov Luminescence Tomography for Small Animal Optical Imaging. Opt Express (2011) 19(13):12605–18. doi:10.1364/oe.19.012605
22. Alsheikh H. [P091] Investigation of Cherenkov Imaging Using IVIS Bioluminescence Scanner. Physica Med (2018) 52:127. doi:10.1016/j.ejmp.2018.06.412
23. D’Souza JW, Hensley H, Dos M, Beigarten C, Torgov M, Olafsen T, et al. Cerenkov Luminescence Imaging as a Modality to Evaluate Antibody-Based PET Radiotracers. J Nucl Med (2017) 58(1):175–80.
24. Maier FC, Wild A-M, Kirchen N, Holm F, Fuchs K, Schwenck J, et al. Comparative Immuno-Cerenkov Luminescence and -PET Imaging Enables Detection of PSMA+ Tumors in Mice Using 64Cu-Radiolabeled Monoclonal Antibodies. Appl Radiat Isot (2019) 143:149–55. doi:10.1016/j.apradiso.2018.09.006
25. Jung J, Seol HS, Chang S. The Generation and Application of Patient-Derived Xenograft Model for Cancer Research. Cancer Res Treat (2018) 50(1):1–10. doi:10.4143/crt.2017.307
26. Siolas D, Hannon GJ. Patient-derived Tumor Xenografts: Transforming Clinical Samples into Mouse Models. Cancer Res (2013) 73(17):5315–9. doi:10.1158/0008-5472.can-13-1069
27. Vander Heiden MG, Cantley LC, Thompson CB. Understanding the Warburg Effect: the Metabolic Requirements of Cell Proliferation. science (2009) 324(5930):1029–33. doi:10.1126/science.1160809
28. DeBerardinis RJ, Chandel NS. We Need to Talk about the Warburg Effect. Nat Metab (2020) 2(2):127–9. doi:10.1038/s42255-020-0172-2
29. Ido T, Wan C-N, Casella V, Fowler JS, Wolf AP, Reivich M, et al. Labeled 2-Deoxy-D-Glucose Analogs. 18F-Labeled 2-Deoxy-2-Fluoro-D-Glucose, 2-Deoxy-2-Fluoro-D-Mannose and 14C-2-Deoxy-2-Fluoro-D-Glucose. J Label Compd Radiopharm (1978) 14(2):175–83. doi:10.1002/jlcr.2580140204
30. Zhang Z, Cai M, Bao C, Hu Z, Tian J. Endoscopic Cerenkov Luminescence Imaging and Image-Guided Tumor Resection on Hepatocellular Carcinoma-Bearing Mouse Models. Nanomedicine: Nanotechnology, Biol Med (2019) 17:62–70. doi:10.1016/j.nano.2018.12.017
31. Beattie BJ, Thorek DL, Schmidtlein CR, Pentlow KS, Humm JL, Hielscher AH. Quantitative Modeling of Cerenkov Light Production Efficiency from Medical Radionuclides. PloS one (2012) 7(2):e31402. doi:10.1371/journal.pone.0031402
32. Lewis DY, Mair R, Wright A, Allinson K, Lyons SK, Booth T, et al. [18F]fluoroethyltyrosine-induced Cerenkov Luminescence Improves Image-Guided Surgical Resection of Glioma. Theranostics (2018) 8(14):3991–4002. doi:10.7150/thno.23709
33. Lee SB, Kumar D, Li Y, Lee IK, Cho SJ, Kim SK, et al. PEGylated Crushed Gold Shell-Radiolabeled Core Nanoballs for In Vivo Tumor Imaging with Dual Positron Emission Tomography and Cerenkov Luminescent Imaging. J nanobiotechnology (2018) 16(1):1–12. doi:10.1186/s12951-018-0366-x
34. Bhatt NB, Pandya DN, Dezarn WA, Marini FC, Zhao D, Gmeiner WH, et al. Practical Guidelines for Cerenkov Luminescence Imaging with Clinically Relevant Isotopes. In: Reporter Gene Imaging. Springer (2018)p. 197–208. doi:10.1007/978-1-4939-7860-1_15
35. Desvaux E, Courteau A, Bellaye PS, Guillemin M, Drouet C, Walker P, et al. Cherenkov Luminescence Imaging Is a Fast and Relevant Preclinical Tool to Assess Tumour Hypoxia In Vivo. EJNMMI Res (2018) 8(1):111. doi:10.1186/s13550-018-0464-7
36. Mitchell GS, Lloyd PT, Cherry SR. Cerenkov Luminescence and PET Imaging of 90Y: Capabilities and Limitations in Small Animal Applications. Phys Med Biol (2020) 65(6):065006. doi:10.1088/1361-6560/ab7502
37. Zhang Z, Qu Y, Cao Y, Shi X, Hongbo G, Zhang XA Novel In Vivo Cerenkov Luminescence Image‐guided Surgery on Primary and Metastatic Colorectal Cancer. J Biophotonics (2020) 13(3):e201960152. doi:10.1002/jbio.202070008
38. Liu M, Zheng S, Zhang X, Guo H, Shi X, Kang X, et al. Cerenkov Luminescence Imaging on Evaluation of Early Response to Chemotherapy of Drug-Resistant Gastric Cancer. Nanomedicine: Nanotechnology, Biol Med (2018) 14(1):205–13. doi:10.1016/j.nano.2017.10.001
39. Carter LM, Poty S, Sharma SK, Lewis JS. Preclinical Optimization of Antibody-Based Radiopharmaceuticals for Cancer Imaging and Radionuclide Therapy-Model, Vector, and Radionuclide Selection. J Label Compd Radiopharm (2018) 61(9):611–35. doi:10.1002/jlcr.3612
40. Li M, Wei W, Engle J, Chen W, Jiang V, Cao T, et al. 800CW Dye and 89Zr Dual-Labeled Antibody for the PET/NIRF/Cerenkov Multi-Modality Imaging of ICAM-1 (CD54) in Pancreatic Cancer. J Nucl Med (2019) 60(Suppl. 1):331.
41. Lee HJ, Ehlerding EB, Jiang D, Barnhart TE, Cao T, Wei W, et al. Dual-labeled Pertuzumab for Multimodality Preoperative and Intraoperative Imaging of Ovarian Cancer. J Nucl Med (2019) 60(Suppl. 1):330.
42. Lee HJ, Ehlerding EB, Jiang D, Barnhart TE, Cao T, Wei W, et al. Dual-labeled Pertuzumab for Multimodality Image-Guided Ovarian Tumor Resection. Am J Cancer Res (2019) 9(7):1454–68.
43. Spinelli AE, Ferdeghini M, Cavedon C, Zivelonghi E, Calandrino R, Fenzi A, et al. First Human Cerenkography. J Biomed Opt (2013) 18(2):020502. doi:10.1117/1.jbo.18.2.020502
44. Grootendorst MR, Cariati M, Kothari A, Tuch DS, Purushotham A. Cerenkov Luminescence Imaging (CLI) for Image-Guided Cancer Surgery. Clin Transl Imaging (2016) 4(5):353–66. doi:10.1007/s40336-016-0183-x
45. Grootendorst MR, Cariati M, Pinder SE, Kothari A, Douek M, Kovacs T, et al. Intraoperative Assessment of Tumor Resection Margins in Breast-Conserving Surgery Using 18F-FDG Cerenkov Luminescence Imaging: a First-In-Human Feasibility Study. J Nucl Med (2017) 58(6):891–8. doi:10.2967/jnumed.116.181032
46. Hu H, Cao X, Kang F, Wang M, Lin Y, Liu M, et al. Feasibility Study of Novel Endoscopic Cerenkov Luminescence Imaging System in Detecting and Quantifying Gastrointestinal Disease: First Human Results. Eur Radiol (2015) 25(6):1814–22. doi:10.1007/s00330-014-3574-2
47. Olde Heuvel J, de Wit-van der Veen BJ, van der Poel HG, Bekers EM, Grootendorst MR, Vyas KN, et al. 68Ga-PSMA Cerenkov Luminescence Imaging in Primary Prostate Cancer: First-In-Man Series. Eur J Nucl Med Mol Imaging (2020) 47(11):2624–32. doi:10.1007/s00259-020-04783-1
48. Darr C, Harke NN, Radtke JP, Yirga L, Kesch C, Grootendorst MR, et al. Intraoperative 68Ga-PSMA Cerenkov Luminescence Imaging for Surgical Margins in Radical Prostatectomy: a Feasibility Study. J Nucl Med (2020) 61(10):1500–6. doi:10.2967/jnumed.119.240424
49. Krohn J, Chen Y-C, Stabo-Eeg NO, Hamre B. Cherenkov Luminescence Imaging for Assessment of Radioactive Plaque Position in Brachytherapy of Uveal Melanoma: An In Vivo Feasibility Study. Trans Vis Sci Tech (2020) 9(7):42. doi:10.1167/tvst.9.7.42
50. Pritychenko B, Běták E, Kellett MA, Singh B, Totans J. The Nuclear Science References (NSR) Database and Web Retrieval System. Nucl Instr Methods Phys Res Section A: Acc Spectrometers, Detectors Associated Equipment (2011) 640(1):213–8. doi:10.1016/j.nima.2011.03.018
51. Glaser AK, Zhang R, Andreozzi JM, Gladstone DJ, Pogue BW. Cherenkov Radiation Fluence Estimates in Tissue for Molecular Imaging and Therapy Applications. Phys Med Biol (2015) 60(17):6701–18. doi:10.1088/0031-9155/60/17/6701
52. Glaser AK, Zhang R, Gladstone DJ, Pogue BW. Optical Dosimetry of Radiotherapy Beams Using Cherenkov Radiation: the Relationship between Light Emission and Dose. Phys Med Biol (2014) 59(14):3789–811. doi:10.1088/0031-9155/59/14/3789
53. Zhang R, Glaser AK, Gladstone DJ, Fox CJ, Pogue BW. Superficial Dosimetry Imaging Based on Čerenkov Emission for External Beam Radiotherapy with Megavoltage X-ray Beam. Med Phys (2013) 40(10):101914. doi:10.1118/1.4821543
54. Jarvis LA, Zhang R, Gladstone DJ, Jiang S, Hitchcock W, Friedman OD, et al. Cherenkov Video Imaging Allows for the First Visualization of Radiation Therapy in Real Time. Int J Radiat Oncology*Biology*Physics (2014) 89(3):615–22. doi:10.1016/j.ijrobp.2014.01.046
55. Tendler II, Hartford A, Jermyn M, LaRochelle E, Cao X, Borza V, et al. Experimentally Observed Cherenkov Light Generation in the Eye during Radiation Therapy. Int J Radiat Oncology*Biology*Physics (2020) 106(2):422–9. doi:10.1016/j.ijrobp.2019.10.031
56. Andreozzi JM, Zhang R, Gladstone DJ, Williams BB, Glaser AK, Pogue BW, et al. Cherenkov Imaging Method for Rapid Optimization of Clinical Treatment Geometry in Total Skin Electron Beam Therapy. Med Phys (2016) 43(2):993–1002. doi:10.1118/1.4939880
57. Xie Y, Petroccia H, Maity A, Miao T, Zhu Y, Bruza P, et al. Cherenkov Imaging for Total Skin Electron Therapy (TSET). Med Phys (2020) 47(1):201–12. doi:10.1002/mp.13881
58. Hachadorian R, Bruza P, Jermyn M, Gladstone DJ, Pogue BW, Jarvis LA. Imaging Radiation Dose in Breast Radiotherapy by X-ray CT Calibration of Cherenkov Light. Nat Commun (2020) 11(1):1–9. doi:10.1038/s41467-020-16031-z
59. Elaloufi R, Carminati R, Greffet J-J. Diffusive-to-ballistic Transition in Dynamic Light Transmission through Thin Scattering Slabs: a Radiative Transfer Approach. J Opt Soc Am A (2004) 21(8):1430–7. doi:10.1364/josaa.21.001430
60. Dothager RS, Goiffon RJ, Jackson E, Harpstrite S, Piwnica-Worms D. Cerenkov Radiation Energy Transfer (CRET) Imaging: a Novel Method for Optical Imaging of PET Isotopes in Biological Systems. PloS one (2010) 5(10):e13300. doi:10.1371/journal.pone.0013300
61. Bernhard Y, Collin B, Decréau RA. Redshifted Cherenkov Radiation for In Vivo Imaging: Coupling Cherenkov Radiation Energy Transfer to Multiple Förster Resonance Energy Transfers. Scientific Rep (2017) 7(1):1–13. doi:10.1038/srep45063
62. Cao X, Jiang S, Jia MJ, Gunn JR, Miao T, Davis SC, et al. Cherenkov Excited Short-Wavelength Infrared Fluorescence Imaging In Vivo with External Beam Radiation. J Biomed Opt (2018) 24(5):051405. doi:10.1117/1.jbo.24.5.051405
Keywords: cherenkov, cerenkov, preclinical, clinical, review, image-guided, surgery, dosimetry (min5–max 8)
Citation: Mc Larney B, Skubal M and Grimm J (2021) A Review of Recent and Emerging Approaches for the Clinical Application of Cerenkov Luminescence Imaging. Front. Phys. 9:684196. doi: 10.3389/fphy.2021.684196
Received: 22 March 2021; Accepted: 12 July 2021;
Published: 28 July 2021.
Edited by:
Brian William Pogue, Dartmouth College, United StatesReviewed by:
David B. Stout, Independent researcher, Culver City, CA, United StatesXu Cao, Dartmouth College, United States
Copyright © 2021 Mc Larney, Skubal and Grimm. This is an open-access article distributed under the terms of the Creative Commons Attribution License (CC BY). The use, distribution or reproduction in other forums is permitted, provided the original author(s) and the copyright owner(s) are credited and that the original publication in this journal is cited, in accordance with accepted academic practice. No use, distribution or reproduction is permitted which does not comply with these terms.
*Correspondence: Jan Grimm, grimmj@mskcc.org