
Structural connectivity changes in the motor execution network after stroke rehabilitation
Abstract
Background:
Although quite a very few studies have tested structural connectivity changes following an intervention, it reflects only selected key brain regions in the motor network. Thus, the understanding of structural connectivity changes related to the motor recovery process remains unclear.
Objective:
This study investigated structural connectivity changes of the motor execution network following a combined intervention of low-frequency repetitive transcranial magnetic stimulation (LF-rTMS) and intensive occupational therapy (OT) after a stroke using graph theory approach.
Methods:
Fifty-six stroke patients underwent Fugl-Meyer Assessment (FMA), Wolf Motor Function Test-Functional Ability Scale (WMFT-FAS), diffusion tensor imaging (DTI), and T1 weighted imaging before and after the intervention. We examined graph theory measures related to twenty brain regions using structural connectomes.
Results:
The ipsilesional and contralesional hemisphere showed structural connectivity changes post-intervention after stroke. We found significantly increased regional centralities and nodal efficiency within the frontal pole and decreased degree centrality and nodal efficiency in the ipsilesional thalamus. Correlations were found between network measures and clinical assessments in the cuneus, postcentral gyrus, precentral gyrus, and putamen of the ipsilesional hemisphere. The contralesional areas such as the caudate, cerebellum, and frontal pole also showed significant correlations.
Conclusions:
This study was helpful to expand the understanding of structural connectivity changes in both hemispheric networks during the motor recovery process following LF-rTMS and intensive OT after stroke.
1Introduction
Stroke is one of the devastating causes of most deaths and disabilities in adults globally. Over the last three decades, stroke has been recognized as an emerging health issue that considerably increases the societal burden due to stroke-related disabilities (Platz, 2019). In particular, strokes resulting in motor impairments can have a major impact on patients’ quality of life. Therefore, enhancement of potential recovery by recognizing brain network changes and developing state-of-the-art interventions to address functional and structural changes would positively impact patients’ quality of life (Johnson et al., 2018).
The growth of a substantial number of stroke survivors suffering from functional deficits consequently increases the demand for interventions (Mazrooyisebdani et al., 2018). Therefore, rehabilitative regimes are often being used to reduce disabilities and improve stroke survivors’ daily living activities by regaining independence (Bindawas & Vennu, 2016; Dobkin, 2005). Previous studies have reported that interventions with the guidance of physical therapy or occupational therapy (OT) tend to be medically advantageous for rehabilitation after a stroke (Dobkin, 2005). Similarly, non-invasive brain stimulations, particularly repetitive transcranial magnetic stimulation (rTMS), transcranial direct current stimulation, and brain-computer interface (BCI), have been used to induce stroke recovery (Johnson et al., 2018).
Over the last decades, functional magnetic resonance imaging (fMRI) based modelling approaches have been applied greatly to investigate the underlying mechanism of stroke recovery following rehabilitation (Cheng et al., 2012; Grefkes & Fink, 2011; Jiang et al., 2013; Mazrooyisebdani et al., 2018; Ueda et al., 2019a; Wang et al., 2010). To date, diffusion tensor imaging (DTI) also facilitates insights into connectivity changes, reorganization, and functional recovery following stroke. Moreover, DTI based parameters can reliably examine microstructural integrity after post-stroke rehabilitation (Fan et al., 2015; Song et al., 2015).
Recently, graph theory measures for characterizing structural brain networks were applied in stroke recovery research (Schlemm et al., 2020; Ueda et al., 2019b). A brain network is composed of a set of nodes and edges. These nodes represent the brain regions, whereas edges represent the connections between brain regions. Various local and global graph theory properties can describe network topologies quantitatively (Bullmore & Sporns, 2009). This approach is a promising tool to have a better understanding of the recovery process after neurological disorders (Lee et al., 2015).
Some convincing evidence has demonstrated that the combined intervention of low-frequency rTMS (LF-rTMS) and intensive OT may induce beneficial functional and structural reorganization after a stroke (Ueda et al., 2019a, 2019b; Yamada et al., 2018). This intervention may generate functional restructuring in the ipsilesional hemisphere by applying LF-rTMS to the contralesional hemisphere (Kakuda et al., 2012; Ueda et al., 2019b, 2020). A recent study has reported that the contralesional hemisphere also contributed to motor recovery following LF-rTMS and OT intervention after a stroke (Ueda et al., 2020). However, the progression of structural changes related to the evolution of network measures of structural connectivity with stroke recovery is less understood.
There are quite a few studies that have tested structural connectivity changes in stroke recovery based on network measures (Schlemm et al., 2020; Shi et al., 2013; Ueda et al., 2019b). Even though the structural connectivity related to motor recovery following LF-rTMS and OT after a stroke has also been shown with the diffusion imaging techniques in a recent study, it only reflects structural connectivity changes between selected seed regions (Ueda et al., 2019b). Thus, the motor network characterized by structural imaging is incomplete. Therefore, the present study investigated structural connectivity changes associated with the motor execution network following LF-rTMS and intensive OT in stroke patients with upper limb hemiparesis.
2Materials and methods
2.1Study design
2.1.1Inclusion and exclusion criteria
This study was approved by the ethics committee of Tokyo Metropolitan University, Japan. Post-stroke patients with upper limb hemiparesis were admitted to the Unit of Rehabilitation Medicine at Shimizu Hospital, Tottori, Japan. Fifty-six patients who had the first-ever stroke, presented with left-hand motor impairment were included in the study sample. Furthermore, the following criteria were used in sampling the patients: (1) first-ever stroke caused by infarction or haemorrhage, (2) Right-handed patients according to self-reporting, (3) Brunnstrom recovery stages (BRS) for hand fingers 3–6, (4) time after the onset of stroke > 10 months, (5) age at intervention 18–90 years, (6) has most frequently lesions located in basal ganglia regions and thalamus. Patients with cognitive deficits, mental disorders, and strokes with cortical and brainstem lesions were excluded from the study sample. The clinical characteristics of the patients are shown in Table 1.
Table 1
Demographics characteristics of stroke patients (n = 56)
| Characteristics | Patients |
| Age (mean±SD) (Years) | 63±11.2 |
| Gender (n, %) | |
| Males | 41 (73%) |
| Females | 15 (27%) |
| Type of stroke (n, %) | |
| Cerebral haemorrhage | 33 (59%) |
| Cerebral infarction | 23 (41%) |
| Duration after stroke (mean±SD) (Years) | 4.6±3.5 |
| Brunnstrom recovery stages | |
| Upper limb (III/ IV/V/VI) | 36/15/4/1 |
| Hand and fingers (III/ IV/ V/ VI) | 9/26/15/6 |
2.2Application of intervention
Patients received LF-rTMS and OT intervention with daily self-training during hospitalization for 12 days. A stimulator with a 70 mm (Fig. 8) coil and MagPro R30 stimulator (MagVenture company, Farum, Denmark) was used to apply LF-rTMS to the unaffected hemisphere to activate cortical excitability in the affected hemisphere. This rTMS consisted of either 1200 pulses for 20 min or 2400 pulses for 40 min. A focal of 1 Hz rTMS was applied over the primary motor area of fingers in the unaffected hemisphere. The optimal site to place the stimulation on the skull was defined as the location where the largest motor-evoked potentials (MEPs) in the first dorsal interosseous (FDI) muscles of the unaffected upper limb using electromyography. The motor threshold (MT) of the FDI muscles of the unaffected upper limb was outlined as the lowest intensity of stimulation that can activate MEPs in those muscles. The intensity of stimulation was set to 90%of MT of the FDI muscle. All patients were carefully monitored throughout the application of rTMS by the same physician who was providing the stimulations.
OT sessions were provided after the application of LF-rTMS, which included one-to-one training for 60 mins and self-training for 60 mins. One-to-one training included shaping techniques such as writing letters, drawing pictures and repetitive task practise techniques, including pinching small coins. These one-to-one training activities were focused mainly on the motor functions of the affected upper limb in individuals and their lifestyles, such as occupation, interest, and household work. The self-training activities were also similar to one-to-one training sessions. A well-experienced occupational therapist evaluated both OT sessions and self-training sessions.
2.3Clinical assessments for motor functions
All patients were assessed using the following functional outcome measures: 1. Fugl-Meyer Assessment (FMA) 2. Wolf Motor Function Test-Functional Ability Scale (WMFT-FAS) at the admission to the hospital and discharge from the hospital. The two assessments were evaluated by an expert occupational therapist at two time points.
2.4Imaging
Three-dimensional (3D) T1-weighted structural images, and DTI were acquired at time points before and after the intervention on a 1.5 T MRI scanner (ECHELON Vega; Hitachi Medico, Tokyo, Japan). For DTI, 30 slices were obtained along 21 diffusion directions with spin-echo diffusion echo-planar images consisting of one b value of 1000 s/mm2; repetition time (TR): 5000 ms, echo time (TE): 74.4 ms, matrix: 256×256 pixels, slice thickness: 5 mm, voxel size: 0.9 mm×0.9 mm×5 mm, the field of view (FOV): 240 mm. For structural imaging, radio frequency (RF)-spoiled steady-state gradient echo was used with the following parameters: TR: 7.7 ms, TE: 4 ms, matrix: 256×256 pixels, slices: 180, voxel size: 0.875 mm×0.875 mm×1 mm, FOV: 224 mm.
2.5Network construction
Structural connectomes were constructed based on DTI and structural T1-weighted images. DTI images were pre-processed using FSL (FMRIB, Oxford, UK). T1-weighted images were processed using the standard scheme of FreeSurfer (http://surfer.nmr.mgh.harvard.edu/) and obtained parcellation of 84 regions in each brain hemisphere based on the Desikan-Killiany atlas. Probabilistic tractography was reconstructed to extract 1×10⁶ streamlines utilizing the iFOD2 algorithm of MRtrix3 (Brain Research Institute, Melbourne, Australia). Weighted connectivity matrices of dimension 84×84 were computed as the streamlines figure defining the strength of connections between two brain regions. Local and global network measures were computed utilizing the Gretna Toolbox (Wang et al., 2015). Spurious links were discarded before calculating network measures. To eliminate the effect of choosing one threshold, we explored a set of thresholds from 10%to 30%with a 5%increment. With careful examination across global network measures and mean degree centrality of all patients, a threshold of 10%was applied (van den Heuvel & Sporns, 2011; Zhang et al., 2011).
2.6Region of interest (ROI) in the motor execution network
Twenty brain regions related to motor execution networks based on previous studies (Jiang et al., 2004; Mazrooyisebdani et al., 2018; Shi et al., 2013; Wang et al., 2010) were evaluated in the study. However, due to the use of different atlases in previous studies, we have chosen the most related brain regions in the motor execution network for the present study. The twenty regions included the precentral gyrus, postcentral gyrus, frontal pole, superior parietal cortex, caudate, putamen, pallidum, thalamus, cuneus, and cerebellum in both contralesional and ipsilesional hemispheres.
2.7Regional network measures
We focused on several common local and global network properties, including degree centrality, betweenness centrality, nodal efficiency, and small-worldness. The degree centrality of the node represents the number of links that connect to the other networks in the brain. Brain regions that have a higher degree centrality are assumed to be hubs of the brain networks together with representing the functional integrations (Dong et al., 2007). Betweenness centrality captures the extent to which a node is in-between several other nodes in a network. The ability of information propagation between a node and the rest of the nodes in the network can be measured by nodal efficiency. Therefore, a node with a high nodal efficiency determines a high capability of information transferring within a network (Ma et al., 2018). Small-worldness combines local clusters among nodes in a network and the shortest paths that connect all the nodes within a network (Bullmore & Sporns, 2009; Mazrooyisebdani et al., 2018).
2.8Statistical analysis
All the statistical analysis was performed using IBM SPSS statistics 25. The normality distribution was assessed by the Kolmogorov Smirnov test. The parametric or non-parametric paired sample t-tests were applied accordingly to determine the pre-post differences in clinical assessments and network measures. The p-value was set to 0.05, and each family of network measures was calculated separately. The false discovery rate (FDR) of q = 0.05 was used to correct the multiple comparisons of paired sample tests (Benjamini & Hochberg, 1995). A linear regression model was employed to examine correlations between clinical assessments and network measures in each region.
3Results
3.1Clinical assessments for motor functions results
The average age of fifty-six participants in our study was 63 years (SD = 11.2 years), with an average onset period of 4.6 years (SD = 3.5 years). FMA scores were found to be significantly increased (p < 0.001) from pre-intervention (43.59±12.13) to post-intervention (49.27±10.75). Similarly, WMFT-FAS was found to be significantly increased (p < 0.001) from pre-intervention (44.71±13.75) to post-intervention (50.11±14.50).
3.2Local network measures
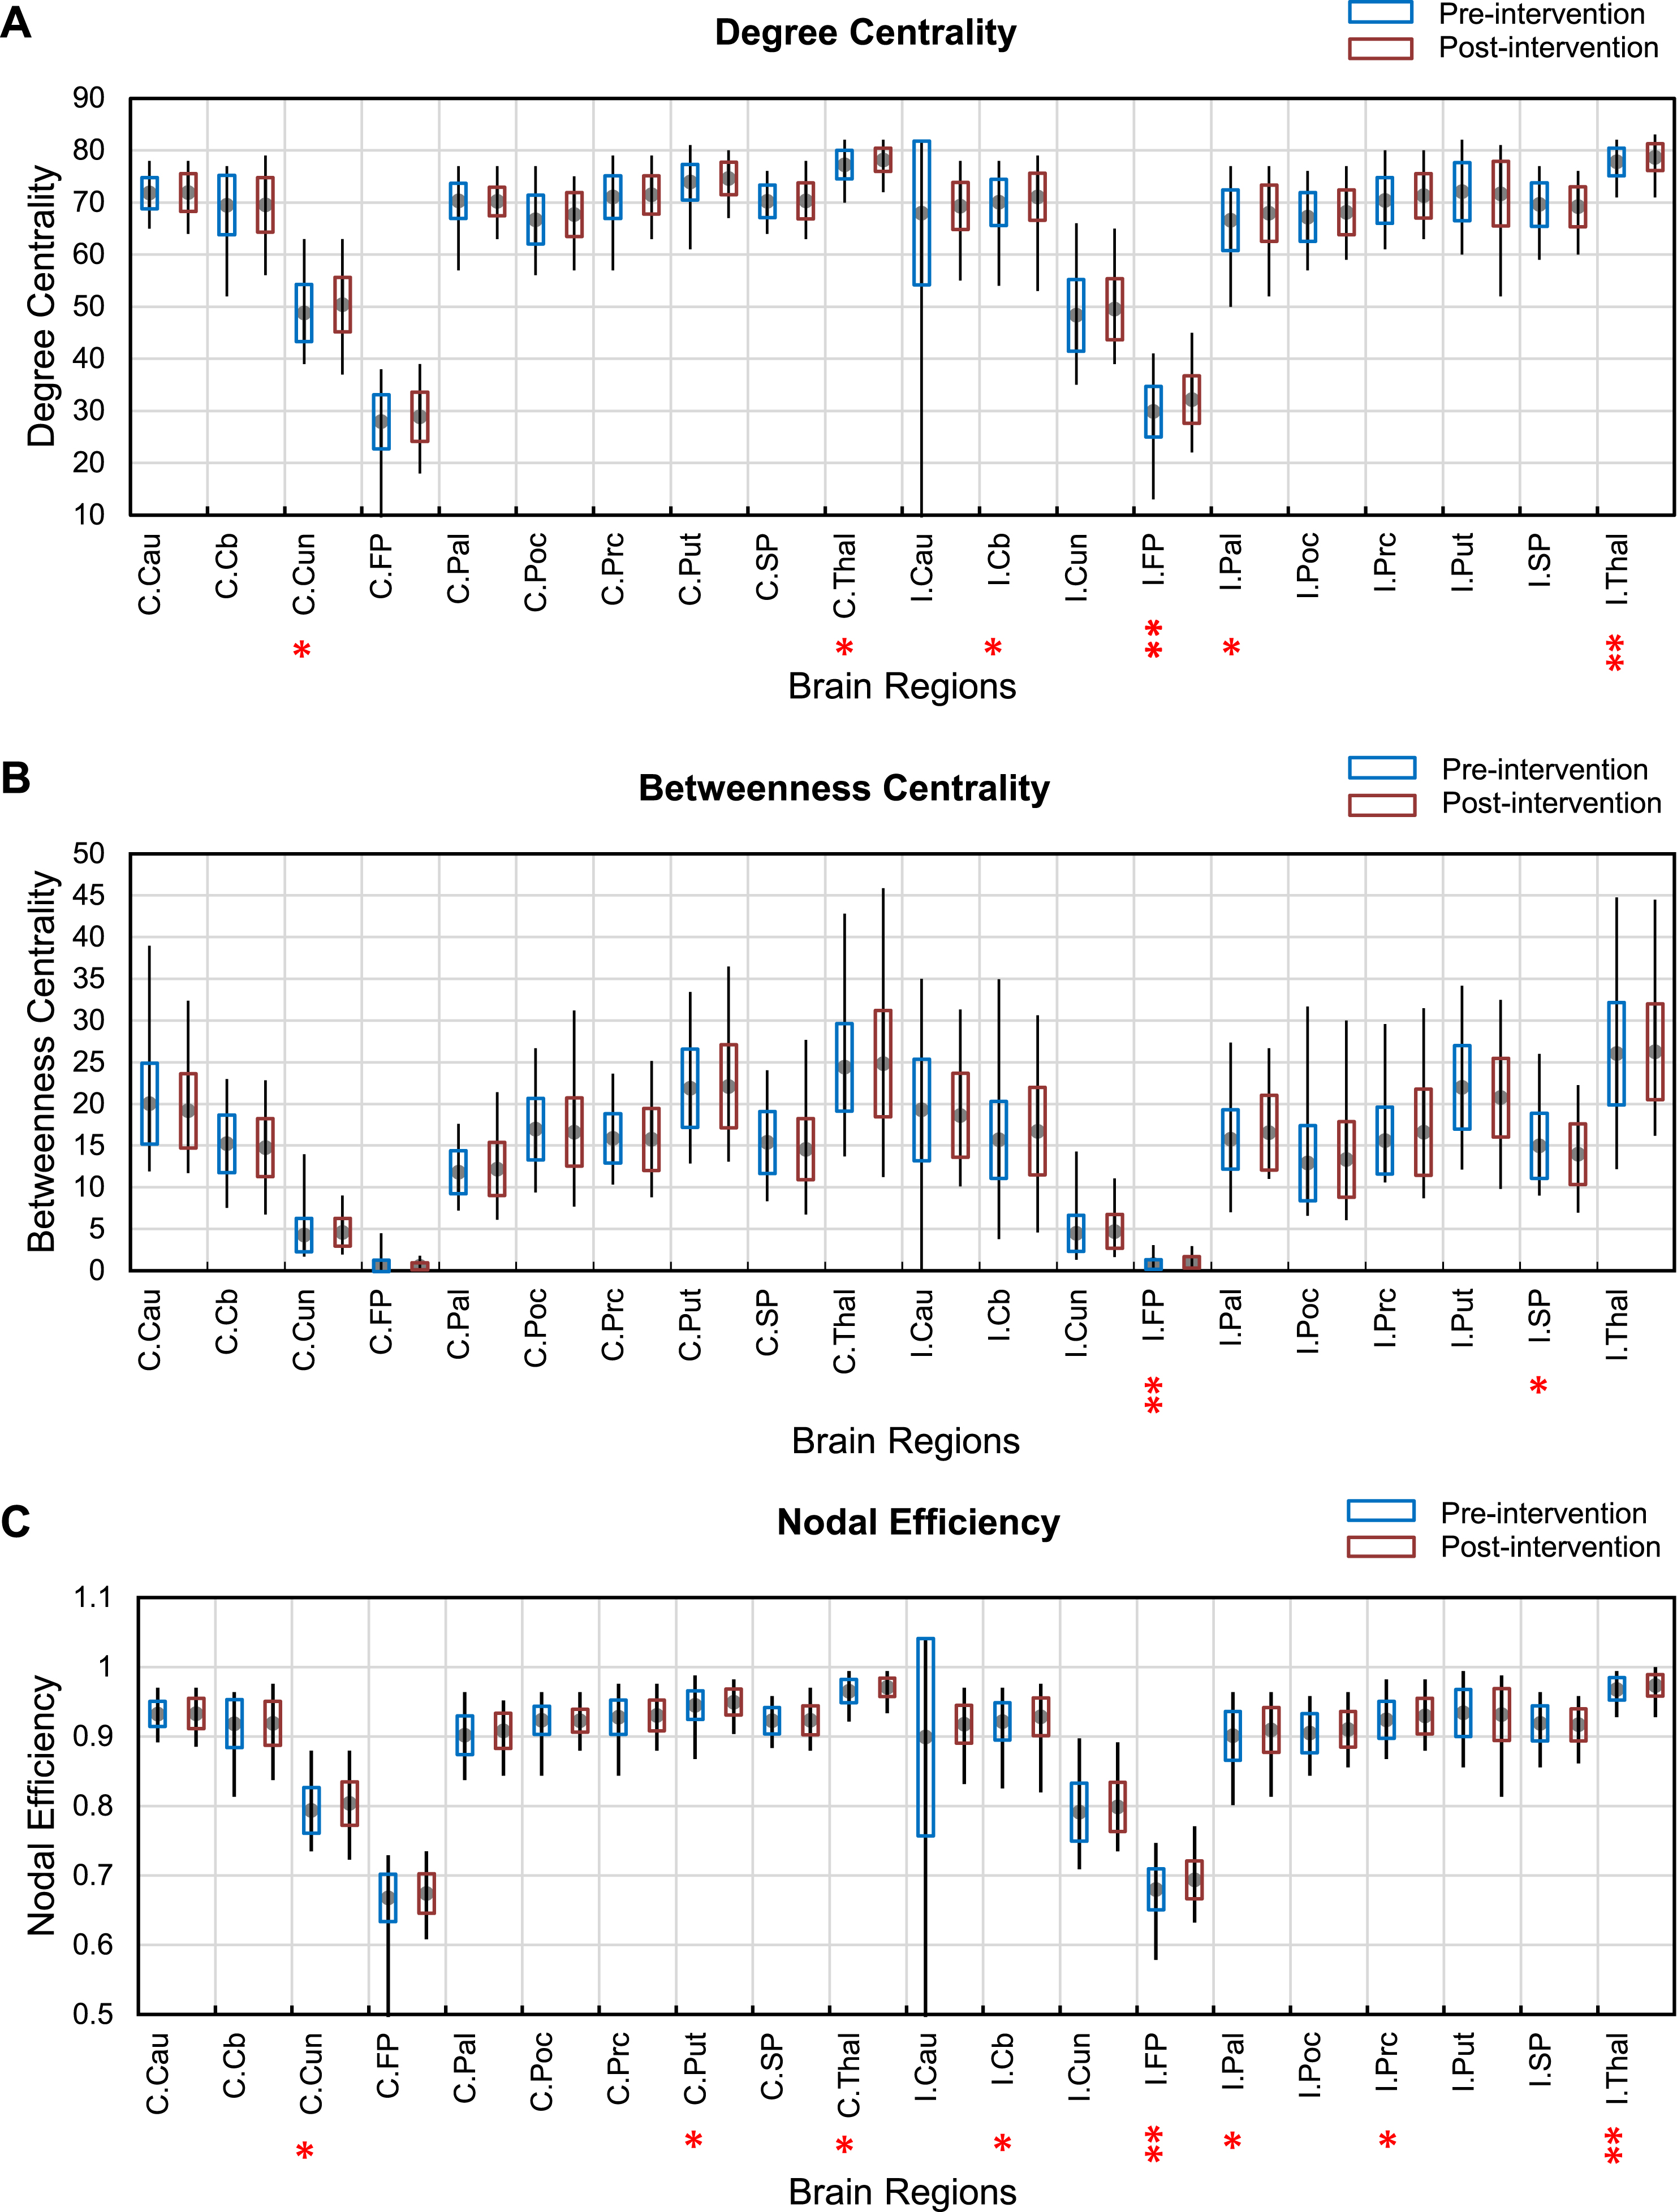
Analysis of the degree centrality showed a significant increase from pre-intervention to post-intervention in the cerebellum, pallidum, and precentral gyrus (q < 0.05), and frontal pole (p < 0.05, FDR) of the ipsilesional hemisphere. In addition, there was a significant decrease in the ipsilesional thalamus (p < 0.05, FDR) after the intervention. In the contralesional hemisphere, significantly increased degree centrality was found in the cuneus and thalamus (q < 0.05) from pre-intervention to post-intervention.
Brain regions within the ipsilesional hemisphere, including the superior parietal cortex (q < 0.05) and frontal pole (p < 0.05, FDR), were found to have a statistically significant increased betweenness centrality in post-intervention.
Interestingly, nodal efficiency showed a significant increase from pre-intervention to post-intervention within both ipsilesional and contralesional hemispheres. Nodal efficiency in the ipsilesional hemisphere was significantly increased in brain regions, including cerebellum, pallidum, and precentral gyrus (q < 0.05), and frontal pole (p < 0.05, FDR). The ipsilesional thalamus (p < 0.05, FDR) showed a significant decrease after the intervention. Furthermore, cuneus, putamen, and thalamus (q < 0.05) in the contralesional hemisphere is also indicated significantly increased nodal efficiency after the intervention.
Figure 1 shows the results of pre-post changes in local network measures.
Fig. 1
Changes in degree centrality (A), betweenness centrality (B) and nodal efficiency (C) from pre-intervention (blue) to post-intervention (orange) across the motor execution areas. C-contralesional hemisphere I-ipsilesional hemisphere **(p < 0.05, FDR) and *(q < 0.05). Abbreviations in the figures; Cau: Caudate, Cb: Cerebellum, Cun: Cuneus, FP: frontal pole, Pal: pallidum, Poc: Postcentral gyrus, Prc: precentral gyrus, Put: Putamen, SP: superior parietal, Thal: Thalamus.
3.3Global network measures
Small-worldness did not show any significant difference after the intervention.
3.4Correlation between network measures and clinical assessments
The clinical assessments for motor functions were examined to investigate behavioural implications with the local network measures in several motor execution regions. Correlations between FMA WMFT-FAS and network measures were found to be statistically significant in several brain regions. Small-worldness did not correlate to clinical assessments. A summary of correlation analysis is presented in Table 2.
Table 2
The correlation between regional network measures and the clinical assessments (p < 0.05)
| Brain regions | Graph measure | t-value | p-value |
| FMA | |||
| Degree centrality | C.Caudate | 2.551 | 0.015 |
| C.Frontal pole | 2.405 | 0.022 | |
| I.Cuneus | –2.128 | 0.041 | |
| I.Precentral gyrus | 2.335 | 0.025 | |
| Betweenness centrality | I.Putamen | –2.403 | 0.022 |
| Nodal efficiency | C.Caudate | 2.544 | 0.016 |
| C.Frontal pole | 2.395 | 0.021 | |
| I.Cuneus | –2.12 | 0.041 | |
| I.Precentral gyrus | 2.329 | 0.026 | |
| WMFT | |||
| Degree centrality | C.Caudate | 2.429 | 0.02 |
| C.Cerebellum | 2.804 | 0.008 | |
| C.Frontal pole | 2.808 | 0.008 | |
| I.Postcentral gyrus | –2.402 | 0.022 | |
| I.Putamen | –2.944 | 0.006 | |
| Betweenness centrality | I.Putamen | –2.425 | 0.021 |
| Nodal efficiency | C.Caudate | 2.424 | 0.021 |
| C.Cerebellum | 2.798 | 0.008 | |
| C.Frontal pole | 2.807 | 0.008 | |
| I.Postcentral gyrus | –2.398 | 0.022 | |
| I.Putamen | –2.945 | 0.006 |
Positive t-values show positive correlations. C: Contralesional hemisphere, I: Ipsileisional hemisphere.
4Discussion
Several prior studies have suggested the mechanisms underlying cortical reorganization following various interventions using functional connectivity (Dong et al., 2007; Han et al., 2020; Mazrooyisebdani et al., 2018). Likewise, a few studies have demonstrated the functional and structural changes in motor recovery induced by the combined intervention of LF-rTMS and intensive OT (Ueda et al., 2019a; Yamada et al., 2013). In a recent study, the authors mentioned that no article had been reported on DTI based graph theory approach for stroke recovery by 2019 (Ueda et al., 2019b). Nevertheless, no reports had explored structural connectivity changes across the motor execution network except certain key regions such as the precentral gyrus and postcentral gyrus following an intervention. Therefore, no comparable data to be found in graph theory based on structural connectivity studies published to date related to the motor execution network following an intervention after a stroke.
The importance of brain areas in providing information transfer within a network can be assessed using centrality measures. The alteration of degree centrality is associated with changes in the structural connectivity (Mazrooyisebdani et al., 2018). Moreover, betweenness centrality characterizes the effect of nodes in a network and measures important nodes related to information processing. The nodal efficiency quantifies how efficiently a network can exchange information. Efficiency measures reflect the global properties of functional networks within the brain (De Vico Fallani et al., 2013; Shi et al., 2013).
In our findings, increased connections were seen within the ipsilesional frontal lobe. Furthermore, a significant increase in betweenness centrality and nodal efficiency of the ipsilesional frontal pole were observed in our study. It has been proposed that the frontal lobe is functionally connected with caudal motor networks and also interconnected with primary and secondary motor networks (Ishikuro et al., 2014; Petrides, 2005). A motor rehabilitation study conducted with healthy subjects has determined that frontal brain regions are essential for improved performance in repetitive motor learning. In their study, authors have reported increased hemodynamic responses in prefrontal regions of healthy subjects using near-infrared spectroscopy (Ishikuro et al., 2014). Another study has reported cortical thickness changes in frontal areas rather than motor cortex related to neuroplasticity after basal ganglia strokes (Liu et al., 2020). A study conducted to examine graph theory measures in white matter network of stroke sample compared with normal subjects reported a significantly decreased betweenness centrality in superior frontal and middle frontal areas (Shi et al., 2013). These findings were not consistent with our study. This may be due to the differences in study design and variations of stroke patients. Generally, nodes with high connections, high betweenness centrality, and high nodal efficiency play a crucial role in faster information exchanging and efficient integration of information within the whole network (Bullmore & Sporns, 2009). Taken together, our findings indicated that the frontal lobe facilitates efficient information transfer within the motor execution network.
Interestingly, a significantly decreased degree centrality and nodal efficiency were seen in the ipsilesional thalamus, which is in general agreement with a prior study that reported functional connectivity measures related to post-stroke reorganization (Wang et al., 2010). In our study, most of the stroke lesions involved subcortical structures such as the thalamus and putamen. Therefore, disrupted connections in the thalamus may result in a decreased degree centrality and nodal efficiency.
Correlation analysis between network measures and functional test scores is consistent with the view that motor network changes due to the intervention of LF-rTMS and intensive OT to assist information transfer within the motor network. In this study, network measures correlated to clinical assessment in ipsilesional regions, including cuneus, postcentral gyrus, precentral gyrus, putamen, and contralesional regions caudate, cerebellum, frontal pole. Mostly, ipsilesional regions except for the precentral gyrus showed negative correlations between network measures and clinical assessments. Significant positive correlations were seen in the contralesional hemisphere.
Notably, the ipsilesional precentral gyrus indicated positive correlations between degree centrality, node efficiency, and FMA, suggesting that behavioural motor performance improved as degree centrality and nodal efficiency increase. In addition, a trend towards a significant increase in degree centrality and nodal efficiency of ipsilesional precentral gyrus was observed in our study. These findings suggest an increase in the role of the ipsilesional precentral gyrus as a hub during the intervention. The importance of the ipsilesional motor cortex in stroke recovery has been suggested by a previous study (Mima et al., 2001) in which functional connections of the primary motor cortex correlated with behavioural recovery. Another functional connectivity study reported a positive correlation between centrality in the ipsilesional motor cortex, supplementary motor area, and clinical measures. This increased hub role of the motor region indicates gradual recovery of the affected hand (Wang et al., 2010).
Moreover, we observed a negative correlation between clinical assessments and network measures in the cuneus and putamen. A prior study has reported a decreased connectivity in the cuneus, which is involved in the processing of visual information (Shi et al., 2013). A recent graph theory study concluded increased performance in cuneus regions in response to long-term motor learning skills (Pi et al., 2019). Thus, in our findings, the correlation of cuneus could be a piece of potential evidence for understanding the visual system related to motor recovery. The putamen plays a vital role in motor rehabilitation with previously learned movements. Moreover, the putamen is closely linked with primary motor regions (Yu et al., 2013). Collectively, our findings in the ipsilesional motor execution network suggest motor recovery after rehabilitation.
A previous study has reported increased contralesional cerebellum activity is related to restoration of motor functions after stroke (Chollet et al., 1991). We observed a significant positive correlation between degree centrality and WMFT-FAS and nodal efficiency and WMFT-FAS in the contralesional cerebellum. Similarly, a few other studies reported adaptive activities in the reorganization process within the cerebellum in relation to relevant behavioural changes in stroke patients (Mazrooyisebdani et al., 2018; Wang et al., 2010). Moreover, positive correlations were found in the contralesional caudate between FMA, WMFT-FAS and degree centrality, node efficiency. A neuroimaging study has reported that caudate plays a key role in learning (Seger & Cincotta, 2005). Even though the contralesional frontal pole did not indicate any notable changes structurally after the intervention, we observed a positive correlation between degree centrality, node efficiency, and clinical assessments.
Seemingly, our results determined that motor execution regions such as caudate, cuneus, cerebellum, frontal pole, and putamen are associated with motor recovery in response to stroke rehabilitation. Based on present and previous studies, relationships between clinical assessments and structural connectivity measures associated with the physical practice of OT intervention might enhance motor learning in stroke patients supporting the possible application of our intervention in stroke rehabilitation.
4.1Limitation and methodological considerations
There were certain limitations we encountered in conducting our study. The major limitation was that our study sample was composed of fifty-six stroke patients with only left upper limb paralysis who were in divergent phases of recovery rather than being in the same stage of recovery. For these reasons, future studies should be considered with a relatively homogeneous stroke sample and patients with right upper limb paralysis to eliminate the confounding effect by choosing only patients with lesions in the right hemisphere. The lesion sites of patients were inconsistent. Additionally, neural injuries occurred due to both cerebral infarctions and haemorrhages, which would impact the results. There was no control group included in this study to conclude the mechanism of the effect after the intervention on stroke recovery. Another limitation is that the age range and period after stroke onset were wide. However, time-lapse since stroke could be a lesser limitation since patients may have passed the period that spontaneous recovery could occur. Despite these issues, the present study shows that LF-rTMS and intensive OT can result in beneficial structural connectivity changes in brain areas involved in motor execution networks in stroke patients.
5Conclusion
Our study demonstrated a graph theory approach to investigate structural connectivity changes in the motor execution network following LF-rTMS and intensive OT intervention in stroke patients with left upper limb motor impairments. The present study highlighted that structural connectivity changes in the motor execution network are pronounced in both the ipsilesional hemisphere and contralesional hemisphere with the intervention period, and these changes could be correlated with improved clinical measures. However, the outcome of this study should be considered with caution due to the inhomogeneity of the sample. Thus, future studies should be conducted with a more homogeneous stroke sample. Our findings are novel in that no article has been previously reported on how these structures of the motor executive network alter with the intervention using DTI. Overall, our study expands the understanding of structural connectivity changes during motor recovery following LF-rTMS and intensive OT intervention after stroke and leads to a new insight for investigating intervention-induced network reorganization.
Acknowledgments
We thank Dr.Surendra Maharjan, Nileema Jayasooriya, Sudeeptha Liyanage, Erayanti Saloko, Enyk Yunanto, Mike Hillman, and Nick Pace, for their useful comments. In addition, the authors are grateful to Tokyo Metropolitan University for granting the Tokyo Human Resource Fund for City Diplomacy Scholarship to the main author.
References
1 | Benjamini, Y. , & Hochberg, Y. ((1995) ). Controlling the False Discovery Rate: A Practical and Powerful Approach to Multiple Testing. Journal of the Royal Statistical Society: Series B (Methodological), 57: (1), 289–300. |
2 | Bindawas, S. , & Vennu, V. ((2016) ). Stroke rehabilitation. A call to action in Saudi Arabia. Neurosciences, 21: (4), 297–305. |
3 | Bullmore, E. , & Sporns, O. ((2009) ). Complex brain networks: graph theoretical analysis of structural and functional systems. Nature Reviews Neuroscience, 10: (3), 186–198. |
4 | Chollet, F. , Di Piero, V. , Wise, R. J. S. , Brooks, D. J. , Dolan, R. J. , & Frackowiak, R. S. J. ((1991) ). The functional anatomy of motor recovery after stroke in humans: A study with positron emission tomography. Annals of Neurology, 29: (1), 63–71. |
5 | De Vico Fallani, F. , Pichiorri, F. , Morone, G. , Molinari, M. , Babiloni, F. , Cincotti, F. , & Mattia, D. ((2013) ). Multiscale topological properties of functional brain networks during motor imagery after stroke. NeuroImage, 83: , 438–449. |
6 | Dobkin, B. H. ((2005) ). Rehabilitation after Stroke. New England Journal of Medicine, 352: (16), 1677–1684. |
7 | Dong, Y. , Winstein, C. J. , Albistegui-DuBois, R. , & Dobkin, B. H. ((2007) ). Evolution of fMRI Activation in the Perilesional Primary Motor Cortex and Cerebellum With Rehabilitation Training-Related Motor Gains After Stroke: A Pilot Study. Neurorehabilitation and Neural Repair, 21: (5), 412–428. |
8 | Fan, Y. T. , Lin, K. C. , Liu, H. L. , Chen, Y. L. , & Wu, C. Y. ((2015) ). Changes in structural integrity are correlated with motor and functional recovery after post-stroke rehabilitation. Restorative Neurology and Neuroscience, 33: (6), 835–844. |
9 | Grefkes, C. , & Fink, G. R. ((2011) ). Reorganization of cerebral networks after stroke: new insights from neuroimaging with connectivity approaches. Brain, 134: (5), 1264–1276. |
10 | Han, X. , Jin, H. , Li, K. , Ning, Y. , Jiang, L. , Chen, P. , Liu, H. , Zhang, Y. , Zhang, H. , Tan, Z. , Cui, F. , Ren, Y. , Bai, L. , & Zou, Y. ((2020) ). Acupuncture Modulates Disrupted Whole-Brain Network after Ischemic Stroke: Evidence Based on Graph Theory Analysis. Neural Plasticity, 2020: , 1–10. |
11 | Ishikuro, K. , Urakawa, S. , Takamoto, K. , Ishikawa, A. , Ono, T. , & Nishijo, H. ((2014) ). Cerebral functional imaging using near-infrared spectroscopy during repeated performances of motor rehabilitation tasks tested on healthy subjects. Frontiers in Human Neuroscience, 8: , 292. |
12 | Jiang, L. , Xu, H. , & Yu, C. ((2013) ). Brain Connectivity Plasticity in the Motor Network after Ischemic Stroke. Neural Plasticity, 2013: , 1–11. |
13 | Jiang, T. , He, Y. , Zang, Y. , & Weng, X. ((2004) ). Modulation of functional connectivity during the resting state and the motor task. Human Brain Mapping, 22: (1), 63–71. |
14 | Johnson, N. N. , Carey, J. , Edelman, B. J. , Doud, A. , Grande, A. , Lakshminarayan, K. , & He, B. ((2018) ). Combined rTMS and virtual reality brain–computer interface training for motor recovery after stroke. Journal of Neural Engineering, 15: (1), 016009. |
15 | Kakuda, W. , Abo, M. , Shimizu, M. , Sasanuma, J. , Okamoto, T. , Yokoi, A. , Taguchi, K. , Mitani, S. , Harashima, H. , Urushidani, N. , Urashima, M. , & Investigators, T. N. ((2012) ). A multi-center study on low-frequency rTMS combined with intensive occupational therapy for upper limb hemiparesis in post-stroke patients. Journal of NeuroEngineering and Rehabilitation, 9: (1), 4. |
16 | Lee, J. , Lee, M. , Kim, D. S. , & Kim, Y. H. ((2015) ). Functional reorganization and prediction of motor recovery after a stroke: A graph theoretical analysis of functional networks. Restorative Neurology and Neuroscience, 33: (6), 785–793. |
17 | Lin Cheng, , Zhiyuan Wu, , Yi Fu, , Fei Miao, , Junfeng Sun, , & Shanbao Tong, , (2012). Reorganization of functional brain networks during the recovery of stroke: A functional MRI study. 2012 Annual International Conference of the IEEE Engineering in Medicine and Biology Society, 4132–4135. |
18 | Liu, H. , Peng, X. , Dahmani, L. , Wang, H. , Zhang, M. , Shan, Y. , Rong, D. , Guo, Y. , Li, J. , Li, N. , Wang, L. , Lin, Y. , Pan, R. , Lu, J. , & Wang, D. ((2020) ). Patterns of motor recovery and structural neuroplasticity after basal ganglia infarcts. Neurology, 95: (9), e1174–e1187. |
19 | Ma, X. , Jiang, G. , Fu, S. , Fang, J. , Wu, Y. , Liu, M. , Xu, G. , & Wang, T. ((2018) ). Enhanced Network Efficiency of Functional Brain Networks in Primary Insomnia Patients. Frontiers in Psychiatry, 9: , 46. |
20 | Mazrooyisebdani, M. , Nair, V. A. , Loh, P. L. , Remsik, A. B. , Young, B. M. , Moreno, B. S. , Dodd, K. C. , Kang, T. J. , William, J. C. , & Prabhakaran, V. ((2018) ). Evaluation of Changes in the Motor Network Following BCI Therapy Based on Graph Theory Analysis. Frontiers in Neuroscience, 12: , 861. |
21 | Mima, T. , Toma, K. , Koshy, B. , & Hallett, M. ((2001) ). Coherence Between Cortical and Muscular Activities After Subcortical Stroke. Stroke, 32: (11), 2597–2601. |
22 | Petrides, M. ((2005) ). Lateral prefrontal cortex: architectonic and functional organization. Philosophical Transactions of the Royal Society B: Biological Sciences, 360: (1456), 781–795. |
23 | Pi, Y. L. , Wu, X. H. , Wang, F. J. , Liu, K. , Wu, Y. , Zhu, H. , & Zhang, J. ((2019) ). Motor skill learning induces brain network plasticity: A diffusion-tensor imaging study. PLOS ONE, 14: (2), e0210015. |
24 | Platz, T. ((2019) ). Evidence-Based Guidelines and Clinical Pathways in Stroke Rehabilitation—An International Perspective. Frontiers in Neurology, 10: , 200. |
25 | Schlemm, E. , Schulz, R. , Bönstrup, M. , Krawinkel, L. , Fiehler, J. , Gerloff, C. , Thomalla, G. , & Cheng, B. ((2020) ). Structural brain networks and functional motor outcome after stroke—a prospective cohort study. Brain Communications, 2: (1), fcaa001. |
26 | Seger, C. A. ((2005) ). The Roles of the Caudate Nucleus in Human Classification Learning. Journal of Neuroscience, 25: (11), 2941–2951. |
27 | Shi, L. , Wang, D. , Chu, W. C. W. , Liu, S. , Xiong, Y. , Wang, Y. , Wang, Y. , Wong, L. K. S. , & Mok, V. C. T. ((2013) ). Abnormal Organization of White Matter Network in Patients with No Dementia after Ischemic Stroke. PLoS ONE, 8: (12), e81388. |
28 | Song, J. , Nair, V. A. , Young, B. M. , Walton, L. M. , Nigogosyan, Z. , Remsik, A. , Tyler, M. E. , Farrar-Edwards, D. , Caldera, K. E. , Sattin, J. A. , Williams, J. C. , & Prabhakaran, V. ((2015) ). DTI measures track and predict motor function outcomes in stroke rehabilitation utilizing BCI technology. Frontiers in Human Neuroscience, 9: , 195. |
29 | Ueda, R. , Yamada, N. , Abo, M. , Ruwan, P. W. , & Senoo, A. ((2019) ). MRI evaluation of motor function recovery by rTMS and intensive occupational therapy and changes in the activity of motor cortex. International Journal of Neuroscience, 130: (3), 309–317. |
30 | Ueda, R. , Yamada, N. , Abo, M. , & Senoo A. ((2019) a) Correlation analysis of motor function improvement and brain structure for upper limb paralysis. NeuroReport, 30: (2), 77–81. |
31 | Ueda, R. , Yamada, N. , Abo, M. , & Senoo A. ((2019) b) Relationship between motor function improvements and white matter structure after low-frequency repetitive transcranial magnetic stimulation plus intensive occupational therapy in chronic subcortical stroke patients. NeuroReport, 30: (7), 485–490. |
32 | van den Heuvel, M. P. , & Sporns, O. ((2011) ). Rich-Club Organization of the Human Connectome. Journal of Neuroscience, 31: (44), 15775–15786. |
33 | Wang, J. , Wang, X. , Xia, M. , Liao, X. , Evans, A. , & He, Y. ((2015) ). GRETNA: a graph theoretical network analysis toolbox for imaging connectomics. Frontiers in Human Neuroscience, 9: , 386. |
34 | Wang, L. , Yu, C. , Chen, H. , Qin, W. , He, Y. , Fan, F. , Zhang, Y. , Wang, M. , Li, K. , Zang, Y. , Woodward, T. S. , & Zhu, C. ((2010) ). Dynamic functional reorganization of the motor execution network after stroke. Brain, 133: (4), 1224–1238. |
35 | Yamada, N. , Kakuda, W. , Senoo, A. , Kondo, T. , Mitani, S. , Shimizu, M. , & Abo, M. ((2013) ). Functional Cortical Reorganization after Low-Frequency Repetitive Transcranial Magnetic Stimulation plus Intensive Occupational Therapy for Upper Limb Hemiparesis: Evaluation by Functional Magnetic Resonance Imaging in Poststroke Patients. International Journal of Stroke, 8: (6), 422–429. |
36 | Yamada, N. , Ueda, R. , Kakuda, W. , Momosaki, R. , Kondo, T. , Hada, T. , Sasaki, N. , Hara, T. , Senoo, A. , & Abo, M. ((2018) ). Diffusion Tensor Imaging Evaluation of Neural Network Development in Patients Undergoing Therapeutic Repetitive Transcranial Magnetic Stimulation following Stroke. Neural Plasticity, 2018: , 1–8. |
37 | Yu, R. , Liu, B. , Wang, L. , Chen, J. , & Liu, X. ((2013) ). Enhanced Functional Connectivity between Putamen and Supplementary Motor Area in Parkinson’s Disease Patients. PLoS ONE, 8: (3), e59717. |
38 | Zhang, J. , Wang, J. , Wu, Q. , Kuang, W. , Huang, X. , He, Y. , & Gong, Q. ((2011) ). Disrupted Brain Connectivity Networks in Drug-Naive, First-Episode Major Depressive Disorder. Biological Psychiatry, 70: (4), 334–342. |

