Characterization of Surface Runoff Pathways and Erosion Using Hydrological Attributes Under Simulated Rainfall
 Lichao Zhang
 Xiaojun Liu4
 - 1College of Land Resources and Environment, Jiangxi Agricultural University, Nanchang, China
- 2Key Laboratory of Poyang Lake Watershed Agricultural Resources and Ecology of Jiangxi Province, Jiangxi Agricultural University, Nanchang, China
- 3Jiangxi Academy of Water Science and Engineering, Nanchang, China
- 4Jiangxi Provincial Key Laboratory of Silviculture, College of Forestry, Jiangxi Agricultural University, Nanchang, China
- 5Research Center of Soil and Water Conservation, Huazhong Agricultural University, Wuhan, China
Conceptualisation of geo-hydrological characteristic of erosive runoff are of particular importance and has been required in recent soil erosion control. This study aimed to explore the feasibility of applying hydrological attributes to characterize surface runoff pathways in the process of hillslope soil erosion due to rainfall. Combined with sub-millimeter high-resolution laser scanning and computer digital image processing method, three hydrological indicators (i.e., sinuosity, gradient and orientation) were used to investigate the changes of the surface runoff pathways on the slope of three typical southern red soils (i.e., shale (HS), and Quaternary red clay soils (HQ1 and HQ2) under simulated rainfall conditions). The results indicated no significant changes of sinuosity with a mean value of 1.19. After the rainfall with the intensity of 1 mm/min and 2 mm/min, the orientation and gradient changed dramatically. The greatest changes appeared at the first rainfall, which showed that the biggest increase of gradient was 26.78% and it tended to be close to the original slope of the test plot, while the orientation dropped by 5.60–31.44%. Compared with HS and HQ1, the runoff pathway characteristics of HQ2 changed more consistent. The rainfall intensities had a significant impact on the correlation between indicators. The determination coefficients sorting with surface roughness were orientation > graient > sinuosity. And they were significantly linearly related to runoff under 1 mm/min rainfall intensity, while had positive correlation with sediment under 2 mm/min rainfall intensity (p < 0.05). In conclusion, there were more remarkable relationships between orientation, gradient and slope erosion under 1 mm/min rainfall intensity. This provided an innovative idea, that is applying the orientation and gradient to the simulation and prediction model of the rainfall erosion process in the sloping farmland in the southern red soil area.
Introduction
Soil erosion is a worldwide environmental problem and has far reaching economic, political and social implications (Singh and Singh, 2018). For further understanding and management of water erosion, a thorough knowledge of spatio-temporal patterns, structures and quantitative description of confluence network is indispensable. It is usually employed to study the river watershed. With the integration of various disciplines, Horton’s law and fractal feature methods are combined to describe the confluence network (Tarboton et al., 1988; Beer and Borgas., 1993). Rill erosion processes are a key part of the process-based runoff-erosion model. A deeper understanding, description, and simulation of the evolution of the rill network will help us to increase our understanding of the slope-scale erosion process and to enhance the predictability of erosion models accordingly (Brunton and Bryan, 2020). Moreover, the similarity between the network of rills on the eroded slope and the river confluence network has long been reported. Sofia et al. (2017) proved the similarity between the river network and the rill network through laboratory simulations. Also, Helming et al. (1999) found that the small-scale drainage network of eroded slope runoff had similar characteristics to the river system when Horton’s law and fractal Feature methods were utilized (Fang et al., 2018). Wu and Chen. (2020) believed that if the similarities exist, the knowledge that has been obtained at the river scale can be used to understand and simulate the rill network process.
However, there are few studies on small-scale runoff configurations. Regarding slope water erosion, most studies focus on runoff and erosion processes. That is, the common concepts were applied to describe its characteristics such as water flow shear force (Bai et al., 2020), and runoff energy (Zhang et al., 2016). Therefore, most of the studies ignore the effect of spatial changes of runoff patterns on runoff hydrodynamics. Wilson. (1993) elaborated on the idea of describing runoff patterns under confluent network conditions. He proposed that the flow between rills can converge with the flow of other runoff pathways to form more rills. Thus, the flow between rills can be described by these small water flow pathways. According to this concept, a rill is defined as a flow pathway at a specific level (Bennett et al., 2015).
Recently, some studies have used Horton’s law and other principles of river hydrology to examine the evolution of small-scale slope erosion confluence networks. Some hydrological feature concepts such as bifurcation ratio (Pant et al., 2020), length ratio (Singh and Singh, 2018), drainage density, stream frequency (Tukura et al., 2021) are effectively used to describe the structural characteristics of the surface convergence network. As the second most obvious feature of the soil surface, roughness can affect the path, depth and velocity of overland flow (Darboux, 2011). However, at present, there are few comprehensive reports on the characteristics of various levels of runoff pathways in the surface confluence network and their development laws. Danino et al. (2021) coupled the thermal images of shallow overland flows with light detection and ranging (LiDAR) scanning to explore the quantified the shallow overland flow. A relative surface connection function was explored as a quantitative link between soil roughness and overland flow generation, which improved the overland flow hydrograph prediction (Peñuela et al., 2016). Moreover, some hydrological attributes have not been employed to characterize the development of rill networks. With the development of high-resolution laser scanning and computer digital image processing technology in the field of water and soil conservation (Milenković et al., 2015), the understanding of runoff hydrological processes in the process of surface erosion has deepened gradually (Stefano et al., 2019). Based on the principle of triangulation measures, the laser micro-topography scanner is utilized to determine the elevation of each point of the micro-topography. In this way, not only a high-resolution and reliable measurement can be obtained but also the spatial change of runoff patterns after rainfall events can be directly reflected. Therefore, the characterization of the slope water erosion process and its mechanism are optimized.
In this study, field rainfall simulation experiments were performed on three typical southern red soils of China using laser micro-landform scanning. Three hydrological indicators (i.e., sinuosity, gradient, and orientation) were used to analyze the surface runoff pathway characteristics and erosion effects on sloping farmland, and then to explore the relationship between runoff patterns and erosion processes. The study scrutinized the feasibility of applying hydrological attributes to characterize soil erosion processes. Thus, it provided reference significances for enriching the knowledge on the slope erosion process and promoted the research on the simulation and prediction model of rainfall erosion process in sloping farmland in southern red soil regions.
Materials and Methods
Description of the Study Sites
The study area was located in Xianning City, Hubei Province, spanning between 113°32-114°58’ E and 29°02-30°19’ N. It had a gently hilly terrain and a subtropical monsoon climate. The annual average temperature was 16.8°C and the rainfall was 1,572 mm, 70% of which occurs from April to September. The rainfall intensities exceeding 50 mm h−1 are common (Shi et al., 2010). The main land use type is forestland (11.31 km2, accounted for 57.8% of the total area), followed by the residential land (13.4%) and water area (9.1%). Evergreen broad-leaved forest, deciduous broad-leaved forest and coniferous forest distributed in the study area. 2/3 of the cultivated land (1.33 km2, accounted for 6.8% of the total area) belongs to medium and low yield land, and the surface soil thickness is about 20 cm. The parent material for soil formation was mainly Quaternary red clay soil and argillaceous shale, and the soil types were red soil and red paddy soil. In this study, the common local sloping farmland was chosen as the test site. Conventional analytical methods (Soil Survey Laboratory Methods Manual, 2004) were applied to determine soil properties such as texture (Table 1)
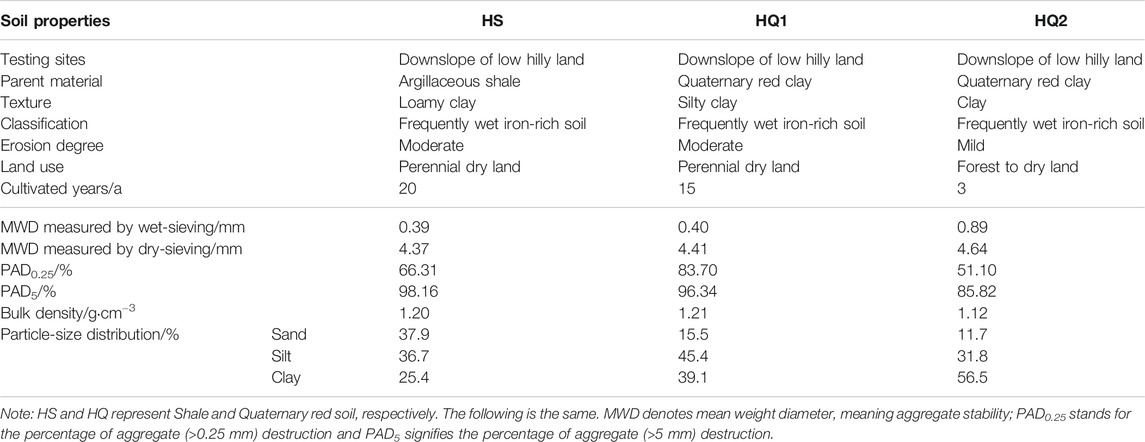
TABLE 1. Basic characteristics and properties of experimental soils.
Experimental Layout and Design
Three soils were selected for the rainfall simulation experiment (Figure 1), among which two were developed in Quaternary red clay and one was developed in argillaceous shale. The slopes of runoff plots ranged from 16 to 18%. The test plot was 2 m × 1 m, and 0.5 cm thick bamboo plywood was used to drive into the soil to the depth of 30 cm serving as a partition wall to separate the flow between the inner and outer plot.
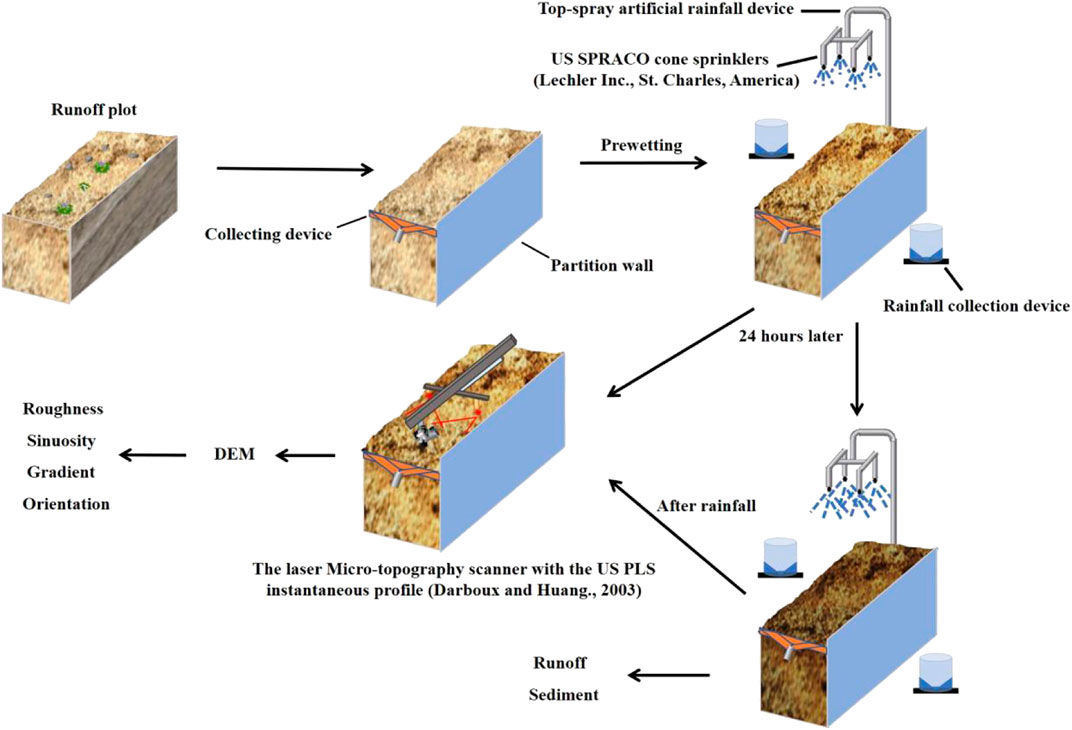
FIGURE 1. The schematic overview of the experiment.
For each soil type, there were 2 runoff plots for the simulated rainfall intensity of 1 mm/min and 2 mm/min, respectively. As a result, 6 runoff plots in total were selected. For the same rainfall intensity, three consecutive rains were conducted 24 h apart. Runoff samples were collected regularly from the start of runoff generation. For 1 mm/min and 2 mm/min rainfall intensity, the sampling intervals were 6 and 3 min, respectively. At the same time, runoff volume was recorded and brought back to the laboratory to determine the sediment content.
Before the first rainfall event and after each rainfall event, the surface microtopography was scanned and the surface microtopography elevation was measured based on the principle of triangulation. The obtained cloud data set was used to create DEM to extract surface microtopography characterization indexes and runoff pathway characteristics (Figure 2).
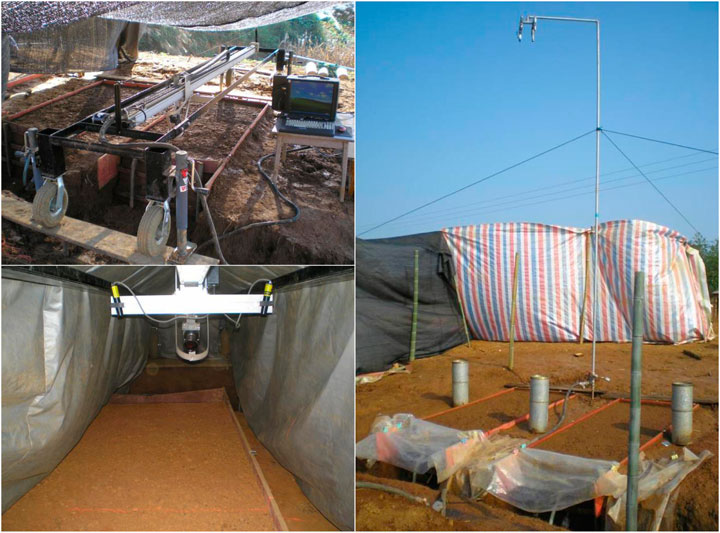
FIGURE 2. The field temporary runoff plots and scanning process.
Before the artificial rainfall, large gravel and plant roots were removed for flat soil surface. A runoff and sediment collection device was set at the outlet of each runoff plot, and a rainfall collection device was set on both sides of the plot to determine whether the rainfall intensity and rainfall meet the experimental requirements. For keeping the consistent rainfall conditions and better comparing the development process of different soil surface micro-topography, the soil surface was pre-wetted with light rain intensity 24 h before the first rainfall experiment until it reached saturation point. The initial soil moisture content was all about 15–17%, determined by thermogravimetric measurement (Bittelli, 2011).
The artificial rainfall simulation equipment was a combined top-spray artificial rainfall device imported from Canada, with American SPRACO cone sprinklers (Lechler Inc., St. Charles, America). The vertical height of the sprinklers from the ground was 4.75 m. The simulated rainfall kinetic energy was about 90% of the natural rainfall of equal rainfall intensity, the uniformity was about 0.9, and the water supply pressure was 0.08 MPa (Luk et al., 1986). According to the local weather conditions and the frequency of heavy rain, two rainfall intensity treatments of 1 mm/min (once-in-a-year rainfall, high intensity) (Shi et al., 2010) and 2 mm/min were adopted. For the same runoff plot, three consecutive rainfalls were performed, which were 24 h apart under the same rainfall intensity. The individual amount of rainfall was 48 mm, 84 mm, and 84 mm, respectively, with the total amount of rainfall controlled to be 216 mm. Two replicates were performed, with 36 effective rainfall events (Table 2).
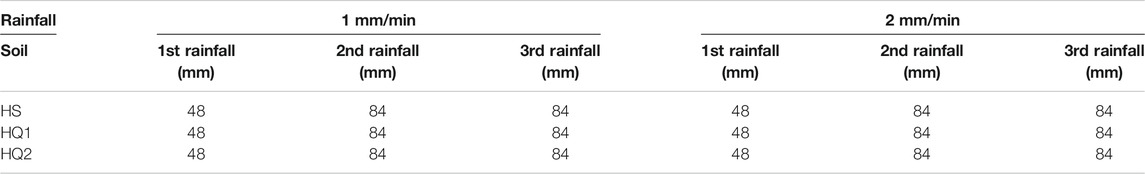
TABLE 2. Field experiment design of simulated rainfall.
Erosion Data Collection
The whole experiment time was recorded, and runoff samples were collected regularly from the beginning. Based on the previous experience, the runoff from lower intensity rainfall was less and slower than that from higher intensity rainfall. Therefore, the sampling intervals for 1 mm/min and 2 mm/min rainfall intensity were 6 and 3 min, respectively. At the same time, runoff volume was recorded and then taken back to the lab for filtration. The filtered sediment was weighed after drying 12 h at 105°C.
The surface roughness index used in this study is lattice surface element roughness. It refers to the area range with four adjacent grid points (i, j), (i, j+1), (i +1, j+1) and (i +1, j) as the vertices on the horizontal projection plane of grid DEM (i and j are the abscissa and ordinate coordinates of grid points respectively). Roughness of lattice surface element means the ratio of the surface area of the lattice on the DEM to its horizontal projection area. It was calculated as following:
where CZ is roughness, AS means surface area, AHP means horizontal projection area.
When the roughness was 1, it stands for horizontal plane for actual surface of the lattice. This specific surface area could affect the rainfall energy per unit area, which was proved to be ideal index for quantifying surface features.
Runoff Pathway Characteristics Determination
Before the first rainfall event and after each rainfall event, the laser micro-topography scanner with the US PLS instantaneous profile (Darboux and Huang., 2003) was employed to scan the surface micro-topography, which was based on the principle of triangulation to measure the surface micro-topography elevation (Figure 2). The positioning accuracy and elevation accuracy were 0.5 mm. The obtained cloud data set was used to create DEM to extract the surface micro geomorphic characterization index before and after rainfall. The main steps are as follows:
1) The laser scanning data set was preliminarily screened through binarization processing, and the pixel values higher than the predetermined threshold were retained.
2) The point cloud data was put into the orthogonal reference system, and a set of (x, y, z) coordinates were obtained through the calibration polynomial processing, and then resampled to the regular grid (x, y). ERDAS image v9.0 software developed by Intergraph (United States) (Darboux and Huang, 2003) was used to convert the calibrated regular raster file into image format.
3) The original DEM was filled with depressions to get non depressions DEM, so as to reflect the surface morphology more accurately.
4) ArcGIS (ESRI software, version 9.3) was used to encode the neighborhood grids of the unit grid, and D8 method (Kumar and PatraLakshmi, 2017) is used to extract the flow direction.
5) Through the numerical matrix simulation of the flow direction of the regional topography, the cumulative numerical matrix of the flow was obtained, and then the flow concentration network of the thin layer on the soil surface was obtained.
To facilitate the analysis of runoff characteristics, the river classification method developed by Strahler. (1952) was applied to classify the confluence network. The method defines a river starting from the source of the river as a first-level river. Also, the level of the river formed by the intersection of two rivers of the same level is increased by one level, and the level of the river formed by the intersection of two rivers of different levels is equal to the higher level of the two. Three indicators of sinuosity, gradient, and orientation were utilized to describe the characteristics of each runoff pathway (Helming et al., 1999). The mathematical expression is as follows:
where h(G)is the elevation of the grid G; x, y are the abscissa and ordinate of the first grid in the runoff pathway; m, n are the abscissa and ordinate of the last grid in the runoff pathway; w is The length of the grid.
Sinuosity, also known as tortuosity, characterizes the complexity of the bending of an object. Generally, the lower the sinuosity of an object, the shorter its relative length and the more monotonous the structure, vice versa. When used in the process of water erosion on slopes, the degree of runoff sinuosity indicates the degree of sinuosity of the runoff pathway. As the sinuosity becomes larger, the relative actual length of the runoff pathway increases, and the structure becomes more complex, whereas the drainage and flow velocity per unit time of the runoff pathway will decrease as a result.
Gradient, sometimes referred to as slope, is the degree of inclination of a surface along a given direction. The gradient can be obtained by taking the dot product of the vector gradient and the research direction. The magnitude of the gradient can be used to describe the speed at which a research object changes in a certain direction. For a slope, there can be a straight uphill pathway downhill, the gradient of which is the largest, and the gradient is equal to the value of the slope. The gradient applied to the field of soil erosion means the rate of change of the runoff pathway in a certain direction. When other factors are fixed, with the increase of the gradient, the flow velocity also increases.
Orientation, also known as directionality, is equal to the angle formed by a certain runoff and the vertical downward slope. Orientation changes can describe the development trend of network configuration. The decrease in the orientation of runoff indicates that the runoff flows more directly downslope, which increases the runoff velocity and drainage effectiveness to a certain extent.
Results and Analysis
Sinuosity Under Continuous Rainfall
As shown in Table 3, in the three intermittent rainfalls under two rainfall intensities, the sinuosity changes of the three red soils before and after rainfall events did not have significant differences, although a certain trend was observed. The average sinuosity range of the runoff pathway in the initial soil surface confluence network was 1.20–1.45. For most of the treatments, the average sinuosity of the runoff pathway generally showed a downward trend, with a more decline of sinuosity on HS and HQ1 than that on HQ2. Also, most of the changes were observed during the first rainfall event. Under 1 mm/min rainfall intensity, the sinuosity of HS, HQ1, and HQ2 decreased by 7.03, 9.45, and 0.82%, respectively; under 2 mm/min rainfall intensity, the sinuosity of HS and HQ2 decreased by 4.92 and 2.38%, whereas the sinuosity of HQ1 increased by 2.5%.
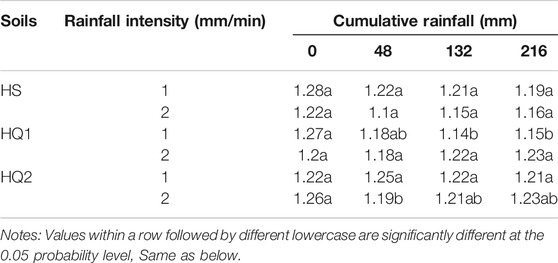
TABLE 3. Sinuosity of three soils under two rainfall intensity Unit:mm−1.
As the runoff level raised, the sinuosity value became larger. The effect of rainfall caused the runoff to flow more directly into the nearest junction, resulting in the sinuosity value which dropped to 1.15–1.35 after 216 mm of rainfall accumulation (Figure 3). Continuous rainfall had reduced the difference between the sinuosity of varying levels of runoff pathways. Most of the changes in the sinuosity occurred during the first rainfall event. Comparing HS, HQ1, and HQ2, it could be found that except for the 1 mm/min rainfall intensity treatment for HQ2, other treatments all showed a certain degree of variability. Under the rainfall intensity of 1 mm/min, the HQ2 surface structure changed slowly and exhibited a gradual change trend. No rills were observed during this change. The runoff pathway sinuosity of HQ2 changed uniformly at all levels with the progress of rainfall. This showed that the sinuosity of the first-level runoff pathway was raised first and diminished thereafter, whereas the sinuosity of the second-to fifth-level diminished gradually. At the end of the experiment, the difference in the sinuosity of each runoff pathway was not significant (p < 0.05).
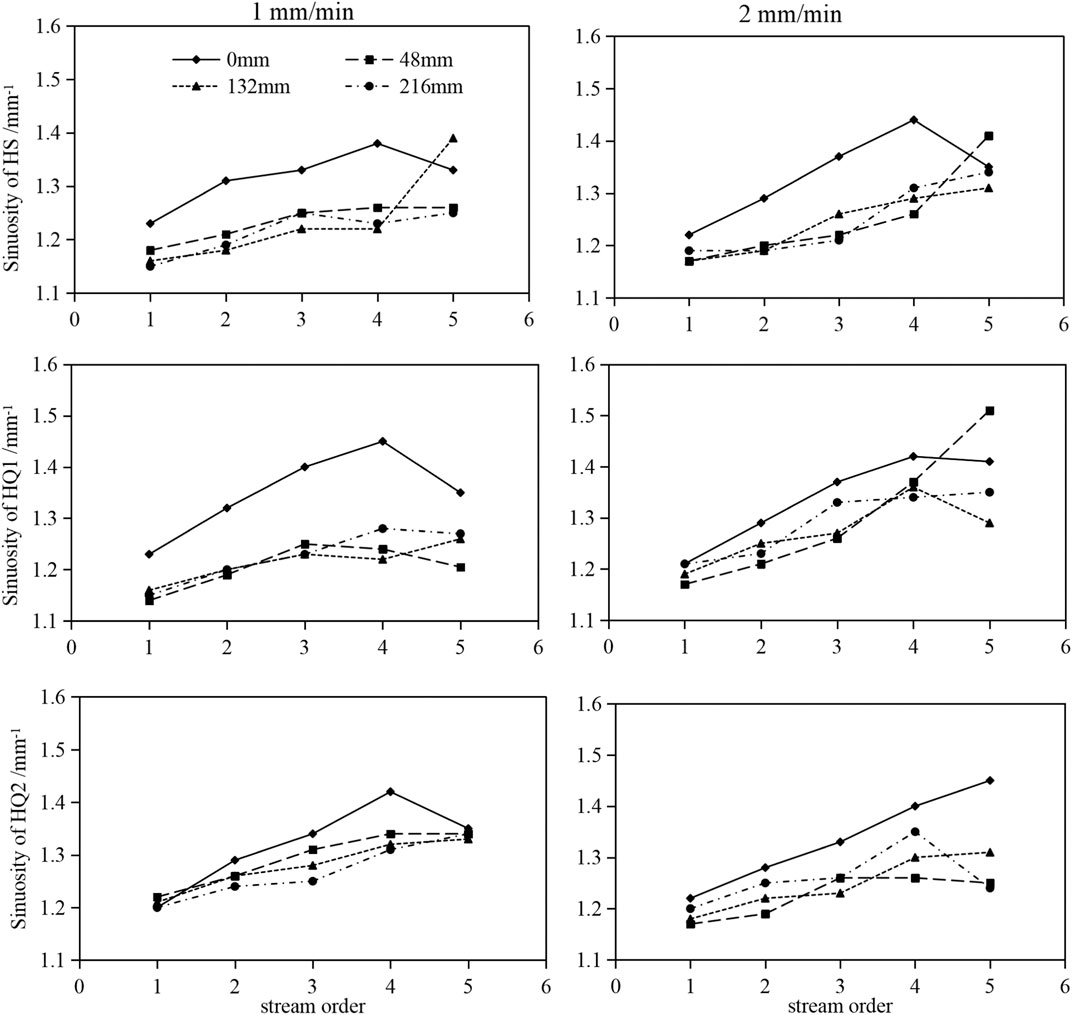
FIGURE 3. The curves of sinuosity of each stream with cumulative rainfall for three selected soils.
Gradient Under Continuous Rainfall
As indicated in Table 4, under the rainfall intensity of 1 mm/min, the gradient changes of the three red soils in the three intermittent rainfalls did not show significant differences, whereas, under the rainfall intensity of 2 mm/min, HS and HQ2 showed a significant difference before and after the first rainfall (p < 0.05). The average sinuosity of the runoff pathway had an overall upward trend and the main change occurred during the first rainfall. Dduring the second and third rainfall, the change was not significant. the gradients increased by 17.84, 10.19, and 13.08% under 2 mm/min rainfall intensity after the first rainfall event. The average gradient of the runoff pathway increased with the accumulation of rainfall and tended to be close to the plot slope.
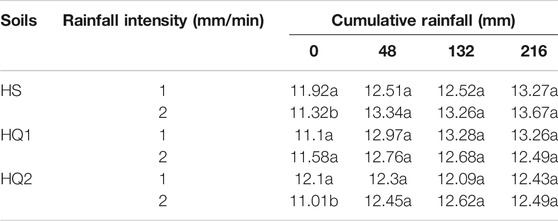
TABLE 4. Gradient of three soils under two rainfall intensity Unit: %.
The first-level runoff pathway gradient was 11.34–12.39% and 12.31–13.78% before and after the first rainfall event and became 12.65–13.97% after the third rainfall event. The gradient of the second-level runoff pathway was 10.72–11.99% before the first rainfall event, 11.27–13.19% after 48 mm of rainfall accumulation, and 12.07–13.68% after 216 mm of rainfall accumulation, respectively. During continuous rainfall, the average gradient of high-level (i.e., the 4th and 5th levels) runoff pathway was low (Figure 4). That is, in most cases, continuous rainfall caused the difference between varying levels of runoff pathway gradients to decrease, especially for HQ2 under 1 mm/min rainfall intensity.
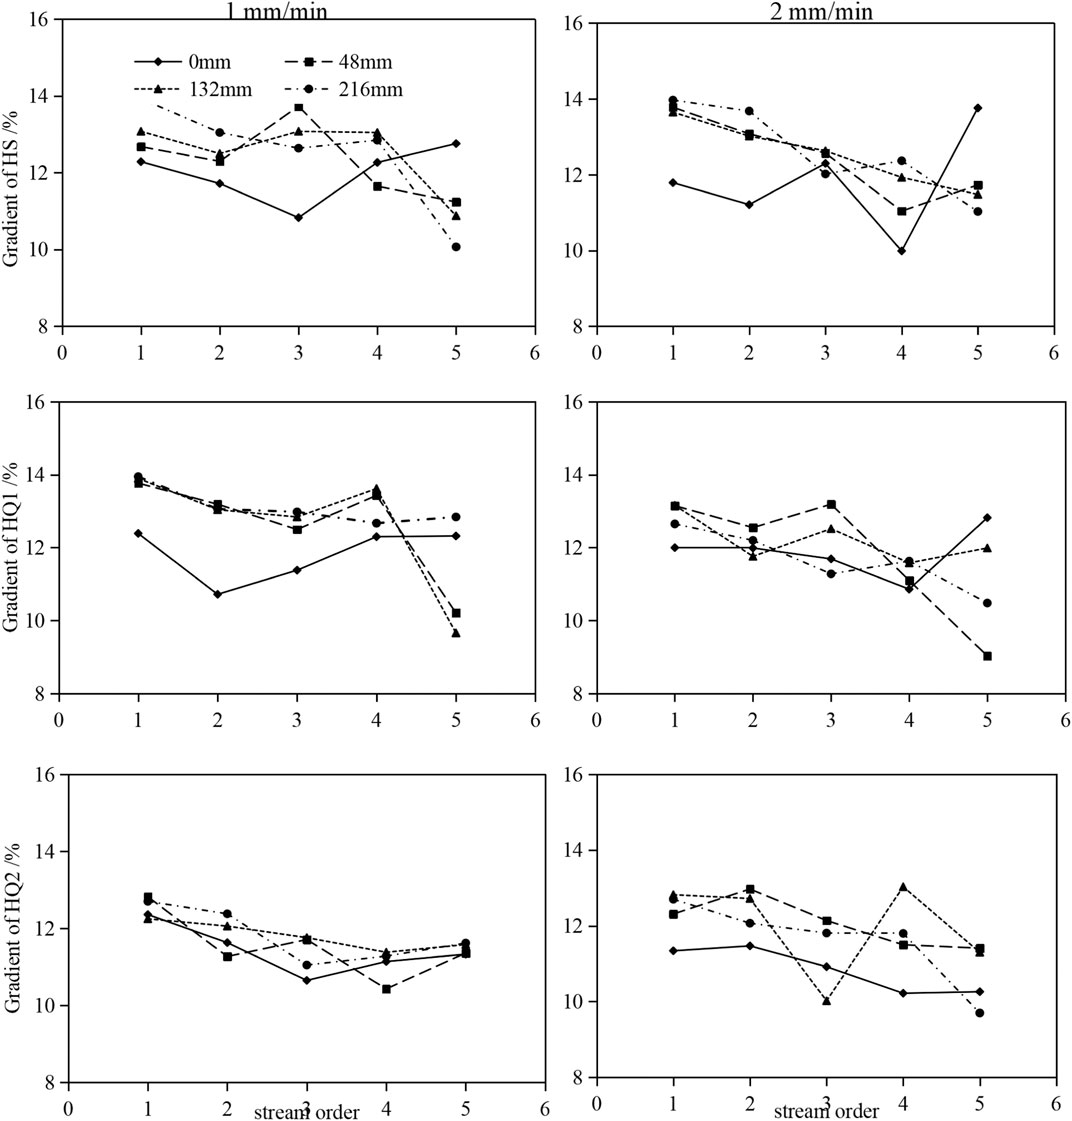
FIGURE 4. The curves of gradient of each stream with cumulative rainfall for three selected soils.
Orientation Under Continuous Rainfall
For all the three intermittent rainfall treatments with two rainfall intensities, the first rainfall event changed the orientation of the three red soils most obviously and significantly (Table 5). Under 1 mm/min rainfall intensity, the orientation of HS, HQ1, and HQ2 decreased by 12.47, 28.11, and 5.00% after the first rainfall event, respectively. These values decreased by 26.93, 15.71, and 21.99% under 2 mm/min rainfall intensity, respectively. After the total rainfall events, the orientation of HS, HQ1, and HQ2 lessened by 25.15, 33.44, and 12.04% under 1 mm/min rainfall intensity, and lessened by 16.97, 5.60, and 12.94% under 2 mm/min rainfall intensity, respectively. Under 1 mm/min rainfall intensity, the orientation of the average runoff pathway of the three red soils showed a downward trend. The change range was the largest during the first rainfall event, with the smallest decline observed in HQ2 soil that maintained a high level of orientation. The orientation of HS continued to reduce and remain stable during the third rainfall event. The orientation of HQ1 declined the fastest during the first rainfall event, but increased after the second rainfall event, and dropped again after the third event. In general, the initial average orientation of the three red soils was similar, and there was a significant difference after the third rainfall event. Under the 2 mm/min rainfall intensity, the orientation of the average runoff pathways of the three red soils decreased first and then increased, although the trend difference was not obvious. The reasons for these phenomena were explained above.
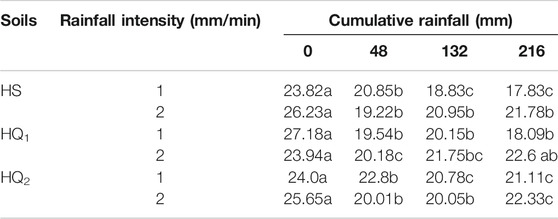
TABLE 5. Orientation of three soils under two rainfall intensity Unit: %.
For the first- and second-level runoff pathways, the initial average orientation was 16.34°–29.39° (deviation from the downhill direction of the plot), and the initial average orientation of the fourth- and fifth-level runoff pathways was 1.5°–7.88°. The orientation of different levels of runoff pathways could be roughly divided into two scenarios: the orientation of the first- and second-level of runoff pathways was approximately diagonal with respect to the slope of the plot, and the orientation of the fourth- and fifth-level of runoff pathways was almost parallel to the slope. Rainfall mostly affected the orientation of the first and second runoff pathways, resulting in a decrease of 14.9°–24.35° after 216 mm of rainfall accumulation (Figure 5). The high-level runoff pathways (i.e., 4th and 5th) appeared as the main local runoff pathways, while the low-level runoff pathways (i.e., 1st-3rd) showed certain subordination. It could be inferred that the adjustment direction of the low-level runoff pathway was shifted to the higher levels of the runoff pathway. The 1st-to 3rd-level runoff pathways moved to the 4th and 5th levels of runoff pathways, indicating that the relative importance of the high-level main runoff pathways in the confluence network system increased gradually. In all treatments, the HQ2 also had the most gentle change in the orientation of the runoff pathway under the 1 mm/min rainfall intensity treatment.
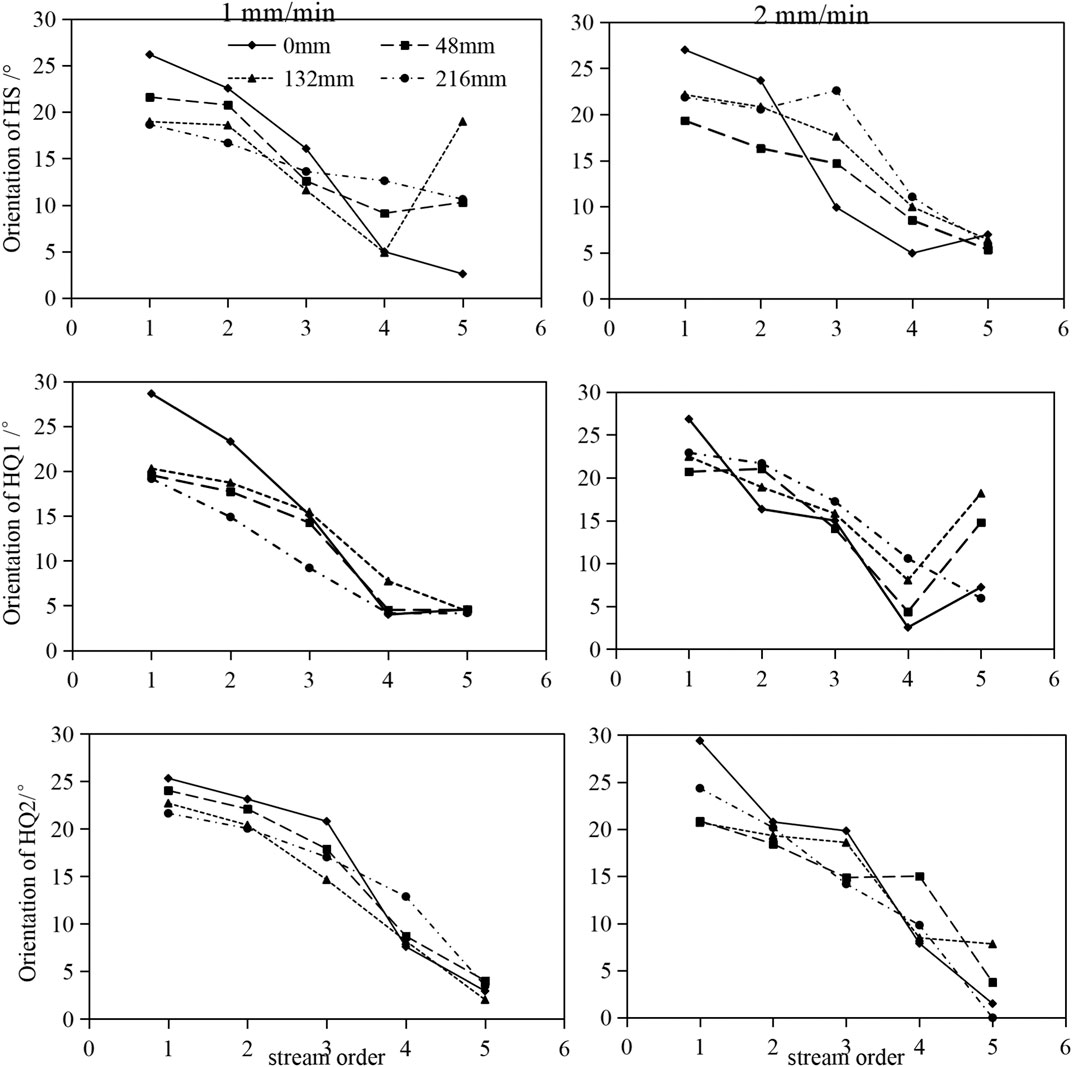
FIGURE 5. The curves of orientation of each stream with cumulative rainfall for three selected soils.
The Relationship Between Roughness and Runoff Pathway Characteristics
Surface roughness (i.e., the ups and downs of the surface micro-topography) directly affects the route and direction of the runoff pathway. Therefore, this study explored the relationship between surface roughness and runoff pathway sinuosity, gradient, and orientation.
The roughness had a linear positive correlation with the sinuosity and orientation and had a linear negative relationship with the gradient (Figure 6). The sensitivity of the runoff pathway characteristics with the variation of the roughness was also different for varying rainfall intensities. The sensitivity of sinuosity and gradient under 1 mm/min rainfall intensity was greater than that under 2 mm/min rainfall intensity.
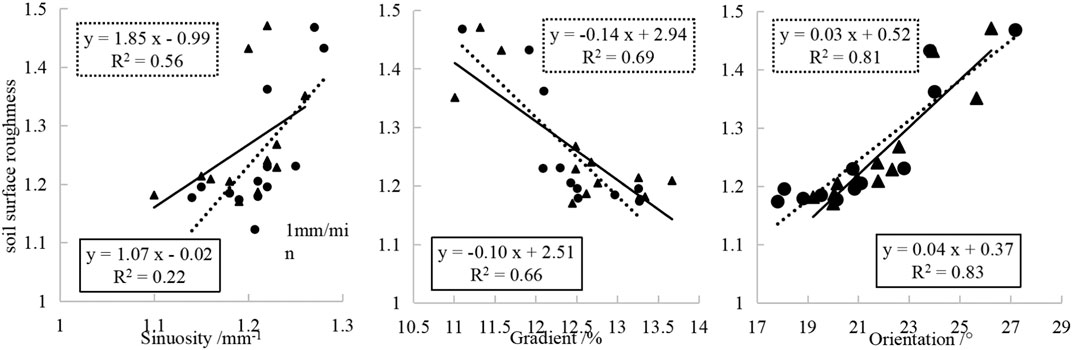
FIGURE 6. Relationship between soil surface roughness and stream sinuosity, gradient, orientation.
The Relationship Between Runoff, Sediment and Runoff Pathway Characteristics
The slope erosion under 2 mm/min rainfall intensity was apparently more severe than that under 1 mm/min rainfall intensity (Table 6). Furthermore, the runoff and sediment showed overall growth trend along with continuous rainfall.
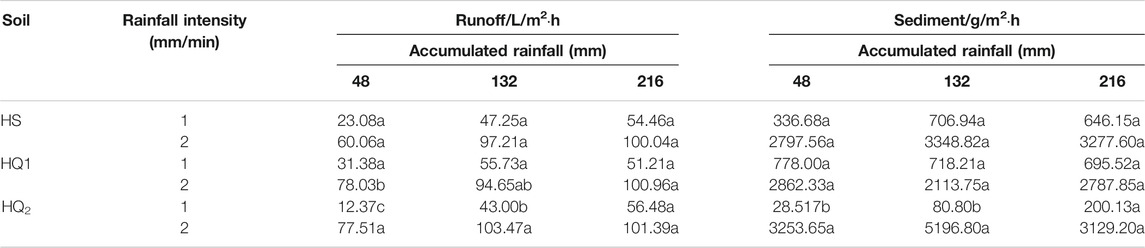
TABLE 6. Runoff yields of three soils under two rainfall intensity.
As shown in Table 7, the runoff pathway characteristics were significant linear related to runoff under 1 mm/min rainfall intensity, while they had significant relationship with sediment under 2 mm/min rainfall intensity, except for gradient. Under the rainfall intensity of 1 mm/min, the sinuosity and orientation decreased along with runoff while gradient showed growth trend (p < 0.05). On the contrary, the sinuosity and orientation was negatively correlated with sediment under 2 mm/min rainfall intensity.
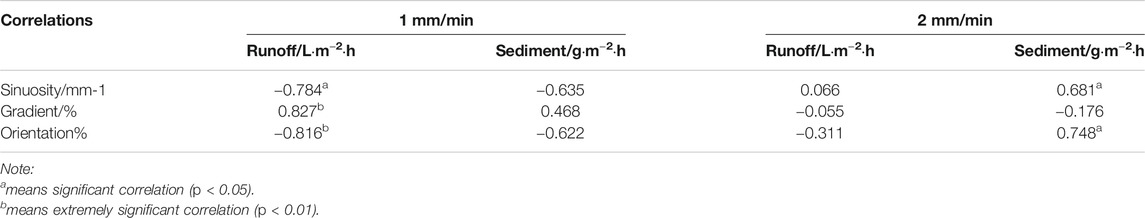
TABLE 7. Relationship between Runoff yields and stream sinuosity, gradient, orientation.
Discussions
The Influence of Rainfall on Hydrological Indicators of Surface Runoff Pathway
Three hydrological attribute indexes (i.e., sinuosity, gradient, and orientation) were used to describe the characteristics of the runoff pathway of the surface confluence network. The three describe the shape and change characteristics of runoff pathways from different perspectives. The sinuosity indicates the degree of curvature of the runoff pathway. The gradient indicates the rate of change of the runoff pathway in a certain direction. The orientation characterizes the development trend of the network configuration. In the three intermittent rainfalls under two rainfall intensities, most of the three red soils sinuosity before and after the rainfall treatment did not have significant differences. The reason was that under the influence of especially the first rainfall event, the continuous impact of raindrops had caused the initial high roughness of the HS surface to decrease rapidly. Thus, the crust area increased, and the surface became smoother, which resulted in a decrease in the tortuous degree of the runoff pathway. But in the river ecosystem, the sinuosity increases, the erosion also increases (Himayoun and Roshni, 2020). Under the two rainfall intensities, the most severe changes of the three attribute indexes occurred during the first rainfall event. The reason was that during the first rainfall, the roughness of the ground surface (Table 8) and the area of the soil crust changed rapidly (Bullard et al., 2018). The ground surface gradually became smoother, resulting in a decrease in the sinuosity of the runoff pathway, a faster change of the runoff pathway, and a decrease in the relative actual length of the runoff pathway. During the second and third rainfall events, the soil crust was destroyed (Lu et al., 2017) and the rills gradually were developed. At the same time, due to the differences in the basic conditions and properties of the soil and the changes in the soil surface structure, the three red soils experienced different degrees of erosion responses. This resulted in larger differences in runoff pathway characteristics after rainfall events. Himayoun and Roshni (2020) found that as the sinuosity increases, the erosion also increases for a relatively significant areal extend. Sarkar et al. (2020) also chose flow gradient as an important parameter for understanding the erosional stage. Because of the different initial conditions of the experiment, the results of the study were somewhat different from this study, but overall showed an increase or decrease trend, and both had a good correlation with the surface roughness. The results of this research supported the viewpoints from Helming et al. (1999), that roughness was sensitive to surface microrelief variations. Comprehensive and collected findings have suggested that there is certain feasibility for utilizing three hydrological attribute indexes of sinuosity, gradient and orientation to characterize surface runoff pathway characteristics during rainfall erosion.
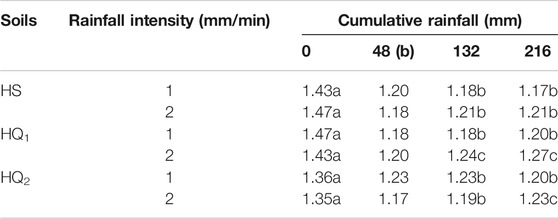
TABLE 8. Soil surface roughness of three soils under two rainfall intensity.
The Influence Factors of Runoff Pathway Changes
In the process of rainfall erosion, the surface affects the characteristics of the runoff pathway changes through the formation of rills and crusts. The crusts tend to reduce the roughness, and the rills tend to increase the roughness (Gessesse et al., 2015). Through analysis, it could be found that the surface roughness had a good correlation with sinuosity, gradient, and orientation, which played a demonstrative role in the previous analysis for the cause of the change in runoff pathway characteristics. As the roughness increased, the runoff pathway was forced to flow around the roughness unit (i.e., soil clods and aggregates), which increased the length and curvature of the runoff pathway. This resulted in an increase in sinuosity and orientation. Similarly, when the roughness increased, the rate of change of the runoff pathway in a certain direction decreased, resulting in a decrease in the gradient of the runoff pathway. With different rainfall intensity, the runoff pathway characteristics varied with the degree of roughness. The variation amplitude under 2 mm/min rainfall intensity was larger than that under 1 mm/min rainfall intensity. The reasons were likely attributed to two aspects. On the one hand, under the impact of heavy rain, bulk soils and aggregates suffered from more raindrops and were more easily destroyed. At the same time, the kinetic energy of raindrop and runoff was also greater under heavy rain than that under low intensity rainfall. The sediment yielding of the red soil slop was controlled by detachment limitation under the high rainfall intensities (Zhao et al., 2015). It was easier to entrain or destroy the bulk soil and aggregates.
During the first rainfall event, the continuous rainfall caused the higher initial roughness of the soil surface to decrease rapidly. Also, the change speed of the runoff pathway was accelerated. That is, the gradient of the runoff pathway increased. Among them, the increase in the gradient of the low-level runoff pathway was the most obvious. During the second and third rainfall events, the gradients of the three soils exhibited a certain differentiation due to the varying development level and stability of crusts and the formation and development of rills. The gradient was increasing because of the large area of stable crust formed on the surface of HS, which was higher than the influence caused by rills. Under the rainfall intensity of 1 mm/min, crusts and rills of HQ1 soil were formed quickly, causing the gradient to reach a peak point quickly, and then to remain stable. Under the rainfall intensity of 2 mm/min, the formed crusts and even rills were easier to be destroyed. Moreover, the soil surface structure became rough, which caused the gradient of runoff pathways to decrease. For HQ2 soil under 1 mm/min rainfall intensity, the soil surface structure changed slowly and the runoff pathway changed less slowly, resulting in insignificant changes of gradient. The fluctuation of the gradient curve was likely attributable to the destruction and reformation of the surface crust. However, under the rainfall intensity of 2 mm/min and the high rainfall energy, the soil surface structure had also undergone more obvious changes and the formation and destruction of crusts had accelerated, followed by the development of rills, and significant changes in the runoff pathway and gradient. This could also explain the significant difference of gradient under the rainfall intensity of 2 mm/min, indicating that gradient could be an effective index to relect water erosion. Because of the decrease in the relative elevation of the bottom of the main runoff pathways under the continuous impact of raindrops and the continuous erosion of runoff, the relative importance of the high-level main runoff pathways increased. That is, the bottom of the rill was continuously washed away and the relative elevation was decreased. With low intensity of rainfall, the slope runoff was more active than sediment which showed significant relationship with sinuosity, gradient and orientation. The increase in rainfall intensity results in the entrapment of coarse silt and sand (Sobol et al., 2017), which lead to positive correlation between sinuosity, orientation and sediment.
The effective characterization of the development and evolution of the rill network is an important means to profoundly understand the slope water erosion process and to simulate the small-scale runoff configuration. The value of the directivity is equal to the angle formed by a certain runoff and the vertical downslope, and its change can characterize the development trend of the network configuration. The decrease in the orientation of runoff indicates that the runoff flows more directly downslope, which increases the runoff velocity and drainage effectiveness to a certain extent. There are a variety of erosion models available, differing from scale (point–continent), timestep (seconds–years) and processes (empirical–process based). The runoff erosion models usually have geographical limitation. Parameter adjustment and new parameter introduction could improve the accuracy. Surface roughness is a dynamic feature that affects soil surface runoff and erosion processes (Zhao et al., 2014). It has an important effect on the way of surface runoff generation, characteristics, infiltration processes, and erosion and sediment production processes (Bu et al., 2015; Modeste et al., 2017).
Conclusion
The mean sinuosity and orientation of the three red soils under the rainfall intensity of both 1 mm/min and 2 mm/min showed an overall downward, although not significantly, trend with the decreasing intervals at 0.82–9.45% and 5.60–31.44%, respectively. The average gradient increased with the accumulation of rainfall and tended to be close to the original slope gradient. Most of the changes in the three hydrological characteristic indicators appeared during the first rainfall event (p < 0.05).
For five levels of the runoff pathway, the effect of continuous rainfall led to an increase in the difference in the hydrological characteristics. Compared with HS and HQ1, HQ2 runoff pathway characteristics changed uniformly. The sinuosity of the first-level runoff pathway increased initially but decreased thereafter, same as that of the second to fifth-level runoff pathways. The gradient and orientation of the runoff pathway changed gradually with the rainfall accumulation.
The correlation coefficients sorting with surface roughness were orientation > gradient > sinuosity. And the three indices were significantly linearly related to runoff under 1 mm/min rainfall intensity, while had positive linear correlation with sediment under 2 mm/min rainfall intensity.
This study demonstrated that for three typical southern red soils, the runoff pathway orientation and gradient had a good correlation with landmark roughness, runoff generation and sediment yield. This provided great ideas, that are the applications of orientation and gradient to the simulation and prediction model of the rainfall erosion process of sloping farmland in the southern red soil area. In addition, studies have shown that rainfall intensity showed more pronounce influence on runoff (Fu et al., 2019), more rainfall experiments should be conducted to explore the characteristics with different rainfall intensities.
Data Availability Statement
The raw data supporting the conclusions of this article will be made available by the authors, without undue reservation.
Authors Contributions
All authors listed have made a substantial, direct, and intellectual contribution to the work and approved it for publication.
Funding
This research was jointly financially supported by the National Natural Science Foundation of China (No.41967012), the Key Research and Development Program of Jiangxi Province, China (No.20181ACG70006), the Natural Science Foundation of Jiangxi Province (No.20181BAB203024).
Conflict of Interest
The authors declare that the research was conducted in the absence of any commercial or financial relationships that could be construed as a potential conflict of interest.
Publisher’s Note
All claims expressed in this article are solely those of the authors and do not necessarily represent those of their affiliated organizations, or those of the publisher, the editors and the reviewers. Any product that may be evaluated in this article, or claim that may be made by its manufacturer, is not guaranteed or endorsed by the publisher.
References
Bai, Y., Zha, X., Zhang, J., and Chen, S. (2020). The Threshold of Nitrogen and Phosphorus Loss in Runoff on Degraded Ferralsols of Fujian Province, Southern China. Environ. Earth Sci. 79 (16), 395–402. doi:10.1007/s12665-020-09130-z
Beer, T., and Borgas, M. (1993). Horton's Laws and the Fractal Nature of Streams. Water Resour. Res. 29 (5), 1475–1487. doi:10.1029/92WR02731
Bennett, S. J., Gordon, L. M., Neroni, V., and Wells, R. R. (2015). Emergence, Persistence, and Organization of Rill Networks on a Soil-Mantled Experimental Landscape. Nat. Hazards 79 (1), 7–24. doi:10.1007/s11069-015-1599-8
Bittelli, M. (2011). Measuring Soil Water Content: A Review. HortTechnology 21 (3), 293–300. doi:10.21273/HORTTECH.21.3.293
Brunton, D. A., and Bryan, R. B. (2000). Rill Network Development and Sediment Budgets. Earth Surf. Process. Landforms 25 (7), 783–800. doi:10.1002/1096-9837(200007)25:7<783::aid-esp106>3.0.co;2-w
Bu, C., Zhao, Y., Hill, R. L., Zhao, C., Yang, Y., Zhang, P., et al. (2015). Wind Erosion Prevention Characteristics and Key Influencing Factors of Bryophytic Soil Crusts. Plant Soil 397 (1), 163–174. doi:10.1007/s11104-015-2609-z
Bullard, J. E., Ockelford, A., Strong, C., and Aubault, H. (2018). Effects of Cyanobacterial Soil Crusts on Surface Roughness and Splash Erosion. J. Geophys. Res. Biogeosci. 123, 3697–3712. doi:10.1029/2018jg004726
Danino, D., Svoray, T., Thompson, S., Cohen, A., Crompton, O., Volk, E., et al. (2021). Quantifying Shallow Overland Flow Patterns under Laboratory Simulations Using Thermal and LiDAR Imagery. Water Res. 57, e2020WR028857. doi:10.1029/2020wr028857
Darboux, F., and Huang, C.-h. (2003). An Instantaneous-Profile Laser Scanner to Measure Soil Surface Microtopography. Soil Sci. Soc. America J. 67 (1), 92–99. doi:10.2136/sssaj2003.0092
Darboux, F. (2011). “Surface Roughness, Effect on Water Transfer,” in Encyclopedia of Agrophysics. Encyclopedia of Earth Sciences Series. Editors J. Gliński, J. Horabik, and J. Lipiec (Dordrecht: Springer), 887–889. doi:10.1007/978-90-481-3585-1_169
Fang, Y., Ceola, S., Paik, K., McGrath, G., Rao, P. S. C., Montanari, A., et al. (2018). Globally Universal Fractal Pattern of Human Settlements in River Networks. Earth Future 6 (8), 1134–1145. doi:10.1029/2017EF000746
Fu, X. T., Zhang, L. P., and Wang, Y. (2019). Effect of Slope Length and Rainfall Intensity on Runoff and Erosion Conversion from Laboratory to Field. Water Resour. 46, 530–541. doi:10.1134/S0097807819040080
Gessesse, G. D., Mansberger, R., and Klik, A. (2015). Assessment of Rill Erosion Development during Erosive Storms at Angereb Watershed, Lake Tana Sub-basin in Ethiopia. J. Mt. Sci. 12 (1), 49–59. doi:10.1007/s11629-014-3151-9
Helming, K., Römkens, M. J. M., Prasad, S. N., and Sommer, H. (1999). Erosional Development of Small Scale Drainage Networks. Process Model. Landform Evol. 78 (10), 123–145. doi:10.1007/s11629-014-3151-9
Himayoun, D., and Roshni, T. (2020). Geomorphic Changes in the Jhelum River Due to an Extreme Flood Event: a Case Study. Arab J. Geosci. 13 (1), 23–35. doi:10.1007/s12517-019-4896-9
Kumar, B., PatraLakshmi, K. C. V., and Lakshmi, V. (2017). Error in Digital Network and basin Area Delineation Using D8 Method: A Case Study in a Sub-basin of the Ganga. J. Geol. Soc. India 89, 65–70. doi:10.1007/s12594-017-0559-1
Lu, P., Xie, X., Wang, L., and Wu, F. (2017). Effects of Different Spatial Distributions of Physical Soil Crusts on Runoff and Erosion on the Loess Plateau in China. Earth Surf. Process. Landforms 42 (13), 2082–2089. doi:10.1002/esp.4175
Luk, S.-h., Abrahams, A. D., and Parsons, A. J. (1986). Methodology: a Simple Rainfall Simulator and Trickle System for Hydro-Geomorphological Experiments. Phys. Geogr. 7 (4), 344–356. doi:10.1080/02723646.1986.10642303
Milenković, M., Pfeifer, N., and Glira, P. (2015). Applying Terrestrial Laser Scanning for Soil Surface Roughness Assessment. Remote Sensing 7 (2), 2007–2045. doi:10.3390/rs70202007
Modeste, M., Abdellatif, K., Nadia, M., and Mohamed, S. (2017). Effects of Land Use and Cover Type on the Risks of Runoff and Water Erosion: Infiltration Tests in the Ourika Watershed (High Atlas, Morocco). Euro Mediterranean J. Environ. Integration 3 (1), 8–16. doi:10.1007/s41207-017-0046-5
Pant, N., Dubey, R. K., Bhatt, A., Rai, S. P., Semwal, P., and Mishra, S. (2020). Soil Erosion and Flood hazard Zonation Using Morphometric and Morphotectonic Parameters in Upper Alaknanda River basin. Nat. Hazards 103 (3), 3263–3301. doi:10.1007/s11069-020-04129-y
Peñuela, A., Darboux, F., Javaux, M., and Bielders, C. L. (2016). Evolution of Overland Flow Connectivity in Bare Agricultural Plots. Earth Surf. Process. Landforms 41, 1595–1613. doi:10.1002/esp.3938
Sarkar, D., Mondal, P., Sutradhar, S., and Sarkar, P. (2020). Morphometric Analysis Using SRTM-DEM and GIS of Nagar River Basin, Indo-Bangladesh Barind Tract. J. Indian Soc. Remote Sens 48 (4), 597–614. doi:10.1007/s12524-020-01106-7
Shi, Z.-H., Yan, F.-L., Li, L., Li, Z.-X., and Cai, C.-F. (2010). Interrill Erosion from Disturbed and Undisturbed Samples in Relation to Topsoil Aggregate Stability in Red Soils from Subtropical China. Catena 81 (3), 240–248. doi:10.1016/j.catena.2010.04.007
Singh, O., and Singh, J. (2018). Soil Erosion Susceptibility Assessment of the Lower Himachal Himalayan Watershed. J. Geol. Soc. India 92 (2), 157–165. doi:10.1007/s12594-018-0975-x
Sobol, N. V., Gabbasova, I. M., and Komissarov, M. A. (2017). Effect of Rainfall Intensity and Slope Steepness on the Development of Soil Erosion in the Southern Cis-Ural Region (A Model experiment). Eurasian Soil Sc. 50 (9), 1098–1104. doi:10.1134/S106422931709006X
Sofia, G., Di Stefano, C., Ferro, V., and Tarolli, P. (2017). Morphological Similarity of Channels: From Linear Erosional Features (Rill, Gully) to Alpine Rivers. Land Degrad. Develop. 28 (5), 1717–1728. doi:10.1002/ldr.2703
Soil Survey Laboratory Methods Manual (2004). Soil Survey Laboratory Methods Manual. Available from: http://soils.usda.gov/technical/lmm (Accessed May 6, 2020).
Stefano, C. D., Palmeri, V., and Pampalone, V. (2019). An Automatic Approach for Rill Network Extraction to Measure Rill Erosion by Terrestrial and Low-Cost Unmanned Aerial Vehicle Photogrammetry. Hydrol. Process. 33 (13), 1883–1895. doi:10.1002/hyp.13444
Strahler, A. N. (1952). Hypsometric (Area-altitude) Analysis of Erosional Topograohy. Bull. Geol. Soc. Am. 63 (11), 1117–1141. doi:10.1130/0016-7606(1952)63[1117:HAAOET]2.0.CO;2
Tarboton, D. G., Bras, R. L., and Rodriguez-Iturbe, I. (1988). The Fractal Nature of River Networks. Water Resour. Res. 24 (8), 1317–1322. doi:10.1029/WR024i008p01317
Tukura, N. G., Akalu, M. M., Hussein, M., and Befekadu, A. (2021). Morphometric Analysis and Sub-watershed Prioritization of Welmal Watershed, Ganale-Dawa River Basin, Ethiopia: Implications for Sediment Erosion. J. Sediment. Environ. 6, 121–130. doi:10.1007/s43217-020-00039-y
Wilson, B. N. (1993). Small-scale Link Characteristics and Applications to Erosion Modeling. Trans. ASAE 36 (6), 1671–1770. doi:10.13031/2013.28521
Wu, S., and Chen, L. (2020). Modeling Soil Erosion with Evolving Rills on Hillslopes. Water Resour. Res. 56 (10), e2020WR027768. doi:10.1029/2020wr027768
Zhang, L. T., Gao, Z. L., Li, Z. B., and Tian, H. W. (2016). Downslope Runoff and Erosion Response of Typical Engineered Landform to Variable Inflow Rate Patterns from Upslope. Nat. Hazards 80 (2), 775–796. doi:10.1007/s11069-015-1996-z
Zhao, L., Liang, X., and Wu, F. (2014). Soil Surface Roughness Change and its Effect on Runoff and Erosion on the Loess Plateau of China. J. Arid Land 6 (4), 400–409. doi:10.1007/s40333-013-0246-z
Keywords: slope, erosion, runoff pathway, laser scanning, hydrological characteristics, hydrologica
Citation: Zhang L, Liu X, Song Y, Li J, Cai C, Zhao X and Li Z (2021) Characterization of Surface Runoff Pathways and Erosion Using Hydrological Attributes Under Simulated Rainfall. Front. Earth Sci. 9:683473. doi: 10.3389/feart.2021.683473
Received: 22 March 2021; Accepted: 12 July 2021;
Published: 30 July 2021.
Edited by:
Qihua Ran, Zhejiang University, ChinaReviewed by:
Jannes Stolte, Norwegian Institute of Bioeconomy Research (NIBIO), NorwayGuoce Xu, Xi’an University of Technology, China
Copyright © 2021 Zhang, Liu, Song, Li, Cai, Zhao and Li. This is an open-access article distributed under the terms of the Creative Commons Attribution License (CC BY). The use, distribution or reproduction in other forums is permitted, provided the original author(s) and the copyright owner(s) are credited and that the original publication in this journal is cited, in accordance with accepted academic practice. No use, distribution or reproduction is permitted which does not comply with these terms.
*Correspondence: Xiaomin Zhao, zhaoxm889@126.com; Zhaoxia Li, zxli@mail.hzau.edu.cn