A Nested Eight-Channel Transmit Array With Open-Face Concept for Human Brain Imaging at 7 Tesla
 Sydney N. Williams1
  Sarah Allwood-Spiers2† Paul McElhinney1† Gavin Paterson1 Jürgen Herrler3 Patrick Liebig4
  Armin M. Nagel5 John E. Foster2 David A. Porter1
  Shajan Gunamony1,6*
- 1Imaging Centre of Excellence, University of Glasgow, Glasgow, United Kingdom
- 2MRI Physics, NHS Greater Glasgow & Clyde, Glasgow, United Kingdom
- 3Department of Neuroradiology, University Hospital Erlangen, Erlangen, Germany
- 4Siemens Healthineers, Erlangen, Germany
- 5Institute of Radiology, University Hospital Erlangen, Erlangen, Germany
- 6MR CoilTech Limited, Glasgow, United Kingdom
Purpose: Parallel transmit technology for MRI at 7 tesla will significantly benefit from high performance transmit arrays that offer high transmit efficiency and low mutual coupling between the individual array elements. A novel dual-mode transmit array with nested array elements has been developed to support imaging the human brain in both the single-channel (sTx) and parallel-transmit (pTx) excitation modes of a 7 tesla MRI scanner. In this work, the design, implementation, validation, specific absorption rate (SAR) management, and performance of the head coil is presented.
Methods: The transmit array consisted of a nested arrangement to improve decoupling between the second-neighboring elements. Two large cut-outs were introduced in the RF shield for an open-face design to reduce claustrophobia and to allow patient monitoring. A hardware interface allows the coil to be used in both the sTx and pTx modes. SAR monitoring is done with virtual observation points (VOP) derived from human body models. The transmit efficiency and coverage is compared with the commercial single-channel and parallel-transmit head coils.
Results: Decoupling inductors between the second-neighboring coil elements reduced the coupling to less than −20 dB. Local SAR estimates from the electromagnetic (EM) simulations were always less than the EM-based VOPs, which in turn were always less than scanner predictions and measurements for static and dynamic pTx waveforms. In sTx mode, we demonstrate improved coverage of the brain compared to the commercial sTx coil. The transmit efficiency is within 10% of the commercial pTx coil despite the two large cut-outs in the RF shield. In pTx mode, improved signal homogeneity was shown when the Universal Pulse was used for acquisition in vivo.
Conclusion: A novel head coil which includes a nested eight-channel transmit array has been presented. The large cut-outs improve patient monitoring and reduce claustrophobia. For pTx mode, the EM simulation and VOP-based SAR management provided greater flexibility to apply pTx methods without the limitations of SAR constraints. For scanning in vivo, the coil was shown to provide an improved coverage in sTx mode compared to a standard commercial head coil.
Introduction
MRI at 7 tesla (7T) has the potential to improve diagnostic imaging due to the clinical capabilities in high resolution anatomical as well as functional and metabolic imaging [1]. This has provided motivation for integrating MRI at 7T into clinical workflows and initial regulatory approval [2, 3] has now been granted for brain and knee imaging using single-transmit (sTx) radiofrequency (RF) coils.
The benefits of 7T brain MRI are offset by an inhomogeneous transmit field which causes signal loss in the posterior and temporal fossae, and in the skull base. A transmit array coil together with parallel transmit (pTx) methods is essential to mitigate the image heterogeneity caused by the shorter wavelength in brain tissue [4, 5]. PTx technology will significantly benefit from the performance of the transmit array coil if the coil design offers high transmit efficiency as well as low mutual coupling between the array elements. Several transmit array designs and array decoupling methods can be found in the literature. The fundamental transmit element is designed using conventional loops [6–12], microstrip transmission lines [13–15], dipoles [16–19] or a combination of loops and dipoles [20–22]. The coupling between the adjacent elements is minimized using various decoupling methods such as geometric overlap [23], counter-wound inductors [9], resonant inductive decoupling (RID) [24], capacitors [8, 13, 14] in the gap between adjacent elements, self-decoupled coils [25] and by shielding [26]. These coil arrays are built as close-fitting transceiver arrays (TxRx) or as transmit-only receive-only arrays (ToRo), in which a large transmit array and a tight receive array is used in combination to achieve high signal-to-noise-ratio (SNR) [27, 28].
Conventional loop-based transmit arrays are well suited for high power applications because the voltage is distributed along the loop capacitors, and their tuning is less subject-dependent compared to other RF coil designs. In a ToRo head coil, the transmit array is typically built on 280–300 mm diameter cylinders to allow sufficient space for the receive array and a rear-projection mirror system for fMRI studies. Hence the size of the overlapped individual loops in an eight-channel transmit array is large enough to cause substantial coupling between the second-neighbouring elements. This results in split resonance, increased reflected power due to mismatch and coupling, and loss in transmit efficiency.
While gapped designs can reduce the coupling between the second-neighbouring elements, they also reduce the sample loading due to the smaller element size. The commonly used preamplifier decoupling technique is not applicable for transmit arrays. Chen et al. [29] have proposed triangular shaped transmit elements as a way to bring the next-neighbouring elements closer to install a decoupling inductor. We have developed a novel eight-channel transmit array in which the adjacent elements are overlapped to maintain sample loading, and the second-neighbouring elements are nested to implement decoupling inductors and minimise coupling. Although loop arrays have been extensively investigated [6–12], a nested transmit array for MRI of the brain at 7T has not been presented to the best of our knowledge. The nested-loop transmit array is combined with a 32-channel receive array and configured for use in both sTx and pTx-modes of a 7T scanner.
Self-built RF coils can improve transmit field (B1+) homogeneity at ultra-high fields (UHF) while allowing full access to the electromagnetic (EM) model of the coil. A wide range of UHF applications will benefit from efficient specific absorption rate (SAR) management by enabling the use of realistic virtual observation points (VOP) [30] derived from human body models. For pTx in particular, SAR can be produced in localized tissue regions by superimposed RF fields so requires accurate prediction and control. We provide extensive details of the checks we conducted for time-resolved SAR monitoring using offline calculations and experimental measurements in a phantom and in vivo.
In this article, we present the design, evaluation, and SAR management of our custom-built dual-mode head coil as well as a comparison with both sTx and pTx commercial head coils.
Methods and Materials
All MR measurements were performed on a MAGNETOM Terra 7T whole body scanner (Siemens Healthcare GmbH, Erlangen Germany), fitted with a whole body gradient (amplitude 80 mT/m, slew rate 200 T/m/s). The scanner is equipped with 32 receive channels and eight transmit channels and operates in two acquisition modes, supporting sTx and pTx operation, respectively. The commercial single- and parallel-transmit head coils (1Tx32Rx and 8Tx32Rx, Nova Medical Inc., MA, United States) were used as the reference coil in the comparison studies.
We imaged healthy volunteers who had signed a written consent form approved by a delegated ethics committee with a remit from the West of Scotland Research Ethics Committee and NHS Greater Glasgow and Clyde (NHS-GGC) Research and Development Department.
Transmit Array Design
Single Transmit Element
For a transmit coil housing with inner diameter 280 mm, the width of the individual loop in the transverse plane will be about 140 mm if two adjacent elements are critically overlapped to reduce mutual coupling. The width of the loop will be about 100 mm for a gapped design with 10 mm between two adjacent loops.
Two test loops were built on a rapid prototyped fiberglass tube (inner diameter: 280 mm; wall thickness: 3 mm; length: 355 mm; manufacturer: Klaus Hoppe Werbetechnik, Ofterdingen, Germany) and the Q-ratio was measured in different positions around the cylinder. The length of the loop along the head/foot direction was chosen to be 210 mm to achieve whole brain excitation. Solder pads to assemble the capacitors were manufactured using flexible circuit board material (PW Circuits, Wigston, United Kingdom) and the pads were attached on to the surface of the tube using double sided tape (3M, Bracknell, United Kingdom).
The loop position and the corresponding coil Q-factors are shown in Figure 1. The Q-factor was measured by placing the single loop inside a local RF shield at a distance of 24 mm from the loop, which was then positioned inside a dummy shield mimicking the scanner bore. The larger loop provided higher sample loading across different positions, and the overlapped configuration was chosen over gapped design.
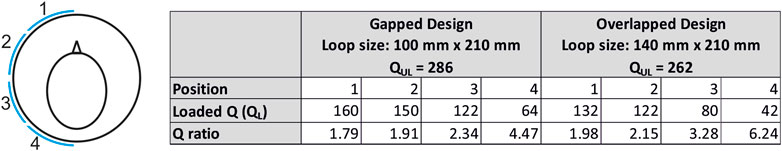
FIGURE 1. Coil Q-ratio measurements demonstrate higher sample loading for the larger loop. The larger loop has the dimensions of a single-transmit element in an overlapped 8-channel transmit array.
8-Channel Nested-Loop Transmit Array
The array consisted of eight overlapped loops arranged in a single row. The loop was built using 2 mm diameter silver plated copper wire (APX, Sarrians, France). A total of 13 fixed capacitors (6.8 pF; 100°C series; American Technical Ceramics, NY, United States) and one variable capacitor (5,610; 1–7.5 pF; Johanson Manufacturing Corporation, NJ, United States) were distributed in each loop. To reduce radiation loss [31], a local RF shield was concentrically placed. A double-sided flexible PCB with 9 µm copper was used to form the RF shield. To reduce gradient induced eddy currents, each layer was slotted and the copper in the second layer was offset from the first to form a continuous RF shield at high frequency [32]. The RF shield PCB was attached to the inner surface of a fiberglass tube (Outer diameter: 340 mm; wall thickness: 2 mm; length: 355 mm) using double sided tape. The distance to the RF shield was 24 mm in this design based on the standard sized tube that was available to us. However, there is scope for further improvement in transmit performance by optimizing the distance to the RF shield [6].
The equivalent circuit of a single element is shown in Figure 2A. A PIN diode (D1, MA4P7446-1091T, MACOM, United States) was installed in series with the loop and a series LC circuit (C16, L3) was connected across the PIN diode and adjusted to maximize the isolation when the diode is turned OFF. A shielded cable trap tuned to 297.2 MHz was soldered across the input matching circuit.
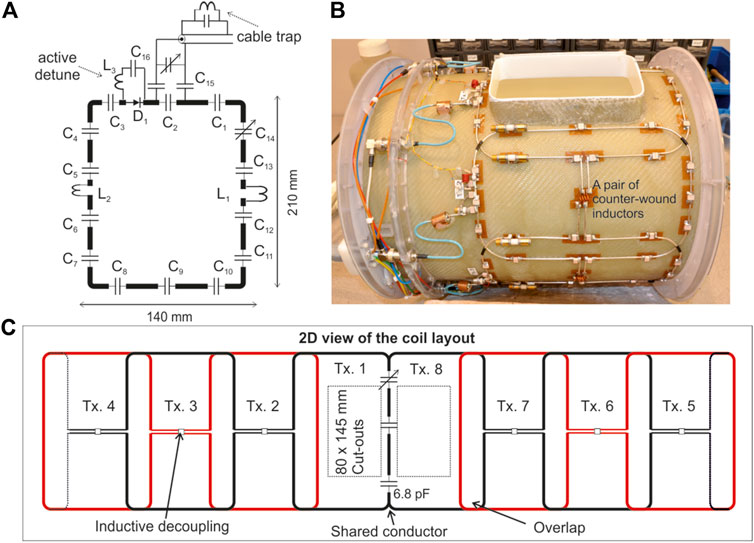
FIGURE 2. (A) Equivalent circuit of a single element of the transmit array consisting of 13 × 6.8 pF fixed capacitors (C1 to C13) and a trimmer capacitor C14 to fine-tune the coil resonance frequency to 297.2 MHz. (B) Picture of the completed transmit array. (C) A two dimensional view of the transmit array configuration. The capacitor distribution in the shared conductor is also provided.
Due to the large size of the individual loops, the coupling between the second-neighbouring elements is strong enough to cause split resonance and deteriorate the performance of the transmit array. Furthermore, the reflected power from a coupled transmit array depends on the amplitude and phase of the RF excitation signal, making it challenging to employ such an array in parallel transmit applications [33]. Hence, it is necessary in this case to implement a decoupling mechanism between the first and the third transmit element in addition to decoupling the adjacent elements. The second-neighbouring elements are nested as shown in Figure 2B and a pair of inductors wound in opposite directions [9] was installed to minimize the mutual coupling between them.
Open-Face Design
The top ranked criteria in the wish list of our clinical collaborators is an open-face coil to reduce claustrophobia and to allow monitoring of the patient. To satisfy this requirement, two large cut-outs in the RF shield and the fiberglass tubes were introduced in front of the eyes, each measuring 80 mm × 145 mm. To minimize the coil structure and allow a larger cut-out, the overlap in front of the nose was replaced by a shared conductor [29, 34]. There were two fixed capacitors (6.8 pF, ATC 100°C series) and one variable capacitor (5,610; 1–7.5 pF; Johanson Manufacturing Corporation, NJ, United States) evenly distributed along the shared conductor between transmit elements 1 and 8. The variable capacitor was adjusted to minimize the coupling between the coil elements 1 and 8. Finally, the cut-outs were closed off using a fiberglass part for ingress protection.
A 2D layout of the final transmit array configuration is shown in Figure 2C. Also note in Figure 2C that there is no inductive decoupling across the second-neighbouring coil pairs (1 and 7; 2 and 8) to maintain a clear open structure. This would allow a ‘look-out’ mirror, which is commonly used in 1.5T/3T clinical head coils, to be fixed outside the transmit array for the subject to see the operator during the scan and reduce claustrophobic effect.
Receive Array Design
To increase the SNR, the transmit array was combined with a 32-channel receive array. The receive array design is a retuned version of the design previously presented for a 9.4T receive array [9, 11]. Briefly, the receive array consisted of 32 elements arranged in four rows. The first three rows form a complete ring around the helmet and the fourth row formed a partial ring with only four receive elements. More details about the receive array layout and circuit schematic can be found in [9]. The final setup consisting of the transmit and receive array, with the view of the open-face approach as seen by the subject being scanned, is shown in Figure 3A.
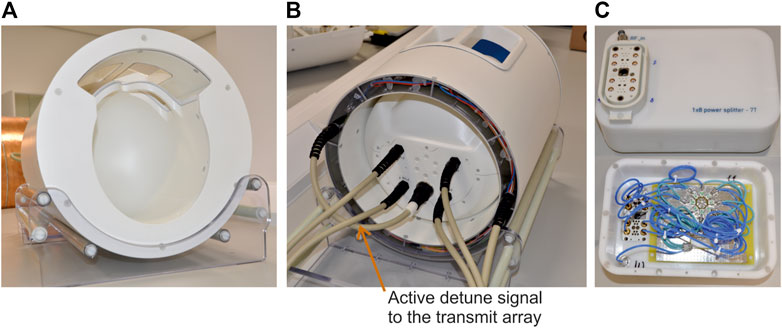
FIGURE 3. (A) The completed coil assembly. (B) View of the coil from the service-end. (C) The custom-built 1x8 power splitter with built-in CP mode phase offsets.
Interface to Single-Transmit Mode
Until CE and FDA approval for clinical use of pTx is received, MRI at 7T will continue to be performed in a hybrid environment using scanners which support imaging in sTx mode for clinical diagnosis and pTx mode for research and clinical validation. Our coil was configured to be interfaced to both pTx and sTx modes so that a single device can be used in both the scanner modes.
The scanner provides eight PIN bias lines in each 8-channel receive socket and eight more in the pTx socket to control the active detuning of the receive and transmit elements, respectively. The PIN bias lines in the pTx socket was not used as this cannot be activated when the scanner is in sTx mode. Instead, eight PIN bias lines from the receive sockets were routed to the transmit array through a multi-pin non-magnetic connector (Amphenol Alden, Chicago, IL. United States). This can be seen in the service-end view shown in Figure 3B. The remaining 24 PIN bias lines were shared to control the switching of the 32-channel receive array.
A 1x8 power splitter was custom built [35] and fitted with the same 8-channel high power socket (ODU GmbH, Germany) as in the scanner. To achieve a circularly polarized (CP) mode excitation, an incremental phase offset of 45° was realized by increasing the length of the coaxial cable and implemented inside the splitter housing. The total loss introduced by the splitter and the additional short connecting cable from the patient table to the splitter input was 0.8 dB. A picture of the custom-built power splitter and an internal view showing the different cable lengths can be seen in Figure 3C.
The transmit array cable is connected directly to the pTx socket in the patient table just like any conventional pTx coil. In sTx mode, the RF power amplifier output is connected to the input of the splitter and the transmit array cable is connected to the output of the splitter.
Bench Measurements
The S-parameters of the transmit and receive arrays were measured by loading the coil with a fiberglass head-and-shoulder phantom filled with tissue equivalent solution (
Transmit Array Simulation
A co-simulation approach consisting of RF circuit simulation and 3D electromagnetic (EM) simulation (CST Studio Suite, Dassault Systems, France) was used to simulate the transmit array [37, 38]. Each lumped element included series resistance values obtained from the component datasheet. The local RF shield, fiberglass tubes as well as the scanner bore were also included in the model. The RF shield and coil conductors were both made from annealed copper with the following properties: σ = 5.80 × 10⁷, ρ = 8.93 × 10³ kg/m. The fiberglass is standard FR-4 from the CST database: ε = 4.3, μ = 1, electrical tand. = 0.025. However, we did not include the coaxial cables, cable traps and DC wiring in the numerical model. The variable capacitors, matching circuit and decoupling inductors were represented as ports resulting in a total of 29 ports in the 3D EM simulation. There are eight excitation ports in circuit co-simulation and each one was connected to the matching network via a 0.6 dB attenuator to represent the cable loss from the coil feed-point to the coil plug.
The transmit array elements were tuned to 297.2 MHz and matched to a 50 Ω port in circuit co-simulation whereas the electric and magnetic field components as well as the SAR maps were calculated in the 3D EM domain [37, 38]. A voxel model of the head-and-shoulder phantom with 1 mm isotropic resolution was imported from a CT scan. The coil was first tuned and matched to the phantom and then loaded with Duke and Ella models from the Virtual Family cohort [39] and Gustav from CST, truncated at the level of the chest. For each model, the EM field and SAR were estimated for three different positions in Z (0, −10 and −20 mm) to mimic the different possible subject positions during scans in vivo.
A typical mesh consisted of about 40 million cells. The frequency sweep was set from 280 to 320 MHz and a convergence criteria of −40 dB was set to obtain the RF field distribution for each discrete port. On a dual Intel Xenon workstation with 256 GB RAM and GPU acceleration using Nvidia Tesla K80, each body model simulation took approximately 1 h per 3D port, for a total simulation time of just over a day.
Virtual Observation Point Generation for Local Specific Absorption Rate Monitoring
Accuracy and control of SAR monitoring is critical for in-house UHF pTx coils [40]. The scanner used in this study uses VOPs [30] as part of its standard framework for local SAR prediction and real-time monitoring during pTx operation.
For each body model and coil position, the electromagnetic field
Once the MATLAB Q-matrix SAR was corroborated with CST for each body model, they were concatenated into one large Q-matrix array. The combined Q-matrix array was compressed into a set of VOPs following the method from Eichfelder and Gebhardt [30]. In an initial study [42], the effect of various overestimation factors for VOP compression on local SAR measurment online by the system was compared. In this work, time-resolved instantaneous local SAR calculations for various overestimation factors is compared with respect to the full Q-matrix array values. Ultimately, a 25% overestimation factor yielded was found to be a good compromise between local SAR and RF performance. As per the equipment manufacturer’s recommendation, the VOPs were also adjusted to account for an RF supervision system error tolerance of 12% in amplitude and 5° in phase with the following calculation,
where
After generating the final, modified VOPs, they were validated by comparing local SAR estimates calculated offline and by the scanner for three B1+ shim configurations with known input power: CP (45° increments), CP2+ (90° increments), and the worst case mode which is the Eigenvector associated with
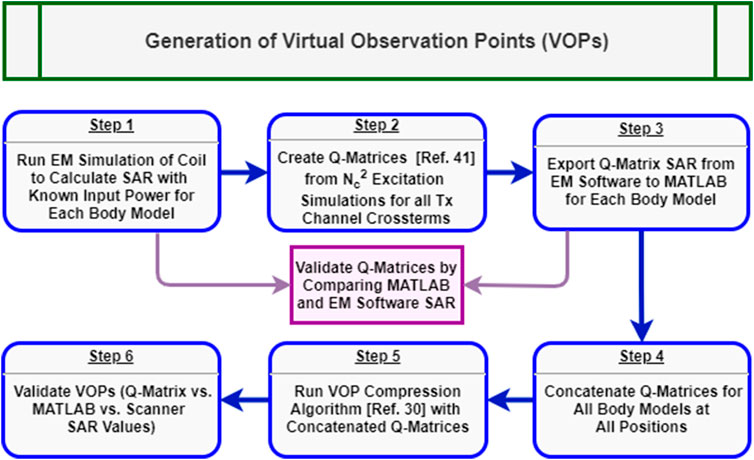
FIGURE 4. Generalized workflow for generation and validation of the virtual observation points for local SAR monitoring in pTx. Blue boxes represent chronological steps within the procedure while, purple boxes show feedback steps for additional EM simulations.
Coil Performance Evaluation
B1+ Map Simulation and Measurement Comparison
The transmit performance was evaluated by collecting B1+ maps with a pre-saturated Turbo-FLASH sequence [43]. For both sTx and pTx operation, a B1+ map combining all transmit elements was collected in CP configuration using the following parameters: number of slices 45, slice thickness 3 mm, slice gap 0.9 mm, flip angle (FA) 5°, TE 1.55 ms, TR 11010 ms, acquisition time (TA) 23 s, FOV 300 × 300 mm2, and matrix size (MAT) 256 × 256. Results were then compared to the EM simulation qualitatively and quantitatively by comparing the peak B1+ field value. In pTx mode, phase-sensitive, single channel B1+ maps were also acquired for each transmit channel using the same scan parameters and a total measurement time of 111 s. These maps were simulated and measured in our custom-built head-and-shoulder phantom. To obtain relative phase maps between channels from the measured phase maps, a reference channel was used to remove additional residual phase components. These complex single channel B1+ maps were then compared qualitatively to the simulated single channel maps from the EM model.
Comparison of Self-Built Parallel-Transmit Coil and Commercial Parallel-Transmit Coil
The transmit performance of the self-built parallel-transmit array was also compared to the commercial 8Tx/32Rx coil (Nova Medical, Wilmington, MA, United States). The commercial pTx coil is not available at the Imaging Centre of Excellence at the University of Glasgow, so a second head-only phantom filled with tissue equivalent solution (εr = 51.1, σ = 0.38 S/m) was prepared. This phantom was scanned with the self-built coil in pTx mode as well as with the commercial pTx coil in another site using the pre-saturated TurboFLASH B1+ mapping sequence with a fixed combined voltage of 165 V (no. slices/slice thickness/slice gap/FA/TE/TR/TA/FOV/MAT = 45/4 mm/0.8 mm/10°/1.48 ms/30000 ms/61 s/240 × 240 mm2/96 × 96). For each coil experiment, the FA maps generated from the B1+ mapping sequences were compared with both sagittal and axial slices for their transmit efficiency and flip angle homogeneity.
Measurement of Dynamic Parallel-Transmit Waveforms
A final validation step for our pTx coil was to verify the accuracy of the scanner’s SAR estimation for time-varying RF waveforms. Four external pTx waveforms were used for this study: a conventional Shinnar-LeRoux (SLR) [44] slice-selective pulse in CP configuration with a nominal flip angle of 90°, the same SLR pulse with transmit channels 4-6 turned off, a 3D hard rectangular pulse with a nominal flip angle of 5°, and a 5° 3D Universal Pulse (UP) [45] designed with a 3D SPINS trajectory [46] using the method described in [47]. The slice-selective SLR pulses were both played out three times in a 2D FLASH sequence with a single 5 mm slice, FOV = 240 × 240 mm2, MAT = 256 × 256, TE = 10 ms, and 3 TRs: 50, 100, and 250 ms. The 3D hard pulse and UP were both played out in a 3D GRE sequence with TE/TR/TA/FOV/MAT = 2.28 ms/1,010 ms/101 s/250 × 220 × 160 mm3/250 × 220 × 160.
For all scans, the external RF waveforms were recorded during data measurement via the directional couplers (DICOs) of the pTx system. These measurements were compared offline to the prescribed waveforms to validate the fidelity of the dynamic pTx system. Furthermore, the time-integrated local SAR was calculated and compared to the scanner predicted and measured values. The time-varying local SAR for
where
Anatomical Imaging in Single-Transmit and Parallel-Transmit Modes
After completing additional temperature mapping and simulation studies [48, 49], the coil was granted local ethics and safety approval for imaging studies of healthy subjects in pTx and sTx modes for operation in normal IEC-SAR mode in the head using local transmit coils (10 W/kg). In the first study, the longitudinal coverage of the coil was compared to the commercially available 1Tx/32Rx coil (Nova Medical, Wilmington, MA, United States). A healthy volunteer was scanned with the commercial coil and the self-built dual-mode coil in sTx operation. The same volunteer was then also scanned with the self-built coil in pTx mode using B1+ shimming. The three-way comparison was performed with a sagitally-oriented T2-weighted 2D RARE sequence with the following parameters: no. slices/slice thickness/slice gap/FA/TE/TR/Echo Train Length/TA/FOV/MAT = 39/3 mm/3.9 mm/140°/58 ms/9,000 ms/9/198 s/172 × 230 mm2/768 × 1,024. When scanning in pTx mode, the vendor provided B1+ shimming routine was set over a volume covering the brain parenchyma.
The second in vivo experiment examined the performance of the self-built coil using dynamic pTx waveforms. Here, two 3D MPRAGE sequences were compared in pTx mode with the same healthy volunteer. The first acquisition used a CP hard pulse for excitation and the second used the Universal Pulse described previously in Measurement of Dynamic Parallel-Transmit Waveforms above. Both scans used the same vendor provided, CP mode adiabatic inversion pulse with a combined total voltage of 350 V. The remaining sequence parameters were FA/TE/TI/TR/TA/FOV/MAT = 5°/2.28 ms/1,100 ms/3,000 ms/294 s/250 × 220 × 160 mm3/250 × 220 × 160.
Results
S-Parameters
Figure 5A demonstrates the coupling between second-neighbouring elements in transmit arrays consisting of large loops. The coupling between the second-neighbouring transmit elements was more than -6 dB. During this measurement, all other loops were terminated with 50 ohms. The S11 plots also demonstrates the split resonance caused by the high mutual coupling. A picture of the 8-channel transmit array with overlapped loops constructed for these measurements is shown in Figure 5B.
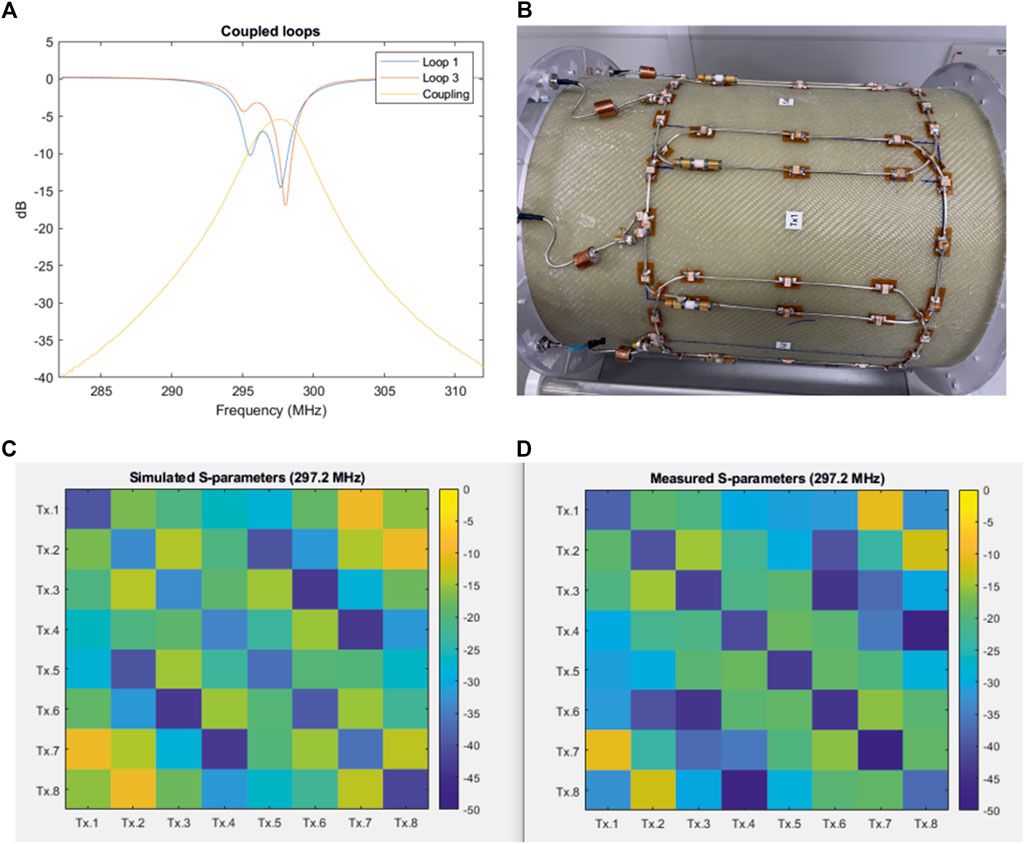
FIGURE 5. (A) S-parameter plots of transmission and reflection demonstrating high coupling and split-resonance between second-neighbouring transmit elements in a coil without decoupling inductors. (B) Picture of the 8-channel loop array (140 m × 210 mm loops) with decoupled adjacent elements, but no decoupling between second neighbouring elements. (C,D) Simulated (C) and measured (D) S-parameter matrix of the 8-channel transmit array, respectively.
The simulated and measured S-parameter matrices of the 8-channel transmit array are shown in Figures 5C,D. The measurements were performed in the presence of the actively detuned receive array, and the coil was loaded with the head-and-shoulders phantom. All channels were matched to better than −30 dB in both simulation and measurement. The average coupling between the adjacent elements in the constructed array was −19.8 dB. Nesting the second-neighbouring elements using inductors reduced the average coupling to −20.2 dB. The adjacent and second-neighbouring element coupling in the simulated model was −17.97 dB and −19.67 dB, respectively.
The measured coupling between the two pairs of second-neighbouring elements (1&7 and 2&8) across which there are no counter-wound inductors was −11 dB. The corresponding value from the simulated model was −9.83 dB. It is important to note that the size of loops 1 and 8 are reduced because the overlap between element 1 and 8 was replaced by a shared conductor. This helped to minimize the mutual coupling and maintain an acceptable decoupling. Although this will slightly reduce the overall performance of the transmit array, an open-face design with a large visual field to reduce claustrophobia was an important consideration in our design approach.
In Figure 6, the measured S-parameter plots of the tune and match, adjacent element, and second-neighbouring element coupling of the constructed transmit array with and without the receive array are shown. The ‘m’ shaped S21 curve is between the transmit elements 1 and 8 which are decoupled by the shared conductor. Only the tune and match of the transmit array was adjusted after the receive array was inserted. The decoupling inductors and the overlaps were not adjusted. The plots shown in Figure 6 demonstrate that the transmit array coupling charecteristics are not influenced by the presence of the 32-channel receive array.
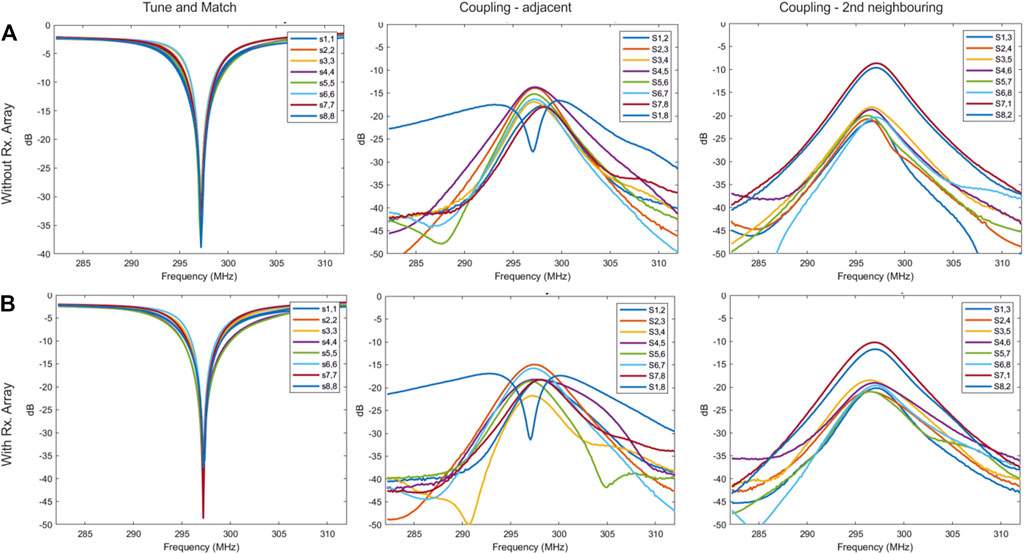
FIGURE 6. (A,B) Measured S-parameter plots of the reflection, adjacent element and next-neighbouring element coupling of the constructed transmit array without the receive array (A) and with the receive array (B).
Comparison of Transmit Array Simulation and Measurements
Figure 7 compares the simulated and experimental B1+ maps in the head-and-shoulders phantom. Figures 7A,B show the sagittal cross section of the combined CP mode magnitude maps. The peak B1+ in the center of the phantom was 111 nT/V in simulation and 107 nT/V in measurement, with the voltage referenced to the coil input. Furthermore, B1+ maps were acquired with and without the receive array to quantify the influence of the receive array. The attenuation in the B1+ field due to the presence of the receive array was 7%. Figures 7C–F show the simulated and experimental B1+ maps for the individual transmit channels, both magnitude and phase. The spatial distributions between simulation and their measurement match well for each individual channel, although some small phase differences do exist.
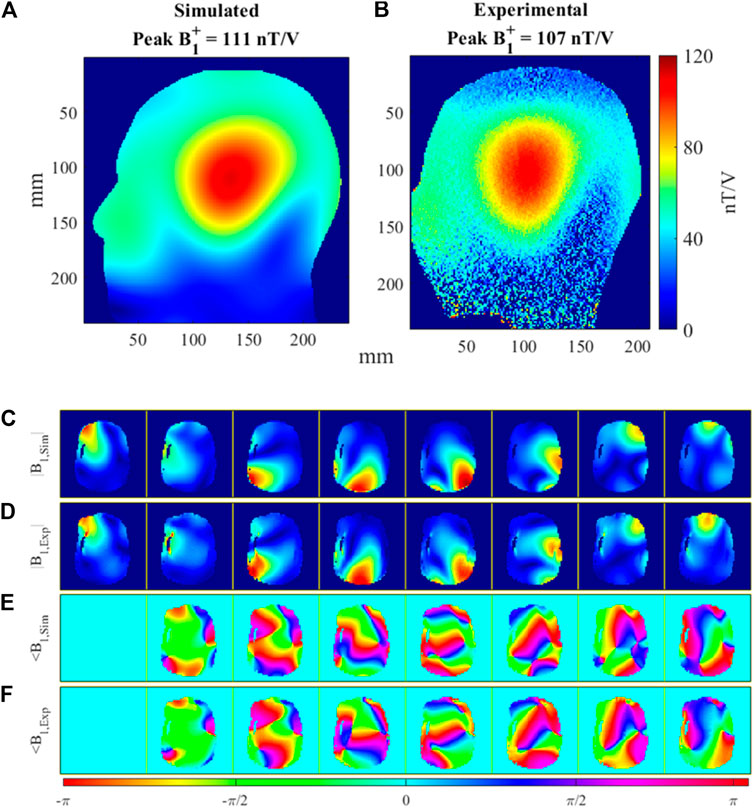
FIGURE 7. Comparison of simulated and measured B1+ maps in the head-and-shoulders phantom. (A) Simulated, sTx (CP mode) B1+ map of Tx array and (B) matching experimental sTx B1+ map. (C) Simulated, normalized |B1+ | field magnitude and (D) matching experimental, normalized |B1+| magnitude for all 8 Tx channels. (E) Simulated ∠B1+ field phase and (F) matching experimental ∠B1+ phase for all 8 Tx channels.
Virtual Observation Point Model Validation
Figure 8A shows the SAR simulations in the three human body models used for EM simulation (Duke, Ella, and Gustav) in CP configuration. For each model, their 10 g SAR is reported with 1W input power at the three simulated coil positions. All SAR simulations are scaled to the same windowing level for comparison. Figure 8B reports the local SAR for the combined SAR coil model (all three human body models, all three positions). The local SAR is compared for CP mode, CP2+ mode, and the worst case excitation vector. The values are listed for the full, combined EM simulation Q-matrices, the compressed VOPs, and the scanner prediction and measurements. The table validates the VOP models because the Q-matrix SAR is always less than the VOP compression estimate, which in return is always less than the scanner predictions and measurements.

FIGURE 8. (A) 3D CST simulations of 10 g-SAR with 1W of input power for Duke, Ella, and Gustav body models all positioned at the B0 field isocenter with the same color scaling on each model. The max SAR value for each model for all three positions (z = 0, −10, and −20 mm) is listed in the left hand corner for each body model. (B) Comparison of local SAR values for concatenated body model Q-matrices, VOP compressions calculated offline, and values reported by scanner during predicition and measurement.
Dynamic Parallel-Transmit Waveform Measurement and Local Specific Absorption Rate Calculations
Figure 9 demonstrates instantaneous local SAR calculations (Eq. 2) for the 5° 3D SPINS Universal Pulse with duration of 1 ms and explores how various VOP overestimation factors affect the local SAR estimates. Figure 9A plots the RF pulse magnitude waveforms for the eight transmit channels. Figure 9B plots the absolute instantaneous SAR of the single pulse in an MPRAGE acquisition with TR = 3,000 ms for the uncompressed Q-matrices (for visualization purposes, the Q-matrices are downsampled here). At various time points with distinct amplitude and phase configurations, different Q-matrix voxel locations deposit more local SAR. Figure 9C compares the normalized maximum local SAR at each time point of the UP excitation for the Q-matrices and various VOP compressions: 5, 10, 25, and 50% worst case SAR overestimation. As anticipated, the difference between max instantaneous SAR using the Q-matrices and the VOP compressions increases with overestimation factor. Higher factors also leads to smoother instantaneous SAR plots due to fewer VOPs and less possible SAR variation. In practice, the dual-mode coil uses a 25% overestimation of worst case SAR. This overestimation factor was chosen empirically to provide a conservative local SAR estimate without compromising overall RF performance drastically.
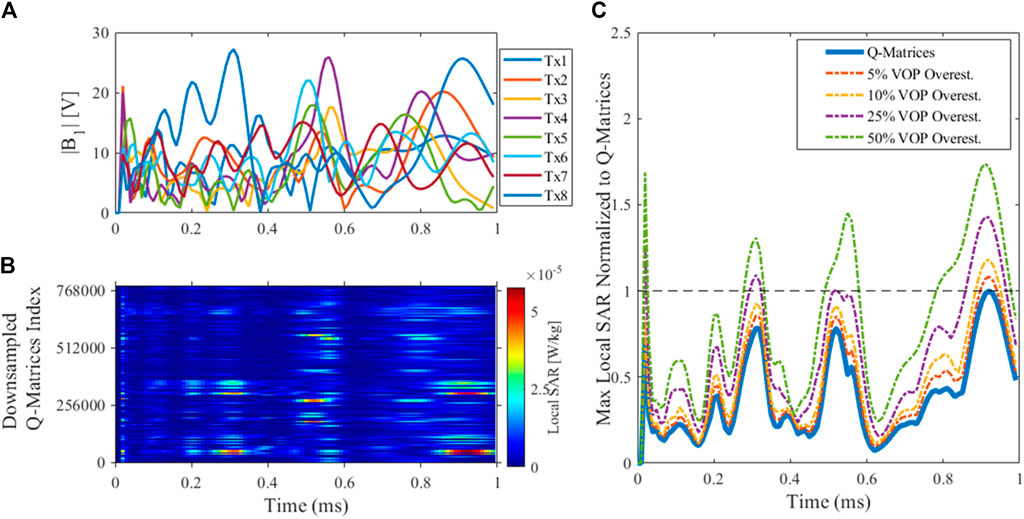
FIGURE 9. Local SAR for a 5° excitation Universal Pulse. (A) UP magnitude waveform; (B) Instantaneous SAR for the UP excitation in MPRAGE using downsampled uncompressed Q-matrices; (C) Max local SAR for each time point of the UP for the Q-matrices and VOPs with 5, 10, 25, and 50% overestimation, all normalized to the maximum of the Q-matrices’ SAR. Different time points of the UP (i.e., different amplitude and phase configurations) lead to varying levels of VOP overestimation relative to the Q-matrices, but importantly the VOP-derived estimate is always overestimated.
Figure 10 plots test pTx waveforms and their complex-valued DICO measurements. Subplots 10A show the magnitude waveforms for forward and reflected measurements using the 2D SLR pTx pulse played in CP mode. Subplots 10B show the forward magnitude and phase waveforms for the 5° 3D SPINS Universal Pulse (for visualization simplicity, only 3 out of 8 channels are plotted here).
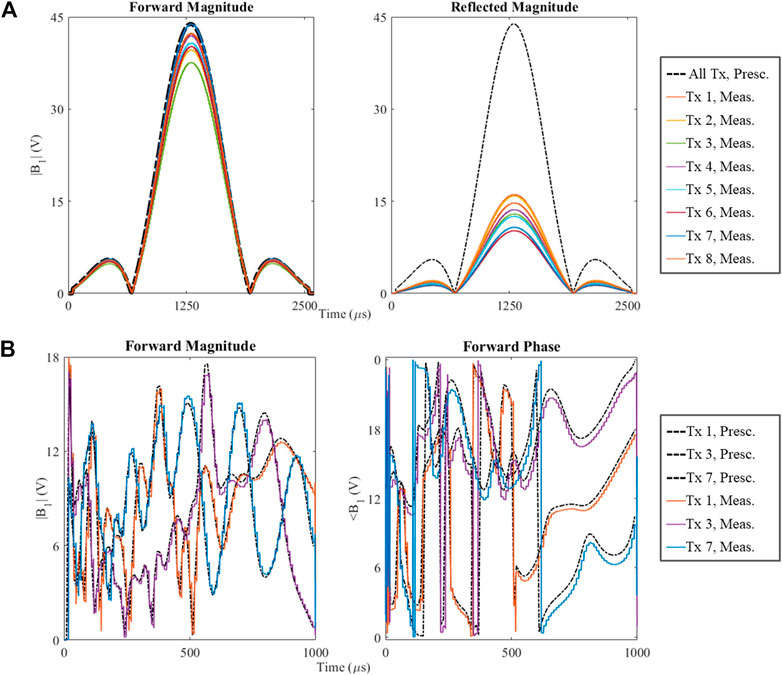
FIGURE 10. Comparison of prescribed RF waveforms (black, dotted lines) and their measurements single transmit channels (solid, colored lines). (A) A conventional, circularly polarized, slice-selective SLR pulse with nominal flip angle of 90°, the left plot contains the forward measurement and the right plot contains the reflected measurement; (B) Dynamic, non-selective Universal Pulse pulse with nominal flip angle of 5°, the left plot shows the RF magnitude waveforms and the right plot shows RF phase waveforms for 3 out of 8 pTx channels.
Table 1 compares the local SAR calculations (Eq. 3) for the four test 2D and 3D pTx pulses and a few different sequence TRs. The fourth column from the left shows the local SAR calculations without considering additional experimental factors. Column 5 shows these calculations including the cable loss between the RF power amplifier (RFPA) and the coil plug of the system, a fixed, measurable value roughly equal to 1.7 dB. Column 6 shows the final, true local SAR calculations that includes cable loss and the gain variation of the RFPA, a value measured for each channel that is calibrated with each new scan session. These final SAR calculations are in excellent agreement with the scanner predicted and measured values for all test pTx pulses and all TRs.
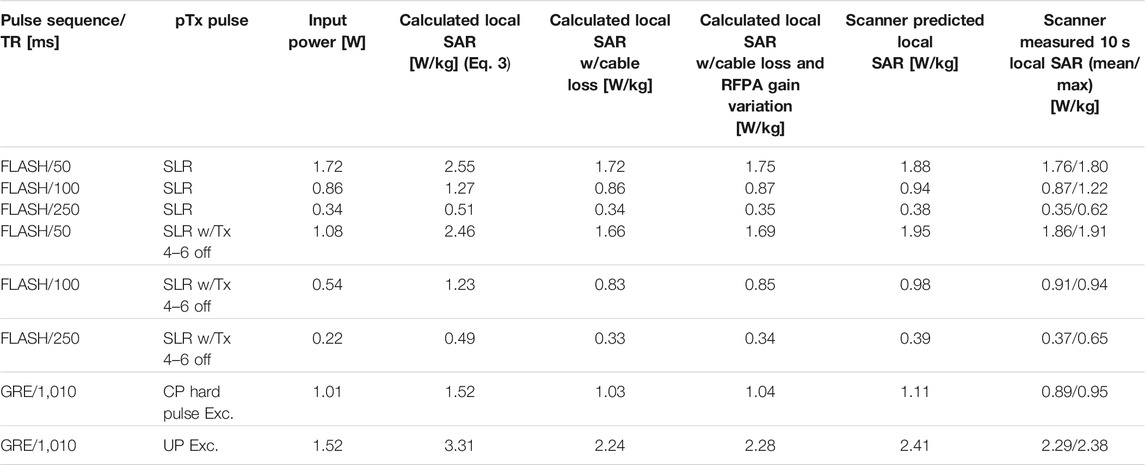
TABLE 1. Time-averaged input power (W) and SAR values (W/kg) for 4 pTx pulses: SLR, SLR w/Tx 4-6 off, CP hard excitation, and UP Excitation. For calculation and experimental measurements, each pTx pulse is associated with a specific sequence and TR. Column 4 values are from Eq. 3 using the external pulses in volts and the electromagnetic field simulation VOPs. Column 5 values add the cable loss from the RF power amplifier (RFPA) to the coil plug, measured to be 1.7 dB. Column 6 values are the true local SAR calculations with cable loss and RFPA gain variation included. The values in column 6 are in good agreement with the scanner predicted local SAR and measured local SAR in the final two columns.
Phantom Comparison of Commercial and Self-Built Parallel-Transmit Coil
Figure 11 compares the phantom flip angle maps collected with the self-built, dual-mode parallel transmit coil and the commercially available parallel-transmit coil using the same applied 165 V. For both coils, sagittal and axial images are shown to visualize the longitudinal coverage and the FA right-left symmetry. Qualitatively, the self-built coil has similar transmit behavior to the commercial coil. Quantitatively, the maximum, mean, and standard deviation of flip angle are reported for the center slice of each acquisition orientation. The self-built coil has a decrease in peak FA and has about the same FA standard deviation despite the lower mean. These discrepancies can be attributed to the effects of the eye cut-outs not present in the commercial coil shield.
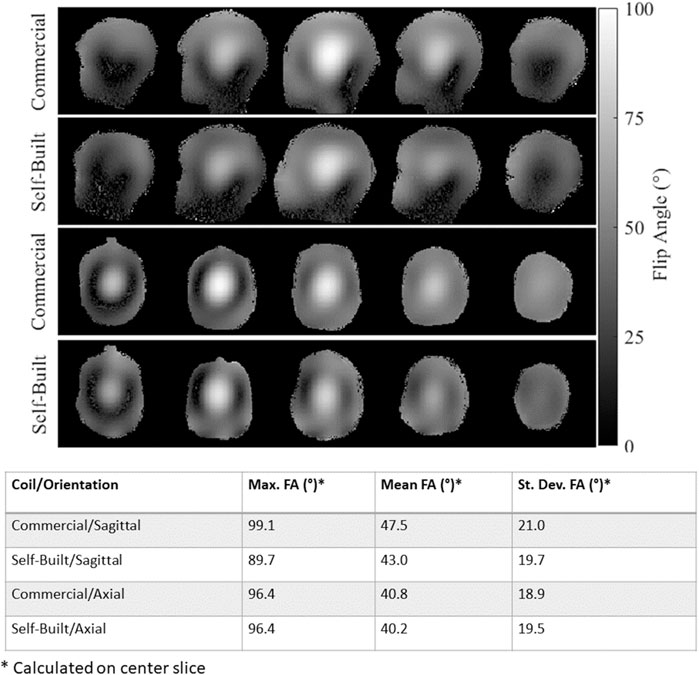
FIGURE 11. Comparison of measured flip angle maps with the commercially-available pTx coil and the dual-mode self-built coil operating in pTx mode with an applied voltage of 165 V. The top two rows show sagittal images and the bottom two rows show axial images. For all flip angle maps, the max, mean, and standard deviation of flip angle in the center slice is reported in the bottom table.
Healthy Volunteer Experiments
Figure 12 displays the T2w RARE images collected in a healthy subject using the commercial single-transmit coil and the dual-mode parallel-transmit coil operating in both sTx and pTx modes. The self-built coil has better longitudinal coverage in the inferior regions of the brain for both modes compared to the commercial sTx coil. In pTx mode, the self-built coil applied B1+ shimming, which led to improved image signal in the inferior slices of the brain.
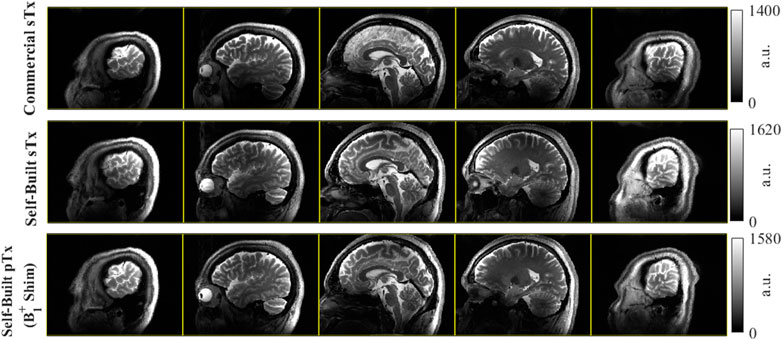
FIGURE 12. Comparison of dual-mode head coil coverage to commercial single-transmit coil with a sagittal T2w 2D RARE acquisition in the same volunteer. Top row) Acquisition using the commercial coil at several slice locations; Middle row). The same acquisition using the dual-mode coil in single-transmit operation; Bottom row) The repeated acquisition with the dual-mode coil in parallel-transmit mode, here with complex B1+ shimming applied. Comparing the commercial Nova coil to the self-built dual-mode coil, there is improved coverage in the inferior regions of the brain. In this example, there are some modest improvements going from sTx to pTx in the dual-mode coil with B1+ shimming, particularly in the most distal slices (columns 1 and 5).
Figure 13 shows the T1w MPRAGE images from a healthy volunteer acquired in the self-built coil operating in pTx mode. The CP pulse images have darker and less homogeneous excitation than the pTx Universal Pulse images, confirming the successful mitigation of B1+ field inhomogeneity of dynamic pTx with the coil.
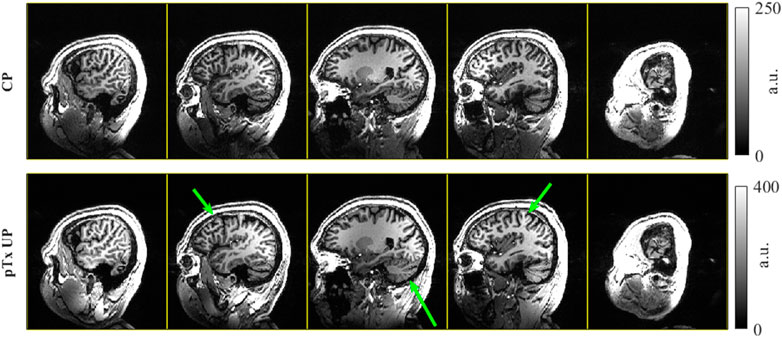
FIGURE 13. T1w MPRAGE images collected in a healthy volunteer with the self-built coil in pTx mode. The top row shows the images acquired in CP mode, equivalent to the sTx case. The bottom row shows the images using dynamic pTx with Universal Pulses for excitation. Both images used the same CP mode 350 V adiabatic inversion and are windowed to have the same contrast. The green arrows highlight a few regions where the UP excitation improves the B1+ homogeneity and resulting image uniformity.
Discussion and Conclusion
A dual-mode 7T head coil prototype which could be interfaced to both the excitation modes of the scanner was developed. The single device supports imaging in sTx mode for clinical diagnosis and pTx mode for research and clinical validation. MRI at 7T is expected to be performed in this hybrid environment until regulatory approval for pTx is received and the pTx workflow is simplified for non-experts.
The large cut-outs also allow a ‘look-out’ mirror to be fixed outside the transmit array for the subjects to see the operator, helping to reduce anxiety and claustrophobia during clinical examinations and also providing patient monitoring. Although the simulations predicted a 10% loss in transmit efficiency due to the cut-outs in the RF shield, equivalent imaging performance can be obtained by increasing the transmit power. This efficiency loss does not immediately mean increased local SAR deposition [50], because this depends on the loss mechanisms such as the radiated, reflected and absorbed power. This suggests that our approach of fully modeling the EM field of the coil and rigorously testing the SAR management experimentally is the best way to understand local SAR and safely use pTx.
The accuracy of the EM coil model was important to validate with experimental B1+ mapping. For sTx operation, the simulated and experimental flip angle maps are in excellent agreement both qualitatively and quantitatively (Figures 7A,B). Comparisons of the complex, single channel maps (Figure 7C—7F) also are qualitatively correlated yet have small phase mismatches. Further experiments to bridge these gaps could include preparing and simulating a more geometrical phantom with known electrical properties that would enable more accurate and more homogeneous field maps and also including the 32-channel receive array in our coil model simulation.
The presented transmit coil is fundamentally a transmit array in which the internal wiring enables a hardware interface through a 1x8 power splitter to the sTx mode of the scanner. We have demonstrated whole brain coverage in sTx mode, which offers a far simpler workflow similar to clinical imaging at 1.5 T/3 T. In the current implementation, a 45° phase increment was set inside the power splitter to achieve CP excitation. However, the setup allows the implementation of a non-CP phase configuration in the splitter that offers a more homogeneous excitation.
For sTx and pTx modes of the coil, SAR monitoring for CP operation uses conventional safety factor or “k-factor” supervision. The EM simulations shown in Figure 8A represent the range of subjects and positions that are anticipated while scanning with our coil. Here, the peak local SAR for 1 W input power and CP excitation across all body model simulations is 0.42 W/kg. The safety factor is added by listing the 1 W input SAR value as 1 W/kg in the coil file that is read by the scanner. This safety factor supervision is always active with reference to CP mode, whether the coil is driven in sTx or pTx.
In general, the more body models and positions included in local SAR estimation, the better, yet often computational and storage resources become a limiting factor with these high-resolution simulations. The overestimation factors and safety margins included in the EM field-derived VOPs ensure that the local SAR is never underestimated, even for every time point in a time-varying pTx pulse (Figure 9). For the initial study presented in this work, the overall safety margin was a factor of 1.7. In an ongoing work, different body models, head positions and rotations are being studied. The VOP can be created by concatenating the different Q-matrices and a higher safety factor is anticipated to account for the subject variations. Future work will also include pathological cases for use of the coil in a clinical population and will examine the influence of subject motion on local SAR [51].
Dynamic pTx operation has demonstrated the improved B1+ homogeneity that the additional degrees of freedom a multi-transmit can provide in the sagittal T1w MPRAGE example using Universal Pulses (Figure 13). With the single row transmit array design, even greater homogenization can be obtained for axially-oriented 2D acquisitions and have found this to be true in some further initial B1+ shimming scans.
In conclusion, a novel eight-channel nested transmit array was developed and its performance in both sTx and pTx modes was demonstrated. This work further demonstrates that a device can be hardwired to both the scanner modes. The coil setup is enhanced by incorporating two large windows which helps claustrophobic subjects as well as opens opportunities for niche applications such as motion correction. This new coil offers uniform coverage of the whole brain and is well suited for 7T clinical neuroimaging. We believe that the dual-mode coil setup is a valuable tool for both clinical diagnosis as well as research and clinical validation in pTx.
Data Availability Statement
The datasets presented in this article are not readily available because of their proprietary nature. Requests to access the datasets should be directed to the corresponding author, Shajan Gunamony.
Ethics Statement
The studies involving human participants were reviewed and approved by West of Scotland Research Ethics Committee and NHS Greater Glasgow & Clyde (NHS-GGC) Research and Development Department. The participants provided their written informed consent to participate in this study.
Author Contributions
SW collected experimental MRI data, prepared the figures, and co-wrote the manuscript. PM generated simulated coil data and prepared figures. SAS collected experimental data, provided guidance on the safety validation of the coil, and helped write the manuscript. GP helped with coil construction. JH prepared the experimental sequences and generated the Universal Pulses. PL also helped prepare experimental sequences and the experimental data collection. AN critically revised the manuscript. JF also critically revised the manuscript and provided guidance on safety validation of the coil. DP helped write the manuscript and provided key guidance on MRI experiments. SG conceived the coil concept, constructed the coil, collected bench top coil measurements, and co-wrote the manuscript. All authors participated in manuscript review.
Funding
This work was supported by the core funding to the Imaging Centre of Excellence, Queen Elizabeth University Hospital by the University of Glasgow.
Conflict of Interest
The coil design is the subject of a US patent application US16857649A. PL is employed by Siemens Healthineers and SG is a shareholder in MR CoilTech Limited. These companies have commercial interest in MRI and RF coils.
The remaining authors declare that the research was conducted in the absence of any commercial or financial relationships that could be construed as a potential conflict of interest.
Publisher’s Note
All claims expressed in this article are solely those of the authors and do not necessarily represent those of their affiliated organizations, or those of the publisher, the editors and the reviewers. Any product that may be evaluated in this article, or claim that may be made by its manufacturer, is not guaranteed or endorsed by the publisher.
Acknowledgments
The authors most gratefully acknowledge the contributions of Tracey Hopkins, Rosemary Woodward and Natasha Fullerton of NHS-GGC R&D in helping us with the scans and formulating the study. We also thank Yuehui Tao from Siemens Healthineers, United Kingdom and Rene Gumbrecht and Robin Heidemann from Siemens Healthineers, Erlangen for their support during the coil validation in pTx. Finally, we would like to extend our gratitude to Christopher T. Rodgers and Belinda Ding from the Wolfson Brain Imaging Centre of the University of Cambridge for their assistance with phantom scanning in the commercial pTx coil.
References
1. Springer E, Dymerska B, Cardoso PL, Robinson SD, Weisstanner C, Wiest R, et al. Comparison of Routine Brain Imaging at 3 T and 7 T. Invest Radiol (2016) 51(8):469–82. doi:10.1097/RLI.0000000000000256
2.FDA Clears First 7T Magnetic Resonance Imaging Device, Silver Spring, MD, USA: US Food & Drug Administration. 2017. Available from: https://www.fda.gov/news-events/press-announcements/fda-clears-first-7t-magnetic-resonance-imaging-device (Accessed April 11, 2021)
3.FDA Clears Most Powerful Clinical MRI. Medgadget. 2020. Available from: https://www.medgadget.com/2020/11/fda-clears-most-powerful-clinical-mri-scanner.html (Accessed May 14, 2020)
4. Zhu Y. Parallel Excitation With an Array of Transmit Coils. Magn Reson Med (2004) 51(4):775–84. doi:10.1002/mrm.20011
5. Van de Moortele P-F, Akgun C, Adriany G, Moeller S, Ritter J, Collins CM, et al. B1 Destructive Interferences and Spatial Phase Patterns at 7 T with a Head Transceiver Array Coil. Magn Reson Med (2005) 54(6):1503–18. doi:10.1002/mrm.20708
6. Avdievich NI. Transceiver-Phased Arrays for Human Brain Studies at 7 T. Appl Magn Reson (2011) 41(2-4):483–506. doi:10.1007/s00723-011-0280-y
7. Gilbert KM, Belliveau J-G, Curtis AT, Gati JS, Klassen LM, Menon RS. A Conformal Transceive Array for 7 T Neuroimaging. Magn Reson Med (2012) 67(5):1487–96. doi:10.1002/mrm.23124
8. Gilbert KM, Curtis AT, Gati JS, Klassen LM, Menon RS. A Radiofrequency Coil to Facilitate B 1+ Shimming and Parallel Imaging Acceleration in Three Dimensions at 7 T. NMR Biomed (2011) 24(7):815–23. doi:10.1002/nbm.1627
9. Shajan G, Kozlov M, Hoffmann J, Turner R, Scheffler K, Pohmann R. A 16-Channel Dual-Row Transmit Array in Combination With a 31-Element Receive Array for Human Brain Imaging at 9.4 T. Magn Reson Med (2014) 71(2):870–9. doi:10.1002/mrm.24726
10. Sengupta S, Roebroeck A, Kemper VG, Poser BA, Zimmermann J, Goebel RA Specialized Multi-Transmit Head Coil for High Resolution FMRI of the Human Visual Cortex at 7T. PLOS ONE (2016). 11(12):e0165418. doi:10.1371/journal.pone.0165418
11. Gunamony S, Hoffmann J, Adriany A, Uğurbil K, Scheffler KA 7T Head Coil With 16-Channel Dual-Row Transmit and 32-Channel Receive Array for pTx Applications and High SNR. In: International Society for Magnetic Resonance in Medicine, Singapore: ISMRM (2016). p. 2132.
12. Gilbert KM, Gati JS, Kho E, Klassen LM, Zeman P, Menon RS. An Parallel-Transmit, Parallel-Receive Coil for Routine Scanning on a 7T Head Only Scanner. In: International Society for Magnetic Resonance in Medicine (2015). p. 0623.
13. Adriany G, Van de Moortele P-F, Wiesinger F, Moeller S, Strupp JP, Andersen P, et al. Transmit and Receive Transmission Line Arrays for 7 Tesla Parallel Imaging. Magn Reson Med (2005) 53(2):434–45. doi:10.1002/mrm.20321
14. Shajan G, Hoffmann J, Budde J, Adriany G, Ugurbil K, Pohmann R. Design and Evaluation of an RF Front-End for 9.4 T Human MRI. Magn Reson Med (2011) 66(2):594–602. doi:10.1002/mrm.22808
15. Orzada S, Kraff O, Schfer LC. 8-Channel Transmit/Receive Head Coil for 7 T Human Imaging Using Intrinsically Decoupled Strip Line Elements with Meanders. In: International Society for Magnetic Resonance in Medicine, Honolulu, HI, USA: ISMRM (2009). p. 3010.
16. Raaijmakers AJE, Ipek O, Klomp DWJ, Possanzini C, Harvey PR, Lagendijk JJW, et al. Design of a Radiative Surface Coil Array Element at 7 T: The Single-Side Adapted Dipole Antenna. Magn Reson Med (2011) 66(5):1488–97. doi:10.1002/mrm.22886
17. Wiggins GC, Zhang B, Lattanzi R, Chen G, Sodickson DK. The Electric Dipole Array: An Attempt to Match the Ideal Current Pattern for Central SNR at 7 Tesla. In: International Society for Magnetic Resonance in Medicine (2012). p. 0541.
18. Raaijmakers AJE, Italiaander M, Voogt IJ, Luijten PR, Hoogduin JM, Klomp DWJ, et al. The Fractionated Dipole Antenna: A New Antenna for Body Imaging at 7 T Esla. Magn Reson Med (2016) 75(3):1366–74. doi:10.1002/mrm.25596
19. Clément JD, Gruetter R, Ipek Ö. A Human Cerebral and Cerebellar 8‐Channel Transceive RF Dipole Coil Array at 7T. Magn Reson Med (2019) 81(2):1447–58. doi:10.1002/mrm.27476
20. Eryaman Y, Guerin B, Kosior R, Adalsteinsson E, Wald LL. Combined Loop + Dipole Arrays for 7 T Brain Imgaing. In: International Society for Magnetic Resonance in Medicine, Salt Lake City, UT, USA: ISMRM (2013). p. 0393.
21. Wiggins CJ, Zhang B, Cloos MA, et al. Mixing Loops and Electric Dipole Antennas for Increased Sensitivity at 7 Tesla. In: International Society for Magnetic Resonance in Medicine (2013). p. 2737.
22. Ertürk MA, Raaijmakers AJE, Adriany G, Uğurbil K, Metzger GJ. A 16‐Channel Combined Loop‐Dipole Transceiver Array for 7 T Esla Body MRI. Magn Reson Med (2017) 77(2):884–94. doi:10.1002/mrm.26153
23. Roemer PB, Edelstein WA, Hayes CE, Souza SP, Mueller OM. The NMR Phased Array. Magn Reson Med (1990) 16(2):192–225. doi:10.1002/mrm.1910160203
24. Avdievich NI, Pan JW, Hetherington HP. Resonant Inductive Decoupling (RID) for Transceiver Arrays to Compensate for Both Reactive and Resistive Components of the Mutual Impedance. NMR Biomed (2013) 26(11):1547–54. doi:10.1002/nbm.2989
25. Yan X, Gore JC, Grissom WA. Self-Decoupled Radiofrequency Coils for Magnetic Resonance Imaging. Nat Commun (2018) 9(1). doi:10.1038/s41467-018-05585-8
26. Gilbert KM, Curtis AT, Gati JS, Martyn Klassen L, Villemaire LE, Menon RS. Transmit/Receive Radiofrequency Coil with Individually Shielded Elements. Magn Reson Med (2010) 64(6):1640–51. doi:10.1002/mrm.22574
27. Pohmann R, Speck O, Scheffler K. Signal‐to‐Noise Ratio and MR Tissue Parameters in Human Brain Imaging at 3, 7, and 9.4 Tesla Using Current Receive Coil Arrays. Magn Reson Med (2016) 75(2):801–9. doi:10.1002/mrm.25677
28. Uğurbil K, Auerbach E, Moeller S. Brain Imaging With Improved Acceleration and SNR at 7 Tesla Obtained With 64-Channel Receive Array. Magn Reson Med (2019) 82:495–509. doi:10.1002/mrm.27695
29. Chen G, Zhang B, Cloos MA, Sodickson DK, Wiggins GC. A Highly Decoupled Transmit-Receive Array Design with Triangular Elements at 7 T. Magn Reson Med (2018) 80(5):2267–74. doi:10.1002/mrm.27186
30. Eichfelder G, Gebhardt M. Local Specific Absorption Rate Control for Parallel Transmission by Virtual Observation Points. Magn Reson Med (2011) 66(5):1468–76. doi:10.1002/mrm.22927
31. Kozlov M, Weiskopf N, Möller HE, Shajan G. Reverse Engineering of a 7T 16-Channel Dual-Row Transmit Array Coil. In: International Society for Magnetic Resonance in Medicine (2018). p. 4412.
32. Vaughan JT, Vaughan JT, Garwood M, Yacoub E, Duong T, DelaBarre L, et al. Detunable Transverse Electromagnetic (TEM) Volume Coil for High-Field NMR. Magn Reson Med (2002) 47(5):990–1000. doi:10.1002/mrm.10141
33. Kazemivalipour E, Sadeghi‐Tarakameh A, Atalar E. Eigenmode Analysis of the Scattering Matrix for the Design of MRI Transmit Array Coils. Magn Reson Med (2021) 85:1727–41. doi:10.1002/mrm.28533
34. Lanz T, Müller M, Barnes H, Neubauer S, Schneider JE. A High-Throughput Eight-Channel Probe Head for Murine MRI at 9.4 T. Magn Reson Med (2010) 64(1):80–7. doi:10.1002/mrm.22414
35. Grebennikov A. Power Combiners, Impedance Transformers and Directional Couplers: Part II. High Freq Electron (2008) 42–53.
36. Beck BL, Jenkins KA, Rocca JR, Fitzsimmons JR. Tissue-Equivalent Phantoms for High Frequencies. Concepts Magn Reson (2004) 20B(1):30–3. doi:10.1002/cmr.b.20002
37. Hoffmann J, Shajan G, Scheffler K, Pohmann R. Numerical and Experimental Evaluation of RF Shimming in the Human Brain at 9.4 T Using a Dual-Row Transmit Array. Magn Reson Mater Phy (2014) 27(5):373–86. doi:10.1007/s10334-013-0419-y
38. Kozlov M, Turner R. Fast MRI Coil Analysis Based on 3-D Electromagnetic and RF Circuit Co-Simulation. J Magn Reson (2009) 200(1):147–52. doi:10.1016/j.jmr.2009.06.005
39. Christ A, Kainz W, Hahn EG, Honegger K, Zefferer M, Neufeld E, et al. The Virtual Family-Development of Surface-Based Anatomical Models of Two Adults and Two Children for Dosimetric Simulations. Phys Med Biol (2010) 55(2):N23–N38. doi:10.1088/0031-9155/55/2/N01
40. Hoffmann J, Henning A, Giapitzakis IA, Scheffler K, Shajan G, Pohmann R, et al. Safety Testing and Operational Procedures for Self-Developed Radiofrequency Coils. NMR Biomed (2016) 29(9):1131–44. doi:10.1002/nbm.3290
41. Graesslin I, Homann H, Biederer S, Börnert P, Nehrke K, Vernickel PA Specific Absorption Rate Prediction Concept for Parallel Transmission MRMagn Reson Med (2012). 68(5):1664–74. doi:10.1002/mrm.24138
42. Williams SN, McElhinney P, Porter DA, Gunamony S. Comparing the Practical Effects of VOP Compressions for SAR Monitoring at 7 Tesla. In: Minnesota Workshop on High and Ultra-high Field Imaging and Training Courses (2019).
43. Chung S, Kim D, Breton E, Axel L. Rapid B 1 + Mapping Using a Preconditioning RF Pulse With TurboFLASH Readout. Magn Reson Med (2010) 64:439–46. doi:10.1002/mrm.22423
44. Pauly J, Le Roux P, Nishimura D, Macovski A. Parameter Relations for the Shinnar-Le Roux Selective Excitation Pulse Design Algorithm (NMR Imaging). IEEE Trans Med Imaging (1991) 10(1):53–65. doi:10.1109/42.75611
45. Gras V, Vignaud A, Amadon A, Bihan D, Boulant N. Universal Pulses: A New Concept for Calibration‐Free Parallel Transmission. Magn Reson Med (2017) 77(2):635–43. doi:10.1002/mrm.26148
46. Malik SJ, Keihaninejad S, Hammers A, Hajnal JV. Tailored Excitation in 3D with Spiral Nonselective (SPINS) RF Pulses. Magn Reson Med (2012) 67(5):1303–15. doi:10.1002/mrm.23118
47. Herrler J, Liebig P, Gumbrecht R, Ritter D, Schmitter S, Maier A, et al. Fast Online‐Customized (FOCUS) Parallel Transmission Pulses: A Combination of Universal Pulses and Individual Optimization. Magn Reson Med (2021) 85:3140–53. doi:10.1002/mrm.28643
48. Shajan G, McElhinney P, Allwood-Spiers S, Paterson G, Goense J. An 8-Channel Transmit 32-Channel Receive 7T Head Coil for 1Tx and pTx Scanner Modes. In: International Society for Magnetic Resonance in Medicine (2019). p. 0572.
49. Williams SN, Allwood-Spiers S, McElhinney P, Tao Y, Foster JE, Gunamony S, et al. Validation and Safety Approval of a Dual-Mode Head Coil for pTx Applications In Vivo at 7 Tesla. In: International Society for Magnetic Resonance in Medicine (2020). p. 4038.
50. Avdievich NI, Hoffmann J, Shajan G, Pfrommer A, Giapitzakis IA, Scheffler K, et al. Evaluation of Transmit Efficiency and SAR for a Tight Fit Transceiver Human Head Phased Array at 9.4 T. NMR Biomed (2017) 30(2):e3680. doi:10.1002/nbm.3680
Keywords: RF coil, B1 homogeneity, 7 Tesla, parallel-transmit (pTx), specific absorption rate (SAR), virtual observation points (VOPs), ultra-high field, transmit array
Citation: Williams SN, Allwood-Spiers S, McElhinney P, Paterson G, Herrler J, Liebig P, Nagel AM, Foster JE, Porter DA and Gunamony S (2021) A Nested Eight-Channel Transmit Array With Open-Face Concept for Human Brain Imaging at 7 Tesla. Front. Phys. 9:701330. doi: 10.3389/fphy.2021.701330
Received: 27 April 2021; Accepted: 09 July 2021;
Published: 27 July 2021.
Edited by:
Sigrun Roat, Medical University of Vienna, AustriaReviewed by:
Özlem Ipek, King’s College London, United KingdomIsabelle Saniour, Weill Cornell Medicine, United States
Copyright © 2021 Williams, Allwood-Spiers, McElhinney, Paterson, Herrler, Liebig, Nagel, Foster, Porter and Gunamony. This is an open-access article distributed under the terms of the Creative Commons Attribution License (CC BY). The use, distribution or reproduction in other forums is permitted, provided the original author(s) and the copyright owner(s) are credited and that the original publication in this journal is cited, in accordance with accepted academic practice. No use, distribution or reproduction is permitted which does not comply with these terms.
*Correspondence: Shajan Gunamony, shajan.gunamony@glasgow.ac.uk
†These authors have contributed equally to this work