210Po and 210Pb as Tracers of Particle Cycling and Export in the Western Arctic Ocean
 Wokil Bam
 Kanchan Maiti
 Mark Baskaran
- 1Department Oceanography and Coastal Sciences, Louisiana State University, Baton Rouge, LA, United States
- 2Department of Environmental Science and Geology, Wayne State University, Detroit, MI, United States
The distribution and vertical fluxes of particulate organic carbon and other key elements in the Arctic Ocean are primarily governed by the spatial and seasonal changes in primary productivity, areal extent of ice cover, and lateral exchange between the shelves and interior basins. The Arctic Ocean has undergone rapid increase in primary productivity and drastic decrease in the areal extent of seasonal sea ice in the last two decades. These changes can greatly influence the biological pump as well as associated carbon export and key element fluxes. Here, we report the export of particulate organic and inorganic carbon, particulate nitrogen and biogenic silica using 210Po and 210Pb as tracers for the seasonal vertical fluxes. Samples were collected as a part of US GEOTRACES Arctic transect from western Arctic Basin in 2015. The total activities of 210Po and 210Pb in the upper 300 m water column ranged from 0.46 to 16.6 dpm 100L–1 and 1.17 to 32.5 dpm 100L–1, respectively. The 210Pb and 210Po fluxes varied between 5.04–6.20 dpm m–2 d–1 and 8.26–21.02 dpm m–2 d–1, respectively. The corresponding particulate organic carbon (POC) and particulate nitrogen (PN) fluxes ranged between 0.75–7.43 mg C m–2 d–1 and 0.08–0.78 mg N m–2 d–1, respectively, with highest fluxes observed in the northern ice-covered stations. The particulate inorganic carbon (PIC) and biogenic silica (bSi) fluxes were extremely low ranging from 0 to 0.14 mg C m–2 d–1 and 0.14 to 2.88 mg Si m–2 d–1, respectively, at all stations suggesting absence of ballast elements in facilitating the biological pump. The variability in POC fluxes with depth suggest prominent influence of lateral transport to downward fluxes across the region. The results provide a better understanding of the spatial variability in the vertical fluxes POC, PN, bSi, and PIC in the western Arctic which is currently undergoing dramatic changes.
Introduction
The Arctic Ocean covers an area of 9.6 × 10⁶ km2 (Serreze et al., 2006), which corresponds to 5% of the world oceans by surface area, with 1.5% by volume (Meybeck and Ragu, 1997; Guay and Falkner, 1998) indicating that it is a relatively shallow ocean with about 50% of the total Arctic Ocean surface area as continental shelf area (Jakobsson et al., 2004). Approximately 10% of the world’s rivers discharge flow into the Arctic Ocean making it one of the most dynamic systems, similar to estuarine systems (Aagaard and Carmack, 1989; Meybeck and Ragu, 1997; Guay and Falkner, 1998; Dickson et al., 2007). The catchment area of these rivers is estimated to store about 30% of the world’s soil carbon (Hugelius et al., 2014; Schuur et al., 2015). Thus, recent climate changes can have profound impacts on the Arctic region resulting in increased export of organic carbon, and associated trace elements and sediments to the Arctic Ocean (Rachold et al., 2000; Moran et al., 2005; Jorgenson et al., 2006; Schuur et al., 2008; Lannuzel et al., 2020; and reference therein).
The input of freshwater from Arctic rivers into the Arctic Ocean has increased significantly during recent decades (Peterson et al., 2002; Ahmed et al., 2020). This increase in freshwater discharge, coupled with increased coastal erosion, permafrost thaw and sea ice melting suggest that the riverine input of carbon, nutrients, and metals will continue to increase in the future. The highly productive shallow shelf serves as a source of organic carbon and nutrients to the central Arctic Ocean through the two major currents systems, Transpolar Drift (TPD), and Beaufort Gyre (e.g., Wheeler et al., 1997; Krishnamurthy et al., 2001; Klunder et al., 2012; Charette et al., 2020). The Arctic Ocean has also undergone more than 20% increase in primary productivity in the last two decades due to decrease in the areal extent of sea ice cover (Arrigo and van Dijken, 2011). The sea ice in this region serves as a platform for retaining atmospherically delivered particle-reactive species, as well as a vehicle for transport of organic and inorganic species incorporated into sea ice formed in the coastal areas (e.g., Krishnamurthy et al., 2001; Tovar-Sánchez et al., 2010). Thus, changes in freshwater input and extent of sea-ice melting can greatly influence the biological pump and particle scavenging in this region.
The present research focuses on the Western Arctic Canada Basin where the vertical fluxes of biogenic materials are reported to be lowest compared to the global ocean, with only 1–2% of the new production reaching the deep basin (Honjo et al., 2010; Hwang et al., 2015). However, expected changes in freshwater discharge will affect the lateral transport of particles into the interior basin (Fahl and Nöthig, 2007; Hwang et al., 2008; Honjo et al., 2010). Water mass exchange between the highly productive shelf and interior basin has been reflected in the observed shelf scavenging signal into the interior basin (Moore and Smith, 1986; Smith et al., 2003). The biogeochemistry in the western Arctic Basin can thus be significantly altered by the influx of shelf-derived materials, and their subsequent transport by TPD (Kipp et al., 2018).
A better understanding of particle cycling and their export to deeper ocean is crucial considering the rapid changes occurring on multiple fronts in this region. The naturally occurring radioisotope pairs from 238U decay series such as 234Th – 238U, 210Pb – 226Ra, and 210Po – 210Pb have been widely used as tracers of particulate matter in the water column, especially in the estimation of the export flux and cycling of particulate matter. Most of the 226Ra (t1/2 = 1602 y) in the oceanic water column in deep ocean basins are derived from bottom sediment via diffusion (Cochran, 1992). 210Pb (T1/2 = 22 y) is produced from in situ decay of its grandparent 226Ra (which has highest concentration near bottom water) present in the water column as well as direct atmospheric deposition (highest concentration at air-sea interface). 210Po is derived from decay of 210Pb in the water column. The 210Po/210Pb activity ratio in atmospheric deposition is generally < 0.1 (Baskaran, 2011), and thus acts as a minor source of 210Po in the surface ocean. Both the 210Pb and 210Po are highly particle reactive, with partition coefficient (Kd) values of 104–106 and 105–109, respectively (Baskaran and Santschi, 2002; Su et al., 2017; Tang et al., 2017; Bam et al., 2020) and hence are scavenged by both suspended and sinking particulate matter. Higher partition coefficient values represent higher affinity of elements to be adsorb/attach to particles. A deficiency of 210Po relative to 210Pb is often observed in the upper few hundred meters of the water column due to higher scavenging efficiency of Po (Bacon et al., 1976; Nozaki et al., 1976). Po has stronger affinity for biogenic particulate matter and thus preferential removal of 210Po takes place in the upper water column. While 210Pb is only adsorbed onto particle surfaces, 210Po is also assimilated into phytoplankton cells (Bacon et al., 1976; Nozaki et al., 1976; Fisher et al., 1983). The preferential adsorption and accumulation of 210Po in organic matter is well documented in both lab culture and field studies (Fisher et al., 1983; Stewart and Fisher, 2003a,b). Similarly, preferential adsorption of 210Pb compared to 210Po onto silicious frustules had been previously reported (Friedrich and Rugters van der Loeff, 2002; Lin et al., 2021). The 226Ra – 210Pb and 210Pb – 210Po pairs can thus be used to trace particle transport processes and quantify chemical scavenging and particle removal rates in the upper ocean for time scales of months to years.
In this article, we utilize these two isotope pairs to investigate the spatial variability in fluxes of particulate organic carbon (POC), particulate inorganic carbon (PIC), particulate nitrogen (PN), and biogenic silica (bSi) across the open water to permanently ice-covered region of the western Arctic Ocean. The spatial and seasonal changes in sea-ice cover, primary productivity, riverine input of freshwater, sediment resuspension, physical processes, and strong halocline play important roles in the distribution of particles, nutrients, and trace elements in the Arctic Ocean (Rachold et al., 2004; Lepore et al., 2009; Chen et al., 2012; Jeandel et al., 2015). Here, we report export fluxes of POC (using POC/210Po ratio), PN (using PN/210Po ratio), bSi (using bSi/210Pb ratio), and PIC (using PIC/210Pb ratio) from upper 250 m of the water column.
Materials and Methods
Study Area
Arctic water comprises of several distinct water masses which include the high salinity and low temperature Pacific water coming through the Bering Strait, freshwater from river discharge, and high salinity and high temperature Atlantic water coming through Fram Strait (Moore and Smith, 1986; Rutgers Van Der Loeff et al., 1995; Hu et al., 2014). The largest freshwater inventory is found in the upper 300 m of the Canadian Basin (Yamamoto-Kawai et al., 2008; Rabe et al., 2011). Pacific water contributes to the surface and halocline waters of the Canadian Basin (Bauch et al., 1995). Pacific water of winter origin tends to enter the interior Arctic below the upper mixed layer because of their higher salinity and creating the lower halocline water masses (Weingartner et al., 1998; Zhong et al., 2019). Warmer Pacific and colder Atlantic water masses make the system highly stratified and lead to formation of two distinct halocline; the upper and the lower halocline (Smith et al., 2003; Lepore et al., 2009; Zhong et al., 2019). Halocline waters from the shelf seas are the key source of high nutrients in the Arctic basin (Aagaard et al., 1981; Moore and Smith, 1986; Fripiat et al., 2018; Granger et al., 2018).
The upper halocline is mainly confined to the Canadian Basin and is characterized by high nutrients and low dissolved oxygen, whereas the lower halocline is characterized by lower nutrients and higher dissolved oxygen (Jensen et al., 2019, 2020). The compositions of these water masses are greatly altered during their residence on the shelves due to ice formation and melting, primary production, and exchanges with the atmosphere and the seafloor (Rutgers Van Der Loeff et al., 1995).
Sample Collection
Samples were collected during the US Arctic GEOTRACES (GN01) cruise onboard US Coast Guard Cutter Healy (HLY1502) from August 9th to October 11th, 2015. Water samples for dissolved and particulate 210Po and 210Pb, particulate organic carbon (POC), particulate inorganic carbon (PIC), particulate nitrogen (PN), and biogenic silica (bSi) were collected at Station 30, Station 43, Station 48, and Station 56 (Figure 1). Station 30 and 43 are permanently ice covered, station 48 is seasonally ice covered and station 56 is predominantly open water located on the continental slope (Figure 1). The station 30, 43, and 48 are within the area of TPD and Beaufort Gyre whereas the station 56 is influenced by Pacific Water inflow and Beaufort Gyre. About 20-L water samples were collected at various depths using a 30-L Niskin bottles. For dissolved 210Po and 210Pb, water samples were filtered through a 0.45 μm cartridge filter within 1–2 h after collection and transferred to acid-cleaned cubitainers. The dissolved samples were adjusted to pH 1–2 by adding 6 M HCl within less than 2–3 h after collection and stored onboard. Particulate samples were collected using battery-operated submersible pumps (McLane Research Laboratories, Inc., Falmouth, MA, United States). The pump deployment consisted of a vertical array of pumps at depths coinciding with dissolved samples. For the particulate matter, large-volume water samples (400–600 L) were filtered at a flow rate of ∼6 L min–1 through acid-washed 150 mm pre-filters (51 μm polycarbonate screen) and then onto pre-acid-washed, pre-combusted 1 μm nominal, 150 mm diameter Quartz Microfiber Filter (QMA) (Whatman, Kent, United Kingdom) to capture suspended particles. The particles captured on 1 and 51 μm filters are referred to as small and large particles, respectively.
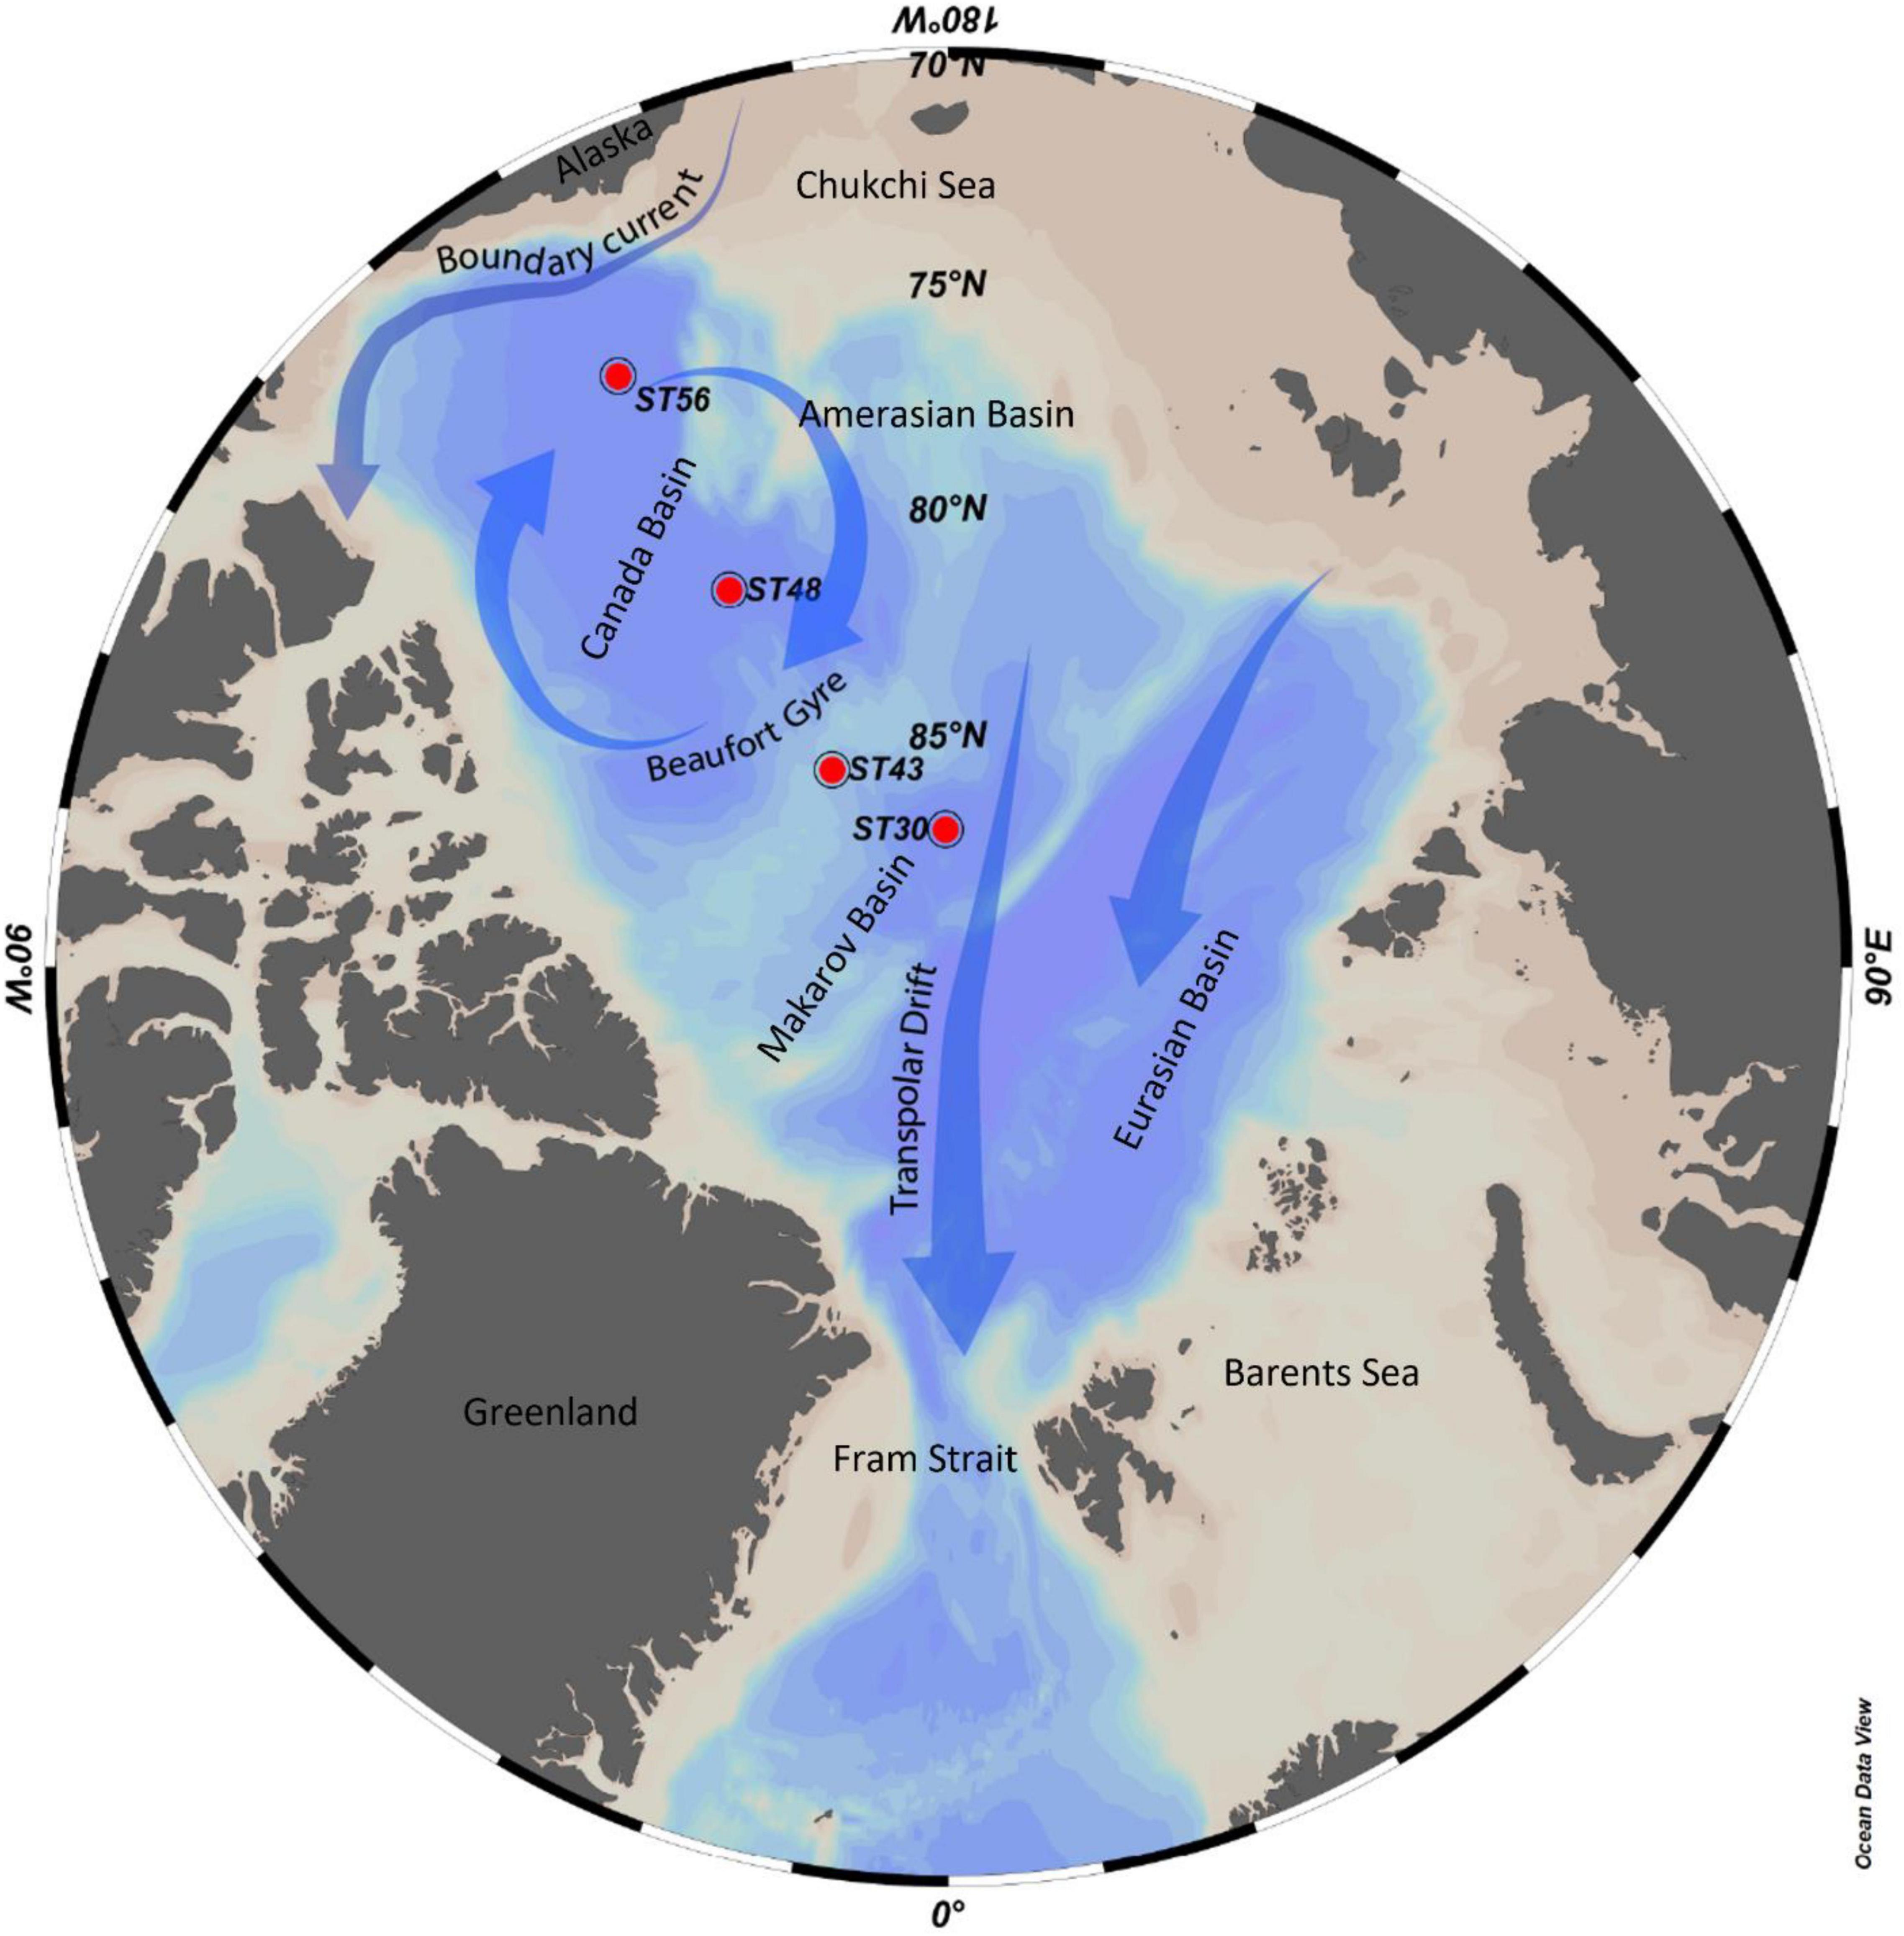
Figure 1. Map showing the sampling stations 30, 43, 48, and 56 in the US Arctic GEOTRACES (GN01) section. Water samples for dissolved and particulate 210Po and 210Pb were collected onboard US Coast Guard Cutter Healy (HLY1502) from August 9th to October 11th, 2015. The arrows represent the major circulation pattern of the surface layer water mass. The map was created using Ocean Data View 5.2.0.
Dissolved and particulate 210Po and 210Pb analysis were carried out in the lab following procedures outlined in Bam et al. (2020). Plating of Po was done by spontaneous electro-deposition onto silver planchets, following methods described in Geotraces Cookbook (2017) and Bam et al. (2020). The average time between sample collection and initial plating of 210Po for dissolved and particulate samples was approximately 1.5–2 months. The final Po-Pb data was appropriately corrected for decay and ingrowth between the sampling and first plating along with other radiometric decay correction (Baskaran et al., 2013; Bam and Maiti, 2021). Data on POC, PN, PIC, bSi, and δ13CPOC data were obtained from BCO-DMO website and details on sampling and analytical methods are reported in Xiang and Lam, 2020 and (Lam, 2020)1. The δ13C-DIC data were also obtained from BCO-DMO website (Quay, 2019)2 and sampling and analytical methods are reported in Ko and Quay (2020). 226Ra activities were also obtained from BCO-DMO website (Charette and Moore, 2020)3 and the details for sampling and analytical methods were reported in Kipp et al. (2019). Temperature, fluorescence, dissolved oxygen, and salinity in-situ data were collected using the shipboard CTD at each station and are reported in BCO-DMO website (Cutter et al., 2019)4.
Pb and Po Export Models
The major source of 210Pb in seawater is from in-situ decay of 226Ra and atmospheric deposition. The rate of change of 210Pb activity can be expressed as follows (Moore and Smith, 1986; Friedrich and Rugters van der Loeff, 2002; Smith et al., 2003):
where, ARa and APb are the activities of dissolved 226Ra (dpm L–1) and total 210Pb (dpm L–1), λPb is decay constant (d–1) of 210Pb, IPb is the atmospheric depositional input flux of 210Pb assumed to be 0.17 dpm cm–1 y–1, based on the mean value (range 0.12–0.22 dpm cm–1 y–1) of previous estimates by Baskaran (2011), FPo is the export flux of 210Pb (dpm m–2 d–1) on to sinking particles and V is the sum of advective and diffusive fluxes of 210Pb activities (dpm m–2 d–1).
Similarly, the major source of 210Po in the water column is from the in-situ decay of its longer-lived grandparent 210Pb. 210Po can also be added via atmospheric deposition from the decay of 210Pb within the atmosphere, but this activity usually represents < 10% of the 210Pb activity because of the short atmospheric residence time of 210Pb-containing aerosols (Harada et al., 1989; Kim et al., 2005; Baskaran, 2011). The rate of change of 210Po due to export can be expressed as follows: (e.g., Bacon et al., 1976; Moore and Smith, 1986):
where, IPo is the atmospheric depositional input flux of 210Po (dpm cm–1 y–1) which is extremely low for this region (Baskaran, 2011), APb is the total 210Pb activity in the water column (dpm L–1), APo is the total 210Po activity (dpm L–1), λPo is the decay constant (d–1), FPo is the export flux of 210Po (dpm cm–1 y–1) on sinking (large) particle, and V is the sum of advective and diffusive fluxes of 210Po activities (dpm cm–1 y–1).
The export fluxes of 210Pb can be estimated using a 1-D steady state model (i.e., ∂APb/ ∂t = 0 total 210Pb remain constant), which assumes negligible advective and diffusive fluxes (V = 0) as follows:
where, FPb is the 210Pb flux, ARa is the total activity of 226Ra in the water column, APb is the total activity of 210Pb in the water column, λPb is the 210Pb decay constant, IPb is the atmospheric depositional input flux of 210Pb, and z is the integrated thickness of the water column layer.
Similarly, the export fluxes of 210Po can be estimated using a 1-D steady state model (i.e., ∂APo/ ∂t = 0, total 210Po remain constant), which assumes negligible advective and diffusive fluxes (V = 0) and negligible 210Po atmospheric flux (considering the fact that 210Po/210Pb activity in atmospheric deposition is < 0.1) as follows:
where, FPo is the 210Po flux, APb is the total activity of 210Pb in the water column, APo is the total activity of 210Po in the water column, λPo is the 210Po decay constant, and z is the integrated thickness of the water column layer. However, western Arctic Ocean can be influenced by shelf interaction which could overestimate the 210Po and 210Pb flux due to 210Po and 210Pb deficit in shelf water. Previous studies have shown lateral input and transport of materials in the western Arctic from the continental shelf areas (Lepore et al., 2009; Kipp et al., 2018; Rutgers Van Der Loeff et al., 2018). The melting ice can also contribute to water column 210Pb and 210Po inventory, but previous studies have suggested melting of all sea-ice present in the Arctic will only contribute to 10% of the 210Pb inventory (Masqué et al., 2007; Roca-Martí et al., 2016). Moreover, such contribution from ice is likely to have 210Po-210Pb in equilibrium and will have negligible impact on 210Po flux estimates in the Arctic.
The 210Po has higher particle affinity for biogenic material such as POC and PN whereas the 210Pb has higher affinity for species such as PIC and bSi (Fisher et al., 1983; Friedrich and Rugters van der Loeff, 2002). Thus, 210Po fluxes can be used to estimate the sinking fluxes of POC and PN and 210Pb fluxes can be used to estimate the sinking fluxes of PIC and bSi. The POC flux can be calculated as follows.
where, FPOC is the flux of POC, F210Po is the flux of 210Po, and APo is the activity of 210Po in the particulate phase and POC is the POC concentration in the particles. The PN, PIC, and bSi fluxes were also calculated in a similar method as the POC flux using equation 5.
Estimation of export of particulate phases in the water column, using equations 3 and 4 involve the following assumptions: (i) the atmospheric input of 210Pb and 210Po in the surface ocean is at steady state on time scale that we integrate for the estimation of POC fluxes. Previous studies from this region have shown the atmospheric input in the Arctic (60–80 °N), to be extremely low ranging between 0.12 and 0.22 dpm cm–2 y–1 (Baskaran, 2011); (ii) the elemental to radionuclide ratios measured in particles collected by in situ pumps are representative of sinking particles. In this study, the elemental ratios in both the small (1–51 um) and large (>51um) particles were measured, we used both the ratios in large and small particles to estimate the export fluxes. However, we primarily focused on the larger particle export similar to earlier studies (Stewart et al., 2007; Maiti et al., 2016; Roca-Martí et al., 2016); (iii) the one-time sampling in the summer is representative for much longer time scales of months to years over which 210Po and 210Pb fluxes integrates. This region is characterized by phytoplankton bloom at the onset of summer which could result in non-steady condition. However, our sampling was carried out in late summer and the longer half-life of 210Po (t1/2 = 138 d) results in flux integrated over timescales of months, making it less sensitive to short-term non-steady state events.
Results
Hydrological Parameters
The national snow and ice data center sea ice index suggests that permanent sea ice (multi-year) is present throughout the year at stations 30 and 43, station 48 is covered with sea ice most of the time during the year whereas station 56 is rarely covered with ice. The mixed layer, defined as the depth where density increased from its surface value by 20% of the difference surface and 100 m, varied between 40 and 50 m in all four stations (Shaw et al., 2009). The top 50–75 m water column is strongly stratified as shown by the temperature and salinity transect (Figures 2A,B). The stations 30 and 43 had maximum chlorophyll-a concentration in the upper 10 m of the water column, whereas stations 48 and 56 had maximum chlorophyll-a concentrations at 50–60 m (Figure 2C). The presence of surface maximum chlorophyll concentration in stations 30 and station 43 could be attributed to melting of sea ice (sea ice present during the sampling) with high concentrations of algae in sea ice. The dissolved oxygen (DO) varied between 7.02 and 12.2 mg L–1, with station 30 having higher DO in the mixed layer (Supplementary Figure 1). In the upper 500 m water column, the silicate, nitrate, and phosphate concentrations varied between 0 and 50 μmol kg–1, 0 and 20 μmol kg–1 and 0 to 2.5 μmol kg–1, respectively, with significantly higher concentrations between 100 and 250 m (Figure 3). The station 30 had the lowest nutrient concentration which increased from North to Southward. The nutrient maximum layer showed a similar pattern to temperature and salinity profiles corresponding to the distinct water masses. The spatial distribution of nutrient in the Arctic water column is mainly influenced by the water masses specially the warm Pacific Water (Jensen et al., 2019, 2020).
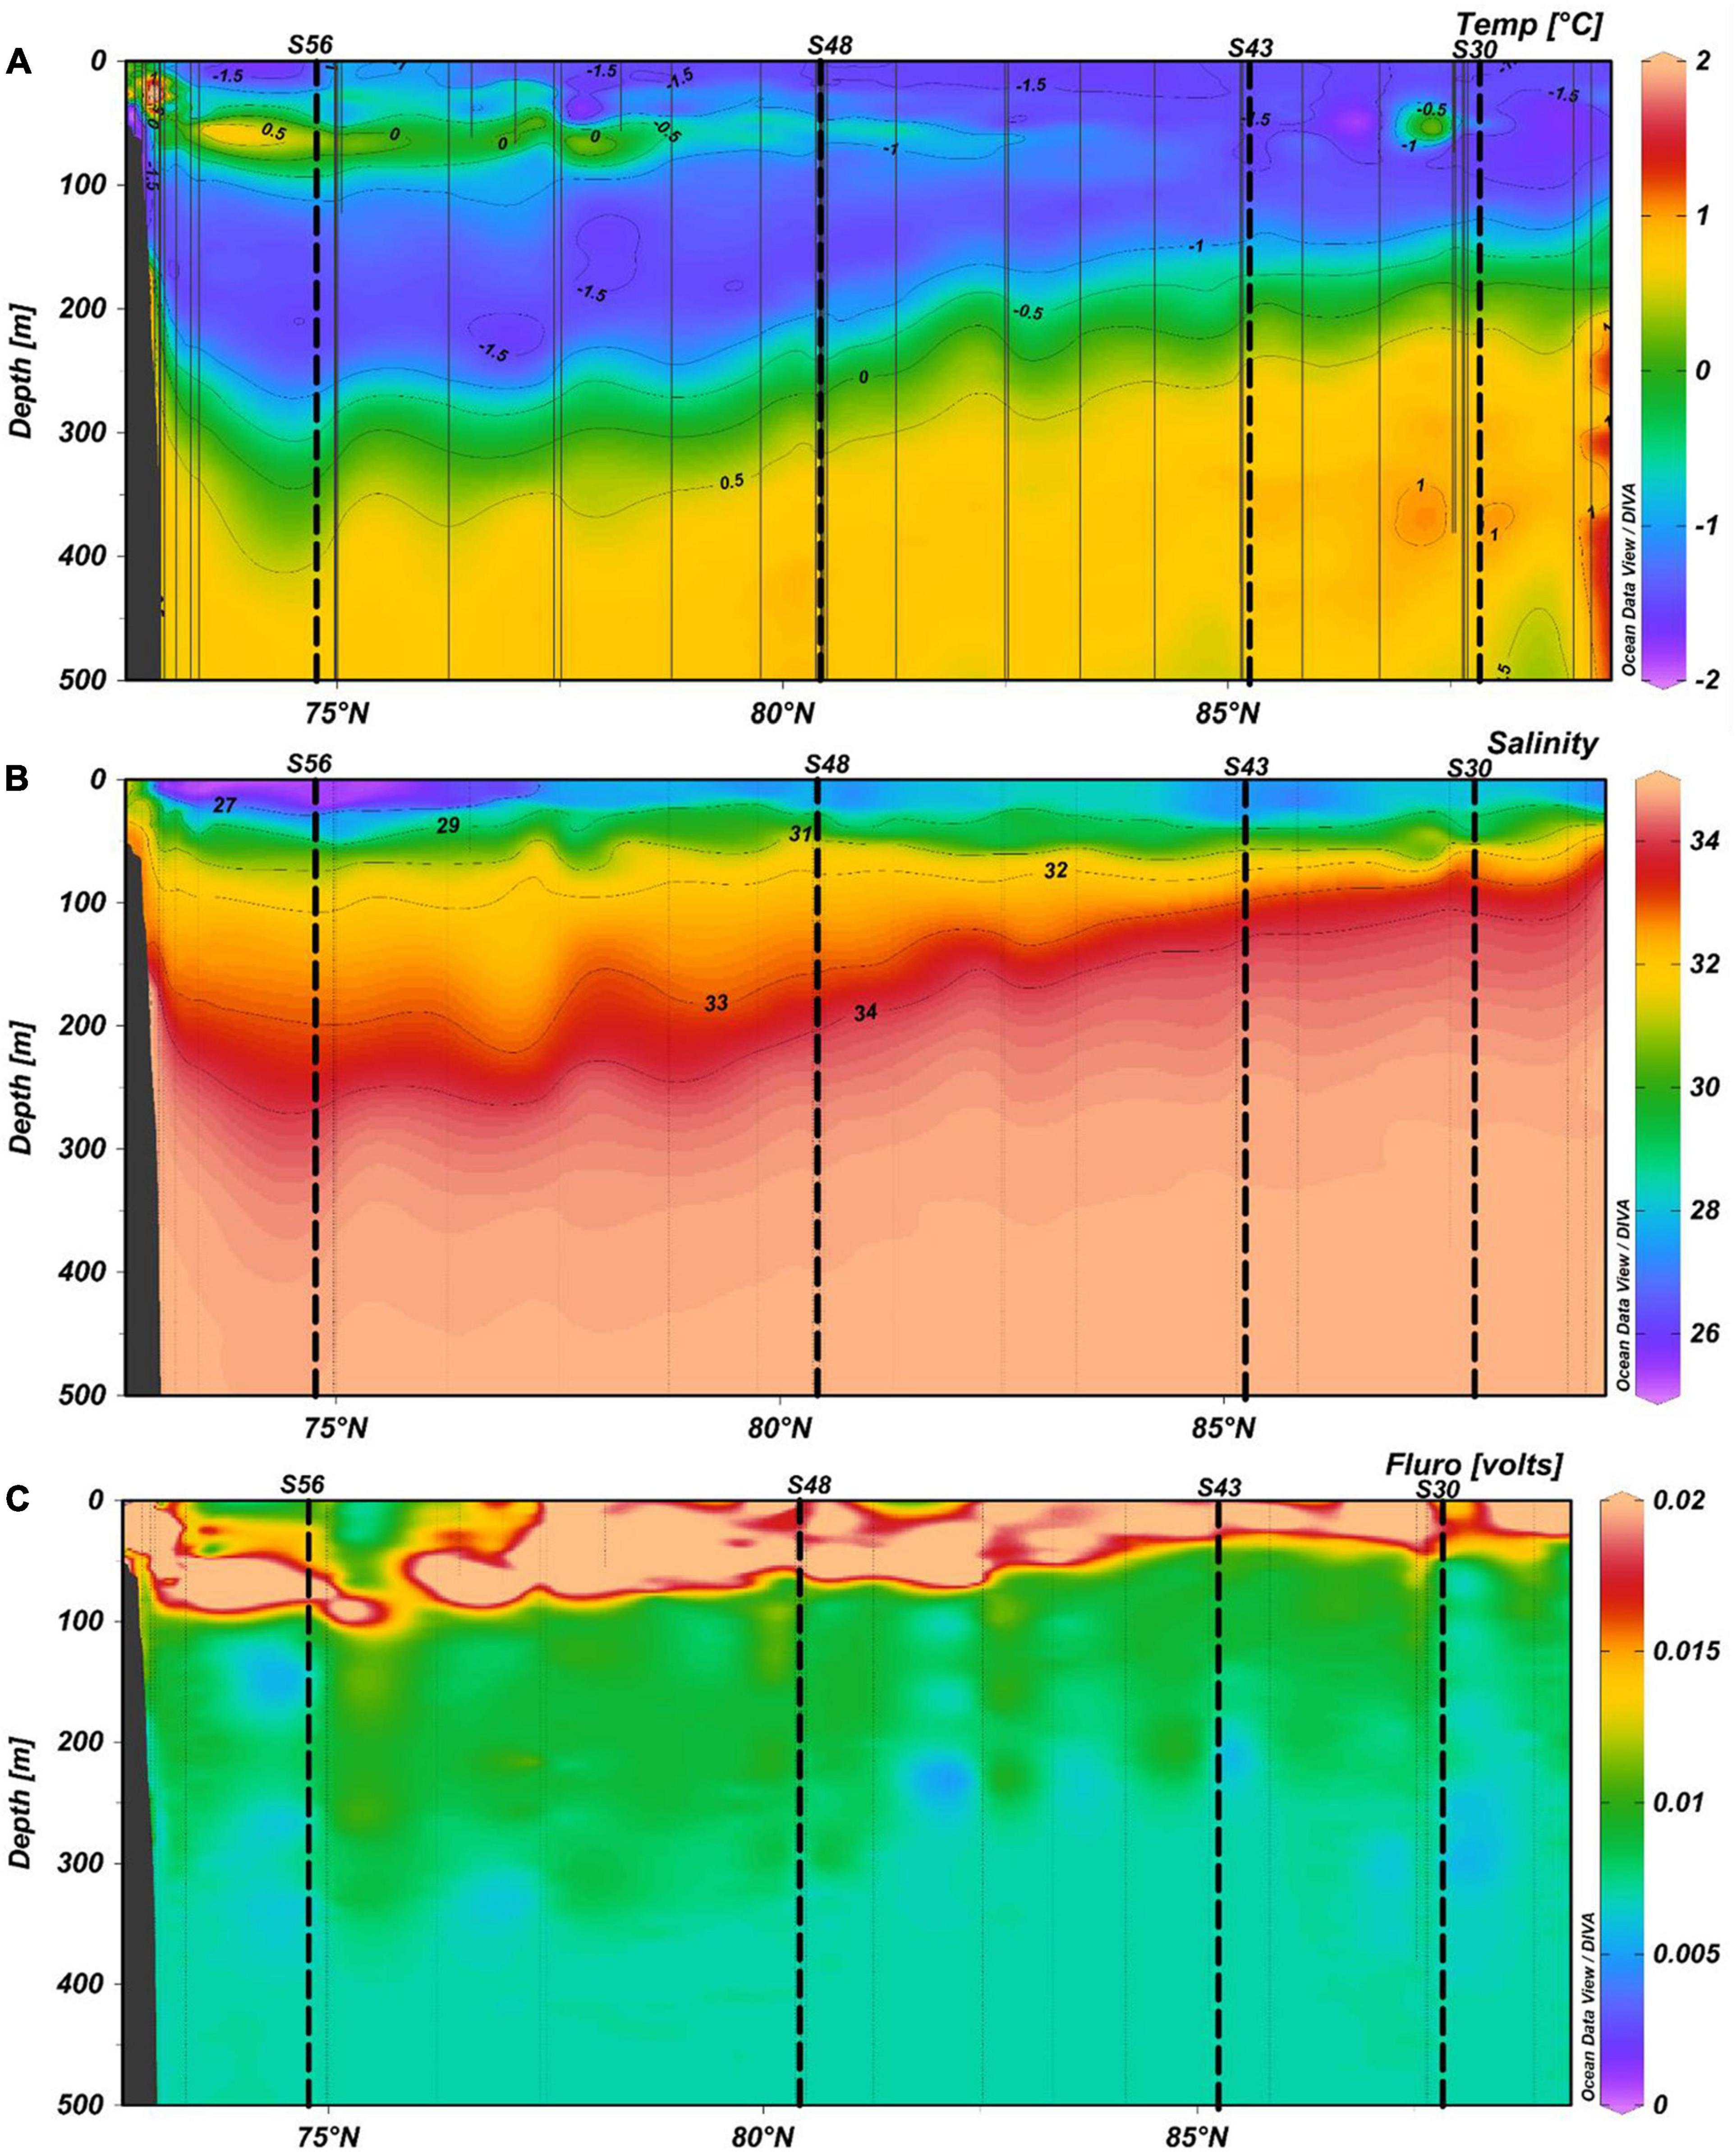
Figure 2. Northbound section plots of (A) water temperature (°C), (B) salinity (sal) and (C) fluorescence (volts -relative units) in the upper 500 m water column. The vertical dashed lines represent the sampling stations along the transect. The transect images were created using Ocean Data View 5.2.0.
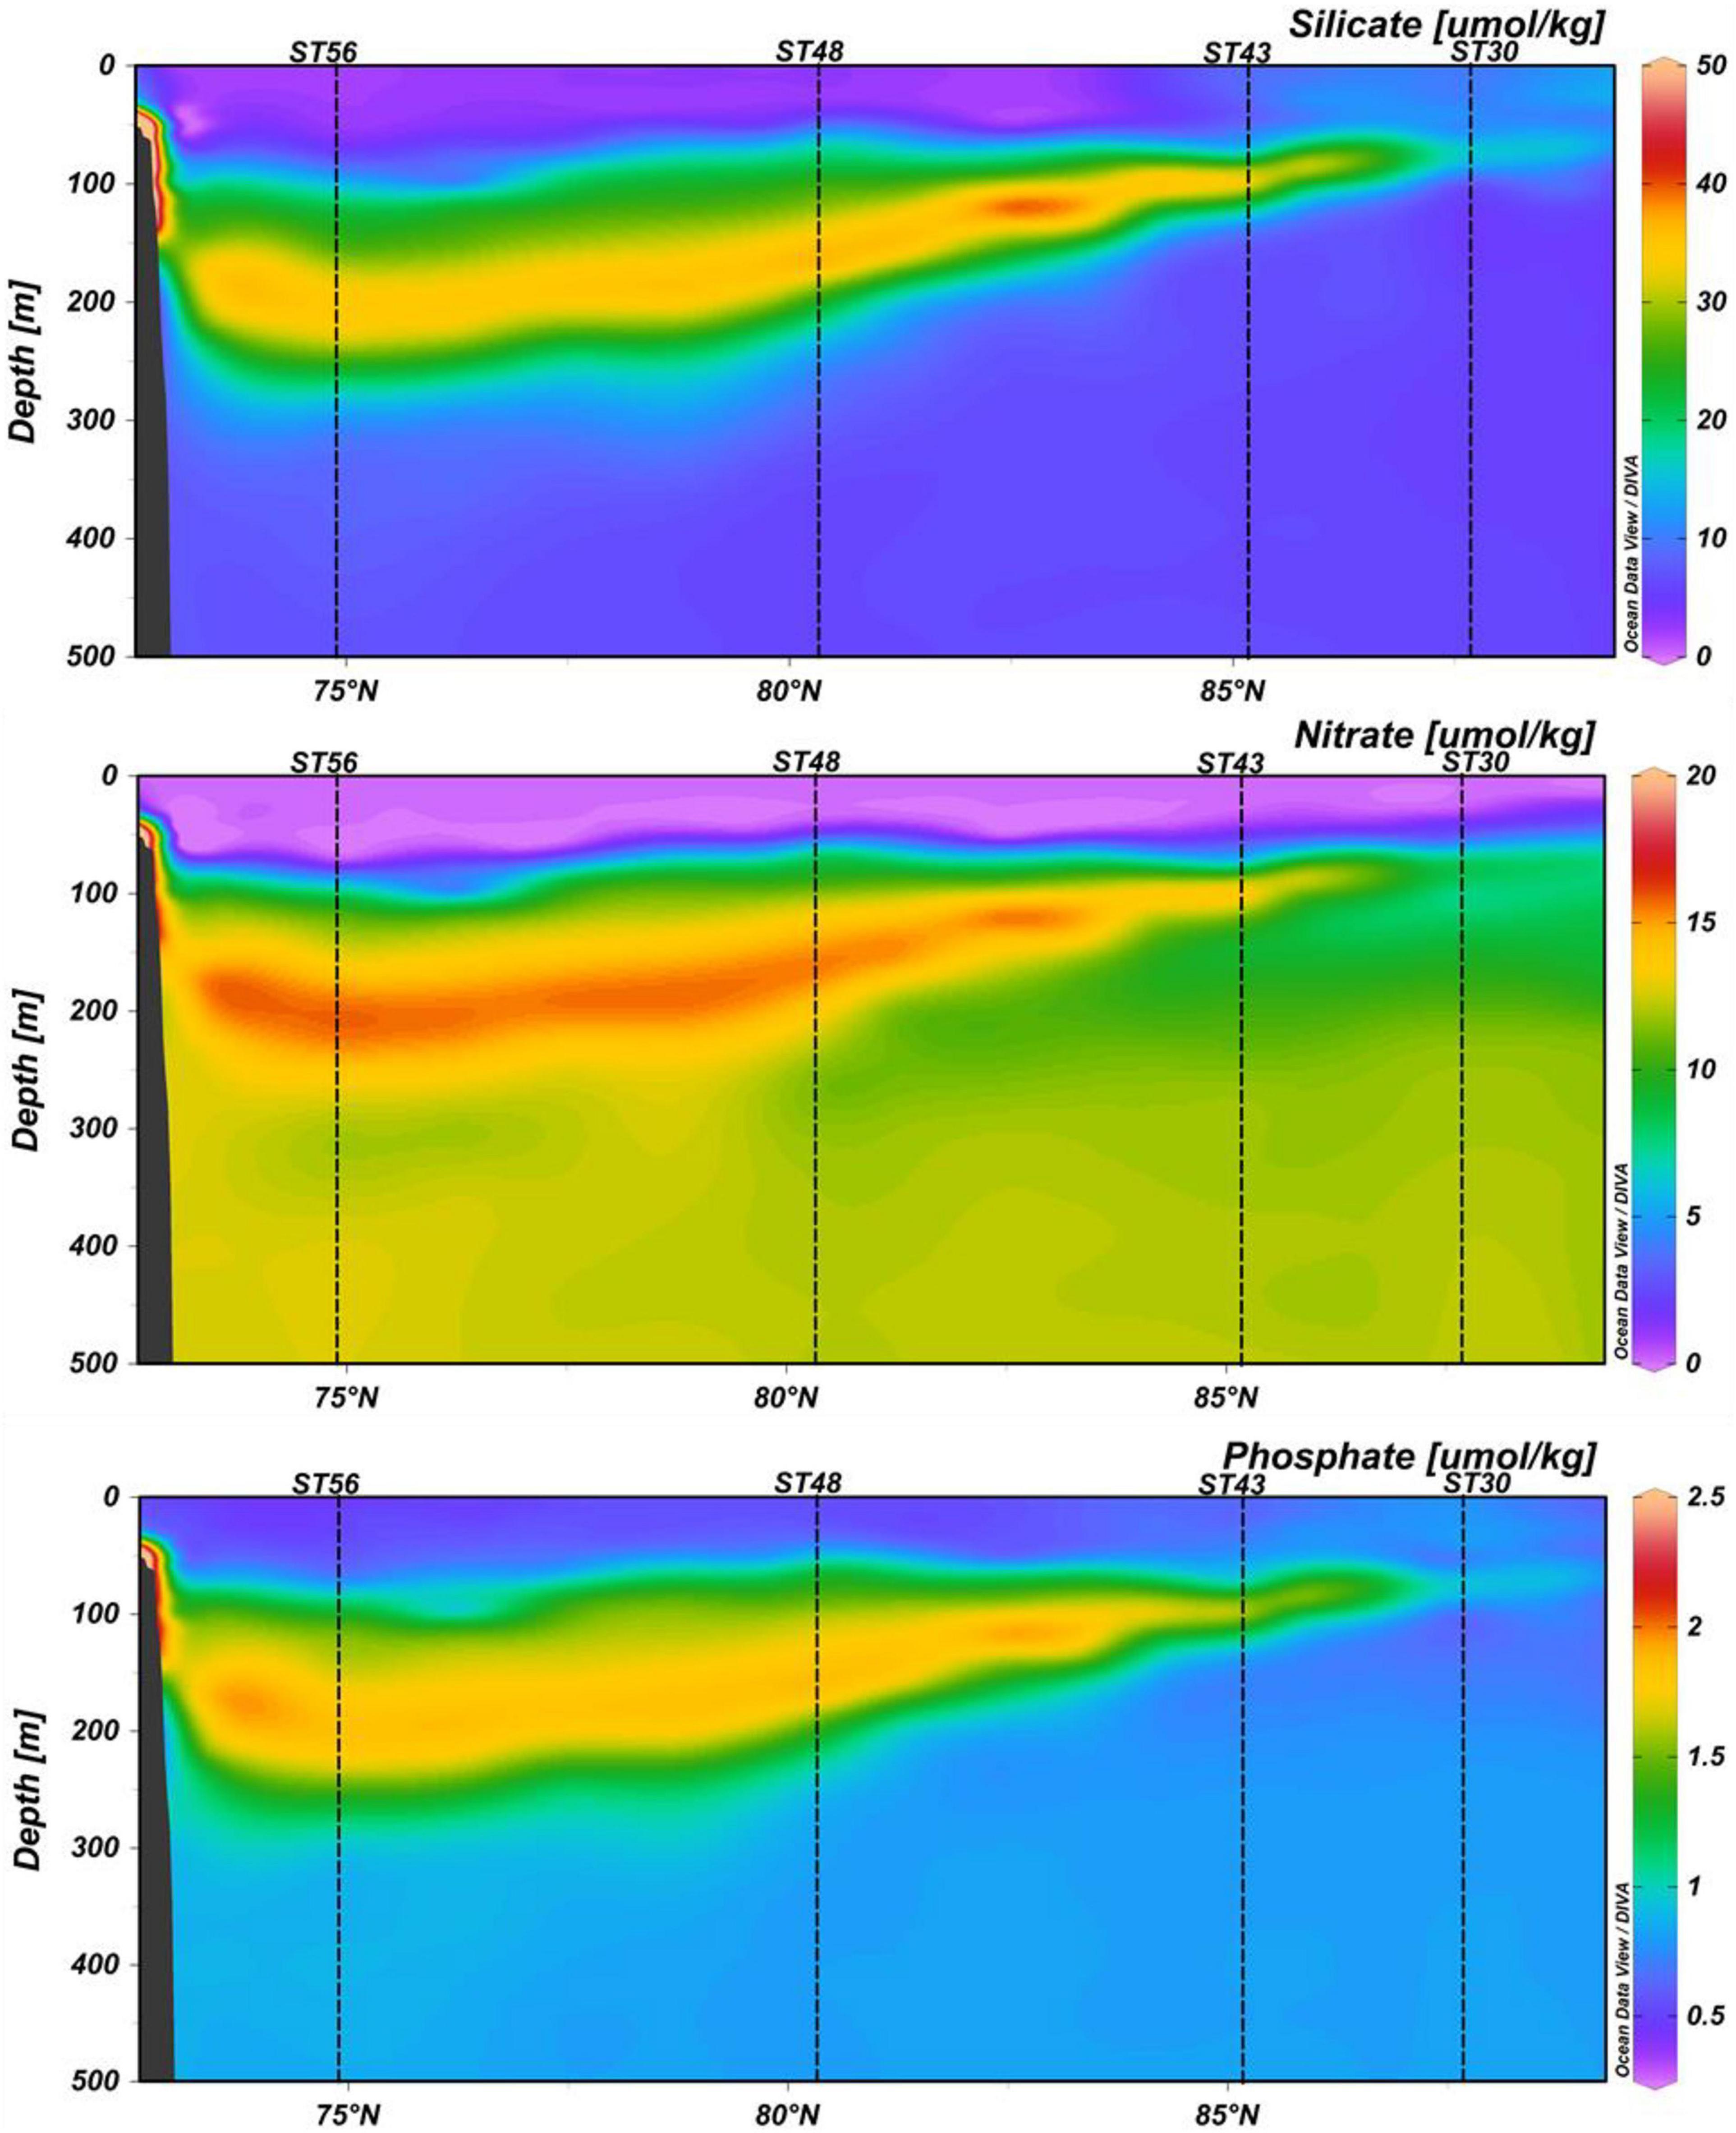
Figure 3. Distribution of silicate (μmol/kg) nitrate (μmol/kg) and phosphate (μmol/kg) in the upper 500 m water column of the sampling transect. The transect images were created using Ocean Data View 5.2.0.
Distribution of 226Ra, 210Pb, and 210Po in the Water Column
The 226Ra activity in the upper 300 m water column ranged from 7.53 ± 0.28 to 14.5 ± 0.5 dpm 100L–1 with lower 226Ra activities at stations 30 and 43 compared to stations 48 and 56 (Figure 4). Elevated 226Ra activities were observed at depths of 75-100 m (station 43), 65–190 m (station 48), and 82–237 m (station 56) (Figure 4). The total 210Po and 210Pb activities (dissolved and particulate) in the upper 300 m water column varied between 0.47 ± 0.06 to 8.2 ± 1.2 dpm 100L–1 and 1.18 ± 0.09 to 11.0 ± 1.0 dpm 100L–1, respectively (Figure 4). There is deficiency of 210Po with respect to 210Pb throughout most of the upper 500 m water column, with exceptions at 225 m for station 43 and at 56 m for station 56, where 210Po activities and 210Pb were similar within uncertainties. The particulate 210Po and 210Pb activities in the large particles varied between 0.016 ± 0.001 to 2.32 ± 0.04 dpm 100L–1 and 0.054 ± 0.004 to 2.50 ± 0.06 dpm 100L–1, respectively, with stations 30 and 43 having lower particulate 210Po activities (Figure 5). The total particulate (large + small) activities of 210Po and 210Pb followed a similar trend (Supplementary Figure 2) with an exception at station 56 where the 210Po activities were higher at 25 and 56 m depth and similar at 86 m depth. The 210Pb and 210Po data for dissolved and particulate samples are archived on BCO-DMO website5,6 and 7 (Baskaran and Krupp, 2020; Maiti and Bam, 2020a,b).
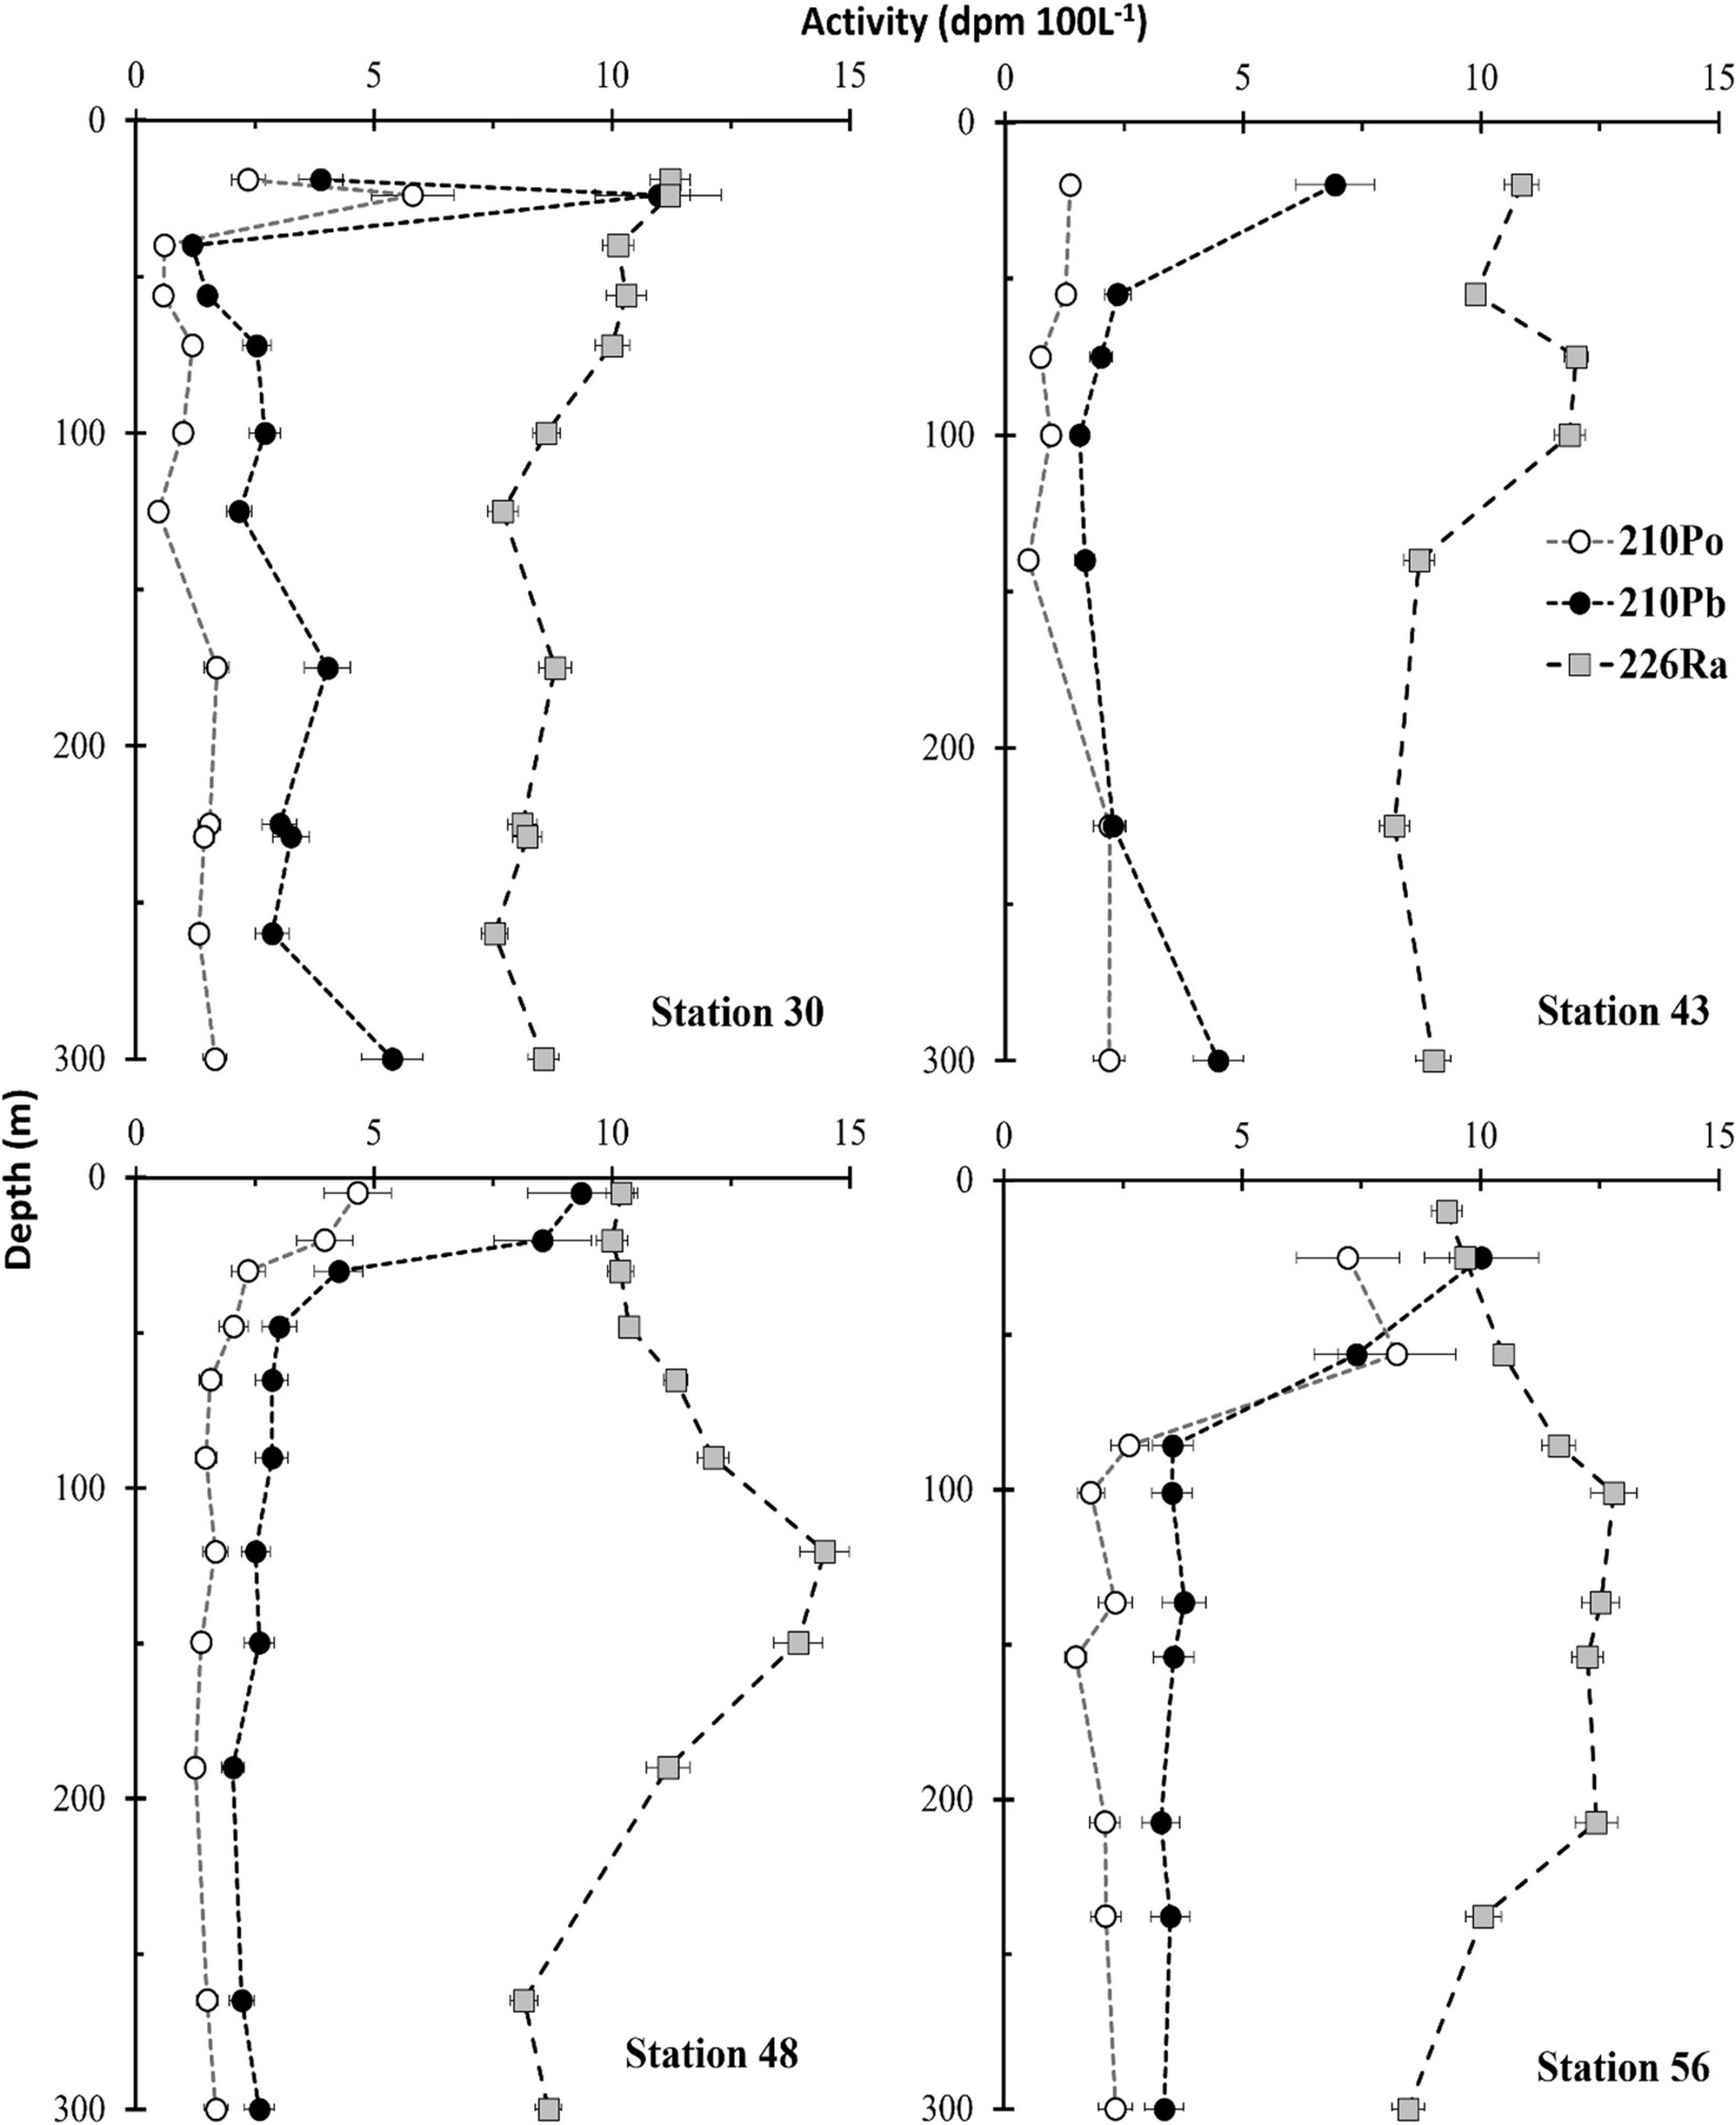
Figure 4. The water column profiles of total 210Po (open circle), 210Pb (filled circle), and 226Ra (filled square) at each station.
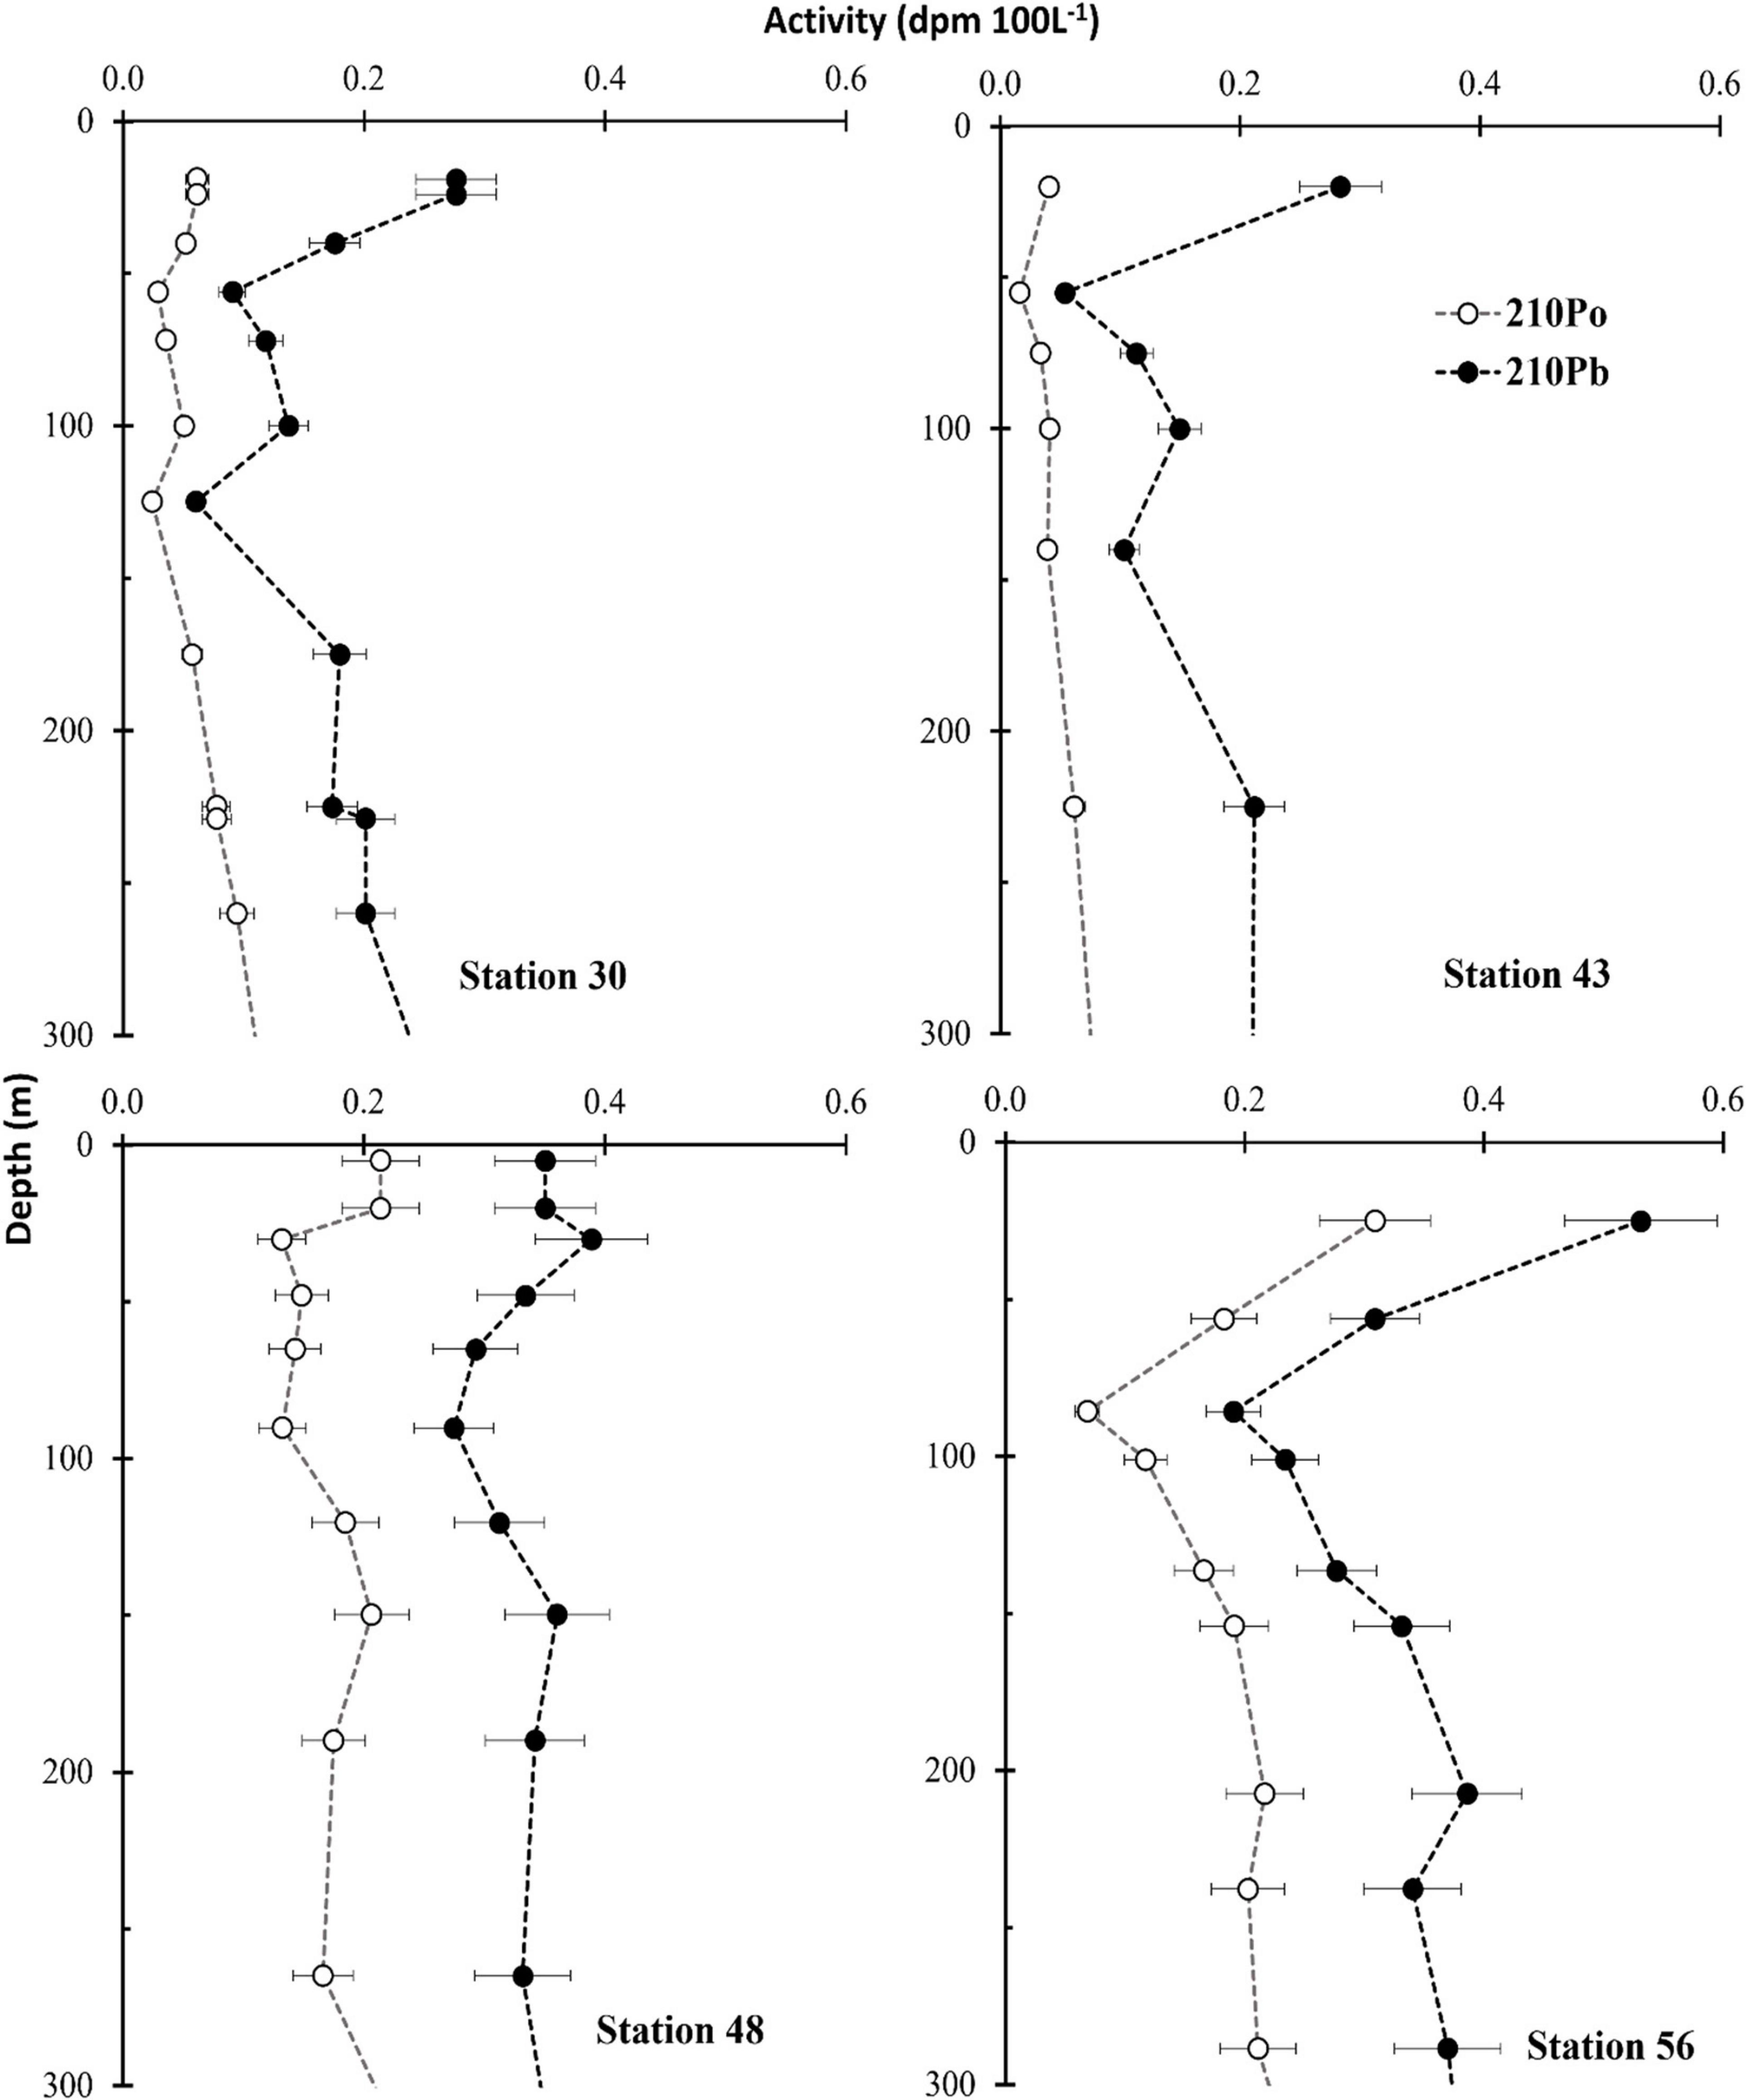
Figure 5. The water column profile of large particulate 210Po (open circle) and 210Pb (filled circle) at each station.
The total 210Pb/226Ra activity ratio in the mixed layer (50 m) varied from 0.12 to 1.1 showing a progressively decreasing trend toward north. The total activity ratio of 210Po/210Pb ranged from 0.19 to 1.11 and was <0.75 for 90% of the sample in the upper 300 m water column, indicating high particle scavenging intensity and low remineralization rate of organic matter.
Distribution of Particulate C, N, and bSi in the Water Column
The POC and PN concentrations ranged from 0.002 ± 0.001 to 0.158 ± 0.002 μmol L–1 and below detection limit to 43.9 ± 0.2 nmol L–1, respectively (Supplementary Figure 3). The PIC and bSi concentration ranged from below detection limit to 0.005 ± 0.001 μmol L–1 and 0.78 ± 0.29 to 85.5 ± 0.3 nmol L–1, respectively (Supplementary Figure 3). The POC content was higher for station 30 compared to other stations, whereas PIC content was higher for station 43 and 48 compared to station 30. The PN and bSi concentrations were lowest for station 56, which also had lower PIC concentrations. In general, POC, PIC, PN, and bSi concentration decreased significantly with depth in the upper 100 m.
Radionuclide and Elemental Fluxes
Water column 210Pb and 210Po fluxes were calculated according to eqn 3 and 4, respectively, at the base of the euphotic zone (100 m) as well as at 50 m and 100 m below the base of the euphotic zone (150 and 200 m water depth). The 210Pb fluxes ranged between 5.04 ± 0.92 and 6.20 ± 0.92 dpm m–2, d–1 with highest 210Pb flux at station 48 and lowest at station 56 (Figure 6A). The 210Pb fluxes for all the stations were similar within uncertainties. The 210Po flux ranged between 8.26 ± 0.89 and 21.0 ± 1.9 dpm m–2 d–1 with highest 210Po flux observed at station 56 and lowest at station 30 (Figure 6B).
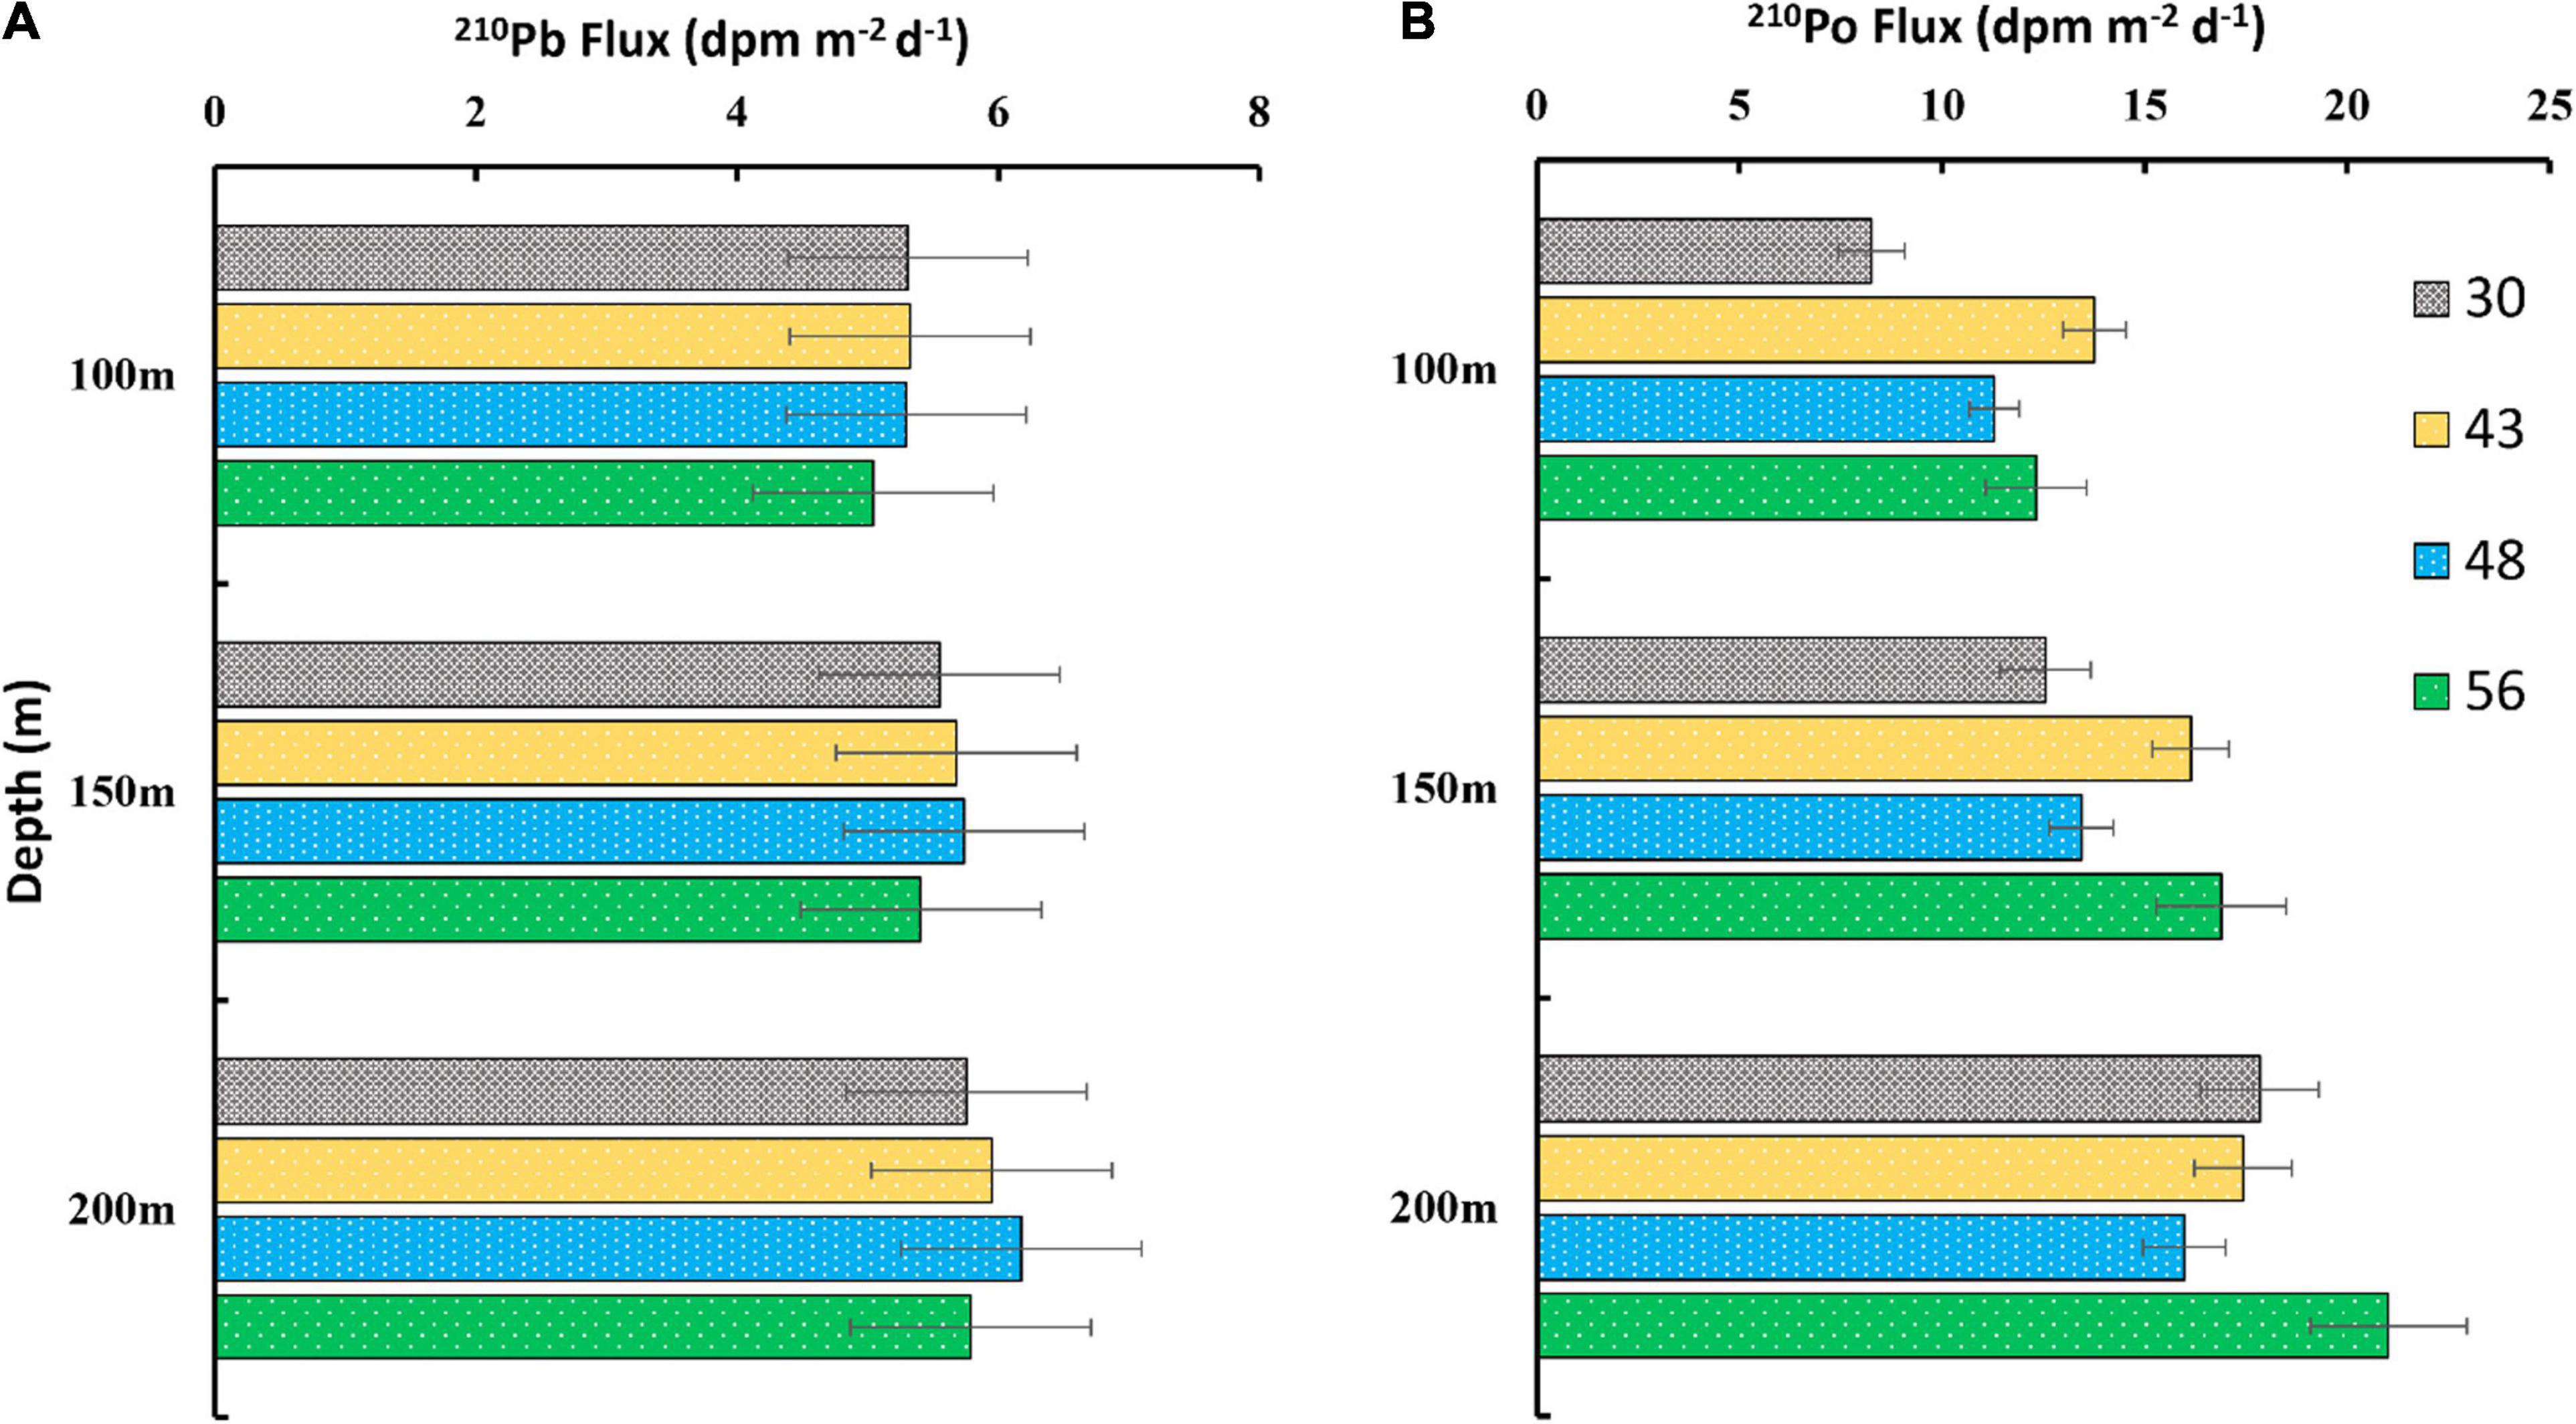
Figure 6. (A) 210Po and (B) 210Pb fluxes calculated at 100 m, 150 m and 200 m depth.
In order to translate these water column fluxes of 210Po and 210Pb to elemental fluxes, corresponding depth distribution of POC/210Po, PN/210Po, PIC/210Pb, and bSi/210Pb ratio at each station is needed (Figure 7). The POC/210Po ratio ranged between 1.04 ± 0.41 and 257 ± 11 μmol dpm–1 (Figure 7A), PN/210Po ranged from 0.11 ± 0.06 to 35.2 ± 1.5 μmol dpm–1 (Figure 7B). PIC/210Pb ranged from 0.13 ± 0.03 to 2.12 ± 0.63 μmol dpm–1 (Figure 7C) and bSi/210Pb ranged from 0.19 ± 0.07 to 18.1 ± 0.9 μmol dpm–1 (Figure 7D). On average, station 30 had higher ratio of POC/210Po and PN/210Po and station 43 had higher bSi/210Pb ratio than other stations. These values are comparable to the previously reported water column activities from the region (He et al., 2015; Roca-Martí et al., 2016).
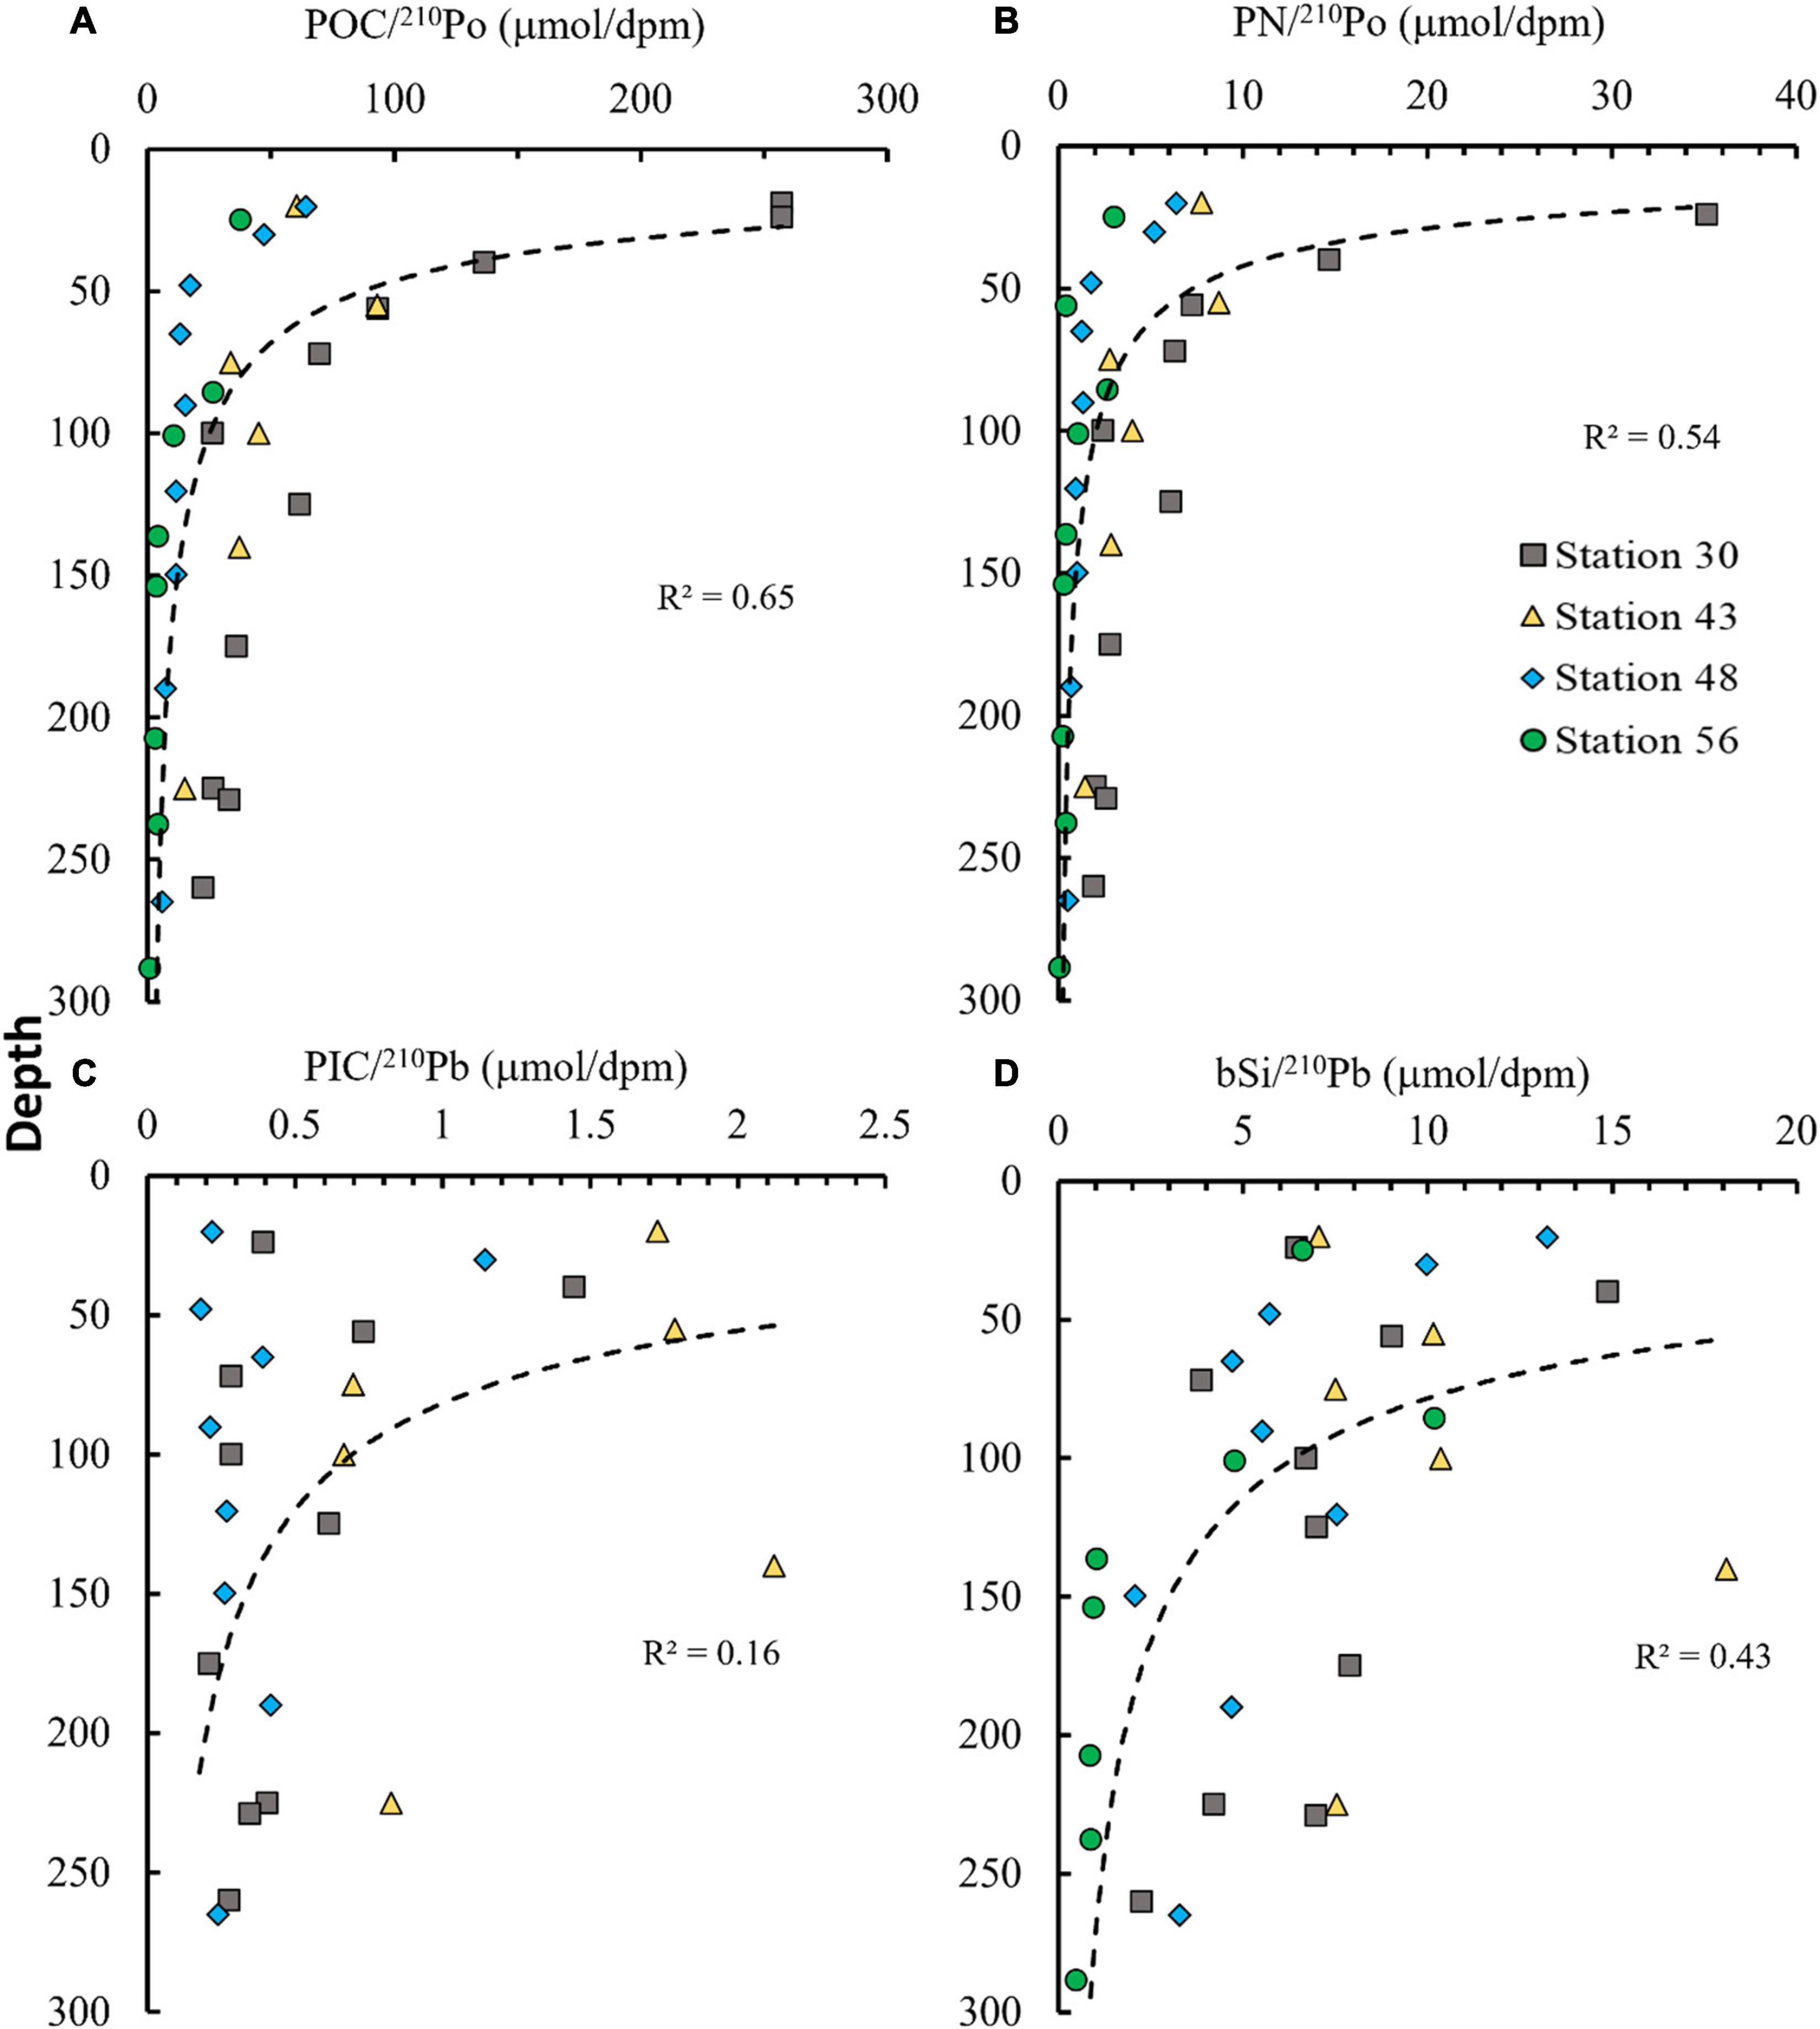
Figure 7. The ratios of (A) POC/210Po, (B) PN/210Po, (C) PIC/210Pb and (D) bSi/210Pb in the large particulate samples for upper 300 m water column depth. The dashed black line represents the power function fitted using the samples collected in upper 300 m depth.
The POC, PN, PIC, and bSi export fluxes were calculated according to eqn 5 at the base of euphotic zone (100 m) as well as at 150 and 200 m depth horizons to estimate the production export and flux attenuation with depth. The POC flux varied between 1.59 ± 0.16 and 7.43 ± 0.41 mg C m–2 d–1 at 100 m (Figure 8A). Similarly, it varied between 0.75 ± 0.07 and 7.23 ± 0.41 mg C m–2 d–1 at 150 m and 1.1 ± 0.10 to 4.86 ± 0.40 mg C m–2 d–1 at 200 m (Figure 8A). The POC flux was highest at station 43 and lowest at station 56. The PN flux ranged from 0.18 ± 0.02 to 0.78 ± 0.04 mg N m–2 d–1 at 100 and 200 m, ranged from 0.08 ± 0.008 to 0.65 ± 0.04 mg N m–2 d–1 at 150 m and 0.11 ± 0.01 to 0.48 ± 0.04 mg N m–2 d–1 (Figure 8B). The flux was higher at the ice stations compared to open water stations with decreasing trend from North to South. The spatial distribution trend of POC and PN fluxes were similar. The POC and PN fluxes estimated using POC/Po and PN/Po ratio in 1–51 um size fraction were in general found higher by up to a factor 2 compared to those estimated using the POC/210Po ratio in the >51 um size fraction (Supplementary Tables 1, 2). This observation is similar to what other studies have reported and can be attributed to the fact that not all suspended particles in 1–51 μm sink fast enough to contribute to the net sinking fluxes (Buesseler et al., 2006; Tang and Stewart, 2019; Bam and Maiti, 2021). The flux estimates using POC/210Po ratio on smaller size fraction particles tend to overestimate when compared with sediment traps, as a significant portion of this pool can be slow sinking particles whose contribution to net flux is reduced by remineralization in the water column. Thus, we suggest that the flux estimate is probably lower bound by the estimates from large particle ratio and upper bound by estimates from small particle ratio.
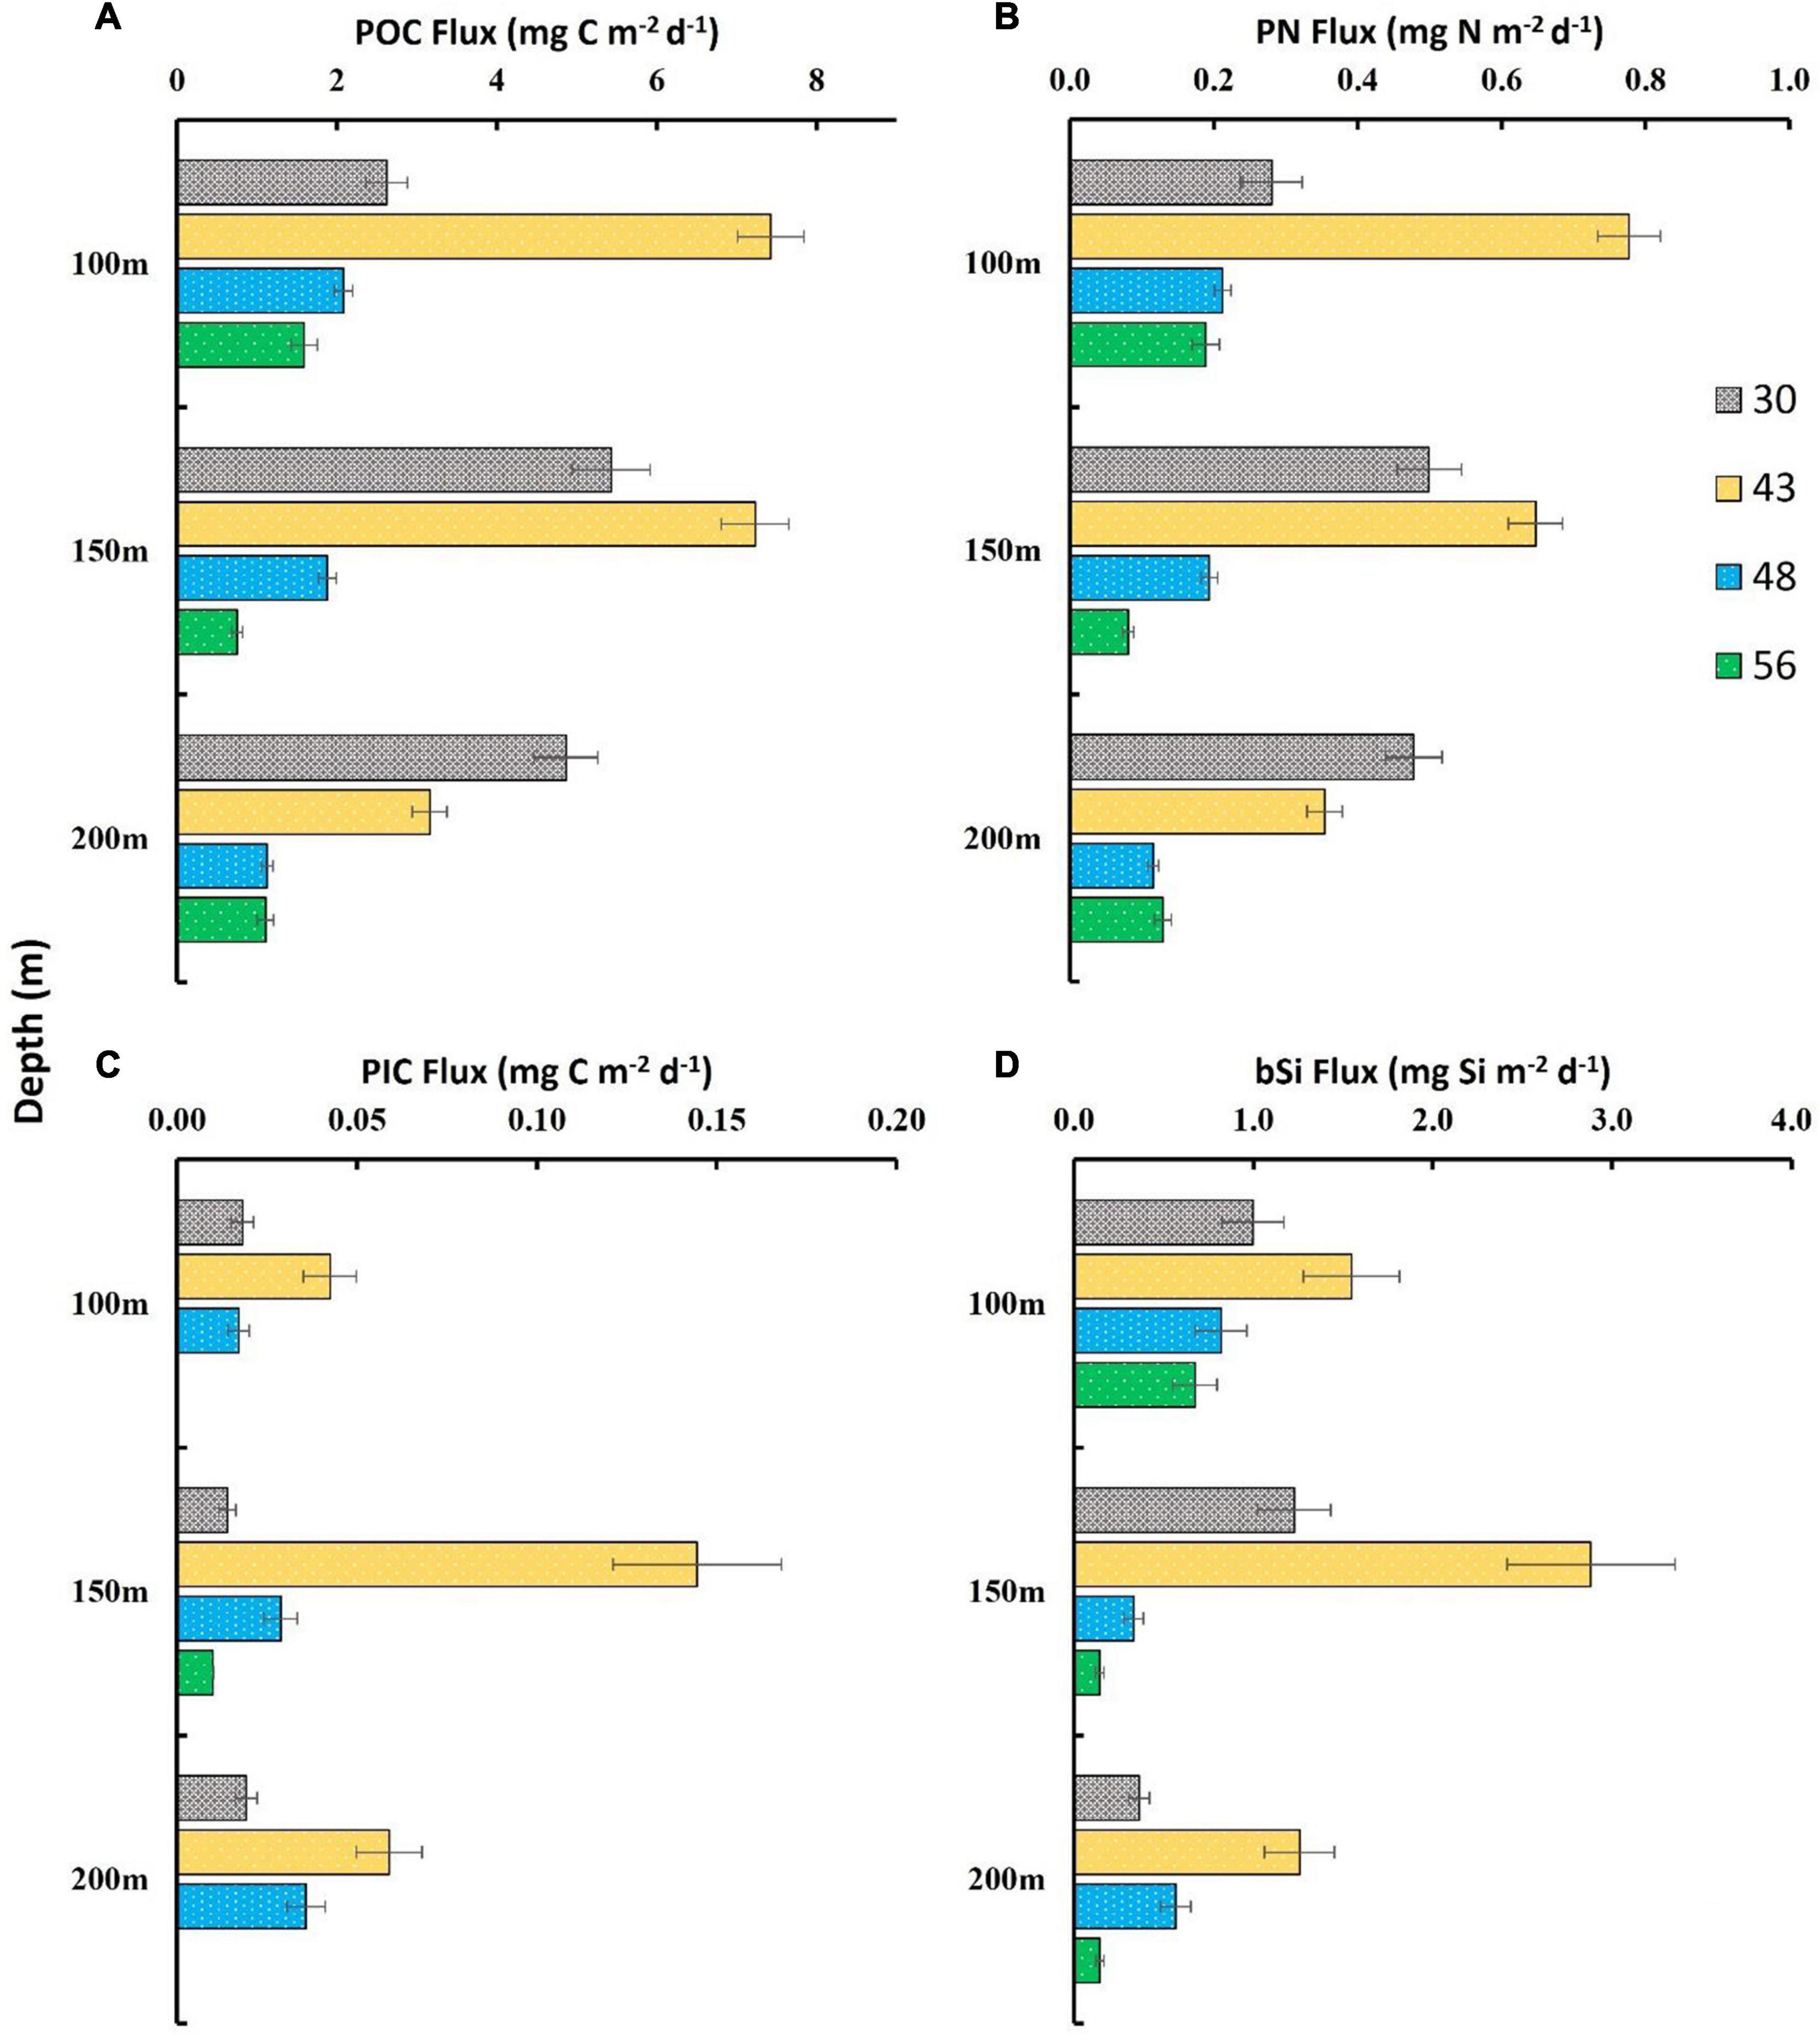
Figure 8. Export fluxes of (A) POC, (B) PIC, (C) PN, and (D) bSi in the water column.
The PIC fluxes in all stations were low and varied from below detection limit to 0.042 ± 0.007 mg C m–2 d–1 at 100 m, 0.010 ± 0.001 to 0.145 ± 0.023 at 150 m, and 0 to 0.059 ± 0.009 mg C m–2 d–1 at 200 m depth (Figure 8C). Overall, station 48 had the highest and station 56 had the lowest PIC flux (Figure 8C). The bSi flux ranged from 0.67 ± 0.12 to 1.54 ± 0.26 mg Si m–2 d–1 at the euphotic zone (Figure 8D). The bSi flux ranged from 0.14 ± 0.02 to 2.88 ± 0.46 and 0.14 ± 0.02 to 1.25 ± 0.19 at 150 m and 200 m depths, respectively (Figure 8D). Station 43 had the highest bSi flux, followed by stations 30, 48, and 56. The spatial distribution trend of bSi and PIC fluxes were similar expect for station 56, where extremely low PIC fluxes were observed at 100 m and 200 m. PIC and bSi fluxes were also estimated by utilizing Po fluxes (Supplementary Tables 3, 4) which were higher than 210Pb estimates. The 210Po based fluxes represent the fluxes integrated over shorter time scale whereas the 210Pb based fluxes represent the fluxes integrated over a longer time scale. The major reasons for difference in PIC and bSi fluxed based on 210Pb and 210Po is discussed in the section below.
Discussion
Water Mass Structure and 226Ra, 210Pb, and 210Po Distribution
The hydrological characters and elemental distribution in the Western Arctic are mainly determined by water masses with unique thermohaline macronutrient distribution (Aagaard et al., 1985; Aagaard and Carmack, 1989; Rudels, 2015; Carmack et al., 2016). The basin wide water column section of temperature and salinity showed the mixed layer was limited to upper ∼50 m. During the sampling transect, four major water masses were encountered – the surface polar mixed layer (PML) (0–50 m), upper halocline layer (UHL) (50–150 m), lower halocline layer (LHL) (150–400 m), and Makarov/Amundsen basin single halocline (50–300 m) (Jensen et al., 2019).
The 226Ra activities are similar in the mixed layers across all the sampling stations and showed a general decrease in activities with depth, similar to earlier results (Moore and Smith, 1986; and other articles). At certain discrete depths, 226Ra activities were elevated and these depths also correspond to nutrient maximum in the halocline (Figures 3, 4). The general pattern of increase in 226Ra activities as a function of increase in the silicate concentration were found to be similar to the previously reported relationship showing – Δ226Ra/ΔSi = 0.1 dpm/100 μ mol (Broecker et al., 1976; Moore and Smith, 1986). Previous studies have also reported such concurrent increase in phosphate, silicate, and 226Ra in the Arctic basin which were attributed to the halocline water (Kinney et al., 1970; Moore et al., 1983; Moore and Smith, 1986). The elevated 226Ra activities observed between 100 and 200 m at station 56 is likely related to the shelf-modified Pacific inflow of water, whereas the elevated 226Ra activities observed between 100–200 m and 75–125 m at station 43 and station 48, respectively, are probably associated with Chukchi winter water (CWW), remnant winter water (RWW), and meteoric cold water (MCW) associated with ice melt that has been carried by the TPD (Kipp et al., 2018). The higher nutrients concentrations and 226Ra activities at this depth likely represent the different water masses and circulation pattern compared to the surface and below the halocline. 226Ra activities in the upper 100 m were found to be consistently higher than that of total 210Pb activities (210Pb/226Ra < 1) which is due to the low 210Pb atmospheric input of 0.12–0.22 dpm cm–2 y–1 in the Arctic (Baskaran, 2011). In most oceans, the contribution of 210Pb from atmospheric fallout to the upper ∼500 m is higher and thus, the 210Pb/226Ra activity ratio is usually > 1.0 in surface waters (Bacon et al., 1976; Cochran et al., 1983; Rigaud et al., 2015; Niedermiller and Baskaran, 2019).
The total activities of 210Po and 210Pb in the water column showed a general decrease in activity with depth (Figure 4). In the Arctic Ocean beside atmospheric deposition, additional surface input of 210Pb is possible during the melting of sea ice which can trap atmospheric flux of 210Pb (Masqué et al., 2007; Chen et al., 2012). The 210Pb input from sea-ice melting is probably not significant, as previous estimates indicate that melting all of sea ice in the Arctic can only contribute up to 10% of the 210Pb inventory in the region (Smith et al., 2003; Masqué et al., 2007; Roca-Martí et al., 2016). However, release of ice-rafted sediment (IRS) from sea ice melt can release a large amount of 210Pb, as its concentration in IRS has been reported to be 1–2 orders of magnitude higher than those in the Arctic benthic sediments (Baskaran, 2005). The largest 210Po – 210Pb disequilibria were observed in the surface layers of most stations, which is expected due to increased biological scavenging of 210Po with respect to 210Pb in the euphotic layer as well the atmospheric deposition which has 210Po/210Pb AR of < 0.1. However, permanently sea ice covered station 30 was an exception where we did not observe a 210Po-210Pb disequilibrium in the surface layer (Figure 4). The particulate 210Pb activities were also higher in the surface layer which could be attributed to release of particles from melting of sea ice at partially ice-covered stations 43 and 48 and lateral input from the adjacent area for station 56. In the Arctic, particle Po/Pb ratio are mostly < 1 in this study which is consistent with other results from the Arctic but contrast with ratios > 1 reported in other oceanic settings. This is probably due to (i) lower atmospheric input of 210Pb in the Arctic and (ii) release of the lithogenic particulate materials during the melting of sea-ice, which contributes higher proportion of 210Pb in the water column resulting in Po/Pb ratio < 1. Thus sea-ice dynamics plays an important role in the distribution of particulate 210Po-210Pb in the Arctic Ocean.
The low activities of 210Pb and 210Po and high activities of 226Ra observed in the nutrient rich water mass indicate scavenging of 210Po and 210Pb by particles and lateral transport of shelf-derived 226Ra (Baskaran et al., 2021). The relative increase in the 210Po and 210Pb activities below 150 m depth compared to halocline at stations 30 and 43 likely indicate lateral transport of particulate material by the Transpolar drift and Beaufort Gyre. The 210Pb and 226Ra distribution appear to be predominantly regulated by the shelf-basin interactions and the halocline water circulation in this region. The particulate and total 210Po and 210Pb activities in this study were similar to previously reported activities in this region (Smith et al., 2003; He et al., 2015; Roca-Martí et al., 2018). The activity ratios of 210Po/210Pb and 210Pb/226Ra showed the preferential scavenging of 210Po and 210Pb, respectively, throughout the upper 300 m of the water column for all the stations. Further, the spatial pattern in 210Po/210Pb and 210Pb/226Ra ratios demonstrate low scavenging rates at higher latitudes in the Arctic basin.
210Pb and 210Po Fluxes
The export fluxes of 210Pb at the base of the euphotic zone, were found to be similar for stations 30, 43 and 48 whereas station 56 had lower 210Pb flux (Figure 6A). The 210Pb fluxes increased with depth at all stations. The sharp increase in the 210Pb fluxes between 100 and 250 m at stations 48 and 56 can be attributed to the lateral input of particulate matter from the inflow of Pacific water and the Beaufort Gyre. Previous sediment trap studies in the interior Canadian Basin have reported significant contribution of lateral input to the vertical flux (Honjo et al., 2010). We utilized previously reported water column activities of 226Ra and 210Pb (Smith et al., 2003) to estimate 210Pb fluxes for three stations in proximity of station 48 and 56. The estimated fluxes for these three stations ranged from 5.32 to 5.48 dpm m–2 d–1 and 5.94 to 6.38 dpm m–2 d–1 at 100 m and 200 m, respectively, which is similar to our current estimates (4.99–6.18 dpm m–2 d–1).
There are spatial differences in 210Po fluxes at the four stations, which did not follow any latitudinal trend (Figure 6B). Station 56 in the Canadian basin had the highest 210Po flux which is expected due to higher particle scavenging in the slope area compared to interior stations. The 210Po fluxes varied between 8.26–13.76 7.23 dpm m–2 d–1 and 12.54–16.89 dpm m–2 d–1 at 100 and 150 m, respectively (Figure 6B), which are higher than previously reported 210Po fluxes in the Arctic Ocean. Roca-Martí et al. (2016) reported 210Po fluxes of 7.2 dpm m–2 d–1 and 3.7 dpm m–2 d–1 at 150 m for two stations in the central Arctic which are in proximity of our stations 30 and 43. The higher observed fluxes at stations 30 and 43 is likely due to the sea ice dynamics. Roca-Martí et al. (2016) sampled during the record sea-ice minimum with mostly single year ice whereas during our sampling in 2015 multi-year sea-ice was observed. The particulate 210Po and 210Pb were found to be orders of magnitude higher during our sampling, pointing to the possible increased input of sediment from melting of multi-year sea-ice which could result in higher 210Po fluxes. The 210Po fluxes estimated using previously reported data (Smith et al., 2003) ranged between 3.95–6.69 dpm m–2 d–1 and 5.29–7.42 dpm m–2 d–1 at 100 m and 200 m depth, respectively. These stations were in proximity to our stations 48 and 56 and the fluxes are lower than our current estimates (8.26–21.0 dpm m–2 d–1). 210Po fluxes in this region is overall lower compared to other regions of the world ocean (Murray et al., 2005; Wei et al., 2011; Anand et al., 2018; Bam and Maiti, 2021). In the future, the 210Po and 210Pb fluxes in the Arctic might change with changing Arctic climatic conditions such as rapid ice melting, increased ice algae growth and enhanced transport of shelf sediments but our current comparison of fluxes with data collected over two decades back (Smith et al., 2003) showed no significant differences. However, it must be noted that large spatiotemporal variability in this region can result in export fluxes varying by a factor of 7 (Roca-Martí et al., 2016). Thus, it will be difficult to identify any recent changes unequivocally in a single study, unless time series measurements are carried out at a particular site for several years.
Distribution of Elemental and Radionuclide Ratios
The higher concentration of POC and PN in surface water at station 30 (Supplementary Figure 3) could be attributed to the supply of POC and PN from melting of the ice (Yu et al., 2012). In the central Arctic, there is no direct external input of POC (Xiang and Lam, 2020) even though the TPD influences the distribution of trace metal and dissolve organic matter (Kipp et al., 2018; Charette et al., 2020). Overall, the surface water in the top 20 m had the highest concentration of POC, PIC, PN and bSi. PIC concentrations were low throughout this region and was below detection limit at station 56 (Supplementary Figure 3). The coccolithophores are the major source of PIC in the ocean and the lower concentration of PIC indicates the absence of coccolithophores in the Arctic waters (Honjo et al., 2010, Xiang and Lam, 2020 and references therein). The total bSi concentration were relatively higher in the shelf/slope region (station 48 and 56) compared to interior station (30 and 43) (Supplementary Figure 3), which is attributed to the diatoms. In the Arctic Ocean, diatoms are major phytoplankton community responsible for > 45% of the total primary production (Coupel et al., 2012; Balch et al., 2014).
The ratios of POC/210Po, PN/210Po in the water column decreased with depth following a general power law (Figures 7A,B) as previously observed by number of studies (Maiti et al., 2008; Tang and Stewart, 2019; Bam and Maiti, 2021). This is expected because of the remineralization of particulate organic matter during settling through the water column and preferential association of 210Po with POC (R2 = 0.65) and PN (R2 = 0.54). The PIC/210Pb and bSi/210Pb ratios did not show such well-defined power law attenuation with depth (Figures 7C,D). This is because both bSi and PIC will solubilize with depth, with the solubility of bSi being much faster than PIC in the water column (Cappellen et al., 2002; Rickert et al., 2002). For all four ratios, maximum variability is observed in the upper 100 m layer, which is due to high biological activity in the euphotic zone. The shelf station 56 had the lowest POC/210Po ratio while station 30 had the highest POC/210Po ratios. This gradual poleward increase in POC/210Po ratio could be due to change in the phytoplankton communities as the station transited from open ocean to permanently sea-ice covered. In the western Arctic Ocean, the coccolithophores and foraminifera are nearly absent thus resulting in low PIC/210Pb ratio (Coupel et al., 2012, 2015; Xiang and Lam, 2020). On the other hand, the bSi/210Pb ratios in the water column were relatively high compared to other oceans due to the abundance of diatoms in the western Arctic (Lalande et al., 2009; Boetius, 2013).
Elemental Fluxes From the Euphotic Zone
In the Arctic, the export production is high during the early summer. The sampling for this study was carried out from August – October which represents the end of high productive season. The 138 days half-life of 210Po results in fluxes integrated over seasonal timescales. Thus, the 210Po flux reported here probably reflects average export for the entire summer season. In the central Arctic, the export fluxes are highest during June-August and ice algae contributes significantly to the export fluxes (Fahl and Nöthig, 2007; Lalande et al., 2009). The 210Po based POC flux estimates at 100 m depth varied widely with higher values in the northern ice-covered stations and lowest in the Canada basin (station 56) (Figure 8A). A previous study showed that the POC exports are greater in areas with sea-ice coverage than in open water (Roca-Martí et al., 2016). Similarly, the studies from the central Arctic using different method (234Th-238U) showed POC fluxes to be less than 60 mg C m–2 d–1 (Moran et al., 1997; Baskaran et al., 2003; Roca-Martí et al., 2016). In contrast, He et al. (2015) reported 210Po based POC export fluxes to vary between 2.7 and 31 mg C m–2 d–1 with fluxes decreasing northward. A comprehensive analysis of reported POC flux in the published literature from the Arctic Ocean shows that POC export fluxes vary between 0.23 and 216 mg C m–2 d–1 (Table 1) which are difficult to compare given the inherent differences in various flux estimation methods (Maiti et al., 2016; Anand et al., 2018). For example, the POC flux estimated using 234Th-238U methods are higher than 210Po-210Pb and traps in the compiled literature (Table 1). The highest fluxes are reported from the marginal seas where biological productivity is expected to be higher while the lowest fluxes are in the central Arctic. Our study indicates that the POC export at the pole is higher than other parts of the deep basin pointing to the importance of sea-ice algae in driving POC fluxes in ice covered region. Ice algae and diatoms are the major component influencing the export fluxes of production in the Arctic Ocean (Lalande et al., 2009; Boetius, 2013).
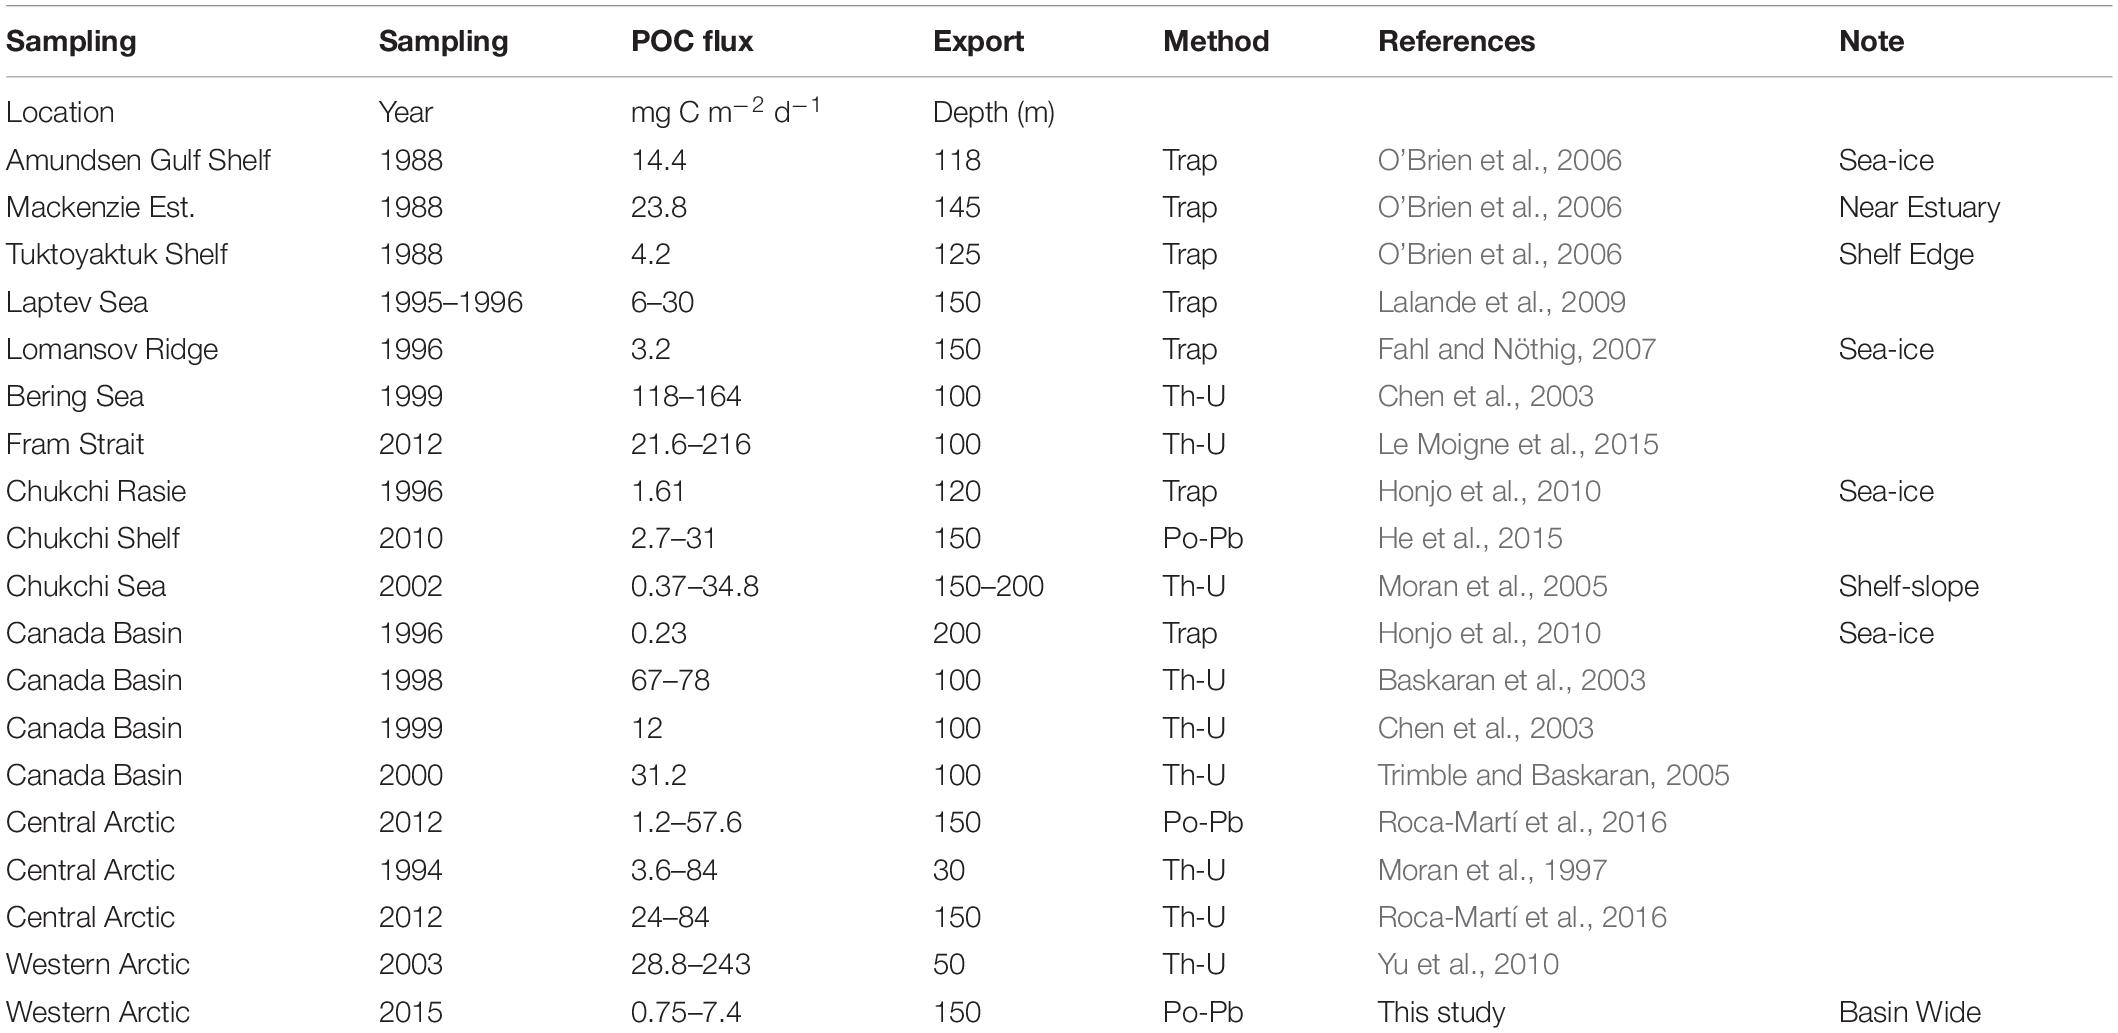
Table 1. Published data on POC fluxes in the Arctic Ocean.
With increasing freshwater input and associated terrestrial organic matter in the Arctic, it is crucial to understand the source of the POC contributing to this downward flux. The δ13C composition of POC indicate predominantly marine origin of POC and PN at all the four stations (Figure 9A; Xiang and Lam, 2020). The δ13C-DIC in the water column can provide relative estimate of primary productivity (Ko and Quay, 2020) while δ13C POC in large particle can help understand the source of POC contributing to fluxes (Griffith et al., 2012; Tolosa et al., 2013; Xiang and Lam, 2020). The higher δ13C-DIC values are associated with enhanced biological productivity in the water column (Ko and Quay, 2020). The value of δ13C-DIC values ranged from −0.04 to 1.47%, with station 48 having higher values (Figure 9B) indicating higher productivity. The difference in the δ13C-DIC for the stations suggest the difference in the magnitude of primary productivity among stations. δ13C-DIC in the top 100 m is usually depleted compared to the surface due to uptake of CO2 and incorporation of lighter 12C by the phytoplankton into organic matter (Bauch et al., 2015). The top 100 m is biological active as reflected by the higher fluorescence content (Figure 2C). Thus, δ13C-DIC water column distribution suggests that station 48 might have higher primary productivity followed by station 43 and then station 30. The δ13C POClarge values were greatly depleted (-30.8 ± 5.7% to −24.45 ± 0.4%), indicating the POC is predominately supplied by marine sources (Xiang and Lam, 2020; Figure 9A). The δ13C POC values are similar to values reported by Brown et al. (2014) in the central Canada Basin. In general, the phytoplankton in open ocean show δ13C values ranging −25 to −18%, however, the δ13C POC in polar systems pelagic and sea ice can exhibit −20 to −34.7% (Sallon et al., 2011; Pineault et al., 2013; Brown et al., 2014). Further, the highly depleted δ13C POClarge might also reflect the slow growth rates of the phytoplankton (Fry, 1996; Griffith et al., 2012; Tolosa et al., 2013), and temperature effect (Rau et al., 1989). This suggests that POC in the upper water column is supported by sea ice and not from terrestrial sources, despite the strong riverine input of POC at the coastal and shelf region, which continues to increase due to increasing river discharge and coastal erosion (Rachold et al., 2000, 2004; Krishnamurthy et al., 2001).
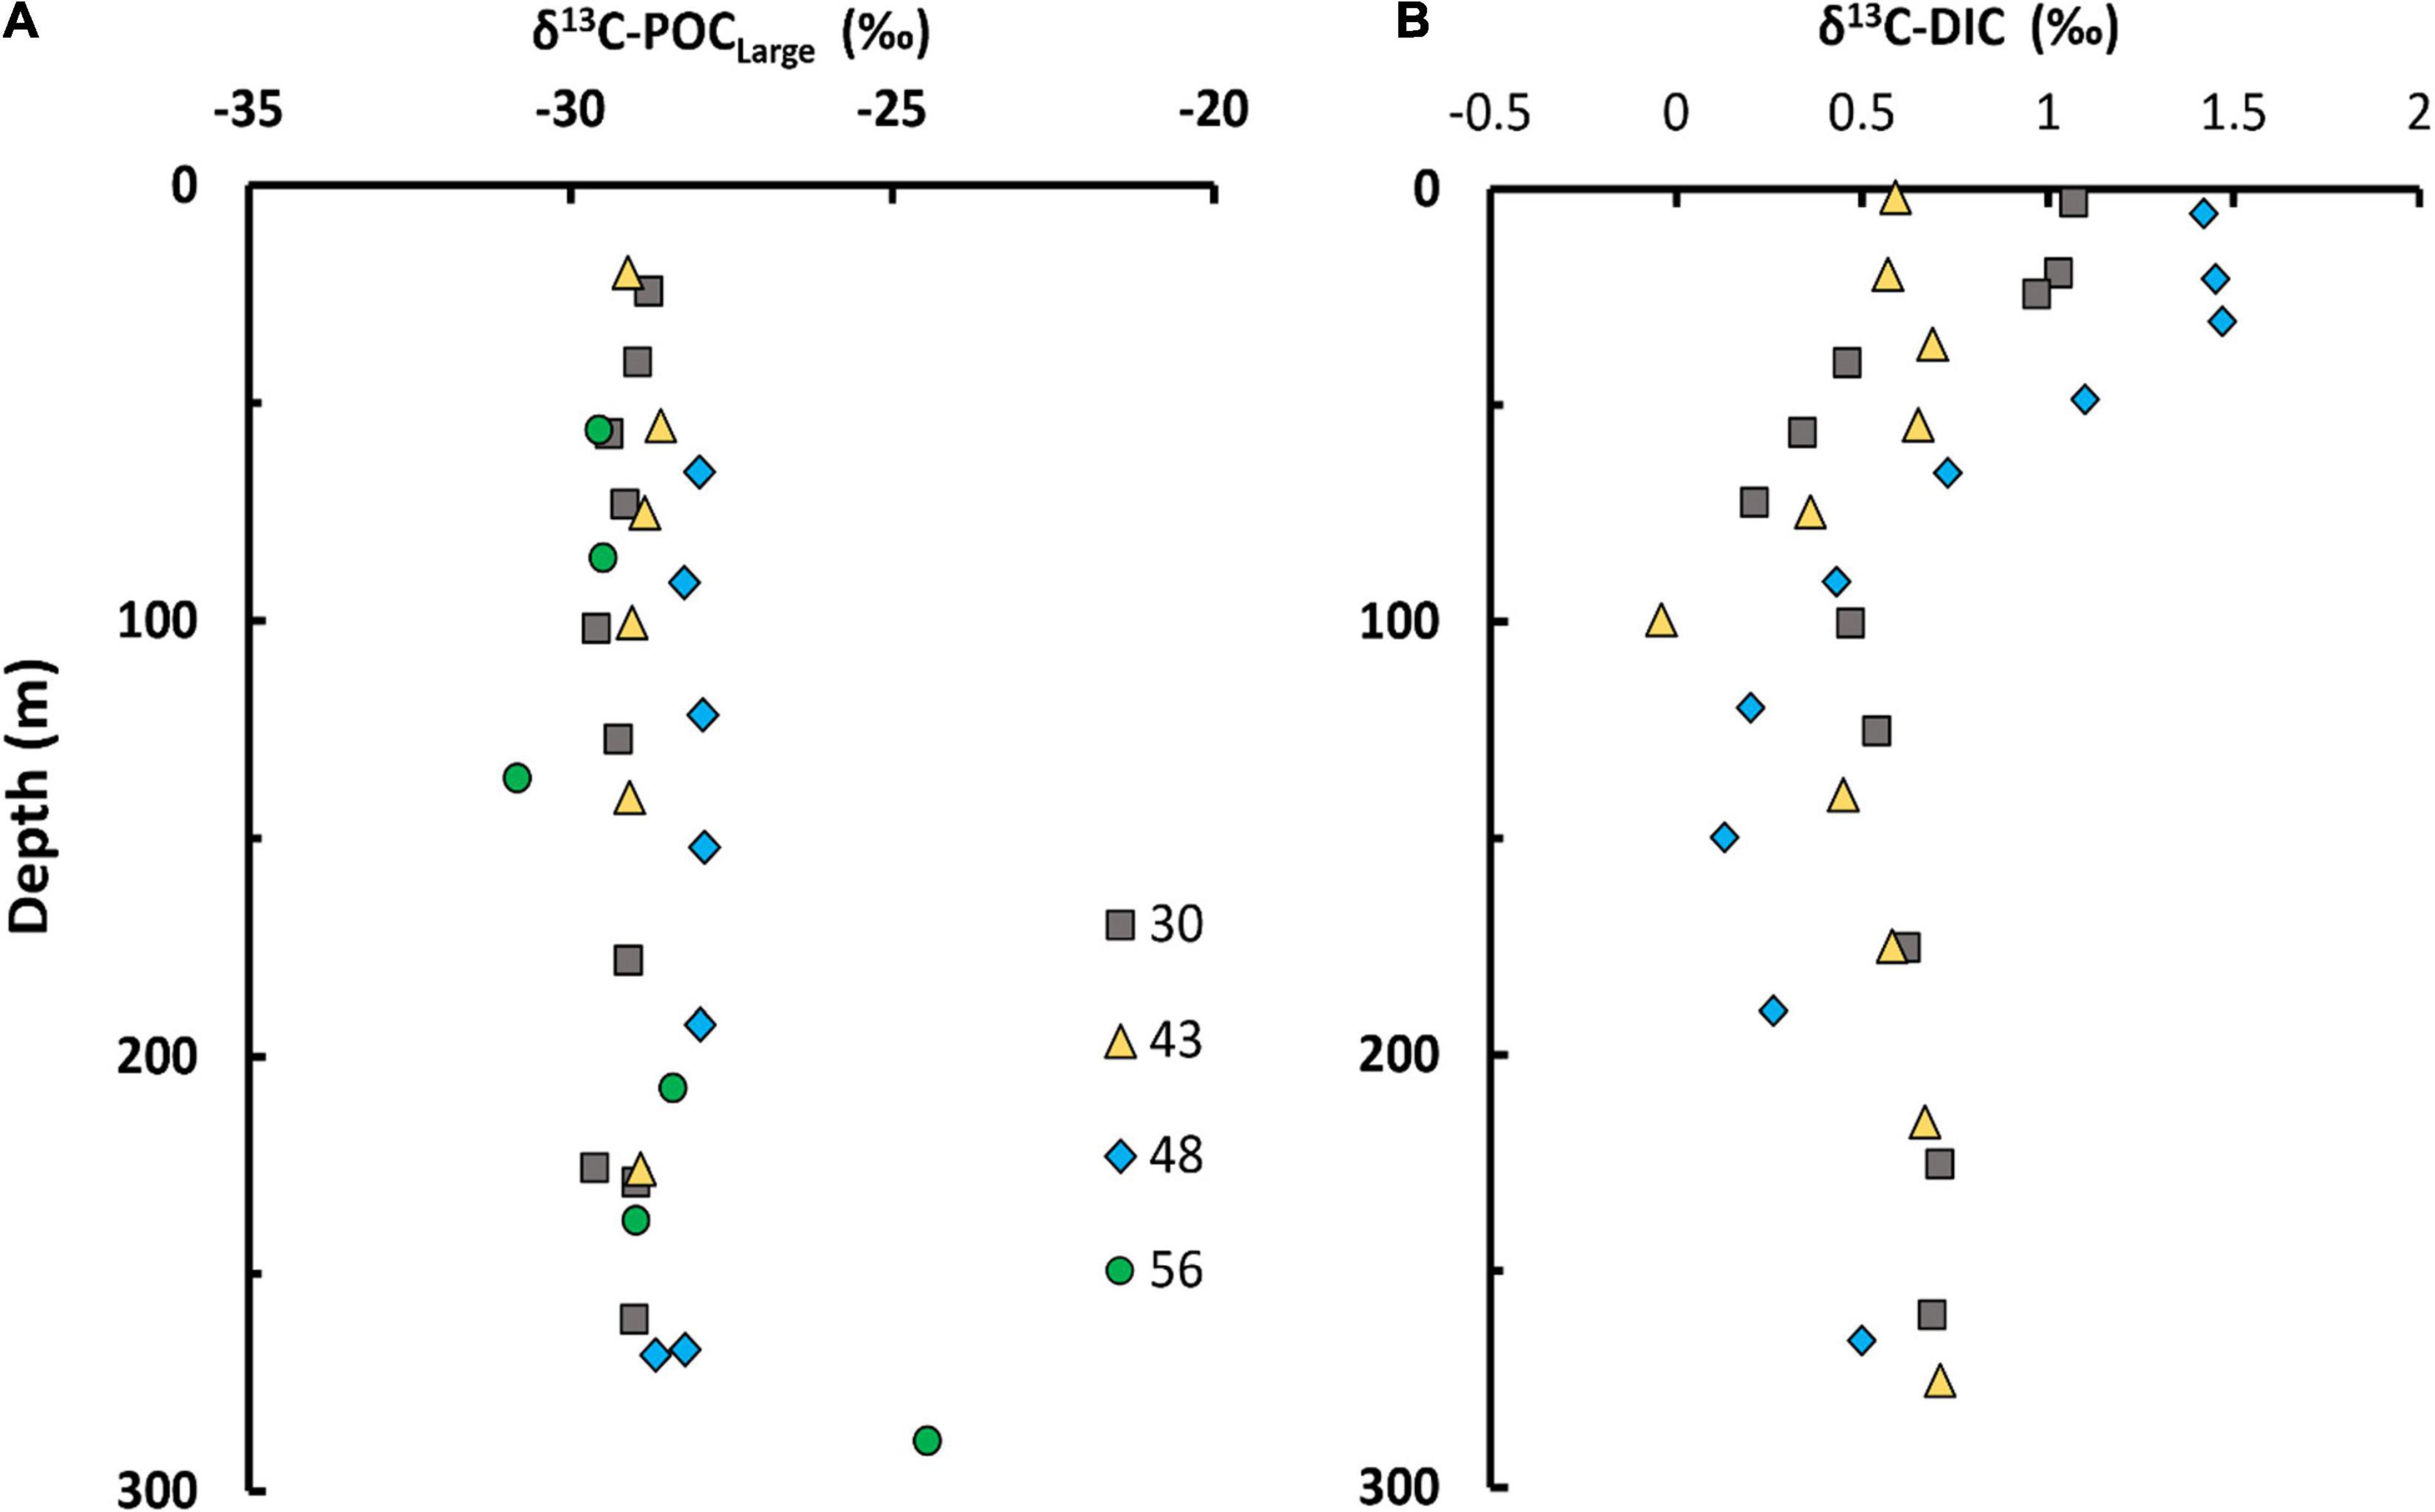
Figure 9. (A) δ13CPOC and (B) δ13CDIC distribution in the water column and large (>51um) particles.
The 210Po and 210Pb fluxes can both be used to estimate the bSi and PIC fluxes. However, there are some fundamental differences on which tracer better represents the fluxes of inorganic material such as bSi and PIC. The key differences are due to (i) the bioaccumulation and adsorption of 210Po and 210Pb in the phytoplankton and particles and (ii) the flux integration timescale. Previous studies have reported differences in the bioaccumulation of 210Po and 210Pb in phytoplankton (Fisher et al., 1983; Stewart and Fisher, 2003a,b). 210Po is incorporated inside the cells of phytoplankton while the 210Pb is mostly bound to cell walls (Fisher et al., 1983; Friedrich and Rugters van der Loeff, 2002). A recent study by Lin et al. (2021) showed the difference in binding capacity of 210Po and 210Pb in diatoms and coccolithophore. Therefore, it is expected that 210Pb would be a better tracer for inorganic components whereas 210Po would better reflect the organic component. Using the 210Po, 210Pb and 234Th, Friedrich and Rugters van der Loeff (2002) showed that 210Po and 234Th fluxes were more useful to estimate POC and 210Pb to estimate bSi. For this study, bSi and PIC fluxes are estimated from 210Pb fluxes although bSi and PIC fluxes based on 210Po fluxes are also included in supplementary data (Supplementary Tables 3, 4). 210Pb fluxes represent longer time scale for the export compared to 210Po based fluxes which represent much shorter seasonal scale. Thus, a direct comparison of 210Pb based and 210Po based fluxes is not appropriate but in general 210Po based fluxes tend to be higher than 210Pb fluxes. The bSi and PIC fluxes showed a similar trend with highest fluxes at station 43 followed by stations 30, 48 and 56 (Figures 8C,D). Based on the low PIC and bSi fluxes at station 30, we attribute the POC flux at station 30 is mostly contributed by the sea algae. The PIC fluxes were extremely low because the primary productivity in this region is currently driven by picoplankton, diatoms, and green algae such as prasinophytes (Lalande et al., 2009; Boetius, 2013; Metfies et al., 2016). However, the eco-regime shifts to coccolithophore, and diatoms blooms are expected (Forest et al., 2008; Honjo et al., 2008) which could increase the PIC and bSi fluxes in future. Due to the ballast effect, the increase in the PIC and bSi fluxes could potentially result in increase of POC and PN fluxes. Biominerals or lithogenic particles increase the density of sinking, particles because of their high density and higher specific gravity, thus increasing the sinking rates and POC export fluxes known as ballast effect.
The primary productivity in the Arctic has been increasing over the last couple of decades (Arrigo and van Dijken, 2011), however, this enhanced productivity might not necessarily translate to larger POC exports fluxes due to changing Arctic environmental conditions as new conditions favor phytoplankton community structure which is based on the smaller cells (Li et al., 2009). With the changes in the phytoplankton community structure due to the changes in environmental conditions such as ice melting, nutrient input and temperature, the magnitude of export flux will be impacted. If the smaller cell phytoplankton community is favored, the export flux might decrease while the larger phytoplankton community could lead to increase in flux. Thus, the changing climatic and environmental conditions could directly or indirectly impact not only the marine carbon cycle but also the trace elements and nutrients distribution in the Arctic Ocean.
Particle Flux Attenuation and Lateral Input in Mesopelagic Zone
The POC fluxes at 150 m and 200 m depth were estimated to understand the particle attenuation and the remineralization below the euphotic zone. At station 30, the POC and PN fluxes increased by factor of 2 at 150 m and subsequently decreased to 15% at 200 m depth with respect to the fluxes measured at 100 m (Figure 8A). This increase in the POC and PN fluxes at 150 m could be attributed to lateral transport by the RWW and MCW. The particle attenuation and remineralization were higher at station 43, 48 and 56 which is expected due to high nutrient rich water. At station 56, POC and PN fluxes were 50% lower at 150 m than at 100 m (Figures 8A,B). However, there was 45% increase in POC and PN fluxes between 150 and 200 m which suggests contribution from lateral transport by inflow of Pacific water. The lower halocline layer with Pacific nutrient rich water is located between 150 and 400 m depth which contributed to the lateral transport of organic matter. The bSi flux at 150 m increase at station 30 and 43 whereas it decreased for stations 48 and 56 compared to the flux estimates at 100 m depth (Figure 8D). High concentration of bSi were observed at station 43 and other nearby stations which could possibly be due to sporadic sinking of ice diatoms such as Melsoria arctica (Fahl and Nöthig, 2007; Lalande et al., 2014). Station 43 is covered with the sea ice during most of the time. The RWW and MCW cold water from TPD and the edge of the high nutrient water with sea ice on the top makes this station one of the most dynamics and interesting in terms of biogeochemical interaction. These combined physical and hydrological characteristics probably enhanced the export fluxes.
Export Efficiency
The export efficiency or e-ratio is defined as the ratio of export flux and net primary productivity (NPP). The mean NPP reported were 265 mg C m–2 d–1 in the Beaufort Basin, 195 mg C m–2 d–1 in Chukchi Basin (Arrigo and van Dijken, 2011) and 12–84 mg C m–2 d–1 in the central Arctic Ocean (Fernandez-Mendez et al., 2015). The average annual export efficiency (>30%) is high in the Arctic Waters (Henson et al., 2015). Since the NPP data during our sampling time was not available, the export efficiency was estimated using the average NPP values for sea-ice covered and open water areas from Fernandez-Mendez et al. (2015),. The export efficiency ranged from 5 to >50% with lowest export efficiency in the slope (5–15%) and highest in the sea-ice covered stations (12–50%). Previous studies have reported export efficiency > 30% in the Eurasian Basin (Gustafsson and Andersson, 2012), 26% in the Canada Basin (Chen et al., 2003), and >30% in the central Arctic (Roca-Martí et al., 2016) which are within the range of this study. The export efficiencies estimated in the Arctic Ocean are higher compared to other oceans (Buesseler et al., 1992, 1995, 1998; Bacon et al., 1996; Murray et al., 1996; Buesseler and Boyd, 2009; Haskell et al., 2013; Anand et al., 2018; Laws and Maiti, 2019; Bam and Maiti, 2021) probably due to lower metabolic rates associated with colder temperature. The lower export efficiency in the slope (station 56) and central Canada basin (station 48) compared to ice-covered interior stations 43 and 30 suggest higher recycling of the particles in the slope and central Canada basin which could be related to relatively higher microbial respiration at these stations compared to colder ice-covered stations.
Conclusion
We estimated the export flux of POC, PN, PIC, and bSi based on the 210Po and 210Pb fluxes obtained during the 2015 US Arctic GEOTRACES cruise in the western Arctic Ocean. Overall, the vertical fluxes of the four key elements remain extremely low throughout the upper 200 m of the ocean. The low fluxes of bSi and PIC indicate that ballast particle fluxes which represent an important mechanism of POC transport to deep ocean are orders of magnitude lower than other regions of the global ocean, similar to what has been shown using deep sediment trap studies (Honjo et al., 2010). The overall low vertical fluxes of POC and prominent influence of lateral transport presented in this study concurs with previous work which suggested that the biological pump is currently inefficient in the cryopelagic Canada Basin. Thus, in this region a lateral POC pump from the shelf/slope region might be playing a more dominant role in transporting POC to the deeper basin.
Our study showed that the particulate organic matter in the western Arctic basin is predominantly the result of in-situ biological activities supported by biological pump. Thus, any changes to the in-situ primary production in the western region will influence the export efficiency and overall carbon cycling. In this study, the production export showed an increasing tend toward north with station 43 having the highest export fluxes. The projected melting of sea ice in future can result in large changes to the top Polar Mixed layer which can potentially transform the biological pump in this region (Macdonald et al., 2002). Thus, it is pertinent that carbon cycling and accompanying biogeochemical responses in the rapidly changing Arctic be closely monitored as it can have far reaching global impact in the future.
Data Availability Statement
The original contributions presented in the study are included in the article/Supplementary Material, further inquiries can be directed to the corresponding authors.
Author Contributions
WB: data curation, formal analysis, methodology, validation, writing-original daft, review, and editing. KM: conceptualization, funding acquisition, methodology, supervision, validation, writing-review, and editing. MB: conceptualization, funding acquisition, methodology, writing-review, and editing. All authors contributed to the article and approved the submitted version.
Funding
Funding for ship time, sampling operations, and hydrographic data was supported by the US National Science Foundation to the US GEOTRACES Western Arctic Management team. This research was funded by the US National Science Foundation grant NSF-OPP-1435376 to KM and NSF-PLR-1434578 to MB. Partial funding for open access publication was provided by Louisiana State University Library Open Access Fund.
Conflict of Interest
The authors declare that the research was conducted in the absence of any commercial or financial relationships that could be construed as a potential conflict of interest.
Publisher’s Note
All claims expressed in this article are solely those of the authors and do not necessarily represent those of their affiliated organizations, or those of the publisher, the editors and the reviewers. Any product that may be evaluated in this article, or claim that may be made by its manufacturer, is not guaranteed or endorsed by the publisher.
Acknowledgments
We would like to thank the captain and crew of the USCGC Healy. Special thanks to Tim Kenna and Martin Fleisher for collecting dissolved water samples and the pumping group led by Phoebe Lam for the particulate samples. We would also like to thank two reviewers whose comments improved this manuscript, and the chief scientists and Arctic GEOTRACES cruise coordinators, David Kadko and Greg Cutter.
Supplementary Material
The Supplementary Material for this article can be found online at: https://www.frontiersin.org/articles/10.3389/fmars.2021.697444/full#supplementary-material
Supplementary Figure 1 | Water column CTD profiles showing Salinity [%], Fluorescence (0- 5 VDC volts), and Dissolved Oxygen [mg L–1] for all the sampling station. The fluorescence has been magnified 100 times to show on the same x-scale. The top X-axis represents the salinity and fluorescence, and the bottom X-axis represents the dissolved oxygen.
Supplementary Figure 2 | The activity depth profile of particulate (large and small) 210Po (open circle) and 210Pb (filled circle) for the sampling station in the upper 300 m.
Supplementary Figure 3 | POC, PIC, PN, and bSi concentration on the large particle samples for upper 300 m water column depth.
Supplementary Table 1 | POC fluxes in large and small particle fraction sizes using 210Po flux.
Supplementary Table 2 | PN fluxes in large and small particles fraction sizes using 210Po flux.
Supplementary Table 3 | PIC flux estimated based on the 210Pb and 210Po fluxes in large particles.
Supplementary Table 4 | bSi flux estimated based on the 210Pb and 210Po fluxes in large particles.
Footnotes
- ^ https://www.bco-dmo.org/dataset/807340
- ^ https://www.bco-dmo.org/dataset/751211
- ^ https://www.bco-dmo.org/dataset/718440
- ^ https://www.bco-dmo.org/dataset/651599/data
- ^ https://www.bco-dmo.org/dataset/808151
- ^ https://www.bco-dmo.org/dataset/808502
- ^ https://www.bco-dmo.org/dataset/794064
References
Aagaard, K., and Carmack, E. C. (1989). The role of sea ice and other fresh water in the Arctic circulation. J. Geophys. Res. Oceans 94, 14485–14498.
Aagaard, K., Coachman, L. K., and Carmack, E. (1981). On the halocline of the Arctic Ocean. Deep Sea Res. A 28, 529–545. doi: 10.1016/0198-0149(81)90115-1
Aagaard, K., Swift, J. H., and Carmack, E. C. (1985). Thermohaline circulation in the Arctic Mediterranean Seas. J. Geophys. Res. Oceans 90, 4833–4846. doi: 10.1029/JC090iC03p04833
Ahmed, R., Prowse, T., Dibike, Y., Bonsal, B., and O’Neil, H. (2020). Recent trends in freshwater influx to the Arctic Ocean from four major Arctic-draining rivers. Waters 12:1189. doi: 10.3390/w12041189
Anand, S. S., Rengarajan, R., Shenoy, D., Gauns, M., and Naqvi, S. W. A. (2018). POC export fluxes in the Arabian Sea and the Bay of Bengal: a simultaneous 234Th/238U and 210Po/210Pb study. Mar. Chem. 198, 70–87. doi: 10.1016/j.marchem.2017.11.005
Arrigo, K. R., and van Dijken, G. L. (2011). Secular trends in Arctic Ocean net primary production. J. Geophys. Res. 116:C09011. doi: 10.1029/2011JC007151
Bacon, M. P., Cochran, J. K., Hirschberg, D., Hammar, T. R., and Fleer, A. P. (1996). Export flux of carbon at the equator during the EqPac time-series cruises estimated from 234Th measurements. Deep Sea Res. II Top. Stud. Oceanogr. 43, 1133–1153. doi: 10.1016/0967-0645(96)00016-1
Bacon, M. P., Spencer, D. W., and Brewer, P. G. (1976). 210Pb/226Ra and 210Po/210Pb disequilibria in seawater and suspended particulate matter. Earth Planet. Sci. Lett. 32, 277–296.
Balch, W. M., Bowler, B. C., Lubelczyk, L. C., and Stevens, M. W. (2014). Aerial extent, composition, bio−optics and biogeochemistry of a massive under−ice algal bloom in the Arctic. Deep Sea Res. II Top. Stud. Oceanogr. 105, 42–58. doi: 10.1016/j.dsr2.2014.04.001
Bam, W., and Maiti, K. (2021). 210Po-210Pb distribution and carbon export in the northern Gulf of Mexico continental slope. Deep Sea Res. I 172:103535. doi: 10.1016/j.dsr.2021.103535
Bam, W., Maiti, K., Baskaran, M., Krupp, K., Lam, P. J., and Xiang, Y. (2020). Variability in 210Pb and 210Po partition coefficients (Kd) along US GEOTRACES Arctic transect. Mar. Chem. 219:103749. doi: 10.1016/j.marchem.2020.103749
Baskaran, M. (2005). Interaction of sea ice sediments and surface sea water in the Arctic Ocean: evidence from excess 210Pb. Geophys. Res. Lett. 32:L12601. doi: 10.1029/2004GL022191
Baskaran, M. (2011). Po-210 and Pb-210 as atmospheric tracers and global atmospheric Pb-210 fallout: a review. J. Environ. Radioact. 102, 500–513. doi: 10.1016/j.jenvrad.2010.10.007
Baskaran, M., Church, T., Hong, G., Kumar, A., Qiang, M., Choi, H., et al. (2013). Effects of flow rates and composition of the filter, and decay/in-growth correction factors involved with the determination of in-situ particulate 210Po and 210Pb in seawater. Limnol. Oceanogr. Methods 11, 126–128. doi: 10.4319/lom.2013.11.126
Baskaran, M., and Krupp, K. (2020). Particulate & Dissolved Po-210 & Pb-210 in Seawater, Snow, Melt Ponds, Ice Core, Ice-Rafted Sediments, and Aerosols from the US GEOTRACES Arctic Cruise (HLY1502) on USCGC Healy from August to October 2015. Woods Hole, MA: Biological and Chemical Oceanography Data Management Office (BCO-DMO). doi: 10.1575/1912/bco-dmo.794064.1
Baskaran, M., Krupp, K., Bam, W., and Maiti, K. (2021). Recent biogeochemical changes in the Arctic Ocean using 210Po-210Pb-226Ra disequilibria: evidence from 2015 GEOTRACES Arctic cruise. (Submitted)
Baskaran, M., and Santschi, P. H. (2002). Particulate and dissolved 210Pb activities in the shelf and slope regions of the Gulf of Mexico waters. Cont. Shelf Res. 22, 1493–1510. doi: 10.1016/S0278-4343(02)00017-1
Baskaran, M., Swarzenski, P. W., and Porcelli, D. (2003). Role of colloidal material in the removal of 234Th in the Canada basin of the Arctic Ocean. Deep Sea Res. Part 1, 1353–1373.
Bauch, D., Polyak, L., and Ortiz, J. D. (2015). A baseline for the vertical distribution of the stable carbon isotopes of dissolved inorganic carbon (δ13CDIC) in the Arctic Ocean. Arktos 1:15. doi: 10.1007/s41063-015-0001-0
Bauch, D., Schlosser, P., and Fairbanks, R. G. (1995). Freshwater balance and the sources of deep and bottom waters in the Arctic Ocean inferred from the distribution of H218O. Prog. Oceanogr. 35, 53–80. doi: 10.1016/0079-6611(95)00005-2
Boetius, A. (2013). The Expedition of the Research Vessel “Polarstern” to the Arctic in 2012 (ARK−XXVII/3), in Reports on Polar and Marine Research, Report 663. Bremerhaven: Alfred Wegener Inst. for Polar and Mar. Res., 166.
Broecker, W. S., Goddard, J., and Sarmiento, J. L. (1976). The distribution of 226Ra in the Atlantic Ocean. Earth Planet. Sci. Lett. 32, 220–235. doi: 10.1016/0012-821X(76)90063-7
Brown, K. A., McLaughlin, F. A., Tortell, P. D., Varela, D. E., Yamamoto−Kawai, M., Hunt, B., et al. (2014). Determination of particulate organic carbon sources to the surface mixed layer of the Canada Basin, Arctic Ocean. J. Geophys. Res. Oceans 119, 1084–1102. doi: 10.1002/2013JC009197
Buesseler, K., Ball, L., Andrews, J., Benitez-Nelson, C., Belastock, R., Chai, F., et al. (1998). Upper ocean export of particulate organic carbon in the Arabian Sea derived from thorium-234. Deep Sea Res. II Top. Stud. Oceanogr. 45, 2461–2487. doi: 10.1016/S0967-0645(98)80022-2
Buesseler, K. O., Andrews, J. A., Hartman, M. C., Belastock, R., and Chai, F. (1995). Regional estimates of the export flux of particulate organic carbon derived from thorium-234 during the JGOFS EqPac program. Deep Sea Res. II Top. Stud. Oceanogr. 42, 777–791. doi: 10.1016/0967-0645(95)00043-P
Buesseler, K. O., Bacon, M. P., Cochran, J. K., and Livingston, H. D. (1992). Carbon and nitrogen export during the JGOFS North Atlantic bloom experiment estimated from 234Th: 238U disequilibria. Deep Sea Res. A 39, 1115–1137. doi: 10.1016/0198-0149(92)90060-7
Buesseler, K. O., Benitez-Nelson, C. R., Moran, S. B., Burd, A. B., Charette, M. A., Cochran, J. K., et al. (2006). An assessment of particulate organic carbon to thorium-234 ratios in the ocean and their impact on the application of 234Th as a POC flux proxy. Mar. Chem. 100, 213–233. doi: 10.1016/j.marchem.2005.10.013
Buesseler, K. O., and Boyd, P. W. (2009). Shedding light on processes that control particle export and flux attenuation in the twilight zone of the open ocean. Limnol. Oceanogr. 54, 1210–1232. doi: 10.4319/lo.2009.54.4.1210
Cappellen, P. V., Dixit, S., and Beusekom, J. V. (2002). Biogenic silica dissolution in the oceans: reconciling experimental and field−based dissolution rates. Glob. Biogeochem. Cycle 16, 23-1–23-10. doi: 10.1029/2001GB001431
Carmack, E. C., Yamamoto-Kawai, M., Haine, T. W. N., Bacon, S., Bluhm, B. A., Lique, C., et al. (2016). Fresh water and its role in the Arctic marine system: sources, disposition, storage, export, and physical and biogeochemical consequences in the Arctic and global oceans. J. Geophys. Res. Biogeosci. 121, 675–717. doi: 10.1002/2015JG003140
Charette, M., Kipp, L. E., Jensen, L. T., Dabrowski, J. S., Whitmore, L. M., Fitzsimmons, J. N., et al. (2020). The transpolar drift as a source of riverine and shelf−derived trace elements to the central Arctic Ocean. J. Geophys. Res. Oceans 125:e2019JC015920. doi: 10.1029/2019JC015920
Charette, M., and Moore, W. (2020). Radium and Thorium Isotopes Measured in the Western Arctic as Part of the 2015 US GEOTRACES Arctic Cruise on the USCGC Healy (HLY1502) from August to October 2015. Woods Hole, MA: Biological and Chemical Oceanography Data Management Office (BCO-DMO). doi: 10.26008/1912/bco-dmo.718440.3
Chen, M., Huang, Y., Cai, P., and Guo, L. (2003). Particulate organic carbon export fluxes in the Canada Basin and Bering Sea as derived from 234Th/238U disequilibria. Arctic 56, 32–44. doi: 10.14430/arctic600
Chen, M., Ma, Q., Guo, L., Qiu, Y., Li, Y., and Yang, W. (2012). Importance of lateral transport processes to 210Pb budget in the eastern Chukchi Sea during summer 2003. Deep Sea Res. II Top. Stud. Oceanogr. 81-84, 53–62. doi: 10.1016/j.dsr2.2012.03.011
Cochran, J. K. (1992). “The oceanic chemistry of the uranium and thorium series nuclides,” in Uranium-Series Disequilibrium; Applications to Earth, Marine, and Environmental Sciences, eds M. Ivanovich and R. S. Harmon (Oxford: OUP), 334–395.
Cochran, J. K., Bacon, M. P., Krishnaswami, S., and Turekian, K. K. (1983). 210Po and210Pb distributions in the central and eastern Indian Ocean. Earth Planet. Sci. Lett. 65, 433–452. doi: 10.1016/0012-821X(83)90180-2
Coupel, P., Jin, H. Y., Joo, M., Horner, R., Bouvet, H. A., Sicre, M. A., et al. (2012). Phytoplankton distribution in unusually low sea ice cover over the Pacific Arctic. Biogeosciences 9, 4835–4850. doi: 10.5194/bg-9-4835-2012
Coupel, P., Matsuoka, A., Ruiz-Pino, D., Gosselin, M., Marie, D., Tremblay, J. E., et al. (2015). Pigment signatures of phytoplankton communities in the Beaufort Sea. Biogeosciences 12, 991–1006.
Cutter, G., Kadko, D., and Landing, W. M. (2019). Bottle Data from the CTD−ODF Carousel on the GEOTRACES Arctic Section Cruise (HLY1502) from August to October 2015 (U.S. GEOTRACES Arctic Project). Dataset Version 2019−07−29. Woods Hole, MA: Biological and Chemical Oceanography Data Management Office (BCO−DMO). doi: 10.1575/1912/bco-dmo.646825.4
Dickson, R., Rudels, B., Dye, S., Karcher, M., Meincke, J., and Yashayaev, I. (2007). Current estimates of freshwater flux through Arctic and subarctic seas. Prog. Oceanogr. 73, 210–230. doi: 10.1016/j.pocean.2006.12.003
Fahl, K., and Nöthig, E. M. (2007). Lithogenic and biogenic particle fluxes on the Lomonosov Ridge (central Arctic Ocean) and their relevance for sediment accumulation: vertical vs. lateral transport. Deep Sea Res. I 54, 1256–1272. doi: 10.1016/j.dsr.2007.04.014
Fernandez-Mendez, M., Katlein, C., Rabe, B., Nicolaus, M., Peeken, I., Bakker, K., et al. (2015). Photosynthetic production in the central Arctic Ocean during the record sea-ice minimum in 2012. Biogeosciences 12, 3525–3549. doi: 10.5194/bg-12-3525-2015
Fisher, N. S., Burns, K. A., Cherry, R. D., and Heyraud, M. (1983). Accumulation and cellular distribution of 241Am, 210Po, and 210Pb in two marine algae. Mar. Ecol. 11, 233–237.
Forest, A., Sampei, M., Hattori, H., Makabe, R., Sasaki, H., Barber, D. G., et al. (2008). The annual cycle of particulate organic carbon export in Franklin Bay (Canadian Arctic): environmental control and food web implications. J. Geophys. Res. 113:CO3SO5. doi: 10.1029/2007JC004262
Friedrich, J., and Rugters van der Loeff, M. M. (2002). A two-tracer (210Po–234Th) approach to distinguish organic carbon and biogenic silica export flux in the Antarctic Circumpolar Current. Deep Sea Res. I 49, 101–120. doi: 10.1016/S0967-0637(01)00045-0
Fripiat, F., Declercq, M., Sapart, C. J., Anderson, L. G., Bruechert, V., Deman, F., et al. (2018). Influence of the bordering shelves on nutrient distribution in the Arctic halocline inferred from water column nitrate isotopes. Limnol. Oceanogr. 63, 2154–2170. doi: 10.1002/lno.10930
Fry, B. (1996). 13C/12C fractionation by marine diatoms. Mar. Ecol. Prog. Ser. 134, 283–294. doi: 10.3354/meps134283
Geotraces Cookbook. (2019). Sampling and Sample-handling Protocols for GEOTRACES Cruise. Available online at: https://www.geotraces.org/methods-cookbook/
Granger, J., Sigman, D. M., Gagnon, J., Tremblay, J.-E., and Mucci, A. (2018). On the properties of the Arctic halocline and deep water masses of the Canada Basin from nitrate isotope ratios. J. Geophys. Res. Oceans 123, 5443–5458. doi: 10.1029/2018JC014110
Griffith, D. R., McNichol, A. P., Xu, L., McLaughlin, F. A., Macdonald, R. W., Brown, K. A., et al. (2012). Carbon dynamics in the western Arctic Ocean: insights from full−depth carbon isotope profiles of DIC, DOC, and POC. Biogeosciences 9, 1217–1224. doi: 10.5194/bg-9-1217-2012
Guay, C. K., and Falkner, K. K. (1998). A survey of dissolved barium in the estuaries of major Arctic rivers and adjacent seas. Cont. Shelf Res. 18, 859–882. doi: 10.1016/S0278-4343(98)00023-5
Gustafsson, O., and Andersson, P. S. (2012). 234Th-derived surface export fluxes of POC from the Northern Barents Sea and the Eurasian sector of the central Arctic Ocean. Deep Sea Res. I 68, 1–11. doi: 10.1016/j.dsr.2012.05.014
Harada, K., Burnett, W. C., and LaRock, P. A. (1989). Polonium in Florida groundwater and its possible relationship to the sulfer cycle and bacteria. Geochim. Cosmochim. Acta 53, 143–150.
Haskell, W. Z. I. I., Berelson, W. M., Hammond, D. E., and Capone, D. G. (2013). Particle sinking dynamics and POC fluxes in the eastern Tropical South Pacific based on 234Th budgets and sediment trap deployments. Deep Sea Res. I 81, 1–13. doi: 10.1016/j.dsr.2013.07.001
He, J., Yu, W., Lin, W., Men, W., and Chen, L. (2015). Particulate organic carbon export fluxes on Chukchi Shelf, western Arctic Ocean, derived from 210Po/210Pb disequilibrium. Chin. J. Oceanol. Limnol. 33, 741–747.
Henson, S. A., Yool, A., and Sanders, R. (2015). Variability in efficiency of particulate organic carbon export: a model study. Glob. Biogeochem. Cycles 29, 33–45. doi: 10.1002/2014GB004965
Honjo, S., Krishfield, R. A., Eglinton, T. I., Manganini, S. J., Kemp, J. N., Doherty, K., et al. (2010). Biological pump processes in the cryopelagic and hemipelagic Arctic Ocean: Canada Basin and Chukchi Rise. Prog. Oceanogr. 85, 137–170. doi: 10.1016/j.pocean.2010.02.009
Honjo, S., Manganini, S. J., Krishfield, R. A., and Francois, R. (2008). Particulate organic carbon fluxes to the ocean interior and factors controlling the biological pump: a synthesis of global sediment trap programs since 1983. Prog. Oceanogr. 76, 217–285. doi: 10.1016/j.pocean.2007.11.003
Hu, W., Chen, M., Yang, W., Zhang, R., Qiu, Y., and Zheng, M. (2014). Low 210Pb in the upper thermocline in the Canadian Basin: scavenge process over the Chukchi Sea. Acta Oceanol. Sin. 33, 28–39. doi: 10.1007/s13131-014-0486-6
Hugelius, G., Strauss, J., Zubrzycki, S., Harden, J. W., Schuur, E. A. G., Ping, C.-L., et al. (2014). Estimated stocks of circumpolar permafrost carbon with quantified uncertainty ranges and identified data gaps. Biogeosciences 11, 6573–6593. doi: 10.5194/bg-11-6573-2014
Hwang, J., Eglinton, T. I., Krishfield, R. A., Manganini, S. J., and Honjo, S. (2008). Lateral organic carbon supply to the deep Canada Basin. Geophys. Res. Lett. 325:L11607. doi: 10.1029/2008GL034271
Hwang, J., Kim, M., Manganini, S. J., McIntyre, C. P., Haghipour, N., Park, J., et al. (2015). Temporal and spatial variability of particle transport in the deep Arctic Canada Basin. J. Geophys. Res. Oceans 120, 2784–2799. doi: 10.1002/2014JC010643
Jakobsson, M., Grantz, A., Kristoffersen, Y., and Macnab, M. (2004). “Bathymetry and physiography of the Arctic Ocean and its constituent seas,” in The Organic Carbon Cycle in the Arctic Ocean, eds R. Stein and R. W. MacDonald (Heidelberg: Springer), 1–6.
Jeandel, C., Rutgers van der Loeff, M., Lam, P. J., Roy-Barman, M., Sherrell, R. M., Kretschmer, S., et al. (2015). What did we learn about ocean particle dynamics in the GEOSECS-JGOFS era? Prog. Oceanogr. 133, 6–16.
Jensen, L. T., Morton, P., Twining, B. S., Heller, M. I., Hatta, M., Measures, C. I., et al. (2020). A comparison of marine Fe and Mn cycling: U.S. GEOTRACES GN01 Western Arctic case study. Geochim. Cosmochim. Acta 299, 138–160. doi: 10.1016/j.gca.2020.08.006
Jensen, L. T., Wyatt, N. J., Twining, B. S., Rauschenberg, S., Landing, W. M., Sherrell, R. M., et al. (2019). Biogeochemical cycling of dissolved zinc in the Western Arctic (Arctic GEOTRACES GN01). Glob. Biogeochem. Cycles 33, 343–369. doi: 10.1029/2018GB005975
Jorgenson, T. M., SHur, Y. L., and Pullman, E. R. (2006). Abrupt increase in permafrost degradation in Arctic Alaska. Geophys. Res. Lett. 33:L02503. doi: 10.1029/2005GL024960
Kim, G., Kim, S.-J., Harada, K., Schultz, M. K., and Burnett, W. C. (2005). Enrichment of excess 210Po in anoxic ponds. Environ. Sci. Technol. 39, 4894–4899.
Kinney, P., Arhelger, M. E., and Burrell, D. C. (1970). Chemical characteristics of water masses in the Amerasian Basin of the Arctic Ocean. J. Geophys. Res. 75, 4097–4104. doi: 10.1029/JC075i021p04097
Kipp, L. E., Charette, M. A., Moore, W. S., Henderson, P. B., and Rigor, G. I. (2018). Increased fluxes of shelf-derived materials to the central Arctic Ocean. Sci. Adv. 4:eaao1302.
Kipp, L. E., Kadko, D. C., Pickart, R. S., Henderson, P. B., Moore, W. S., and Charette, M. A. (2019). Shelf−basin interactions and water mass residence times in the Western Arctic Ocean: insights provided by radium isotopes. JGR Oceans 124, 3279–3297. doi: 10.1029/2019JC014988
Klunder, M. B., Bauch, D., Laan, P., Baar, H. J. W. D., Heuven, S.v., and Ober, S. (2012). Dissolved iron in the Arctic shelf seas and surface waters of the central Arctic Ocean: impact of Arctic river water and ice−melt. J. Geophys. Res. 117:C01027. doi: 10.01029/02011JC007133
Ko, Y. H., and Quay, P. D. (2020). Origin and accumulation of an anthropogenic CO2 and 13C Suess effect in the Arctic Ocean. Glob. Biogeochem. Cycles 34:e2019GB006423. doi: 10.1029/2019GB006423
Krishnamurthy, R. V., Machavaram, M., Baskaran, M., Champ, M., and Brooks, J. M. (2001). Organic carbon flow in the Ob, Yenisey Rivers and Kara Sea of the Arctic Region. Mar. Pollut. Bull. 42, 726–732.
Lalande, C., Forest, A., Barber, D. G., Gratton, Y., and Fortier, L. (2009). Variability in the annual cycle of vertical particulate organic carbon export on Arctic shelves: contrasting the Laptev Sea, Northern Baffin Bay and the Beaufort Sea. Cont. Shelf Res. 29, 2157–2165. doi: 10.1016/j.csr.2009.08.009
Lalande, C., Nöthig, E. M., Somavilla, R., Bauerfeind, E., Shevchenko, V., and Okolodkov, Y. (2014). Variability in under−ice export fluxes of biogenic matter in the Arctic Ocean. Glob. Biogeochem. Cycles 28, 571–583. doi: 10.1002/2013GB004735
Lam, P. (2020). Size-Fractionated Major and Minor Particle Composition and Concentration from the US GEOTRACES Arctic Cruise (HLY1502) on USCGC Healy from August to October 2015. (Version 1). Woods Hole, MA: Biological and Chemical Oceanography Data Management Office (BCO-DMO). doi: 10.26008/1912/bco-dmo.807340.1
Lannuzel, D., Tedesco, L., Leeuwe, M. V., Campbell, K., Flores, H., Delille, B., et al. (2020). The future of Arctic sea-ice biogeochemistry and ice-associated ecosystems. Nat. Clim. Change 10, 983–992. doi: 10.1038/s41558-020-00940-4
Laws, E. A., and Maiti, K. (2019). The relationship between primary production and export production in the ocean: effects of time lags and temporal variability. Deep Sea Res. Part I 148, 100–107. doi: 10.1016/j.dsr.2019.05.006
Le Moigne, F. A. C., Poulton, A. J., Henson, S. A., Daniels, C. J., Fragoso, G. M., et al. (2015). Carbon export efficiency and phytoplankton community composition in the Atlantic sector of the Arctic Ocean. J. Geophys. Res. Oceans 120, 3896–3912. doi: 10.1002/2015JC010700
Lepore, K., Moore, R. M., and Smith, J. N. (2009). 210Pb as a tracer of shelf–basin transport and sediment focusing in the Chukchi Sea. Deep Sea Res. II Top. Stud. Oceanogr. 56, 1305–1315.
Li, W. K. W., McLaughlin, F. A., Lovejoy, C., and Carmack, E. C. (2009). Smallest algae thrive as the Arctic Ocean freshens. Science 326:539. doi: 10.1126/science.1179798
Lin, P., Xu, C., Xing, W., and Santschi, P. H. (2021). Molecular level characterization of diatom and coccolithophore-associated biopolymers that are binding 210Pb and 210Po in seawater. Front. Mar. Sci. 8:703503. doi: 10.3389/fmars.2021.703503
Macdonald, R. W., McLaughlin, F. A., and Carmack, E. C. (2002). Freshwater and its sources during the SHEBA drift in the Canada Basin of the Arctic Ocean. Deep Sea Res. I 49, 1769–1785. doi: 10.1016/S0967-0637(02)00097-3
Maiti, K., and Bam, W. (2020a). Dissolved and Large Particulate Polonium 210 and Lead 210 Measurements from the Western Arctic Ocean, Which Were Sampled as Part of the 2015 US GEOTRACES Cruise, HLY1502 (GN01), on USCGC Healy. (Version 1) Version Date 2020-04-01. Woods Hole, MA: Biological and Chemical Oceanography Data Management Office (BCO-DMO). doi: 10.26008/1912/bco-dmo.808151.1
Maiti, K., and Bam, W. (2020b). Small Particulate Polonium 210 and Lead 210 Measurements from the Western Arctic Ocean, Which Were Sampled as Part of the 2015 US GEOTRACES Cruise, HLY1502 (GN01), on USCGC Healy. (Version 1) Version Date 2020-04-07. Woods Hole, MA: Biological and Chemical Oceanography Data Management Office (BCO-DMO). doi: 10.26008/1912/bco-dmo.808502.1
Maiti, K., Benitez-Nelson, C. R., Rii, Y., and Bidigare, R. (2008). The influence of a mature cyclonic eddy on particle export in the lee of Hawaii. Deep Sea Res. II 55, 1445–1460. doi: 10.1016/j.dsr2.2008.02.008
Maiti, K., Bosu, S., D’Sa, E. J., Adhikari, P. L., Sutor, M., and Longnecker, K. (2016). Export fluxes in northern Gulf of Mexico-comparative evaluation of direct, indirect and satellite-based estimates. Mar. Chem. 184, 60–77. doi: 10.1016/j.marchem.2016.06.001
Masqué, P., Cochran, J. K., Hirschberg, D. J., Dethleff, D., Hebbeln, D., Winkler, A., et al. (2007). Radionuclides in Arctic sea ice: tracers of sources, fates and ice transit time scales. Deep Sea Res. I 54, 1289–1310. doi: 10.1016/j.dsr.2007.04.016
Metfies, K., von Appen, W. J., Kilias, E., Nicolaus, A., and Nöthig, E. M. (2016). Biogeography and photosynthetic biomass of arctic marine pico-eukaroytes during summer of the record sea ice minimum 2012. PLoS One 11:e0148512. doi: 10.1371/journal.pone.0148512
Meybeck, M., and Ragu, A. (1997). River Discharges to the Oceans: an Assessment of Suspended Solids, Major Ions and Nutrients. Geneva: UNEP.
Moore, R. M., Lowings, M. G., and Tan, F. C. (1983). Geochemical profiles in the central Arctic Ocean: their relation to freezing and shallow circulation. J. Geophys. Res. Oceans 88, 2667–2674. doi: 10.1029/JC088iC04p02667
Moore, R. M., and Smith, J. N. (1986). Disequilibria between226Ra, 210Pb and 210Po in the Arctic Ocean and the implications for chemical modification of the Pacific water inflow. Earth Planet. Sci. Lett. 77, 285–292.
Moran, S. B., Ellis, K. M., and Smith, J. N. (1997). 234Th/238U disequilibrium in the central Arctic Ocean: implications for particulate organic carbon export. Deep Sea Res. II Top. Stud. Oceanogr. 44, 1593–1606. doi: 10.1016/S0967-0645(97)00049-0
Moran, S. B., Kelly, R. P., Hagstrom, K., Smith, J. N., Grebmeier, J. M., Cooper, L. W., et al. (2005). Seasonal changes in POC export flux in the Chukchi Sea and implications for water column−benthic coupling in Arctic shelves. Deep Sea Res. II Top. Stud. Oceanogr. 52, 3427–3451. doi: 10.1016/j.dsr2.2005.09.011
Murray, J. W., Paul, B., Dunne, J. P., and Chapin, T. (2005). 234Th, 210Pb, 210Po and stable Pb in the central equatorial Pacific: tracers for particle cycling. Deep Sea Res. I Oceanogr. Res. Pap. 52, 2109–2139.
Murray, J. W., Young, J., Netwon, J., Dunne, J., Chapin, T., Paul, B., et al. (1996). Export flux of particulate organic carbon from the central equatorial Pacific determined using a combined drifting trap-234Th approach. Deep Sea Res. II Top. Stud. Oceanogr. 43, 1095–1132. doi: 10.1016/0967-0645(96)00036-7
Niedermiller, J., and Baskaran, M. (2019). Comparison of the scavenging intensity, remineralization and residence time of 210Po and 210Pb at ley zones (biotic, sediment-water and hydrothermal) along the East Pacific GEOTRACES transect. J. Environ. Radioact. 198, 165–188. doi: 10.1016/j.jenvrad.2018.12.016
Nozaki, Y., Thompson, J., and Turekian, K. K. (1976). The distribution of210Pb and210Po in the surface water of the Pacific Ocean. Earth Planet. Sci. Lett. 32, 304–312. doi: 10.1016/0012-821X(76)90070-4
O’Brien, M. C., Macdonald, R. W., Melling, H., and Iseki, K. (2006). Particle fluxes and geochemistry on the Canadian Beaufort Shelf: Implications for sediment transport and deposition. Cont. Shelf Res. 26, 41–81. doi: 10.1016/j.csr.2005.09.007
Peterson, B. J., Holmes, R. M., McClelland, J. W., Vörösmarty, C. J., Lammers, R. B., Shiklomanov, A. I., et al. (2002). Increasing river discharge to the Arctic Ocean. Science 298, 2171–2173.
Pineault, S., Tremblay, J. E., Gosselin, M., Thomas, H., and Shadwick, E. H. (2013). The isotopic signature of particulate organic C and N in bot-tom ice: key influencing factors and applications for tracing the fate of ice-algae in the Arctic Ocean. J. Geophys. Res. 118, 287–300. doi: 10.1029/2012JC008331
Quay, P. (2019). The Ratio of 13C to 12C of Dissolved Inorganic Carbon (DIC) Measured During the GEOTRACES Arctic Cruise (HLY 1502, ARC01) During FALL 2015. (Version 1). Woods Hole, MA: Biological and Chemical Oceanography Data Management Office (BCO-DMO).
Rabe, B., Karcher, M., Schauer, U., Toole, J. M., Krishfield, R. A., Pisarev, S., et al. (2011). An assessment of Arctic Ocean freshwater content changes from the 1990s to 2006–2008 period. Deep Sea Res. I 58, 173–185. doi: 10.1016/j.dsr.2010.12.002
Rachold, V., Eicken, H., Gordeev, V., and Schirrmeister, L. (2004). “Modern terrigenous organic carbon input to the Arctic Ocean,” in The Organic Carbon Cycle in the Arctic Ocean, eds R. S. Stein and R. W. Macdonald (New York, NY: Springer), 33–55.
Rachold, V., Grigoriev, M. N., Are, F. E., Solomon, S., Reimnitz, E., Kassens, H., et al. (2000). Coastal erosion vs riverine sediment discharge in the Arctic Shelf seas. Int. J. Earth Sci. 89, 450–460. doi: 10.1007/s005310000113
Rau, G. H., Takahashi, T., and Des Marais, D. J. (1989). Latitudinal variations in plankton δ13C: implications for CO2 and productivity in past oceans. Nature 341, 516–518. doi: 10.1038/341516a0
Rickert, D., Schluter, M., and Wallmann, K. (2002). Dissolution kinetics of biogenic silica from the water column to the sediments. Geochim. Cosmochim. Acta 66, 439–455. doi: 10.1016/S0016-7037(01)00757-8
Rigaud, S., Stewart, G., Baskaran, M., Marsan, D., and Church, T. (2015). 210Po and 210Pb distribution, dissolved-particulate exchange rates, and particulate export along the North Atlantic US GEOTRACES GA03section. Deep Sea Res. II 116, 60–78. doi: 10.1016/j.dsr2.2014.11.003
Roca-Martí, M., Puigcorbéc, V., Friedrich, J., Rutgers van der Loeff, M., Rabe, B., Korhonen, M., et al. (2018). Distribution of 210Pb and 210Po in the Arctic water column during the 2007 sea-ice minimum: particle export in the ice-covered basins. Deep Sea Res. I 142, 94–106. doi: 10.1016/j.dsr.2018.09.011
Roca-Martí, M., Puigcorbé, V., Rutgers van der Loeff, M. M., Katlein, C., Fernandez-Mendez, M., Peeken, I., et al. (2016). Carbon export fluxes and export efficiency in the central Arctic during the record sea-ice minimum in 2012: a joint 234Th/238U and 210Po/210Pb study. J. Geophys. Res. Oceans 121, 5030–5049. doi: 10.1002/2016JC011816
Rudels, B. (2015). Arctic Ocean circulation, processes and water masses: a description of observations and ideas with focus on the period prior to the International Polar Year 2007–2009. Prog. Oceanogr. 132, 22–67. doi: 10.1016/j.pocean.2013.11.006
Rutgers Van Der Loeff, M., Key, R. M., Scholten, J., Bauch, D., and Michel, A. (1995). 228Ra as a tracer for shelf water in the Arctic Ocean. Deep Sea Res. II Top. Stud. Oceanogr. 42, 1533–1553. doi: 10.1016/0967-0645(95)00053-4
Rutgers Van Der Loeff, M., Kipp, L., Charette, M. A., Moore, W. S., Black, E., Stimac, I., et al. (2018). Radium isotopes across the arctic ocean show time scales of water mass ventilation and increasing shelf inputs. J. Geophys. Res. Oceans 123, 4853–4873. doi: 10.1029/2018JC013888
Sallon, A., Michel, C., and Gosselin, M. (2011). Summertime primary production and carbon export in the southeastern Beaufort Sea during the low ice year of 2008. Polar Biol. 34, 1989–2005. doi: 10.1007/s00300-011-1055-5
Schuur, E. A., McGuire, A. D., Schädel, C., Grosse, G., Harden, J. W., Hayes, D. J., et al. (2015). Climate change and the permafrost carbon feedback. Nature 520, 171–179. doi: 10.1038/nature14338
Schuur, E. A. G., Bockheim, J., Canadell, J. G., Euskirchen, E., Field, C. B., Goryachkin, S. V., et al. (2008). Vulnerability of permafrost carbon to climate change: implications for the global carbon cycle. Bioscience 58, 701–714. doi: 10.1641/B580807
Serreze, M. C., Barrett, A. P., Slater, A. G., Woodgate, R. A., Aagaard, K., Lammers, R. B., et al. (2006). The large−scale freshwater cycle of the Arctic. J. Geophys. Res. Oceans 111:C11010. doi: 10.1029/2005JC003424
Shaw, W. J., Stanton, T. P., McPhee, M. G., Morison, J. H., and Martinson, D. G. (2009). Role of the upper ocean in the energy budget of Arctic sea ice during SHEBA. J. Geophys. Res. 114:C06012. doi: 10.1029/2008JC004991
Smith, J. N., Moran, S. B., and Macdonald, R. W. (2003). Shelf–basin interactions in the Arctic Ocean based on 210Pb and Ra isotope tracer distributions. Deep Sea Res. I 50, 397–416.
Stewart, G., Cochran, J. K., Miquel, J. C., Masqué, P., Szlosek, J., Rodriguez y Baena, A. M., et al. (2007). Comparing POC export from 234Th/238U and 210Po/210Pb disequilibria with estimates from sediment traps in the northwest Mediterranean. Deep Sea Res. I 54, 1549–1570. doi: 10.1016/j.dsr.2007.06.005
Stewart, G. M., and Fisher, N. S. (2003a). Bioaccumulation of polonium-210 in marine copepods. Limnol. Oceanogr. 48, 2011–2019. doi: 10.4319/lo.2003.48.5.2011
Stewart, G. M., and Fisher, N. S. (2003b). Experimental studies on the accumulation of polonium-210 by marine phytoplankton. Limnol. Oceanogr. 48, 1193–1201. doi: 10.4319/lo.2003.48.3.1193
Su, K., Du, J., Baskaran, M., and Zhang, J. (2017). 210Po and 210Pb disequilibrium at the PN section in the East China Sea. J. Environ. Radioact. 174, 54–65. doi: 10.1016/j.jenvrad.2016.07.031
Tang, Y., and Stewart, G. (2019). The 210Po/210Pb method to calculate particle export: lessons learned from the results of three GEOTRACES transects. Mar. Chem. 217:103692. doi: 10.1016/j.marchem.2019.103692
Tang, Y., Stewart, G., Lam, P. J., Riguad, S., and Church, T. (2017). The influence of particle concentration and composition on the fractionation of 210 Po and 210 Pb along the North Atlantic GEOTRACES transect GA03. Deep Sea Res. I 128, 42–54. doi: 10.1016/j.dsr.2017.09.001
Tolosa, I., Fiorini, S., Gasser, B., Martín, J., and Miquel, J. C. (2013). Carbon sources in suspended particles and surface sediments from the Beaufort Sea revealed by molecular lipid biomarkers and compound−specific isotope analysis. Biogeosciences 10, 2061–2087. doi: 10.5194/bg-10-2061-2013
Tovar-Sánchez, A., Duarte, C. M., Alonso, J. C., Lacorte, S., Tauler, R., and Galbán-Malagón, C. (2010). Impacts of metals and nutrients released from melting multiyear Arctic sea ice. J. Geophys. Res. 115, 1–7. doi: 10.1029/2009JC005685
Trimble, S. M., and Baskaran, M. (2005). The role of suspended particulate matter in 234Th scavenging and 234Th-derived export fluxes of POC in the Canada Basin of the Arctic Ocean. Marine Chemistry 96, 1–19. doi: 10.1016/j.marchem.2004.10.003
Wei, C. L., Lin, S. Y., Sheu, D. D. D., Chou, W.-C., Yi, M.-C., Santschi, P. H., et al. (2011). Particle-reactive radionuclides (234Th, 210Pb, 210Po) as tracers for the estimation of export production in the South China Sea. Biogeosciences 8, 3793–3808. doi: 10.5194/bg-8-3793-2011
Weingartner, T. J., Cavalieri, D. J., Aagaard, K., and Sasaki, Y. (1998). Circulation, dense water formation, and outflow on the northeast Chukchi shelf. J. Geophys. Res. 103, 7647–7661. doi: 10.1029/98JC00374
Wheeler, P. A., Watkins, J. W., and Hansing, R. L. (1997). Nutrients, organic carbon and organic nitrogen in the upper water column of the Arctic Ocean: implications for the sources of dissolved organic carbon. Deep Sea Res. II Top. Stud. Oceanogr. 44, 1571–1592.
Xiang, Y., and Lam, P. J. (2020). Size−fractionated compositions of marine suspended particles in the Western Arctic Ocean: lateral and vertical sources. J. Geophys. Res. Oceans 125:e2020JC016144. doi: 10.1029/2020JC016144
Yamamoto-Kawai, M., McLaughlin, F. A., Carmack, E. C., Nishino, S., and Shimada, K. (2008). Freshwater budget of the Canada Basin, Arctic Ocean, from salinity, δ18O, and nutrients. J. Geophys. Res. Oceans 113:C01007. doi: 10.1029/2006JC003858
Yu, W., Chen, L., Cheng, J., He, J., Yin, M., and Zeng, Z. (2010). 234Th-derived particulate organic carbon export fluxes in the western Arctic Ocean Chin. J. Oceanol. Limnol. 28, 1146–1151. doi: 10.1007/s00343-010-9933-1
Yu, W., He, J., Li, Y., Lin, W., and Chen, L. (2012). Particulate organic carbon export fluxes and validation of steady state model of 234Th export in the Chukchi Sea. Deep Sea Res. II Top. Stud. Oceanogr. 8, 63–71. doi: 10.1016/j.dsr2.2012.03.003
Keywords: export production, POC flux, particle export, Arctic Ocean, organic matter export
Citation: Bam W, Maiti K and Baskaran M (2021) 210Po and 210Pb as Tracers of Particle Cycling and Export in the Western Arctic Ocean. Front. Mar. Sci. 8:697444. doi: 10.3389/fmars.2021.697444
Received: 19 April 2021; Accepted: 09 July 2021;
Published: 29 July 2021.
Edited by:
Laodong Guo, University of Wisconsin–Milwaukee, United StatesReviewed by:
J. Kirk Cochran, Stony Brook University, United StatesAnne-Marie Wefing, ETH Zürich, Switzerland
Copyright © 2021 Bam, Maiti and Baskaran. This is an open-access article distributed under the terms of the Creative Commons Attribution License (CC BY). The use, distribution or reproduction in other forums is permitted, provided the original author(s) and the copyright owner(s) are credited and that the original publication in this journal is cited, in accordance with accepted academic practice. No use, distribution or reproduction is permitted which does not comply with these terms.
*Correspondence: Wokil Bam, wbam1@lsu.edu; bamwokil1@gmail.com; Kanchan Maiti, kmaiti@lsu.edu