Long-Term Evolution of Greenhouse Gas Emissions From Global Reservoirs
 Xingcheng Yan
 Vincent Thieu
 Josette Garnier
- Sorbonne Université, CNRS, EPHE, UMR 7619 METIS, Paris, France
The contribution of artificial reservoirs to greenhouse gas (GHG) emissions has been emphasized in previous studies. In the present study, we collected and updated data on GHG emission rates from reservoirs at the global scale, and applied a new classification method based on the hydrobelt concept. Our results showed that CH4 and CO2 emissions were significantly different in the hydrobelt groups (p < 0.01), while no significant difference was found for N2O emissions, possibly due to their limited measurements. We found that annual GHG emissions (calculated as C or N) from global reservoirs amounted to 12.9 Tg CH4-C, 50.8 Tg CO2-C, and 0.04 Tg N2O-N. Furthermore, GHG emissions (calculated as CO2 equivalents) were also estimated for the 1950–2017 period based on the cumulative number and surface area of global reservoirs in the different hydrobelts. The highest increase rate in both the number of reservoirs and their surface area, which occurred from 1950 to the 1980s, led to an increase in GHG emissions from reservoirs. Since then, the increase rate of reservoir construction, and hence GHG emissions, has slowed down. Moreover, we also examined the potential impact of reservoir eutrophication on GHG emissions and found that GHG emissions from reservoirs could increase by 40% under conditions in which total phosphorus would double. In addition, we showed that the characteristics of reservoirs (e.g., geographical location) and their catchments (e.g., surrounding terrestrial net primary production, and precipitation) may influence GHG emissions. Overall, a major finding of our study was to provide an estimate of the impact of large reservoirs during the 1950–2017 period, in terms of GHG emissions. This should help anticipate future GHG emissions from reservoirs considering all reservoirs being planned worldwide. Besides using the classification per hydrobelt and thus reconnecting reservoirs to their watersheds, our study further emphasized the efforts to be made regarding the measurement of GHG emissions in some hydrobelts and in considering the growing number of reservoirs.
Introduction
Reservoirs are important components of inland water ecosystems (together with lakes) and are recognized as significant sources of greenhouse gases (GHG) globally (Demarty and Bastien, 2011; Beaulieu et al., 2015, 2018; Li et al., 2018). Artificial reservoirs impounded after river damming are distinct from natural lakes in multiple aspects (e.g., riverine nutrient inputs, flooding of terrestrial organic carbon, depth/water-level fluctuations, thermal stratification, power generation, etc.) and may affect GHG emissions (Ford and Johnson, 1986; Deemer et al., 2016; Zamani et al., 2020). It was suggested that the flooded organic matter and vegetation could potentially contribute to large emissions of methane (CH4) and carbon dioxide (CO2) to the atmosphere, especially during the first year and even 10 years after flooding (Rudd et al., 1993; Kelly et al., 1997; Delmas et al., 2005; Tremblay, 2005). Moreover, it was reported that carbon emissions from a tropical hydropower plant (in Brazil) could reach four times the carbon emissions from a comparable fossil fuel station during the first 10 years (Fearnside, 1995, 2006). On the other hand, studies have pointed out that carbon emissions from reservoirs may be overestimated (Rosa et al., 2004, 2006). Regarding nitrous oxide (N2O), we can expect important emissions in reservoirs enriched with nitrogen (N), especially in the form of nitrate (N-NO3), which is known to be denitrified in stagnant systems (Beaulieu et al., 2015; Yan et al., 2021). Previous research also showed that there can be substantial GHG emissions downstream of tropical hydroelectric reservoirs (Abril et al., 2005; Kosten et al., 2010). Even without these downstream emissions, however, it is undeniable that the impact of reservoirs on global GHG emissions is significant (Giles, 2006).
To date, there are a number of studies available that have estimated the contribution of reservoirs to GHG emissions. The first global estimation of GHG emissions from reservoirs was proposed by St. Louis et al. (2000), who reported that reservoirs have a potentially large impact on global GHG emissions, with a value of 55 Tg CH4-C and 270 Tg CO2-C per year. Several studies followed, aiming to quantify the GHG emissions from reservoirs, and provided global and regional estimations. Among them, three global estimations indicated that GHG emissions from worldwide reservoirs ranged from 13.4 to 55 Tg CH4-C per year, 36.8 to 270 Tg CO2-C per year, and 0.03 to 0.07 Tg N2O-N per year, respectively (St. Louis et al., 2000; Bastviken et al., 2011; Deemer et al., 2016; Maavara et al., 2019). In addition, GHG emissions from global hydroelectric reservoirs (comprising approximately 20% of all reservoirs) were also estimated, with values ranging from 3 to 7.3 Tg CH4-C per year and 48 to 76 Tg CO2-C per year (Barros et al., 2011; Hertwich, 2013).
Current estimations have focused mainly on the magnitude of GHG emissions from global reservoirs at present, which were calculated from the average GHG emission rates with respect to their surface area (e.g., Barros et al., 2011; Deemer et al., 2016). However, the contribution of global reservoirs to GHG emissions should be varied with time due to the global surges of reservoir construction since the 1950s (Lehner et al., 2011), the topic is a highly instructive but still underexplored. In this study, we analyzed the GHG emissions of dammed reservoirs going back in time, and aimed to provide implications for future GHG emissions from reservoirs under the context of the continuous dam constructions in the next decades (Zarfl et al., 2015). In addition, we applied a more appropriate classification method for global reservoirs based on hydrobelt concept proposed by Meybeck et al. (2013), which considering the fundamental heterogeneity of hydroclimates and natural boundaries of river basins, including reservoirs. Compared to other latitude-based classification methods (e.g., Barros et al., 2011), hydrobelt divisions are more conceptually adapted, and our methodology as a whole is expected to provide a new frame for analyzing the spatial patterns of GHG emissions from global reservoirs.
Methods
Data Collection From the Literature
We collected data on GHG emissions from the literature (Barros et al., 2011; Hertwich, 2013; Deemer et al., 2016), and the latest measurements of the GHG emissions from reservoirs were also added based on published papers (e.g., Almeida et al., 2016; Bevelhimer et al., 2016; Jiang et al., 2017; Li et al., 2018), in particular those from North and South America and Asia. The reservoirs in our dataset are mostly distributed in North and South America, Europe, and Asia, but they are limited in Africa (Figure 1); the records of GHG emissions are from 1988 to 2018. Data on GHG emissions and the reservoir-related parameters (e.g., water quality, reservoir morphology, location, precipitation in the catchment, and usage) were gathered from these studies. Among the 289 records in the gathered dataset presented in (Supplementary Table S1, for 234 reservoirs, some of them were investigated at several stations), 170, 257, and 60 observations were collected for the CH4, CO2, and N2O fluxes, respectively.
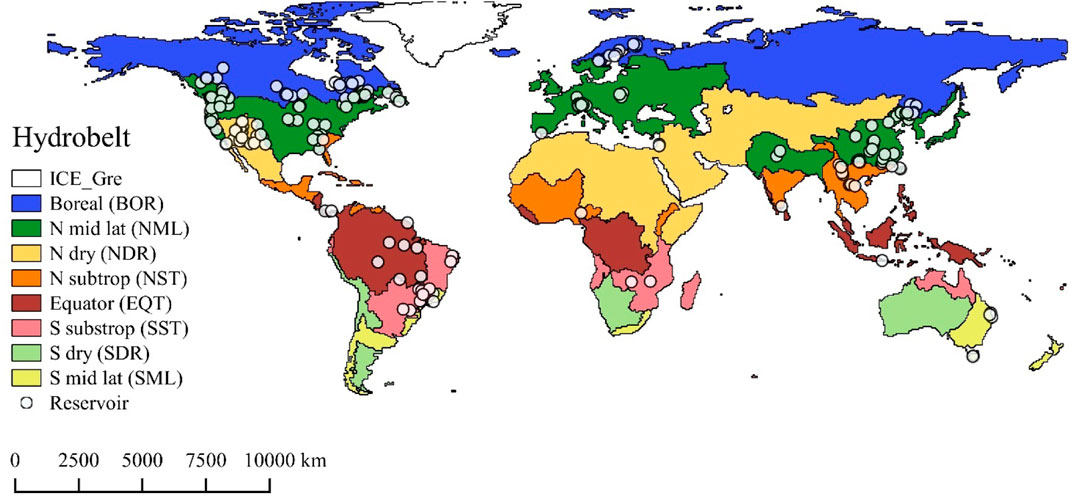
FIGURE 1. Distribution of reservoirs analyzed for GHG emissions and related parameters. The hydrobelt classification was referenced from Meybeck et al. (2013).
Classification of Global Reservoirs
The present classification method contains eight hydrobelts (excluding Greenland): boreal belt (BOR), north and south mid-latitude belts (NML and SML), north and south subtropical belts (NST and SST), north and south dry belts (NDR and SDR), and equatorial belt (EQT). As shown in Figure 1, this hydrobelt classification method also infers global climatic zones. This climatic zone approach was explored in parallel using climatic zones simply referenced from their latitudes (tropical: 0°–20°; subtropical: 20°–30°; temperate: 30°–50° and boreal: > 50°). Compared to the classification of different climatic zones, the hydrobelt concept contains much more information, as it considers the fundamental heterogeneity of hydroclimates and natural boundaries of river basins (Meybeck et al., 2013). The classifications of hydrobelts and climatic groups were determined using a geographic information system (GIS; ArcGis 10.5), and the Kruskal–Wallis nonparametric test was used to identify the differences in GHG fluxes between the different groups mentioned above using R language, version 3.5.1.
According to the amounts of GHG emissions reported in the gathered dataset, we finally compared the differences in CH4 and CO2 fluxes in five hydrobelt groups (BOR, NML, NDR_NST, EQT, and SST_SDR_SML), while three hydrobelt groups were used for N2O fluxes (BOR, NML, and Others).
Estimating Present and Long-Term Evolution of Greenhouse Gas Emissions at the Global Scale
In order to generalize the GHG emissions documented from the literature, we used the Global Reservoir and Dam Database (GRanD, v. 1.3, http://globaldamwatch.org/grand/), which selected 7,320 reservoirs and their respective surface area (3.6 × 10⁵ km2) (with a storage capacity of >0.1 km3). The regulated natural lakes Victoria, Baikal, and Ontario, totaling 0.12 × 10⁶ km2, in the original GRanD database census were excluded from our estimate of GHG emissions from reservoirs. The average areal GHG fluxes were derived from the reclassified hydrobelt groups based on the results of the Kruskal–Wallis nonparametric test (see above) and were then multiplied by the corresponding reservoir surface area in each hydrobelt group. Finally, the total GHG emissions from global reservoirs were obtained by summing up the GHG emissions in different hydrobelt groups. In addition, the evolution of GHG emissions in the different hydrobelts [expressed as CO2 Equivalent (Eq) taking a 100-years global warming potential of 25 and 298 for CH4 and N2O, respectively] was traced back to 1950 from the dates of dam construction documented in the GRanD database (v. 1.3).
The ebullition of CH4 is considered an important component of CH4 emissions from lakes and reservoirs; however, this pathway is not usually measured. There were 50 records of CH4 diffusion and associated ebullition in the dataset of Deemer et al. (2016). In order to derive more records of total CH4 emission, we also used the dataset of DelSontro et al. (2018), i.e., 96 pairs of data from lakes and reservoirs, and established a relationship between the total CH4 emission and diffusive CH4 emission for global lakes and reservoirs (Figure 2, p < 0.01, n = 146). Thereby, we were able to complete the missing CH4 ebullition emissions in our dataset (Supplementary Table S1) using this relationship, leading to total CH4 emissions for 33, 68, 31, and 38 records (vs 9, 28, 11, and 27 records in Deemer et al., 2016)) in boreal, temperate, subtropical, and tropical zones, respectively. Therefore, our collected dataset contained more total CH4 emissions than previous studies (∼2.3 times more than in Deemer et al. (2016)).
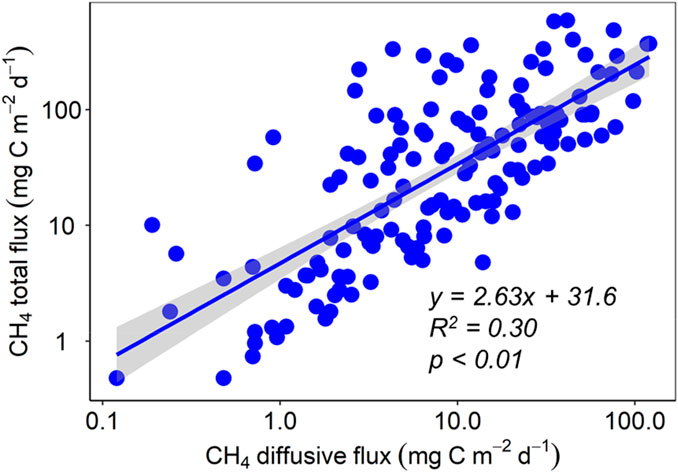
FIGURE 2. Relationship between total CH4 flux (diffusive and ebullitive) and diffusive flux. This relationship was derived on the basis of the dataset of DelSontro et al. (2018), i.e., 96 records, and that of Deemer et al. (2016), i.e., 50 records.
To evaluate the long-term evolution of GHG emissions from global reservoirs since 1950, we computed the cumulative number and surface area of reservoirs in the eight aforementioned hydrobelts. The average GHG fluxes were multiplied by the total reservoir surface area in each hydrobelt group, resulting in total GHG emissions per hydrobelt.
In addition, previous studies have described the impact of eutrophication on GHG emissions from inland waters (e.g., DelSontro et al., 2018; Beaulieu et al., 2019). Herein, we also considered the potential impact of reservoir eutrophication on GHG emissions based on the regression equations from DelSontro et al. (2018) (see Supplementary Table S2). On the basis of these equations, we assumed different total phosphorus (TP) concentrations in the reservoirs linking GHG emissions and TP, i.e., the current concentrations with multiplication factors ×0.5, ×0.75, ×0.10, ×1.5, ×2.0, referenced in Beaulieu et al. (2019). Next, the newly calculated areal GHG emissions were multiplied by the total surface area corresponding to each hydrobelt, and the annual total GHG emissions from global reservoirs were derived from the sum of GHG emissions in each hydrobelt (Supplementary Table S2).
Results
Greenhouse Gas Fluxes From Reservoirs in Different Hydrobelt Groups
The patterns of GHG fluxes in different hydrobelt groups and climatic zones are shown in Figure 3. Average CH4 fluxes were high in the EQT and SST_SDR_SML hydrobelt groups (Figure 3A), with values (mean ± SE) of 380.3 ± 145.4 mg CH4-C m−2 d−1 and 165.8 ± 48.6 mg CH4-C m−2 d−1, respectively. The mean CO2 fluxes also showed similar patterns, with the highest value (1,257.9 ± 221.1 mg CO2-C m−2 d−1) in the EQT hydrobelt (Figure 3B). Lower average N2O fluxes were found in the BOR and NML hydrobelts, with values of 0.05 ± 0.01 mg N2O-N m−2 d−1 and 0.16 ± 0.05 mg N2O-N m−2 d−1, respectively (Figure 3C). In terms of the patterns of GHG fluxes in different climatic zones, the highest GHG fluxes were generally found in the tropical zone (Figures 2D–F). At the global scale, average fluxes of CH4, CO2, and N2O were 125.7 ± 21.2 mg CH4-C m−2 d−1, 415.7 ± 36.0 mg CO2-C m−2 d−1, and 0.28 ± 0.11 mg N2O-N m−2 d−1, respectively.
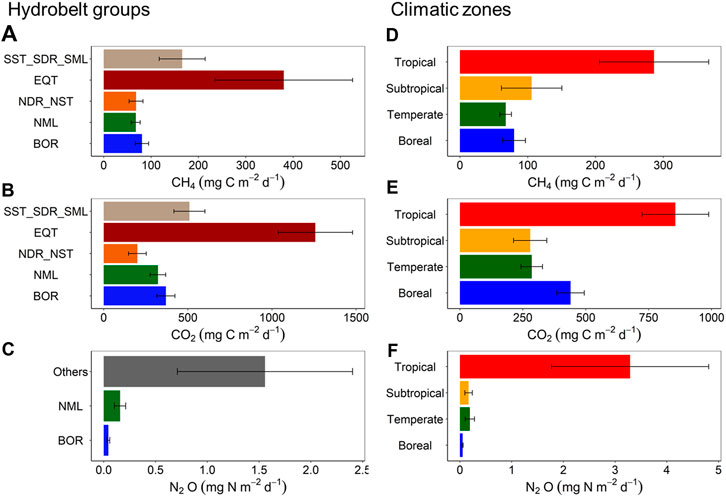
FIGURE 3. GHG fluxes from reservoirs for different hydrobelt groups (A,B,C) and climatic zones (D,E,F) for CH4, CO2, and N2O (from top to bottom). For the hydrobelt classification, SST_SDR_SML is the combination of GHG fluxes in the SST (south subtropical), SDR (south dry), and SML belts (south mid-latitude); EQT (equatorial belt); NDR_NST (north dry and north subtropical); NML (north mid-latitude) and BOR (boreal belt).
According to the data collected in our study, all the reservoirs were sources of CH4, with the diffusive flux ranging from 0.07 to 1,140.0 mg CH4-C m−2 d−1 (from 31.8 to 3,027.3 mg CH4-C m−2 d−1 for the total fluxes calculated). Whereas 86% of the reservoirs were a source of CO2, with emission rates varying from 0.3 to 3,800.0 mg CO2-C m−2 d−1, 14% of the reservoirs were sinks for CO2 (with the flux ranging from −0.3 to −356.0 mg CO2-C m−2 d−1). For N2O, 91% of the reservoirs were sources, with fluxes fluctuating from 0.0 to 5.77 mg N2O-N m−2 d−1.
Global Estimates of Greenhouse Gas Emissions From Reservoirs
The results of the nonparametric Kruskal–Wallis test showed significant differences in CH4 and CO2 areal fluxes between the BOR, EQT, and SST_SDR_SML hydrobelt groups (p < 0.01), while no significant difference was found in the NML and NDR_NST hydrobelts. Therefore, four hydrobelt groups (BOR, EQT, SST_SDR_SML, and NML_NDR_NST) were reclassified for the global estimation (Table 1). The results of a Kruskal–Wallis test for N2O emissions did not show any significant difference between hydrobelts owing to the limited measurements in the present dataset, and N2O emissions were thus considered as a whole (Table 1).
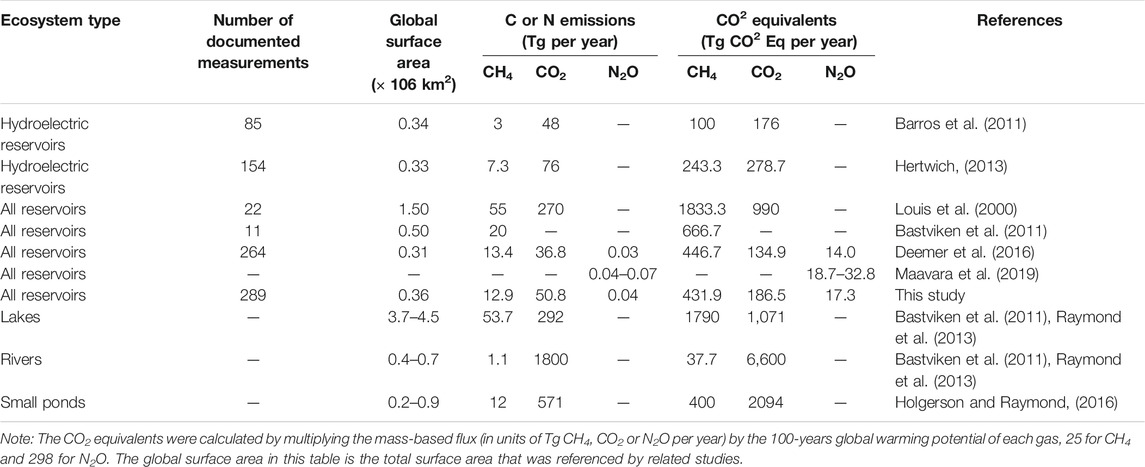
TABLE 1. Global estimation of GHG emissions from freshwater ecosystems.
Globally, annual GHG emissions from reservoirs were approximately 12.9 Tg CH4-C, 50.8 Tg CO2-C, and 0.04 Tg N2O-N (Table 1). In terms of CO2 Eq, reservoirs in BOR, NML, EQT, and SST contribute the majority of GHG emissions (more than 80%). The highest annual GHG emissions were found in the NML hydrobelt, at 171.9 Tg CO2 Eq per year, followed by the BOR (148.3 Tg CO2 Eq per year), EQT (119.7 Tg CO2 Eq per year), and SST (91.6 Tg CO2 Eq per year) hydrobelts. However, GHG emissions from reservoirs in the SDR and SML hydrobelts were lower, at 9.7 and 15.9 Tg CO2 Eq per year, respectively.
Statistical Analysis of Factors Influencing Greenhouse Gas Fluxes From Reservoirs
Based on the data collected here, the relationships between GHG fluxes and the characteristics of the reservoir watersheds revealed that there was a significant linear relationship between CH4 and CO2 fluxes and the surrounding terrestrial net primary production (NPP) and precipitation (Figure 4, p < 0.01), although the rather low variation coefficient indicated that other factors can influence GHG emissions. N2O fluxes had no significant relationship with NPP. We also analyzed the impact of the reservoir age and residence time on GHG emissions. Surprisingly, we found no significant relationship between GHG emissions and the age and residence time of reservoirs (p > 0.05), in contrast to results from previous studies of hydroelectric reservoirs.
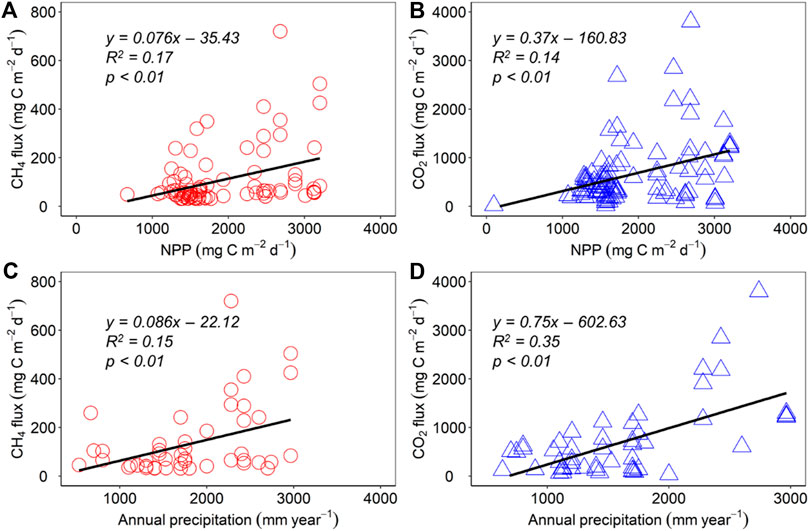
FIGURE 4. Linear regressions for the relationships between CH4 and CO2, and terrestrial net primary production (NPP) and precipitation in the reservoir catchments.
Estimating Long-Term CO2 Eq Emissions From Global Reservoirs
A prerequisite for the estimation of long-term GHG emissions was to calculate the cumulative reservoir number and surface area (Figure 5). Thus, GHG emissions (expressed as CO2 Eq) were calculated for the period 1950–2017 for different hydrobelts. Here, we used the averaged GHG fluxes in each hydrobelt group in agreement with the above analysis (see Global Estimates of Greenhouse Gas Emissions From Reservoirs Section). In the GRanD database, there are 357 reservoirs with unknown construction date, with a total surface area of 7,849 km2, representing 2.2% of the actual total surface area of global reservoirs taken into account in our evaluation. Hence, these reservoirs were not included in the cumulative number, surface area, and evolution of CO2 Eq emissions.
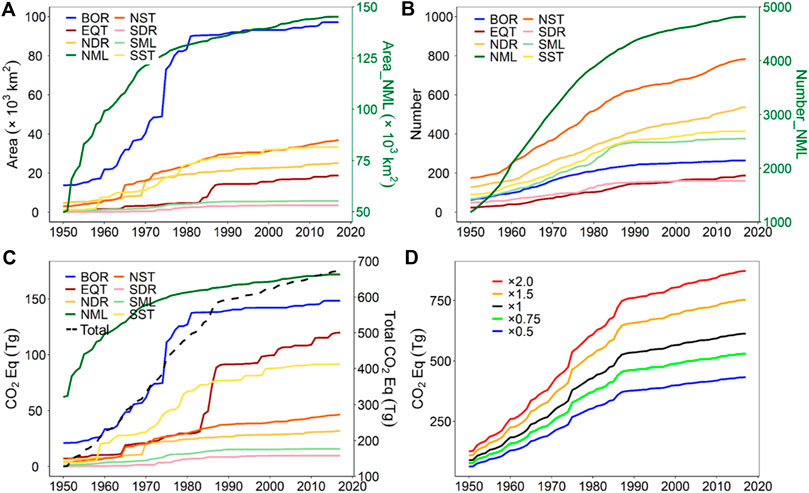
FIGURE 5. Long-term evolution of global reservoir surface area (A), numbers (B), estimated GHG emissions in different hydrobelts [(C), black dotted line represents the total CO2 Eq], and GHG emissions calculated from global reservoirs under different TP concentrations (D).
Regarding the cumulative number and the surface area of the reservoirs, the highest increase rate occurred from 1950 to the 1980s, after which the increase rate slowed down (Figures 5A,B). In terms of cumulative reservoir numbers in different hydrobelts, the NML hydrobelt has the largest number of reservoirs, representing nearly 62% of the current global count. For cumulative surface area, the reservoirs located in the NML made up the largest value followed by the BOR hydrobelt, and the total surface area of these two hydrobelts represents 66% of the global reservoir area. When combining surface area with total number, the reservoirs located in the BOR hydrobelts are large (average area per reservoir is ca. 372 km2, much higher than that in other hydrobelts averaging 38 km2 per reservoir). In terms of the evolution of CO2 Eq in different hydrobelts, reservoirs located in the BOR and NML hydrobelts contribute more to the total amount of annual CO2 Eq (Figure 5C). Although the total surface area in EQT and SST is relatively small, attention should be paid to their relatively higher GHG emission rates, especially of CH4 and CO2 (Figure 5C).
The potential impact of reservoir eutrophication on GHG emissions was also considered in the long-term evolution of GHG emissions from global reservoirs. The GHG emissions calculated from reservoirs could increase by 1.4-fold as the TP concentration increases twofold (Figure 5D). However, it should be noted that we assumed a constant GHG flux under each TP concentration when evaluating the impact of eutrophication on GHG emissions, despite the fact that the trophic state of reservoirs could change during this long-term period. We tested the role of TP concentration in order to provide a realistic envelope to the current GHG emission values applied to the whole period. Various trajectories in GHG emissions can be drawn in this range, and we can assume that values during 1980–2000, a period with significant eutrophication, might have been higher than the present ones thanks to increasing national regulations in many countries.
Discussion
In this study, we summarized the estimates of GHG emissions from global reservoirs (Table 1). We used a new functional classification by hydrobelts elaborated for world river basins (Meybeck et al., 2013). Besides taking into account the watershed as an impluvium for water collection, this classification also considers the hydroclimate zones. To date, there have been two estimates from global hydroelectric reservoirs, and three from all types of reservoirs. However, the estimates differ from each other. For hydroelectric reservoirs, estimates by Hertwich (2013) (522 Tg CO2 Eq) were twice as high as those by Barros et al. (2011) (276 Tg CO2 Eq). For all reservoirs, the results estimated by St. Louis et al. (2000) were the highest; the amount of CH4-C and CO2-C emissions (55 Tg CH4-C and 270 Tg CO2-C) was three and eight times higher, respectively, than that estimated by others [Bastviken et al. (2011) for CH4 only and Deemer et al. (2016) for the three gases]. Here, we estimated the annual GHG emissions from global reservoirs as 635.4 Tg CO2 Eq based on a new classification method, and our estimations are close to those of Deemer et al. (2016). Although there are some differences between each estimation, it can be acknowledged that GHG emissions from global reservoirs should not be neglected, especially because the number of reservoirs could increase further for water resource management (Zarfl et al., 2015) and hydropower production (Muller, 2019). However, we propose that GHG emissions from reservoirs need future research efforts due to their large spatiotemporal variations, i.e., conducting more field measurements of GHG emissions from reservoirs worldwide (e.g., diffusive/ebullitive fluxes from surface water, as well as downstream degassing covering seasonal scale) and in the long term so as to establish the impact of the trophic state of reservoirs on GHG emissions (DelSontro et al., 2018; Beaulieu et al., 2019). For such a worldwide effort, installing continuous measurement systems for monitoring of GHG emissions would be appreciated (Gerardo-Nieto et al., 2019).
Uncertainties and Challenges in Estimating Total Greenhouse Gas Emissions From Reservoirs
Indeed, there is still uncertainty regarding the estimation of GHG emissions at the global scale due to the numerous interacting factors. First, the total surface area of global reservoirs varies from 0.26 × 10⁶ to 1.5 × 10⁶ km2 (St. Louis et al., 2000; Downing et al., 2006). Based on the Global Reservoir and Dam Database (GRanD, v. 1.1), Lehner et al. (2011) estimated that reservoirs with more than 0.1 km3 storage capacity cover 0.3 × 10⁶ km2 (excluding regulated natural lakes, see Estimating Present and Long-Term Evolution of Greenhouse Gas Emissions at the Global Scale Section), which was considered a reliable area of global reservoirs (Li and Lu, 2012), and was also used by Bastviken et al. (2011) and Deemer et al. (2016). In the present study, 0.36 × 10⁶ km2 of reservoir surface area was used based on the updated database (GranD, v. 1.3), which adds new dams and reservoirs that were built between 2000 and 2016. In other words, reservoirs currently under construction (and planned) also affect GHG emissions (Zarfl et al., 2015). Not surprisingly, the different total areas used by various studies are therefore one of the important reasons for the variations in the GHG estimation results, i.e., St. Louis et al. (2000) estimated the highest GHG emissions from global reservoirs with a surface area of 1.5 × 10⁶ km2. Also, the more GHG measurements in reservoirs are collected, the more robust global estimations will be obtained. While we 1) expanded the dataset provided by Deemer et al. (2016) by ∼10%, 2) completed the gap in ebullitive CH4 emissions (by elaborating a new relationship from the DelSonto et al. (2018) and Deemer et al. (2016) datasets), and 3) used a classification that is conceptually fully adapted to reservoirs (hydrobelts; Meybeck et al., 2013), we obtained comparable GHG estimations (Table 1).
CH4 pathways also act as a major source of variation when estimating total GHG emissions from reservoirs, especially for ebullitive CH4 flux, which has been described as being rather stochastic with high spatial and temporal heterogeneity (Delsontro et al., 2011, 2015; Deemer et al., 2016). Therefore, ebullitive CH4 flux was reported to be highly unpredictable and would greatly limit accurate estimations of CH4 emissions from reservoirs (Prairie et al., 2018), while CH4 ebullition was found to vary more temporally than spatially (Linkhorst et al., 2020). We have also emphasized the scarcity of data on N2O emissions (1/3 and ¼ of CH4 and CO2 records, respectively). Moreover, much more research is required to assess the potential importance of downstream GHG emissions, which may constitute an important pathway of GHG release to the atmosphere. Such a mechanism, however, remains poorly studied (Abril et al., 2005).
Influencing Factors of Greenhouse Gas Emissions From Reservoirs
Existing studies suggest that the influencing factors of GHG emissions from reservoirs are multifaceted. CH4 and CO2 fluxes from hydroelectric reservoirs declined with age (Barros et al., 2011). We also attempted to analyze the correlations between GHG flux and reservoir age on the basis of our dataset. Unfortunately, no significant correlation was found between GHG flux and reservoir age (p > 0.05), partly because the reservoirs in our dataset are used not only for hydroelectric energy but also for flooding control, water supply, as well as irrigation (Supplementary Table S1). It has been reported that reservoir age affects GHG fluxes, probably due to flooded vegetation and/or organic matter accumulation after impoundment, which provides a large amount of substrate for GHG production, especially in hydroelectric reservoirs (Abril et al., 2005; Bastien, 2011; Teodoru et al., 2012; Maeck et al., 2013). Labile organic carbon (e.g., leaves and litter from the edge and internal primary production) should be mineralized at a higher rate than recalcitrant organic carbon (e.g., trees and soil carbon after impoundment) (Kelly et al., 1997). Furthermore, it was also suggested that CH4 formation can be predicted from sediment age in tropical reservoirs (Isidorova et al., 2019).
Residence time is also a factor that has a significant effect on physical and biological processes (Hutchinson and Loffler, 1956; Straškraba et al., 1993; Loffier, 2004). Previous studies indicated that reservoir residence time not only affects CH4 flux (Delmas et al., 2001; Abril et al., 2005), but also kinetically limits the extent of denitrification and nitrification in water bodies, and thus N2O flux (Seitzinger et al., 2006; Maavara et al., 2019). However, based on our compilation data, GHG emissions did not appear to be influenced by residence time (p > 0.05). A possible explanation is that the biological processes participating in the gas production in reservoirs can be controlled by multiple factors, among those, the effect of residence time may be offset. In other words, we should be cautious when estimating GHG emissions from global reservoirs using residence time only.
In addition to the aforementioned intrinsic characteristics of reservoirs, we found a positive relationship between their catchment characteristics and GHG flux (Figure 4, terrestrial NPP and precipitation vs CH4 and CO2 emissions). Indeed, precipitation can flush terrestrial carbon and other elements such as nutrients into reservoir waters and affect CO2 and CH4 emissions (Rantakari and Kortelainen, 2005). Maberly et al. (2013) also indicated that catchment productivity plays an important role in controlling CO2 emissions from lakes. These two relationships reinforce the strong link found between inland water bodies, their catchments, and GHG emissions (Cole et al., 2007). Moreover, we also aimed to explore the impact of the trophic state of reservoirs (different TP concentrations) on GHG emissions (Figure 2, and Supplementary Table S2), and our results indicate that eutrophication can potentially enhance GHG emissions from reservoirs (Beaulieu et al., 2019). The relationship between GHG emissions and trophic state has been widely investigated in different aquatic ecosystems; however, different conclusions have been drawn (Gu et al., 2011; Trolle et al., 2012; Knoll et al., 2013; Pacheco et al., 2014; Almeida et al., 2016). Overall, GHGs are produced by related biogeochemical processes, which could be impacted by the characteristics of reservoirs (e.g., temperature, depth, thermal stratification, and trophic status) and their catchments (land use, terrestrial net primary production, and human activities), and therefore complicate the identification of influencing factors at a large scale.
Long-Term Greenhouse Gas Emissions From Reservoirs
Based on the GRanD database in the long term and on our own approach for estimating the GHG emissions by hydrobelts, we have identified two periods of GHG emissions: from 1950 to the 1980s (period I), and from the 1980s to the present (period II). Period I corresponds to post-World War II. In these 3 decades the world population doubled (2.5 vs Five billion people in 1950 and 1980, respectively, https://ourworldindata.org/world-population-growth), requiring modernization (e.g., industries, agriculture) to meet society's basic needs but also the demand for more wellbeing (domestic goods, household equipment). Although this period of continuous growth was characterized by cheap fossil energy (Dyer and Desjardins, 2009), most of the reservoirs were constructed for water irrigation, drinking water production, health and personal hygiene, and for producing energy to power this modernization. All these factors determine the existing distribution patterns of global reservoirs, including their number as well as their surface area. For period II, although the world population increased at the same rate (7.5 billion in 2015), the construction of reservoirs slowed down. However, the surface area of reservoirs globally will still increase in the next 10–20 years, due to the 3,700 hydropower dams that were either planned or are under construction, which may contribute to an additional 280–1,100 Tg CO2 and 10–40 Tg CH4 (Zarfl et al., 2015) in GHGs.
Indeed, it is difficult to analyze the impacts of potential changes in the reservoirs (e.g., direct inputs, water management) and their watershed (e.g., land use, climate) on GHG emissions. These changes were not considered in our estimates of the long-term evolution of GHG emissions at the global scale. However, this would not modify the general trend of GHG emissions—i.e., a strong increase during period I, with fluxes reaching a plateau in period II—but values could be over- or underestimated. For example, previous results have indicated that land use change associated with catchment productivity affects CO2 emissions from lakes and reservoirs (Maberly et al., 2013; Junger et al., 2019). As mentioned earlier, eutrophication is a common feature of reservoirs (Gunkel, 2009), often increasing CH4 emissions (Beaulieu et al., 2019), and eutrophication of reservoirs could be further amplified by future climate change (Sinha et al., 2017). However, in many countries where sanitation has been (or is being) improved, eutrophication can be alleviated (e.g., Lake Biwa, Japan; Hsieh et al., 2011). Therefore, management agencies should implement effective measures for better control of the trophic state of inland water, not only to improve water quality, but also to reduce GHG emissions (Li et al., 2021).
Conclusion
In this study, a novel classification method based on the hydrobelt concept was used to estimate GHG emissions from global reservoirs. Based on the dataset gathered from reservoirs at the global scale from the literature and from new data that we have added, we estimated that annual GHG emissions were approximately 12.9 Tg CH4-C, 50.8 Tg CO2-C, and 0.04 Tg N2O-N. In terms of total carbon emissions (CH4-C and N2O-N, calculated as CO2 eq), annual carbon emissions from global reservoirs amount to 2.3% of total carbon emissions from inland freshwaters. Areal fluxes of CH4 and CO2 showed significant differences within hydrobelts, a spatial pattern that should be taken into account when estimating the amount of GHG emissions from global reservoirs. In addition, the characteristics of reservoirs (e.g., geographical location) and their catchments (e.g., surrounding terrestrial NPP, and precipitation) may influence GHG emissions. Our results showed that updating the number of GHG measurements and the surface area of all impounded reservoirs, including small reservoirs not documented in the database and all those being planned, would help anticipate future GHG emissions from reservoirs. Tracing back the GHG emissions of reservoirs, albeit by simply linking the long-term change of the reservoir surface areas with the present areal GHG emissions, provides a trend of these global “new” emissions from reservoirs and allows us to anticipate their future impact with further impoundments.
Data Availability Statement
The original contributions presented in the study are included in the article/Supplementary Material, further inquiries can be directed to the corresponding author.
Author Contributions
XY, JG, and VT designed the general framework of this study, XY collected and analyzed the data with suggestions from the other authors, and all the authors contributed to discussions and improvements of this paper.
Funding
XY was supported by the China Scholarship Council (CSC, No. 201806860053) and supplemented by the PIREN-Seine programme (https://www.piren-seine.fr/). JG and VT are, respectively, permanent staff at the CNRS and Sorbonne Université.
Conflict of Interest
The authors declare that the research was conducted in the absence of any commercial or financial relationships that could be construed as a potential conflict of interest.
Acknowledgments
We warmly thank Gilles Billen, Sophie Guillon, and Dominique Amon-Moreau for their valuable suggestions. XY is pleased to thank Yang Su for her encouragement in this study.
Supplementary Material
The Supplementary Material for this article can be found online at: https://www.frontiersin.org/articles/10.3389/fenvs.2021.705477/full#supplementary-material
References
Abril, G., Guérin, F., Richard, S., Delmas, R., Galy-Lacaux, C., Gosse, P., et al. (2005). Carbon Dioxide and Methane Emissions and the Carbon Budget of a 10-year Old Tropical Reservoir (Petit Saut, French Guiana). Glob. Biogeochem. Cycles 19, 1–16. doi:10.1029/2005GB002457
Almeida, R. M., Nóbrega, G. N., Junger, P. C., Figueiredo, A. V., Andrade, A. S., de Moura, C. G. B., et al. (2016). High Primary Production Contrasts with Intense Carbon Emission in a Eutrophic Tropical Reservoir. Front. Microbiol. 7, 717. doi:10.3389/fmicb.2016.00717
Barros, N., Cole, J. J., Tranvik, L. J., Prairie, Y. T., Bastviken, D., Huszar, V. L. M., et al. (2011). Carbon Emission from Hydroelectric Reservoirs Linked to Reservoir Age and Latitude. Nat. Geosci 4, 593–596. doi:10.1038/ngeo1211
Bastien, J. (2011). CO2 and CH4 Diffusive and Degassing Fluxes from 2003 to 2009 at Eastmain 1 Reservoir, Québec, Canada. Inland Waters 1, 113–123. doi:10.5268/iw-1.2.349
Bastviken, D., Tranvik, L. J., Downing, J. A., Crill, P. M., and Enrich-Prast, A. (2011). Freshwater Methane Emissions Offset the continental Carbon Sink. Science 331, 50. doi:10.1126/science.1196808
Beaulieu, J. J., Balz, D. A., Birchfield, M. K., Harrison, J. A., Nietch, C. T., Platz, M. C., et al. (2018). Effects of an Experimental Water-Level Drawdown on Methane Emissions from a Eutrophic Reservoir. Ecosystems 21, 657–674. doi:10.1007/s10021-017-0176-2
Beaulieu, J. J., DelSontro, T., and Downing, J. A. (2019). Eutrophication Will Increase Methane Emissions from Lakes and Impoundments during the 21st century. Nat. Commun. 10, 1375. doi:10.1038/s41467-019-09100-5
Beaulieu, J. J., Nietch, C. T., and Young, J. L. (2015). Controls on Nitrous Oxide Production and Consumption in Reservoirs of the Ohio River Basin. J. Geophys. Res. Biogeosci. 120, 1995–2010. doi:10.1002/2015JG002941
Bevelhimer, M., Stewart, A., Fortner, A., Phillips, J., and Mosher, J. (2016). CO2 Is Dominant Greenhouse Gas Emitted from Six Hydropower Reservoirs in Southeastern United States during Peak Summer Emissions. Water 8, 15. doi:10.3390/w8010015
Cole, J. J., Prairie, Y. T., Caraco, N. F., McDowell, W. H., Tranvik, L. J., Striegl, R. G., et al. (2007). Plumbing the Global Carbon Cycle: Integrating Inland Waters into the Terrestrial Carbon Budget. Ecosystems 10, 171–184. doi:10.1007/s10021-006-9013-8
Deemer, B. R., Harrison, J. A., Li, S., Beaulieu, J. J., Delsontro, T., Barros, N., et al. (2016). Greenhouse Gas Emissions from Reservoir Water Surfaces: A New Global Synthesis. Bioscience 66, 949–964. doi:10.1093/biosci/biw117
Delmas, R., Galy-Lacaux, C., and Richard, S. (2001). Emissions of Greenhouse Gases from the Tropical Hydroelectric Reservoir of Petit Saut (French Guiana) Compared with Emissions from thermal Alternatives. Glob. Biogeochem. Cycles 15, 993–1003. doi:10.1029/2000GB001330
Delmas, R., Richard, S., Guérin, F., Abril, G., Galy-Lacaux, C., Delon, C., et al. (2005). “Long Term Greenhouse Gas Emissions from the Hydroelectric Reservoir of Petit Saut (French Guiana) and Potential Impacts,” in Greenh. Gas Emiss. — Fluxes Process. Editors A. Tremblay, L. Varfalvy, C. Roehm, and M. Garneau (Berlin, Heidelberg: Springer), 293–312. doi:10.1007/978-3-540-26643-3_13
DelSontro, T., Beaulieu, J. J., and Downing, J. A. (2018). Greenhouse Gas Emissions from Lakes and Impoundments: Upscaling in the Face of Global Change. Limnol. Oceanogr. 3, 64–75. doi:10.1002/lol2.10073
Delsontro, T., Kunz, M. J., Kempter, T., Wüest, A., Wehrli, B., and Senn, D. B. (2011). Spatial Heterogeneity of Methane Ebullition in a Large Tropical Reservoir. Environ. Sci. Technol. 45, 9866–9873. doi:10.1021/es2005545
Delsontro, T., McGinnis, D. F., Wehrli, B., and Ostrovsky, I. (2015). Size Does Matter: Importance of Large Bubbles and Small-Scale Hot Spots for Methane Transport. Environ. Sci. Technol. 49, 1268–1276. doi:10.1021/es5054286
Demarty, M., and Bastien, J. (2011). GHG Emissions from Hydroelectric Reservoirs in Tropical and Equatorial Regions: Review of 20 Years of CH4 Emission Measurements. Energy Policy 39, 4197–4206. doi:10.1016/j.enpol.2011.04.033
Downing, J. A., Prairie, Y. T., Cole, J. J., Duarte, C. M., Tranvik, L. J., Striegl, R. G., et al. (2006). The Global Abundance and Size Distribution of Lakes, Ponds, and Impoundments. Limnol. Oceanogr. 51, 2388–2397. doi:10.4319/lo.2006.51.5.2388
Dyer, J. A., and Desjardins, R. L. (2009). A Review and Evaluation of Fossil Energy and Carbon Dioxide Emissions in Canadian Agriculture. J. Sustain. Agric. 33, 210–228. doi:10.1080/10440040802660137
Fearnside, P. M. (2006). Greenhouse gas emissions from hydroelectric dams: Reply to Rosa et al. Climatic Change 75, 103–109. doi:10.1007/s10584-005-9016-z
Fearnside, P. M. (1995). Hydroelectric Dams in the Brazilian Amazon as Sources of 'Greenhouse' Gases. Envir. Conserv. 22, 7–19. doi:10.1017/S0376892900034020
Ford, D. E., and Johnson, L. S. (1986). An Assessment of Reservoir Mixing Processes. Technical Report E-86-7. Vicksburg, MS: U.S. Army Engineers Waterways Experiment StationAvailable at: https://usace.contentdm.oclc.org/digital/collection/p266001coll1/id/2728/ (Accessed June 1, 2021).
Gerardo-Nieto, O., Vega-Peñaranda, A., Gonzalez-Valencia, R., Alfano-Ojeda, Y., and Thalasso, F. (2019). Continuous Measurement of Diffusive and Ebullitive Fluxes of Methane in Aquatic Ecosystems by an Open Dynamic Chamber Method. Environ. Sci. Technol. 53, 5159–5167. doi:10.1021/acs.est.9b00425
Giles, J. (2006). Methane Quashes green Credentials of Hydropower. Nature 444, 524. doi:10.1038/444524a
Gu, B., Schelske, C. L., and Coveney, M. F. (2011). Low Carbon Dioxide Partial Pressure in a Productive Subtropical lake. Aquat. Sci. 73, 317–330. doi:10.1007/s00027-010-0179-y
Gunkel, G. (2009). Hydropower - A green Energy? Tropical Reservoirs and Greenhouse Gas Emissions. Clean. Soil Air Water 37, 726–734. doi:10.1002/clen.200900062
Hertwich, E. G. (2013). Addressing Biogenic Greenhouse Gas Emissions from Hydropower in LCA. Environ. Sci. Technol. 47, 9604–9611. doi:10.1021/es401820p
Holgerson, M. A., and Raymond, P. A. (2016). Large Contribution to Inland Water CO2 and CH4 Emissions from Very Small Ponds. Nat. Geosci 9, 222–226. doi:10.1038/ngeo2654
Hsieh, C. H., Sakai, Y., Ban, S., Ishikawa, K., Ishikawa, T., Ichise, S., et al. (2011). Eutrophication and Warming Effects on Long-Term Variation of Zooplankton in Lake Biwa. Biogeosciences 8, 1383–1399. doi:10.5194/bg-8-1383-2011
Hutchinson, G. E., and Loffler, H. (1956). The thermal Classification of Lakes. Proc. Natl. Acad. Sci. 42, 84–86. doi:10.1073/pnas.42.2.84
Isidorova, A., Grasset, C., Mendonça, R., and Sobek, S. (2019). Methane Formation in Tropical Reservoirs Predicted from Sediment Age and Nitrogen. Sci. Rep. 9, 1–9. doi:10.1038/s41598-019-47346-7
Jiang, X., Zhang, L., Yao, X., Xu, H., and Li, M. (2017). Greenhouse Gas Flux at Reservoirs of Jiangxi Province and its Influencing Factors. J. Lake Sci. 29, 1000–1008. doi:10.18307/2017.0424
Junger, P. C., Dantas, F. D. C. C., Nobre, R. L. G., Kosten, S., Venticinque, E. M., Araújo, F. D. C., et al. (2019). Effects of Seasonality, Trophic State and Landscape Properties on CO2 Saturation in Low-Latitude Lakes and Reservoirs. Sci. Total Environ. 664, 283–295. doi:10.1016/j.scitotenv.2019.01.273
Kelly, C. A., Rudd, J. W. M., Bodaly, R. A., Roulet, N. P., St.Louis, V. L. V. L., Heyes, A., et al. (1997). Increases in Fluxes of Greenhouse Gases and Methyl Mercury Following Flooding of an Experimental Reservoir†. Environ. Sci. Technol. 31, 1334–1344. doi:10.1021/es9604931
Knoll, L. B., Vanni, M. J., Renwick, W. H., Dittman, E. K., and Gephart, J. A. (2013). Temperate Reservoirs Are Large Carbon Sinks and Small CO2sources: Results from High-Resolution Carbon Budgets. Glob. Biogeochem. Cycles 27, 52–64. doi:10.1002/gbc.20020
Kosten, S., Roland, F., Da Motta Marques, D. M. L., Van Nes, E. H., Mazzeo, N., Sternberg, L. D. S. L., et al. (2010). Climate-dependent CO2emissions from Lakes. Glob. Biogeochem. Cycles 24, a–n. doi:10.1029/2009GB003618
Lehner, B., Liermann, C. R., Revenga, C., Vörösmarty, C., Fekete, B., Crouzet, P., et al. (2011). High‐resolution Mapping of the World's Reservoirs and Dams for Sustainable River‐flow Management. Front. Ecol. Environ. 9, 494–502. doi:10.1890/100125
Li, S., Bush, R. T., Santos, I. R., Zhang, Q., Song, K., Mao, R., et al. (2018). Large Greenhouse Gases Emissions from China's Lakes and Reservoirs. Water Res. 147, 13–24. doi:10.1016/j.watres.2018.09.053
Li, S., and Lu, X. X. (2012). Uncertainties of Carbon Emission from Hydroelectric Reservoirs. Nat. Hazards 62, 1343–1345. doi:10.1007/s11069-012-0127-3
Li, Y., Shang, J., Zhang, C., Zhang, W., Niu, L., Wang, L., et al. (2021). The Role of Freshwater Eutrophication in Greenhouse Gas Emissions: A Review. Sci. Total Environ. 768, 144582. doi:10.1016/j.scitotenv.2020.144582
Linkhorst, A., Hiller, C., DelSontro, T., M. Azevedo, G., Mendonça, R., et al. (2020). Comparing Methane Ebullition Variability across Space and Time in a Brazilian Reservoir. Limnol Oceanogr 65, 1623–1634. doi:10.1002/lno.11410
Loffier, H. (2004). “The origin of lake basins,” in The Lakes Handbook. 2nd Edn, Editors P. E. O'Sullivan, and C. S. Reynolds (United Kingdom: Blackwell Publishing), Vol. 1, 8–60. doi:10.1002/9780470999271
Louis, S. V. L., Kelly, C. A., Duchemin, É., Rudd, J. W. M., and Rosenberg, D. M. (2000). Reservoir Surfaces as Sources of Greenhouse Gases to the Atmosphere: A Global EstimateReservoirs Are Sources of Greenhouse Gases to the Atmosphere, and Their Surface Areas Have Increased to the point where They Should Be Included in Global Inventories of Anthropogenic Emissions of Greenhouse Gases. Bioscience 50, 766–775. doi:10.1641/0006-3568(2000)050[0766:rsasog]2.0.co;2
Maavara, T., Lauerwald, R., Laruelle, G. G., Akbarzadeh, Z., Bouskill, N. J., Van Cappellen, P., et al. (2019). Nitrous Oxide Emissions from Inland Waters: Are IPCC Estimates Too High? Glob. Change Biol. 25, 473–488. doi:10.1111/gcb.14504
Maberly, S. C., Barker, P. A., Stott, A. W., and De Ville, M. M. (2013). Catchment Productivity Controls CO2 Emissions from Lakes. Nat. Clim Change 3, 391–394. doi:10.1038/nclimate1748
Maeck, A., Delsontro, T., McGinnis, D. F., Fischer, H., Flury, S., Schmidt, M., et al. (2013). Sediment Trapping by Dams Creates Methane Emission Hot Spots. Environ. Sci. Technol. 47, 8130–8137. doi:10.1021/es4003907
Meybeck, M., Kummu, M., and Dürr, H. H. (2013). Global Hydrobelts and Hydroregions: Improved Reporting Scale for Water-Related Issues?. Hydrol. Earth Syst. Sci. 17, 1093–1111. doi:10.5194/hess-17-1093-2013
Muller, M. (2019). Hydropower Dams Can Help Mitigate the Global Warming Impact of Wetlands. Nature 566, 315–317. doi:10.1038/d41586-019-00616-w
Pacheco, F., Roland, F., and Downing, J. (2014). Eutrophication Reverses Whole-lake Carbon Budgets. Inland waters 4, 41–48. doi:10.5268/IW-4.1.614
Prairie, Y. T., Alm, J., Beaulieu, J., Barros, N., Battin, T., Cole, J., et al. (2018). Greenhouse Gas Emissions from Freshwater Reservoirs: What Does the Atmosphere See?. Ecosystems 21, 1058–1071. doi:10.1007/s10021-017-0198-9
Rantakari, M., and Kortelainen, P. (2005). Interannual Variation and Climatic Regulation of the CO2 Emission from Large Boreal Lakes. Glob. Change Biol 11, 1368–1380. doi:10.1111/j.1365-2486.2005.00982.x
Raymond, P. A., Hartmann, J., Lauerwald, R., Sobek, S., McDonald, C., Hoover, M., et al. (2013). Global Carbon Dioxide Emissions from Inland Waters. Nature 503, 355–359. doi:10.1038/nature12760
Rosa, L. P., Dos Santos, M. A., Matvienko, B., Dos Santos, E. O., and Sikar, E. (2004). Greenhouse Gas Emissions from Hydroelectric Reservoirs in Tropical Regions. Climatic Change 66, 9–21. doi:10.1023/B:CLIM.0000043158.52222.ee
Rosa, L. P., Santos, M. A. D., Matvienko, B., Sikar, E., and Santos, E. O. D. (2006). Scientific Errors in the Fearnside Comments on Greenhouse Gas Emissions (GHG) from Hydroelectric Dams and Response to His Political Claiming. Climatic Change 75, 91–102. doi:10.1007/s10584-005-9046-6
Rudd, J. W. M., Hecky, R. E., Harris, R., and Kelly, C. A. (1993). Are Hydroelectric Reservoirs Significant Sources of Greenhouse Gases? Available at: http://www.jstor.org/stable/4314078%0A http://inis.iaea.org/Search/search.aspx?orig_q=RN:24074728 (Accessed September 4, 2019).
Seitzinger, S., Harrison, J. A., Böhlke, J. K., Bouwman, A. F., Lowrance, R., Peterson, B., et al. (2006). Denitrification across Landscapes and Waterscapes: a Synthesis. Ecol. Appl. 16, 2064–2090. doi:10.1890/1051-0761(2006)016[2064:dalawa]2.0.co;2
Sinha, E., Michalak, A. M., and Balaji, V. (2017). Eutrophication Will Increase during the 21st century as a Result of Precipitation Changes. Science 357, 405–408. doi:10.1126/SCIENCE.AAN2409
Straškraba, M., Tundisi, J. G., and Duncan, A. (1993). “State-of-the-art of Reservoir Limnology and Water Quality Management,” In Comparative Reservoir Limnology and Water Quality Management (Dordrecht, Netherlands: Springer), 213–288. doi:10.1007/978-94-017-1096-1_13
Teodoru, C. R., Bastien, J., Bonneville, M.-C., Del Giorgio, P. A., Demarty, M., Garneau, M., et al. (2012). The Net Carbon Footprint of a Newly Created Boreal Hydroelectric Reservoir. Glob. Biogeochem. Cycles 26, a–n. doi:10.1029/2011gb004187
Tremblay, A. (Editor) (2005). Greenhouse Gas Emissions – Fluxes and Processes: Hydroelectric Reservoirs and Natural Environments. Environ. Sci. Ser. New York: Springer, 732. doi:10.1007/978-3-540-26643-3 Available at: https://books.google.com/books?hl=zh-CN&lr=&id=A1xi5LDF7F4C&oi=fnd&pg=PA21&dq=.+Greenhouse+gas+Emissions-Fluxesand+Processes:+hydroelectric+reservoirs+and+natural+environments&ots=VBJLTvyqzS&sig=QzDr7sQI1OOoj3SF99BXd0FgkCA (Accessed September 4, 2019).
Trolle, D., Staehr, P. A., Davidson, T. A., Bjerring, R., Lauridsen, T. L., Søndergaard, M., et al. (2012). Seasonal Dynamics of CO2 Flux across the Surface of Shallow Temperate Lakes. Ecosystems 15, 336–347. doi:10.1007/s10021-011-9513-z
Yan, X., Thieu, V., and Garnier, J. (2021). Long-term Assessment of Nutrient Budgets for the Four Reservoirs of the Seine Basin (France). Sci. Total Environ. 778, 146412. doi:10.1016/j.scitotenv.2021.146412
Zamani, B., Koch, M., and Hodges, B. R. (2020). Effects of Morphology in Controlling Propagation of Density Currents in a Reservoir Using Uncalibrated Three-Dimensional Hydrodynamic Modeling. J. Limnol. 79, 238–253. doi:10.4081/jlimnol.2020.1942
Keywords: global reservoirs, greenhouse gas, hydrobelts, long term evolution, controlling factors
Citation: Yan X, Thieu V and Garnier J (2021) Long-Term Evolution of Greenhouse Gas Emissions From Global Reservoirs. Front. Environ. Sci. 9:705477. doi: 10.3389/fenvs.2021.705477
Received: 05 May 2021; Accepted: 09 July 2021;
Published: 20 July 2021.
Edited by:
Shaoda Liu, Beijing Normal University, ChinaReviewed by:
Elena Neverova-Dziopak, AGH University of Science and Technology, PolandYan Weijin, Institute of Geographic Sciences and Natural Resources Research, (CAS), China
Behnam Zamani, Thünen Institut of Climate-Smart Agriculture, Germany
Copyright © 2021 Yan, Thieu and Garnier. This is an open-access article distributed under the terms of the Creative Commons Attribution License (CC BY). The use, distribution or reproduction in other forums is permitted, provided the original author(s) and the copyright owner(s) are credited and that the original publication in this journal is cited, in accordance with accepted academic practice. No use, distribution or reproduction is permitted which does not comply with these terms.
*Correspondence: Xingcheng Yan, xingcheng.yan@upmc.fr