Soil Characteristics and Hydromorphological Patterns Control Denitrification at the Floodplain Scale
 Ute Susanne Kaden1,2*
  Elmar Fuchs3 Sophie Geyer1
  Thomas Hein2,4 Peter Horchler3 Holger Rupp5
  Mathias Scholz1 Christiane Schulz-Zunkel1
  Gabriele Weigelhofer2,4
- 1Department of Conservation Biology and Social-Ecological Systems, UFZ – Helmholtz Centre for Environmental Research, Leipzig, Germany
- 2Institute of Hydrobiology and Aquatic Ecosystem Management, BOKU – University of Natural Resources and Life Sciences, Vienna, Austria
- 3BfG – German Federal Institute of Hydrology, Koblenz, Germany
- 4WCL – WasserCluster Lunz, Lunz am See, Austria
- 5Department of Soil System Science, UFZ – Helmholtz Centre for Environmental Research, Altmärkische Wische, Germany
Nitrate pollution in aquatic ecosystems is still a major problem in Germany. There is a great potential to permanently remove nitrate from aquatic systems through denitrification as a relevant ecosystem function. However, the controlling factors and the dimension of the denitrification potential are still not fully understood due to the high complexity of the process. This study presents the combined assessment of potential soil denitrification rates, physical and chemical soil parameters, and hydrological parameters from six floodplains of four large German rivers, namely the Rhine, the Elbe, the Weser, and the Main. Based on multivariate statistics, results show that the denitrification potential of soil was almost solely controlled by soil pH. The lab assays showed mean soil denitrification potentials of 6.4–11.4 mg N m−2 h−1 (pH < 7) and 23.0–30.5 mg N m−2 h−1 (pH > 7). We contend that when upscaling these estimates to annual rates of potential denitrification, the duration of average inundation should be incorporated, as this accounts for water saturation and nutrient supply − the major controlling variables for denitrification. Results provide evidence that the denitrification potential can only be fully exploited in frequently inundated floodplains. Thus, despite favorable soil conditions for denitrification, floodplains that have suffered from anthropogenic impacts, lose their importance in nitrate removal for the river system. We conclude that pH and lateral hydrological connectivity are likely to be key factors that should be considered when estimating denitrification as an ecosystem function.
Introduction
Based on the knowledge that floodplains provide key ecosystem services to improve water and soil quality by unmanaged, natural processes, these ecotones have become of great interest for management strategies (Mitsch et al., 2000; Stander and Ehrenfeld, 2009). In Germany, for instance, dike opening projects have been realized to extend the active floodplain area as an easily affordable measure to meet the requirements of the EU-Water Framework Directive (WFD). This is based on the assumption that lateral hydrological connectivity enhances nutrient retention through longer water residence times in the floodplains (Gergel et al., 2005; Rücker and Schrautzer, 2010). However, nutrient retention processes within river-floodplain systems are highly complex, heterogeneous in space and time, and the relative contribution of different floodplain compartments and different abiotic and biotic processes are still not fully understood (Fisher and Acreman, 2004; Natho and Venohr, 2012; Richardson et al., 2019). In the face of high nitrate loadings of many European rivers, there is a strong interest in the potential of floodplains for denitrification (Behrendt et al., 2002; European Environment Agency, 2012). Although the dynamics of various nitrate-related processes in floodplains remain partially unclear, through denitrification, there is a great potential to permanently remove nitrate from surface waters, the groundwater, and soils (Saunders and Kalff, 2001). Denitrifying bacteria act facultative aerobic, but can shift to anaerobic respiration when exposed to an anoxic milieu (Zaman et al., 2012). Their performance is optimized under conditions of high nitrate and organic carbon availability and low oxygen amounts (Zaman et al., 2012). Thus inundation and flood pulses, resulting in a lack of soil aeration, are implied to be important for effective denitrification (Sabater et al., 2003; Shrestha et al., 2014). Other soil and environmental factors affecting denitrification are -pH, soil texture, temperature, drying–wetting cycles, etc. (Šimek and Cooper, 2002; Saggar et al., 2013; Pinto et al., 2021). Among the different aquatic and terrestrial floodplain compartments, floodplain soils are of particular interest for estimating the floodplain’s denitrification potential due to their large spatial extent. Besides, floodplain soils are most affected by inundation patterns and floodplain degradation and restoration (Pinay et al., 2007). Thus, they are subjected to control aerobic and anaerobic soil conditions through changing water levels and nutrient supply, which in turn controls the structure and functioning of the microbial community and therefore processes such as denitrification (Baldwin and Mitchell, 2000; Pinay et al., 2002; Hefting et al., 2004; Wilson et al., 2011).
For estimating the potential nitrate removal capacity of floodplains and determining their role in mitigating nutrient loads in rivers, soil denitrification has to be estimated on a landscape scale. There are diverse approaches for measuring denitrification (Groffman et al., 2006) but it has remained a difficulty to date. Along with temporal and spatial variability, this leads to highly varying estimations of the nitrate retention capacity of floodplains, ranging from less than 1 kg N ha−1 a−1 to more than 600 kg N ha−1 a−1 (Arheimer and Wittgren, 2002; Forshay and Stanley, 2005; Gergel et al., 2005; Fabre et al., 2020; Walton et al., 2020). In Germany, knowledge about the spatial distribution of the denitrification potential in floodplains on the landscape scale is rather limited. At the moment, a proxy-based approach with five denitrification classes is used for the nitrogen retention of German soils, depending mainly on the soil type (Brunotte et al., 2009; Schulz-Zunkel et al., 2012). In this classification, a denitrification rate of 30–50 kg N ha−1 a−1 was defined for alluvial soils in general, which is raised to 100–150 kg ha−1 a−1 if the floodplain status (FlStC) is not “severely or totally modified”, following the criteria of morphodynamics/floodplain relief, hydrodynamics/flooding, and vegetation/land use (Brunotte et al., 2009; European Environment Agency, 2016). In terms of flooding dynamics, this proxy-based approach needs to be combined with model-based approaches, but first and foremost it is imperative to conduct more research on floodplain denitrification as data availability is still limited here (Natho et al., 2013). Therefore, this study was conducted in cooperation with the German Federal Institute of Hydrology 1) to analyze key controlling factors for soil denitrification potential in a range of floodplain ecosystems, 2) to assess the impact of inundation duration on potential denitrification capacities and 3) to provide data for possible future adjustments to the existing proxy-based approach and the denitrification classes used for German floodplains. For this purpose, six study areas at four large German rivers were chosen for analyzing soil denitrification potential, potential denitrification capacities, soil physical and chemical properties, and several hydrological parameters. Floodplain soil sampling points were randomly and evenly distributed among calculated flooding gradients to ensure the best possible comparability of the different study areas. We hypothesized that the greatest variations in soil denitrification potential are driven by hydrological factors (e.g., inundation duration, flow path lengths) and soil properties (e.g., grain size distribution, pH). We further expected that the status of floodplains plays an important role and that anthropogenic impacts considerably reduce the nitrate retention potential.
Materials and Methods
Site Descriptions
Six floodplain study areas, located along four German rivers (the Elbe, the Weser, the Main and the Rhine), were chosen for the investigation (Figure 1). Based on floodplain heterogeneity, the size of the study areas varies between 3 and 120 ha. All sites [Elbe_R (ER), Elbe_S (ES), Weser_S (WS), Main_U (MU), Rhine_E (RE), Rhine_K (RK), Figure 1] differ in hydrology, geomorphology and anthropogenic influence, with the latter being strongest for the Weser and the Main. Table 1 summarizes the most important characteristics of each study area.
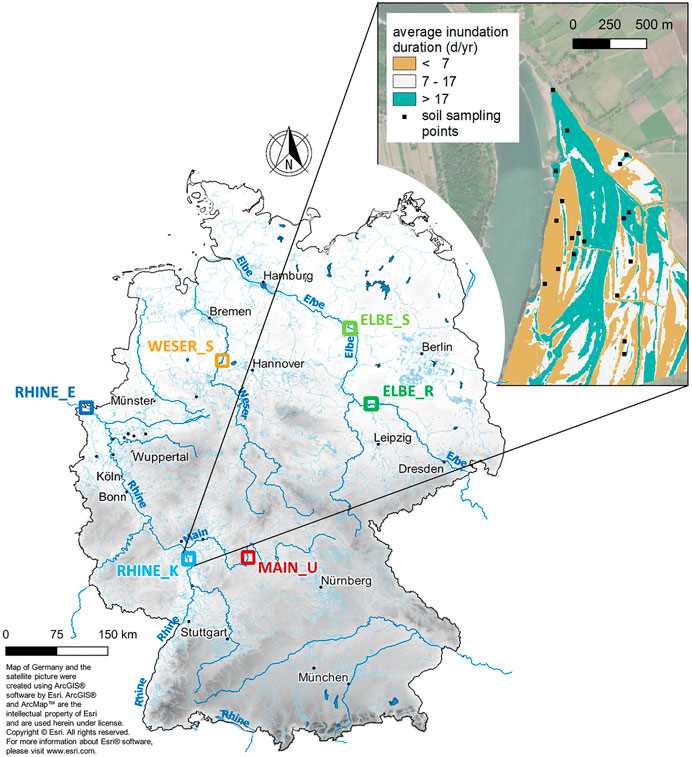
FIGURE 1. Location of the study areas in the six floodplains [Elbe_R (ER), Elbe_S (ES), Weser_S (WS), Main_U (MU), Rhine_E (RE), Rhine_K (RK)] in Germany with a detailed view of RK, located in the Upper Rhine region of Germany.
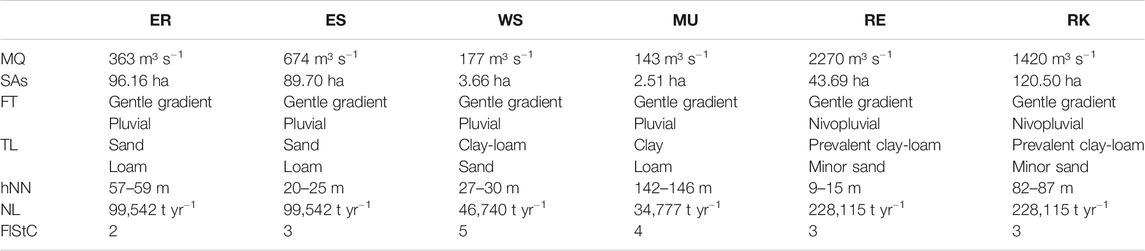
TABLE 1. Study site characterization of the study areas Elbe_R (ER), Elbe_S (ES), Weser_S (WS), Main_U (MU), Rhine_E (RE), and Rhine_K (RK). MQ – mean discharge, SAs – study area size, FT – floodplain type (Koenzen, 2005), TL – top layer (Koenzen, 2005), hNN – height above sea level, NL – nitrogen load (river) (BMU&BfG, 2007), FlStC – floodplain status class (Koenzen et al., 2021): 1 – nearly natural, 2 – slightly modified, 3 – moderately modified, 4 – severely modified, 5 – totally modified.
The river section comprising ER is characterized by large floodplains with alluvial forests and extended grassland. The old dike there was opened in 2006, creating 140 ha more retention space. ES is located further downstream and also characterized by large extended floodplains, mostly used as grassland. In contrast to the near-natural river landscapes of the Elbe, both WS and MU are strongly anthropogenically influenced by intensive river training with locks and weirs, causing low water level fluctuations. At the WS test section, alternative bank protection systems were installed in 1989 accompanied by flattening, willow planting, and stone fill removal. The narrow floodplains at MU were used as intensive grassland but were modified a few years ago by bank restructuring, including a strip representing a proper floodplain forest. The largest German river comprises a study area along the Upper Rhine (RK) and along the Lower Rhine (RE). Despite the strong impact on the entire Rhine floodplain landscape, both have nature reserve status with large, recent floodplains and near-natural flooding conditions. RK is located in the floodplain of a cut-off meander (Figure 1) and characterized by carbonate-containing soils. Downstream, on the border to the Netherlands, RE is dominated by extensive grassland with standing water bodies, siltation zones, and gravel banks.
Field Sampling
During summer 2017, floodplain soils were sampled at the six study areas. Sampling points were stratified random among flooding gradients, resulting from the subdivided distribution of the inundation duration. For each study area, three classes were defined within a range of 1 to max. 246 days of flooding, setting thresholds between classes at the 0.33 and 0.67 quantiles. Each class contained at least 5 points, resulting in 15–20 plots per study area. This ensured that rarely and often inundated plots from each study area were considered equally. For each sampling plot (2 m × 2 m), five repetitions (10 cm diameter × 20 cm depth) were taken using a soil auger. Each plot was located and saved with centimeter-level accuracy by using a GNSS system (Trimble R8). All samples per sampling plot were mixed to create one homogenized sample for further analysis. One part was stored at 4°C until soil physical and chemical parameters were measured, whereas the other was air-dried and sieved (<2 mm) and stored at room temperature until the denitrification potential (DP) measurements were taken. Soil bulk density was measured using three soil cutter cores (100 cm³) per plot. Additionally, the soil types of all plots were characterized (auger to a depth of 100 cm).
Soil Physical and Chemical Parameters
Physical and chemical soil parameters were measured using the following standardized analysis methods: pH (H2O) - DIN ISO 10390:2005-12, 2005, total organic carbon [TOC in % dry matter (DM)] - DIN EN 15936:2012-11, 2012, mineral nitrogen content (Nmin in % DM) – VDLUFA, (1991), particle size distribution (content of clay, silt, and sand in %) - DIN ISO 11277:2002-08, 2002, soil bulk density (BD in g cm−3) - DIN 18126:1996-11, 1996. Soil textures and types were defined based on soil mapping guidelines (Ad-hoc-AG Boden, 2005). Field capacity (FC in %) was calculated using BD, soil texture and humus content (TOC * 1.7) (DIN 4220:2008-11, Ad-hoc-AG Boden, 2005).
Potential Denitrification
One commonly applied method for estimating denitrification in soils is the acetylene inhibition technique (AIT). This method determines the denitrification potential (DP), which is defined as the amount of nitrous oxide (N2O) and dinitrogen (N2) released from soil within a given time period after enrichment with nitrate and carbon and anaerobic incubation in the presence of acetylene (Groffman et al., 1999). This method has been proven to work when comparing soils and ecosystems (Groffman et al., 2006; Felber et al., 2012; Russell et al., 2019) and allows the soil DP to be estimated at the landscape level. Parameters leading to bias are adjusted to be as low as possible, by using the AIT modified by Kaden et al. (2020), which addresses a time series analysis of rewetting as this is likely to strongly affect denitrification. This modification is based on the common assay for measuring denitrification enzyme activity (DEA) with the AIT developed by Smith and Tiedje (1979), that was modified by Groffman et al. (1999). Comparative method trials concluded that the use of soils with high nutrient and low sand contents reduces the risk of bias (Qin et al., 2013), which justifies the applicability of the AIT in the context of this study (Kaden et al., 2020). In short, soil samples were pre-incubated for 7 days (d) to 100% water-filled pore space (WFPS). 5–8 g of rewetted soil (5 g equivalent of dry soil) were added to 130 ml flasks. Then 5 ml of nutrient solution containing 6.8 g/L NaCH3COO and 2.9 g/L KNO3 equal to 2 mg C g−1 dry soil and 0.4 mg N g−1 dry soil, were added. The flasks were sealed with caps (air-tight butyl rubber septa) with two hoses (each with one valve) and made anaerobic by 3 min of flushing with N2. Subsequently 13 ml of N2 was substituted with acetylene (equal to 10 vol%). The flasks were incubated in the dark at 21°C. Previous experiments ensured that anaerobic conditions were maintained. Gas samples were taken and transferred into vacuumized vials with butyl septa and crimped caps, using a syringe. Nitrogen (N) that accumulated as N2O in the top of all flasks was analyzed using gas chromatography (GC-14B, Shimadzu, Duisburg, Germany) connected to an automatic sample-injection system (APS 96/20-K, ESWE, Gera, Germany). The gas chromatograph was equipped with an electron capture detector and a packed column (1/8’ Hayesep-Q, 80/100 mesh, length 4 m; Sigma-Aldrich, Darmstadt, Germany). Potential denitrification rates (DP in ng N g−1 h−1) were calculated by correcting the measured concentrations (ppm) for N2O dissolved in water [Bunsen coefficient = 0.65 (21°C)], divided by the incubation time (4 h) and expressed on the basis of dry soil matter (DM). DP was also analyzed under the same conditions but without acetylene to determine the amount of N denitrified to N2O (DPN2O in ng N g−1 h−1). The denitrification product ratio [DPR = N2O/(N2 + N2O)] was derived using the ratio of DPN2O to DP. In addition to the two treatments with and without acetylene, the experiment had a control treatment (without soil), all in triplicate.
Hydrological Calculations
Four hydrological parameters were calculated: average duration of yearly inundation (flood), height above mean water level (hMW), distance to the riverbank (distance), and average hydrological distance (flowpath). The average duration of yearly inundation (flood) of the sampling year (2017) and the last 5 and 30 years (yr) before sampling were derived using averaged yearly summations of the daily inundation information for each plot in all six study areas, calculated in MATLAB. Floodplains are characterized by the rise and fall of the water table of the alluvial aquifer which is coherent with that of the river channel (Krause et al., 2007; Stanford, 2007). This is reflected by overland inundation from the river channel to the floodplain when bank full conditions are exceeded, but also by flooding from below ground through the filling of the alluvial aquifer (Stanford, 2007). Based on this, for modeling purposes, plots with an elevation below the current river water level were assumed to be inundated. Data were based on the daily water levels of the adjacent gauge of the 30 years prior to sampling, from the Federal Waterways and Shipping Administration (WSV), provided by the German Federal Institute of Hydrology (BfG). The water level fluctuations of the most adjacent gauge were linearly transferred to the digital elevation model (DEM) of the study area, using a real-time water level difference between gauge and study area. This data was also used to calculate the height above the mean water level, which resulted from the difference between the plots’ height above sea level and the mean water level. The distance to the riverbank describes the shortest distance between each plot and the riverbank and was derived using proximity- and contour-tools in ArcGIS 10.7.1 (ESRI, 2011). To cover the supply of nutrients from the river water as a key element for the denitrification process, the hydrological distance (flowpath) as an important measure for connectivity was considered. It was defined as the length of the shortest surface path that the river water takes to a single plot in the floodplain. It was derived using the flow accumulation approach on the gridded DEMs of the floodplain areas and calculated using the TopoToolbox 2 (Schwanghart and Scherler, 2014) in MATLAB version 9.6.0. (MATLAB, 2019) (see example Figure 2).
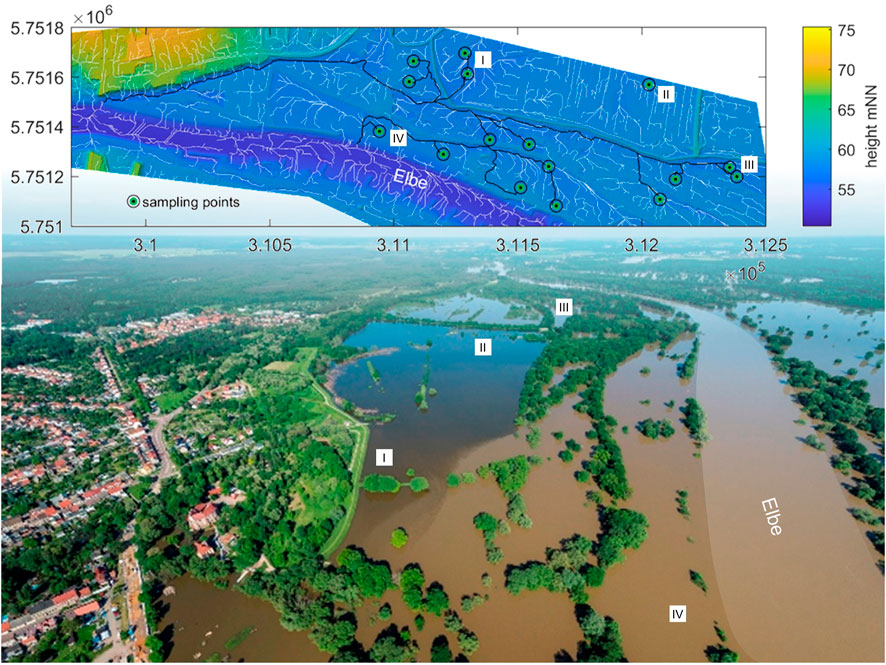
FIGURE 2. Hydrological connectivity of investigated plots for the Elbe_R (ER). Black lines show calculated flow paths based on the DEM using the flow accumulation approach from TopoToolbox2 in MATLAB. The dike was slit, hence two of the plots behind are connected (I), and one is not (II, no black line). This is confirmed by a helicopter photo (André Künzelmann/UFZ) of a flood event showing river water and groundwater behind the opened dike.
Conversion to the Potential Denitrification Capacity of Floodplains
Potential denitrification rates (DP in ng N g−1 h−1, see Potential Denitrification) from individual soil samples were converted to plot-DP in mg N m−2 h−1 using plot soil volume of 0.8 m³ (2 m × 2 m x 0.2 m, see Field Sampling) and measured dry bulk densities (in g cm−3, see Soil Physical and Chemical Parameters). We based our area-wide estimation of floodplain denitrification (in kg N ha−1 a−1) on flooding patterns. Flooding represents optimized conditions for denitrification, as the inflowing river water facilitates both soil saturation and the availability of reactants for heterotrophic denitrification (carbon and nitrate) (Hill et al., 2000). Thus, individually estimated soil DP (in N m−2 d−1) can be upscaled to the potential denitrification capacity of a whole floodplain by multiplying it with average inundation days. To analyze the influence of long-term changing flooding dynamics, we used average inundation days based on the last 30 and 5 years for comparison (calculation see Hydrological Calculations).
Statistical Analysis
Due to the detected non-normality with Shapiro-Wilk tests, non-parametric methods were used for the analyses. Potential denitrification, inundation, and soil properties (chemical and physical) were compared between floodplains using Mann Whitney U tests. A correlation analysis (Spearman’s rank) was used to characterize the relationships between responding (DP, DPR) and predicting variables (e.g., pH, flowpath). The diversity of the study areas required the detection of spurious correlations caused by strongly correlating predicting variables in order to interpret and identify actual explanatory factors. Based on the Spearman’s rank correlation, a subset of predicting variables (pH, flowpath, Nmin and FC) were used in a multivariate regression approach based on PLS (partial least squares) regression (Wold et al., 2001), taking DP and DPR as responding variables. Somehow, this method is related to a principal component regression and robust against collinearity in predicting variables because it incorporates the covariance structure between the variables. The regression model is evaluated by using R2, a predicting variable ranking (magnitude of influence) and by defining the direction of each influence with a coefficient (coeff). VIP (variable importance in projection) is used for the ranking and only VIPs >1 are counted as being important (Trauth et al., 2018). For the PLS regression, variables were log-normalized, when bivariate relations showed a clear non-linear behavior. All analyses were performed in RStudio Version 1.2.1335 (R Core Team, 2019).
Results
Hydrogeology, Soil Properties, and Denitrification Potential of Floodplain Sites
Days of flooding and inundation duration significantly differ between the study areas (Table 2) due to an area-specific flooding regime. WS and MU showed significantly fewer days of flooding (flood) and shorter stream distances (mindist). Despite larger minimum distances to streams, ER, ES, RE, and RK showed longer inundation durations. This was also apparent in the respective differences between flowpath and mindist. Due to their heterogeneous topography, the flow paths at these four sites were significantly longer than the direct distance of the plots to the river.
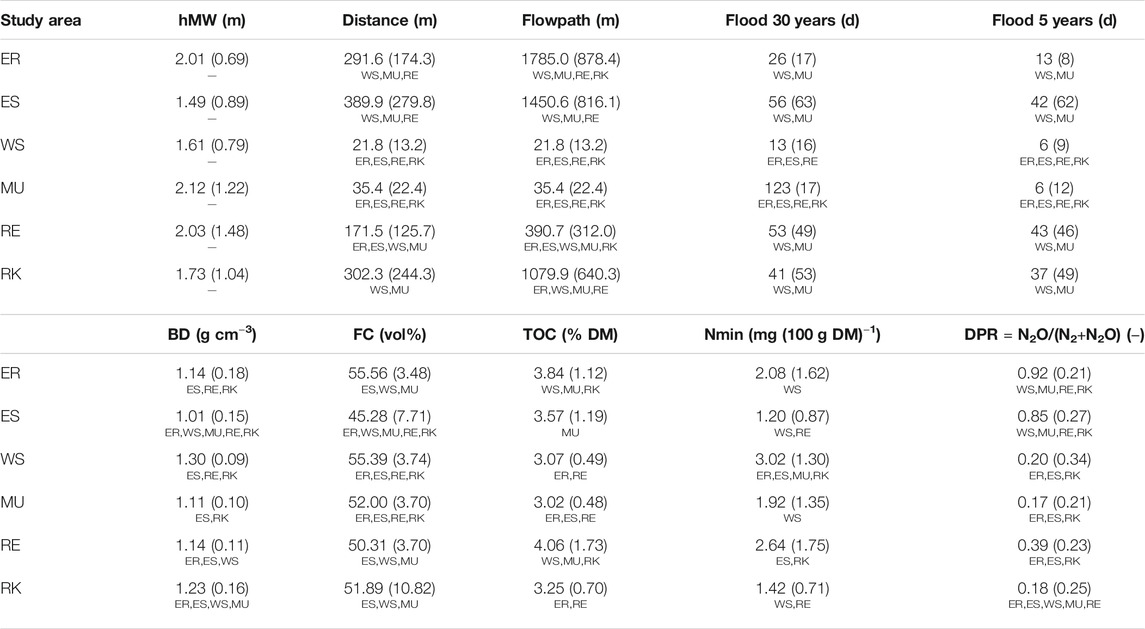
TABLE 2. Measured average, standard deviation (in parenthesis), and significant differences between all plots in each of the study areas: Elbe_R (ER), Elbe_S (ES), Weser_S (WS), Main_U (MU), Rhine_E (RE), Rhine_K (RK) (superscripted, Mann Whitney U test, p < 0.05, nstudyarea = 15–20, ntotal = 105) of hydrological parameters height above mean water (hMW), distance to riverbank (distance), hydrological distance (flowpath), average yearly inundation duration (flood) on the basis of 30 years (30 years) and 5 years (5 years) and soil parameters soil bulk density (BD), field capacity (FC), total organic carbon (TOC), mineral nitrogen content (Nmin) and the denitrification product ratio (DPR = N2O/(N2+N2O) = DPN2O/DP). Significant differences (Mann Whitney U test, p < 0.05) of flood 5 years compared to flood 30 years are printed in bold.
The overall mean soil bulk density was high, showing mean values slightly above 1 g cm−3 (Table 2). FC ranged from 17 vol% up to 60 vol%, but the average per study site was between 45 and 55 vol%. FC was highest at ER and WS, while ES showed the lowest mean water holding capacity (Table 2). Since FC is directly related to soil texture, this was also apparent in the soil texture distribution of each study area (Figure 3A). ES had the largest proportion of sandy substrates, while loams were generally the most common. RK showed the highest variability concerning FC and soil texture (Table 2; Figure 3A). Mean TOC concentrations were lowest at MU with 3.02% DM and highest at RE with 4.06% DM, showing predominantly medium to strongly humic soils (Table 2). The sum of ammonium and nitrate ranged on average between 0.012 mg (g DM)−1 (ES) and 0.030 mg (g DM)−1 (WS) (Table 2). Soil pH showed two clusters among the study areas (Figure 3B). Both Elbe sites, with mean pH values of 5.9 (ER) and 6.2 (ES), were moderately to slightly acidic. WS, MU, RE, and RK with mean pH values in the range of 7.8 and 8.2 were slightly to moderately alkaline.
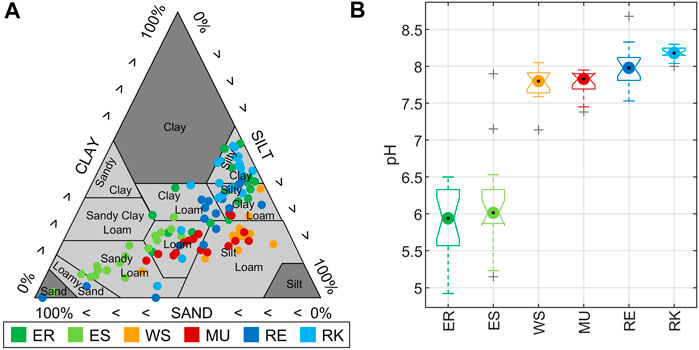
FIGURE 3. (A) Soil texture distribution of samples from the study areas: Elbe_R (ER), Elbe_S (ES), Weser_S (WS), Main_U (MU), Rhine_E (RE), Rhine_K (RK). All in the soil texture triangle defined by the United States Department of Agriculture (USDA). (B) Comparison of average soil pH between the study areas. Box lines show upper and lower quartiles. Whiskers extend to the 95th and fifth percentiles.
Comparable to soil pH, DP also showed two clusters among the study areas (Figure 4). Both Elbe sites, with a mean DP of 11.4 (ER) and 6.4 mg N m−2 h−1 (ES), were significantly lower than WS, MU, RE and RK with mean DP values in the range of 23.0–30.5 mg N m−2 h−1. Denitrification product ratios (DPR) at ER and ES were significantly higher than those of the other sites, with a mean DPR of 0.92 (ER) and 0.85 (ES). The sites WS, MU, RE and RK showed a mean DPR below 0.4 (Table 2).
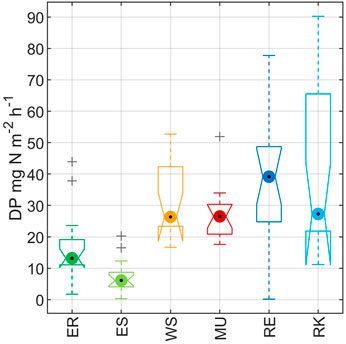
FIGURE 4. Comparison of average soil DP between the study areas. Box lines show upper and lower quartiles. Whiskers extend to the 95th and fifth percentiles.
Factors Influencing Denitrification Potential
Lowest denitrification potential (DP) and highest denitrification product ratios (DPR) were found at ER and ES (Figure 4; Table 2). This corresponded to pH values, which were significantly lower there than at the other sites (Figure 3B). A correlation analysis using Spearman’s Rank Correlation (Table 3) revealed a negative correlation between the two responding variables DP and DPR (rspear = −0.49). For DP only pH and for DPR pH, distance, and flowpath showed the highest correlations (rspear ≥ 0.5). We also observed that distance and flowpath, Nmin, FC, and silt were weakly correlated to DP (rspear = 0.3–0.5), and found BD to be weakly correlated to DPR (Table 3). The PLS model explained 52% of the DP variance and pH was identified as being the only important predictor with a VIP of >1 (Table 4). Further, the model explained 63% of DPR variance, with pH and flowpath as dominant variables with VIP >1 (Table 4). The pH values alone were able to explain 43% of DP variance using a linear regression of log-transformed values.
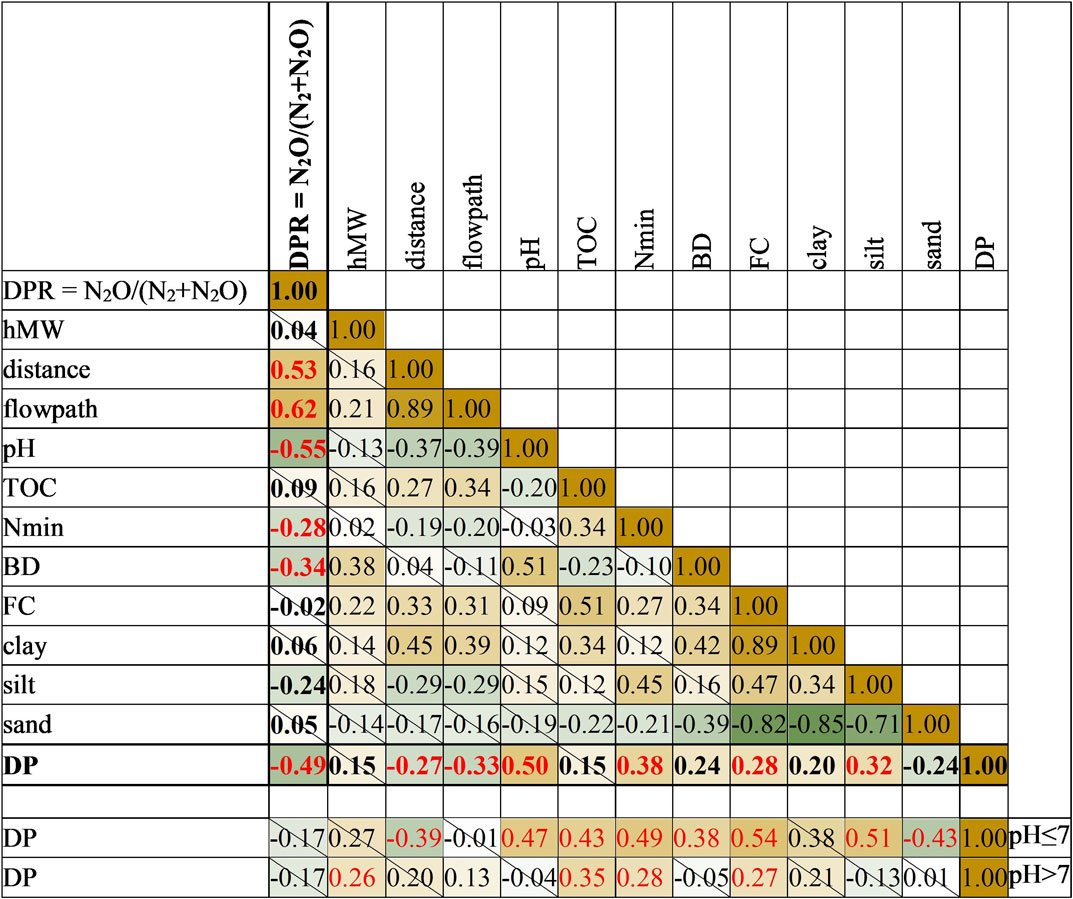
TABLE 3. Spearman’s rank correlation matrix (rspear) between measured and derived variables. Dark colors indicate stronger absolute correlations. Green indicates negative, brown positive correlations. Cells crossed out are not significant (p > 0.05), |rspear| > 0.3 are written in red, n = 104.
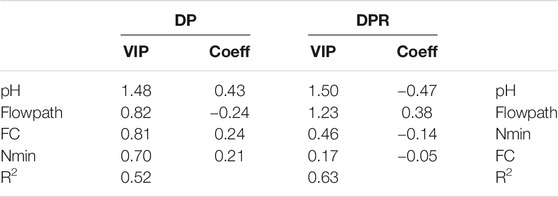
TABLE 4. PLS model regression parameters and results for the prediction of DP and DP [=N2O/(N2+N2O)]. All samples were taken into account (n = 104). VIP (variable importance in prediction), coeff (coefficient) defining the direction of influence on the responding variable. DP was log-normalized prior to analysis.
To analyze additional explanatory factors, we divided the data set into two subsets using pH values ≤7 and a subset with pH > 7. In both groups DP was positively correlated (rspear = 0.3–0.5) to hMW, TOC, Nmin, and FC (Table 3). Variable flowpath only had a significant effect on DPR in subgroup pH > 7 (rspear = 0.32), which is in line with the PLS regression results.
Potential Denitrification Capacity of Floodplains Based on Flooding Patterns
Upscaling of DP results based on flooding patterns resulted in equally high DP capacities in ER and ES as well as in WS and MU [Figure 5A, mean DP in kg N ha−1 a−1 on 30 years basis: 106.15 (ER), 70.10 (ES), 103.59 (WS), 74.08 (MU)], caused by comparatively long inundation durations. RE and RK showed the highest mean potential denitrification capacities of 416.26 kg N ha−1 a−1 (RE, 30 years) and 217.44 kg N ha−1 a−1 (RK, 30 years).
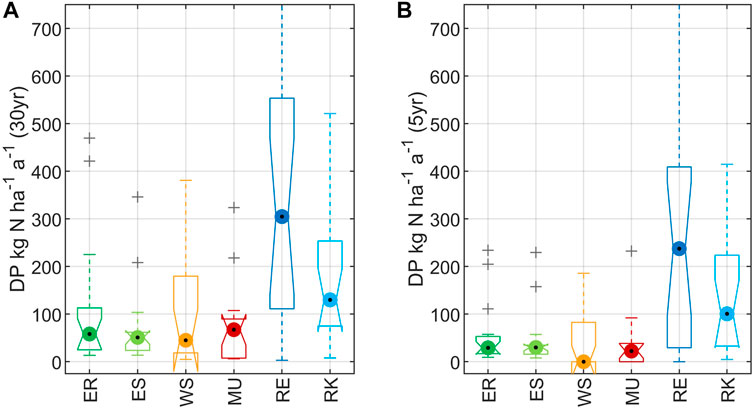
FIGURE 5. Comparison of potential floodplain denitrification capacity between the study areas. Upscaling was derived using average inundation days per year for multiplication. Box lines show upper and lower quartiles. Whiskers extend to the 95th and fifth percentiles. (A) Data basis = daily water levels 1988–2017. Upper whisker of RE extends to 1013.32 mg N ha−1 a−1. (B) Data basis = daily water levels 2013–2017. Upper whisker of RE extends to 898.32 mg N ha−1 a−1.
Comparing the 5-years average to the long-term average (30 years), the plots in all study areas were inundated less often (flood, Table 2). The sampling year was comparatively dry, showing significantly less flooding days in each study area compared to the 30-years average. In contrast, however, water levels at WS and MU were higher than average during the sampling period (Supplementary Figure 1). Due to less inundation days per year during the last 5 years compared to the long-term average (30 years) an upscaling of the 5-years data basis resulted in much lower mean DPs (in kg N ha−1 a−1): 53.54 (ER), 44.42 (ES), 42.80 (WS), 34.85 (MU), 328.91(RE), 182.53 (RK) (Figure 5B). This is equivalent to a 21–59% reduction of mean denitrification capacities of the investigated floodplains.
Discussion
Factors Influencing Soil Denitrification Potential
Factors affecting denitrification can be categorized into distal and proximal regulators (Wallenstein et al., 2006; Saggar et al., 2013). It is not surprising that proximal regulators, which have an immediate effect on denitrification rates, virtually play no role in our study due to the uniform and optimized conditions of the experimental set-up such as high nitrate and carbon availability, controlled temperature, and no oxygen. However, distal controls, exemplified here by pH and soil texture, can play an equally important role in denitrification as proximal factors, by influencing denitrifier community structure in the long term (Priemé et al., 2002; Rich et al., 2003; Wallenstein et al., 2006).
Our results suggest increased denitrification potential (DP) and decreased N2O/(N2+N2O) ratios (DPR) related primarily to higher soil pH and, with less significance, to shorter flow paths. The strong pH effect on denitrification (potential) has been observed in many other studies (S̆imek et al., 2000; Šimek and Cooper, 2002; Rochester, 2003; Zaman et al., 2008; Čuhel et al., 2010; Liu et al., 2010; Brenzinger et al., 2015; Senbayram et al., 2015). Rochester (2003) found a negative exponential function between DPR and pH by summarizing numerous field and laboratory studies. Acidic pH lowers denitrification rates and affects the kinetics and stoichiometry of the enzymatic reactions, resulting in higher N2O production, a highly efficient greenhouse gas (Pinay et al., 2007; Liu et al., 2010; Brenzinger et al., 2015). Mechanisms behind this correlation are still not fully understood, but N2O reductase (Nos) seems to be particularly sensitive to low pH, affecting its activity post-transcriptionally (Liu et al., 2010; Brenzinger et al., 2015). In addition, pH-based fungi dominance may also result in the lack of Nos, leading to N2O as the major end product of fungal denitrification (Shoun, 1992; Rohe et al., 2014). Thus, we recommend considering the strong influence of soil pH on DP that we found here, when estimating denitrification classes.
The correlation analysis further revealed weak correlations between DP, respectively DPR and hydrological parameters (distance, flowpath), suggesting increased DP with shorter flow path lengths and thus shorter distances to the river. This is probably due to the fact that the floodplains with the longest flow paths (ER and ES) had the most acidic conditions regarding the floodplain soils. For DPR, the identification of flow path lengths along with soil pH as an important parameter (PLS: VIP > 1) might be related to the better hydrological connectivity, causing increased denitrification associated with the prokaryotic community (Tomasek et al., 2017).
In any case, our data indicate a relationship between DP and grain size distribution. In the past studies have indeed described the strong correlation between soil texture and denitrification (D’Haene et al., 2003; van der Salm et al., 2007; Guo and Lin, 2018). Fine-grained soils, like clay, have a greater water storage capacity than other soils as the advection forces in small pores are strong (Blume et al., 2010). This results in a lack of aeration (Drury et al., 1992; Bollmann and Conrad, 1998; Luo et al., 2000; Saggar et al., 2013), which also influences nutrient cycling (Beauchamp et al., 1980; Fierer and Schimel, 2002; Castellano et al., 2013; Malique et al., 2019). Based on our field capacity (FC) data, which directly depend on grain size distribution, we were able to confirm this relationship despite the same water contents (D’Haene et al., 2003; Jamali et al., 2016). Soils with high FC may favor denitrification because of larger surfaces available for colonization by denitrifying bacteria. Since DPR do not correlate with FC or sand, silt, or clay contents, soil texture does not lead to higher N2 fractions in the denitrification product. Detected correlations between soil bulk density (BD) and DP and DPR correspond to negative correlations between DP and BD found by Wu et al. (2013). This connection is also often included in regression models (Richardson et al., 2004; Zhang et al., 2012), while studies of Gardner and White (2010) could not detect a significant correlation in wetlands.
Known proximal DP influencing soil parameters such as TOC and Nmin showed positive, although weak correlations with DP. As organic carbon and nitrate are added in excess for the denitrification assays, these factors will only become relevant, if they have previously affected the soil. Thus, adaptation effects of the denitrifying community to natural occurring soil properties are a possible explanation. The known strong influences of carbon respectively nitrate on DP, are more likely to be a question of their availability during incubation, as several studies have already described (Welti et al., 2012a; Pinto et al., 2021).
To increase the certainty in the evaluation of the relationships between DP and influencing environmental factors, the number of observations in each study area needs to be increased. Further, assessments of denitrifier community structure (nirS and nosZ genes) and denitrifier community size (qPCR of these genes) (Deslippe et al., 2014) would also allow microbial aspects to be included.
Denitrification at the Floodplain Scale
Previous floodplain soil studies have reported a wide range of denitrification rates (e.g., Gergel et al., 2005). Our areal estimates of 70–416 kg N ha−1 a−1 are within the range of other published assessments for wetlands and floodplains. However, comparing the values of this study with other studies should be done with great caution, because of 1) the different methodologies applied, 2) the distinctions and comparability of different zones (riparian zone, floodplain, soil or sediment), and 3) differences in units and values presented (in % of river-N-load, without area relation, or on a “per flood” basis), leading to strong distortions when extrapolated. As an example for the latter, rates of ∼10 mg N m−2 h−1 (Forshay and Stanley, 2005) measured during several days of one flood, would become an estimate of ∼2.4 kg N ha−1 d−1 respectively 876 kg N ha−1 a−1. With 50–246 kg N ha−1 a−1 (Gergel et al., 2005), or 57–466 kg N ha−1 a−1 (Arheimer and Wittgren, 2002) the range of average wetland N-removal estimations is wide (Figure 6). Due to optimized process conditions and neglected processes that contribute to the overall nitrate removal such as nitrate assimilation, anaerobic ammonium oxidation (anammox), and dissimilatory nitrate reduction to ammonium (DNRA) (Burgin and Hamilton, 2007; Sgouridis et al., 2011; Hoagland et al., 2019), potential denitrification measured with the acetylene inhibition technique probably overestimates actual denitrification.
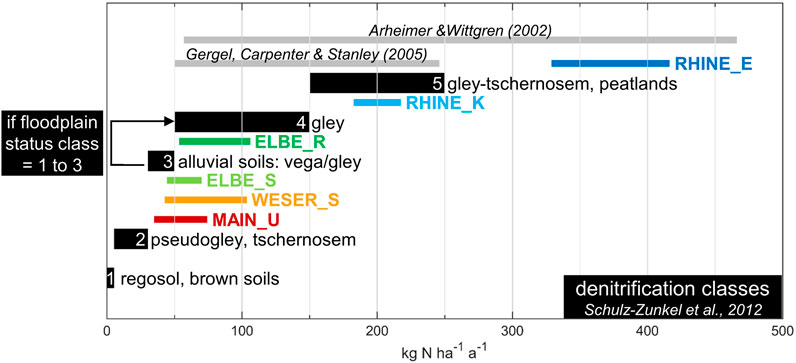
FIGURE 6. Assessment of nitrogen retention via denitrification classes after Schulz-Zunkel et al. (2012) in kg N ha−1 a−1. If floodplain status class (FlStC) = 1, 2, or 3 denitrification class (DC) raises from 3 to 4. This is compared with observed average values by two other studies, and observed mean potential floodplain denitrification capacities of Elbe_R (ER), Elbe_S (ES), Weser_S (WS), Main_U (MU), Rhine_K (RK), and Rhine_E (RE). For the latter, the range plotted extends from the upscaled mean, based on the average days of inundation over the past 5 years, to the upscaled mean, based on the average days of inundation over the past 30 years (see also Panel 5).
Currently the assessment of nitrogen retention in Germany mainly follows proxy-based approaches using five denitrification classes (DC) (1 = very low to 5 = very high; depending on the soil type) (Schulz-Zunkel et al., 2012; Natho et al., 2013) (Figure 6). By applying the classification of Schulz-Zunkel et al. (2012), the investigated soils are attributed to DC = 3, with an estimated nitrogen retention of 30–50 kg ha−1 a−1. Since both of the Elbe and the Rhine study areas belong to floodplain status class (FlStC) 1 (“nearly natural”) to 3 (“moderately modified”), the estimated nitrogen removal rate there increases to 100–150 kg ha−1 a−1 (Brunotte et al., 2009; Schulz-Zunkel et al., 2012). Observed mean annual nitrogen retention with regard to the 30-years average inundation of ER, ES, WS, and MU confirm this range, while RK and RE significantly exceed this value (Figure 6). However, the latter are still in the range of other reported values from other floodplain areas (e.g., Arheimer and Wittgren, 2002; Gergel et al., 2005). Thus, inclusion of floodplain status when defining DC’s is a necessary parameter, but further specification of this parameter is needed. Our findings highlight that inundation days and areas should be considered, in addition to aforementioned soil pH implementation.
Research on nitrate removal from floodplain soils draws attention to plant and microbial uptake (assimilation) or respiratory denitrification by bacteria (Burgin and Hamilton, 2007). The latter is often recognized as the predominant process for permanent nitrate removal from floodplain soils (Seitzinger et al., 2006). More recent studies show the importance of alternative microbial pathways of nitrate transformation. For instance, processes such as nitrate assimilation, anaerobic ammonium oxidation (anammox), and dissimilatory nitrate reduction to ammonium (DNRA) contribute to nitrogen transformation and thus, retention in floodplain soils (Burgin and Hamilton, 2007; Hoagland et al., 2019). Under anaerobic soil conditions, denitrification and DNRA are assumed to be in competition for available nitrate – however, the relationship between the two remains poorly understood (Friedl et al., 2018). While Hoagland et al. (2019) quantified the contribution of anammox to total N2 production as a significant pathway in restored wetlands (41–84%), Welti et al. (2012b) measured ∼0% contribution in Danube floodplain sediments. Friedl et al. (2018) revealed that DNRA and not denitrification dominated nitrate reduction in pasture soils, whereas Sgouridis et al. (2011) found that DNRA capacity in riparian soils was an order of magnitude lower than denitrification capacity.
Effects of Inundation on the Denitrification Capacity of the Floodplains
Lateral connectivity, expressed here as the average duration of inundation of the active floodplain (see Natho et al., 2020), promotes the exchange of water, nutrients, and organic matter between the river channel and the floodplain (Tockner et al., 1999; Tockner et al., 2000). Longer inundation results in more pronounced oxygen reduction conditions, influencing biogeochemical processes (Noe and Hupp, 2005). More specifically, flooding can increase rates of denitrification in zones where anoxic conditions, organic matter and nitrate availability coincide (Groffman et al., 2005; Hernandez and Mitsch, 2007). The method applied (AIT with 100% WFPS, C and N excess) represents flooded conditions in our study. While rate measurements were influenced by pH values, estimations of the areal floodplains’ denitrification capacities, based on their inundation regime, changed the denitrification patterns considerably at the floodplain scale (Figure 7). The morphologically degraded floodplains WS and MU show low areal denitrification capacities despite high soil DP rates due to short average inundation periods. Equally low denitrification capacities were estimated for ER and ES, which are characterized by unfavorable soil conditions for denitrification, but are well-connected floodplains with regular inundation events. Thus, the inundation regime can superimpose soil properties in terms of potential denitrification capacity (Figure 7). RE and RK combine both: favorable soil conditions (alkaline pH) and frequent flooding. Thus, the Rhine sites scored best in this comparison, with denitrification capacities two to five times higher than the others. With these findings we can confirm statements by Natho et al. (2013) who emphasized the need to combine proxy-based data (soil DP) with model-based data (inundation), to tackle the issue of flooding dynamics to calculate biogeochemical processes at the landscape level. Since soil conditions are mostly set, the probability of inundation is, together with nitrate and carbon availability, one important variable for stimulating denitrification as a natural self-purification process. This depends on both environmental conditions (e.g., discharge, topography) as well as anthropogenic intervention, like e.g., embankment structures and water impoundments. Management interventions such as e.g., dike slitting or dyke back-shifting projects increase flooding probability and thus, would enhance denitrification potential. Restoring lateral hydrological connection may positively affect the overall quality of the river water.
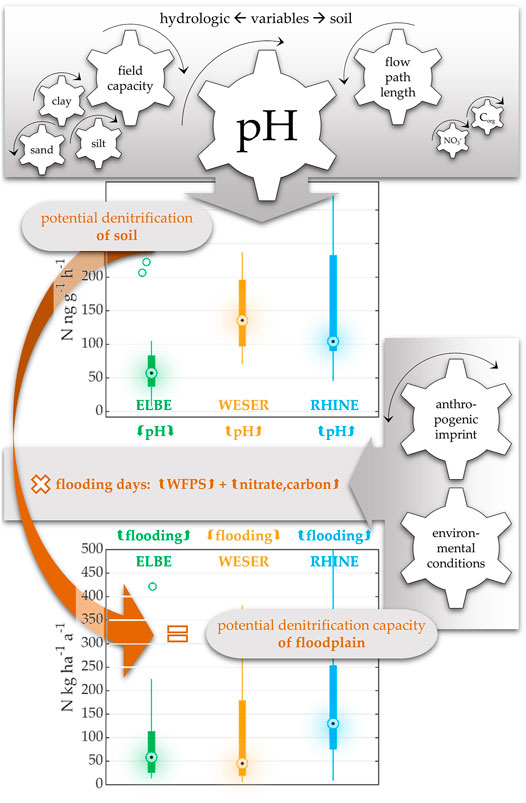
FIGURE 7. Flowchart of this study’s data processing. The gears are to represent an influence. If the arrow goes to the right (“turn up”), meaning a positive correlation - and the other way around. The focus is on how this calculation creates a completely changed pattern. By incorporating average inundation duration per year, potential denitrification of soil is converted to potential denitrification capacity of floodplain.
Since denitrification processes also occur in soils which are below 100% WFPS, adjusting and upscaling considerations with inundation duration could be extended by implementation of denitrification potentials measured in treatments with less water and nutrient supply. This could be further elaborated by including flooding frequency aspects, as studies showed gas emissions peaks during the drying phase after flooding (Tockner et al., 2000; Shrestha et al., 2014; Kaden et al., 2020).
Conclusion
There are numerous studies that address the factors influencing denitrification (Pinay et al., 2007; Saggar et al., 2013) and also several larger-scale modelling approaches (e.g., Nielsen et al., 2001; Natho et al., 2013; Fabre et al., 2020). However, the lack of integrated regional soil DP measurements and flood duration assessments may limit a precise assessment of environmental factors controlling DP at the landscape level. This study provides new information about soil DP and potential denitrification capacity in floodplains. We were able to identify a strong soil pH effect, which has so far not been considered in the German nitrate removal approaches. Hydrological influences on soil DP were of less significance than expected. However, we were able to assess a significant impact of inundation on potential denitrification capacities. This underlines just how imperative it is to combine soil DP proxies with the modeled duration and the spatial distribution of floodwater. In a floodplain comparison, inundation can even superimpose soil properties. Therefore, as expected, anthropogenic interventions causing low water fluctuations or limitation of flooding areas, considerably influence the overall retention potential. Hence, the ecological status of floodplains plays a vital role and our results emphasize how important the conservation and restoration of floodplains are as management goals. Further, inundation is not only a condition for effective nitrate retention through denitrification, but also simultaneously supports other multiple functions and services of riverine landscapes. We are aware of methodological uncertainties, but with the method applied we can present upper bound estimates of in situ DP and more realistic upscaling to the floodplain scale. Thus, the findings of this work, in combination with other recent studies, can be understood as a basis for adjusting the existing management approaches for nitrate removal. We plan to specify the inundation parameter more clearly and to integrate the soil pH value for upscaling denitrification potential. Quantification of nitrate retention through denitrification will remain a challenge, but our findings certainly contribute to a better understanding of denitrification as an ecosystem function.
Data Availability Statement
The raw data supporting the conclusion of this article will be made available by the authors, without undue reservation.
Author Contributions
Conceptualization, UK, EF, PH, MS, and CS-Z.; methodology, UK, EF, TH, PH, HR, MS, CS-Z, and GW; software, UK and SG; formal analysis, UK and SG; investigation, UK, EF, and SG; resources, EF, PH, HR, and MS; writing - original draft preparation, UK and GW; writing - review and editing, UK, EF, SG, TH, PH, HR, MS, CS-Z, and GW; visualization, UK supervision, TH, MS, CS-Z, and GW; project administration, EF and MS. All authors have read and agreed to the published version of the manuscript.
Conflict of Interest
The authors declare that the research was conducted in the absence of any commercial or financial relationships that could be construed as a potential conflict of interest.
Publisher’s Note
All claims expressed in this article are solely those of the authors and do not necessarily represent those of their affiliated organizations, or those of the publisher, the editors and the reviewers. Any product that may be evaluated in this article, or claim that may be made by its manufacturer, is not guaranteed or endorsed by the publisher.
Acknowledgments
This study was part of the AZOTE project “Determining potential nutrient retention rates as an ecosystem service in riparian zones.” The authors are much indebted to Sarah Gwillym-Margianto for her proofreading assistance. Many thanks to the farmers, land owners, and nature conservation authorities for their helpful cooperation. We thank C. Hecht for conscientious field sampling and R. Lüdtke and B. Apelt for their excellent support during the experimental period. Many thanks also to Michael Vieweg and Andreas Musolff for their advice regarding Matlab and R calculations.
Supplementary Material
The Supplementary Material for this article can be found online at: https://www.frontiersin.org/articles/10.3389/feart.2021.708707/full#supplementary-material
Supplementary Figure 1 | River water level in the study areas Elbe_R (ER), Elbe_S (ES), Weser_S (WS), Main_U (MU), Rhine_E (RE), Rhine_K (RK) in the sampling year 2017 (black line), mean river water level of the last 5 years (medium gray line), and interquartile range (iqr) with mean river water level in the long term of 30 years (light gray patch and line). Dashed lines mark the period of soil sampling.
References
Ad-hoc-Arbeitsgruppe Boden (2005). Bodenkundliche Kartieranleitung/Manual of -KA5. Hannover: Schweizerbart Science Publishers.
Arheimer, B., and Wittgren, H. B. (2002). Modelling nitrogen removal in potential wetlands at the catchment scale. Ecol. Eng. 19, 63–80. doi:10.1016/S0925-8574(02)00034-4
Baldwin, D. S., and Mitchell, A. M. (2000). The effects of drying and re-flooding on the sediment and soil nutrient dynamics of lowland river-floodplain systems: A synthesis. Regul. Rivers: Res. Mgmt. 16, 457–467. doi:10.1002/1099-1646(200009/10)16:5<457::aid-rrr597>3.0.co;2-b
Beauchamp, E. G., Gale, C., and Yeomans, J. C. (1980). Organic matter availability for denitrification in soils of different textures and drainage classes. Commun. Soil Sci. Plant Anal. 11, 1221–1233. doi:10.1080/00103628009367119
Behrendt, H., Kornmilch, M., Opitz, D., Schmoll, O., and Scholz, G. (2002). Estimation of the nutrient inputs into river systems - experiences from German rivers. Reg. Environ. Change 3, 107–117. doi:10.1007/s10113-002-0042-3
Blume, H.-P., Brümmer, G. W., Horn, R., Kandeler, E., Kögel-Knabner, I., Kretzschmar, R., et al. (2010). Scheffer/Schachtschabel: Lehrbuch der Bodenkunde. 16th ed.. Berlin, Heidelberg: Springer Berlin Heidelberg. doi:10.1007/978-3-662-49960-3
BMU&BfG (2007). Informationsplattform Undine. Verbesserung der Datengrundlage zur Bewertung Hydrol. Extrem. Available at: http://undine.bafg.de/index.html.
Bollmann, A., and Conrad, R. (1998). Influence of O2availability on NO and N2O release by nitrification and denitrification in soils. Glob. Change Biol. 4, 387–396. doi:10.1046/j.1365-2486.1998.00161.x
Brenzinger, K., Dörsch, P., and Braker, G. (2015). pH-driven shifts in overall and transcriptionally active denitrifiers control gaseous product stoichiometry in growth experiments with extracted bacteria from soil. Front. Microbiol. 6, 1–11. doi:10.3389/fmicb.2015.00961
Brunotte, E., Dister, E., Günther-Diringer, D., Koenzen, U., and Mehl, D. (2009). Flussauen in Deutschland - Erfassung und Bewertung des Auenzustandes. Bonn-Bad Godesberg: Bundesamt für Naturschutz. (BfN).
Burgin, A. J., and Hamilton, S. K. (2007). Have we overemphasized the role of denitrification in aquatic ecosystems? A review of nitrate removal pathways. Front. Ecol. Environ. 5, 89–96. doi:10.1890/1540-9295(2007)5[89:hwotro]2.0.co;2
Castellano, M. J., Lewis, D. B., and Kaye, J. P. (2013). Response of soil nitrogen retention to the interactive effects of soil texture, hydrology, and organic matter. J. Geophys. Res. Biogeosci. 118, 280–290. doi:10.1002/jgrg.20015
Čuhel, J., Šimek, M., Laughlin, R. J., Bru, D., Chèneby, D., Watson, C. J., et al. (2010). Insights into the Effect of Soil pH on N2O and N2 Emissions and Denitrifier Community Size and Activity. Appl. Environ. Microbiol. 76, 1870–1878. doi:10.1128/AEM.02484-09
Deslippe, J. R., Jamali, H., Jha, N., and Saggar, S. (2014). Denitrifier community size, structure and activity along a gradient of pasture to riparian soils. Soil Biol. Biochem. 71, 48–60. doi:10.1016/j.soilbio.2014.01.007
D’Haene, K., Moreels, E., De Neve, S., Chaves Daguilar, B., Boeckx, P., Hofman, G., et al. (2003). Soil properties influencing the denitrification potential of Flemish agricultural soils. Biol. Fertil. Soils 38, 358–366. doi:10.1007/s00374-003-0662-x
DIN 18126:1996-11 (1996). Baugrund, Untersuchung von Bodenproben - Bestimmung der Dichte nichtbindiger Böden bei lockerster und dichtester Lagerung. doi:10.31030/7209583
DIN EN 15936:2012-11 (2012). Schlamm, behandelter Bioabfall, Boden und Abfall - Bestimmung des gesamten organischen Kohlenstoffs (TOC) mittels trockener Verbrennung. doi:10.31030/1866720
DIN ISO 11277:2002-08 (2002). Bodenbeschaffenheit - Bestimmung der Partikelgrößenverteilung in Mineralböden - Verfahren mittels Siebung und Sedimentation. doi:10.31030/9283499
Drury, C. F., Findlay, W. I., and McKenney, D. J. (1992). Nitric Oxide and Nitrous Oxide Production from Soil: Water and Oxygen Effects. Soil Sci. Soc. America J. 56, 766–770. doi:10.2136/sssaj1992.03615995005600030015x
European Environment Agency (2016). Flood risks and environmental vulnerability - Exploring the synergies between floodplain restoration, water policies and thematic policies. doi:10.2800/039463 Available at: https://www.eea.europa.eu/publications/flood-risks-and-environmental-vulnerability/
European Environment Agency (2012). European waters - current status and future challenges - Synthesis. Copenhagen. Available at: http://www.eea.europa.eu/publications/european-waters-synthesis-2012/at_download/file%5Cnhttp://www.eea.europa.eu/publications/towards-efficient-use-of-water.
Fabre, C., Sauvage, S., Guilhen, J., Cakir, R., Gerino, M., and Sánchez-Pérez, J. M. (2020). Daily denitrification rates in floodplains under contrasting pedo-climatic and anthropogenic contexts: modelling at the watershed scale. Biogeochemistry 149, 317–336. doi:10.1007/s10533-020-00677-4
Felber, R., Conen, F., Flechard, C. R., and Neftel, A. (2012). Theoretical and practical limitations of the acetylene inhibition technique to determine total denitrification losses. Biogeosciences 9, 4125–4138. doi:10.5194/bg-9-4125-2012
Fierer, N., and Schimel, J. P. (2002). Effects of drying-rewetting frequency on soil carbon and nitrogen transformations. Soil Biol. Biochem. 34, 777–787. doi:10.1016/S0038-0717(02)00007-X
Fisher, J., and Acreman, M. C. (2004). Wetland nutrient removal: A review of the evidence. Hydrol. Earth Syst. Sci. 8, 673–685. doi:10.5194/hess-8-673-2004
Forshay, K. J., and Stanley, E. H. (2005). Rapid Nitrate Loss and Denitrification in a Temperate River Floodplain. Biogeochemistry 75, 43–64. doi:10.1007/s10533-004-6016-4
Friedl, J., De Rosa, D., Rowlings, D. W., Grace, P. R., Müller, C., and Scheer, C. (2018). Dissimilatory nitrate reduction to ammonium (DNRA), not denitrification dominates nitrate reduction in subtropical pasture soils upon rewetting. Soil Biol. Biochem. 125, 340–349. doi:10.1016/j.soilbio.2018.07.024
Gardner, L. M., and White, J. R. (2010). Denitrification Enzyme Activity as an Indicator of Nitrate Movement through a Diversion Wetland. Soil Sci. Soc. Am. J. 74, 1037–1047. doi:10.2136/sssaj2008.0354
Gergel, S. E., Carpenter, S. R., and Stanley, E. H. (2005). Do dams and levees impact nitrogen cycling? Simulating the effects of flood alterations on floodplain denitrification. Glob. Change Biol 11, 1352–1367. doi:10.1111/j.1365-2486.2005.00966.x
Groffman, P. M., Altabet, M. A., Böhlke, J. K., Butterbach-Bahl, K., David, M. B., Firestone, M. K., et al. (2006). Methods for measuring denitrification: Diverse approaches to a difficult problem. Ecol. Appl. 16, 2091–2122. doi:10.1890/1051-0761(2006)016[2091:mfmdda]2.0.co;2
Groffman, P. M., Dorsey, A. M., and Mayer, P. M. (2005). N processing within geomorphic structures in urban streams. J. North Am. Benthological Soc. 24, 613–625. doi:10.1899/04-026.1
Groffman, P. M., Holland, E. A., Myrold, D. D., Robertson, G. P., and Zou, X. (1999). “Denitrification,” in Standard soil methods for long-term ecological research. Editors G. P. Robertson, D. C. Coleman, C. S. Bledsoe, and P. Sollins (New York, USA: Oxford University Press), 272–288.
Guo, L., and Lin, H. (2018).Addressing Two Bottlenecks to Advance the Understanding of Preferential Flow in Soils. in Advances in Agronomy. Netherlands: Elsevier, 61–117. doi:10.1016/bs.agron.2017.10.002
Hefting, M., Clément, J. C., Dowrick, D., Cosandey, A. C., Bernal, S., Cimpian, C., et al. (2004). Water table elevation controls on soil nitrogen cycling in riparian wetlands along a European climatic gradient. Biogeochemistry 67, 113–134. doi:10.1023/B:BIOG.0000015320.69868.33
Hernandez, M. E., and Mitsch, W. J. (2007). Denitrification in created riverine wetlands: Influence of hydrology and season. Ecol. Eng. 30, 78–88. doi:10.1016/j.ecoleng.2007.01.015
Hill, A. R., Devito, K. J., Campagnolo, S., and Sanmugadas, K. (2000). Subsurface denitrification in a forest riparian zone: Interactions between hydrology and supplies of nitrate and organic carbon. Biogeochemistry 51, 193–223. doi:10.1023/A:1006476514038
Hoagland, B., Schmidt, C., Russo, T. A., Adams, R., and Kaye, J. (2019). Controls on nitrogen transformation rates on restored floodplains along the Cosumnes River, California. Sci. Total Environ. 649, 979–994. doi:10.1016/j.scitotenv.2018.08.379
Jamali, H., Quayle, W., Scheer, C., Rowlings, D., and Baldock, J. (2016). Effect of soil texture and wheat plants on N2O fluxes: A lysimeter study. Agric. For. Meteorology 223, 17–29. doi:10.1016/j.agrformet.2016.03.022
Kaden, U. S., Fuchs, E., Hecht, C., Hein, T., Rupp, H., Scholz, M., et al. (2020). Advancement of the Acetylene Inhibition Technique Using Time Series Analysis on Air-Dried Floodplain Soils to Quantify Denitrification Potential. Geosciences 10, 431. doi:10.3390/geosciences10110431
Koenzen, U. (2005). Fluss- und Stromauen in Deutschland - Typologie und Leitbilder. Bonn: Bundesamt für Naturschutz (BfN).
Koenzen, U., Kurth, A., and Günther-Diringer, D. (2021). AUENZUSTANDSBERICHT 2021. BMU - Bundesministerium für Umwelt, Naturschutz und nukleare Sicherheit und BfN - Bundesamt für Naturschutz. Berlin, Germany. doi:10.19217/brs211
Krause, S., Bronstert, A., and Zehe, E. (2007). Groundwater-surface water interactions in a North German lowland floodplain - Implications for the river discharge dynamics and riparian water balance. J. Hydrol. 347, 404–417. doi:10.1016/j.jhydrol.2007.09.028
Liu, B., Mørkved, P. T., Frostegård, Å., and Bakken, L. R. (2010). Denitrification gene pools, transcription and kinetics of NO, N2O and N2 production as affected by soil pH. FEMS Microbiol. Ecol. 72, 407–417. doi:10.1111/j.1574-6941.2010.00856.x
Luo, J., Tillman, R. W., and Ball, P. R. (2000). Nitrogen loss through denitrification in a soil under pasture in New Zealand. Soil Biol. Biochem. 32, 497–509. doi:10.1016/S0038-0717(99)00179-0
Malique, F., Ke, P., Boettcher, J., Dannenmann, M., and Butterbach-Bahl, K. (2019). Plant and soil effects on denitrification potential in agricultural soils. Plant Soil 439, 459–474. doi:10.1007/s11104-019-04038-5
Mitsch, W. J., Horne, A. J., and Nairn, R. W. (2000). Nitrogen and phosphorus retention in wetlands - ecological approaches to solving excess nutrient problems. Ecol. Eng. 14, 1–7. doi:10.1016/S0925-8574(99)00015-4
Natho, S., Tschikof, M., Bondar-Kunze, E., and Hein, T. (2020). Modeling the Effect of Enhanced Lateral Connectivity on Nutrient Retention Capacity in Large River Floodplains: How Much Connected Floodplain Do We Need? Front. Environ. Sci. 8. doi:10.3389/fenvs.2020.00074
Natho, S., Venohr, M., Henle, K., and Schulz-Zunkel, C. (2013). Modelling nitrogen retention in floodplains with different degrees of degradation for three large rivers in Germany. J. Environ. Manage. 122, 47–55. doi:10.1016/j.jenvman.2013.02.049
Natho, S., and Venohr, M. (2012). Nutrient retention in riparian floodplains on landscape scale, the necessity for a monthly retention approach. Water Sci. Technol. 66, 2800–2807. doi:10.2166/wst.2012.531
Nielsen, K., Risgaard-Petersen, N., Sømod, B., Rysgaard, S., and Bergø, T. (2001). Nitrogen and phosphorus retention estimated independently by flux measurements and dynamic modelling in the estuary, Randers Fjord, Denmark. Mar. Ecol. Prog. Ser. 219, 25–40. doi:10.3354/meps219025
Noe, G. B., and Hupp, C. R. (2005). Carbon, Nitrogen, and Phosphorus Accumulation in Floodplains of Atlantic Coastal Plain Rivers, Usa. Ecol. Appl. 15, 1178–1190. doi:10.1890/04-1677
Pinay, G., Clément, J. C., and Naiman, R. J. (2002). Basic principles and ecological consequences of changing water regimes on nitrogen cycling in fluvial systems. Environ. Manage. 30, 481–491. doi:10.1007/s00267-002-2736-1
Pinay, G., Gumiero, B., Tabacchi, E., Gimenez, O., Tabacchi-planty, A. M., Hefting, M. M., et al. (2007). Patterns of denitrification rates in European alluvial soils under various hydrological regimes. Freshw. Biol 52, 252–266. doi:10.1111/j.1365-2427.2006.01680.x
Pinto, R., Weigelhofer, G., Brito, A. G., and Hein, T. (2021). Effects of dry-wet cycles on nitrous oxide emissions in freshwater sediments: a synthesis. PeerJ 9, e10767. doi:10.7717/peerj.10767
Priemé, A., Braker, G., and Tiedje, J. M. (2002). Diversity of Nitrite Reductase (nirK and nirS) Gene Fragments in Forested Upland and Wetland Soils. Appl. Environ. Microbiol. 68, 1893–1900. doi:10.1128/AEM.68.4.1893-1900.2002
Qin, S., Yuan, H., Dong, W., Hu, C., Oenema, O., and Zhang, Y. (2013). Relationship between soil properties and the bias of N2O reduction by acetylene inhibition technique for analyzing soil denitrification potential. Soil Biol. Biochem. 66, 182–187. doi:10.1016/j.soilbio.2013.07.016
R Core Team (2019). R: A Language and Environment for Statistical Computing. Available at: https://www.r-project.org..
Rich, J. J., Heichen, R. S., Bottomley, P. J., Cromack, K., and Myrold, D. D. (2003). Community Composition and Functioning of Denitrifying Bacteria from Adjacent Meadow and Forest Soils. Appl. Environ. Microbiol. 69, 5974–5982. doi:10.1128/AEM.69.10.5974-5982.2003
Richardson, W. B., Bartsch, L. A., Bartsch, M. R., Kiesling, R., and Lafrancois, B. M. (2019). Nitrogen cycling in large temperate floodplain rivers of contrasting nutrient regimes and management. River Res. Applic 35, 529–539. doi:10.1002/rra.3267
Richardson, W. B., Strauss, E. A., Bartsch, L. A., Monroe, E. M., Cavanaugh, J. C., Vingum, L., et al. (2004). Denitrification in the Upper Mississippi River: rates, controls, and contribution to nitrate flux. Can. J. Fish. Aquat. Sci. 61, 1102–1112. doi:10.1139/f04-062
Rochester, I. J. (2003). Estimating nitrous oxide emissions from flood-irrigated alkaline grey clays. Soil Res. 41, 197. doi:10.1071/SR02068
Rohe, L., Anderson, T.-H., Braker, G., Flessa, H., Giesemann, A., Lewicka-Szczebak, D., et al. (2014). Dual isotope and isotopomer signatures of nitrous oxide from fungal denitrification - a pure culture study. Rapid Commun. Mass. Spectrom. 28, 1893–1903. doi:10.1002/rcm.6975
Rücker, K., and Schrautzer, J. (2010). Nutrient retention function of a stream wetland complex-A high-frequency monitoring approach. Ecol. Eng. 36, 612–622. doi:10.1016/j.ecoleng.2008.12.035
Russell, M., Fulford, R., Murphy, K., Lane, C., Harvey, J., Dantin, D., et al. (2019). Relative Importance of Landscape Versus Local Wetland Characteristics for Estimating Wetland Denitrification Potential. Wetlands 39, 127–137. doi:10.1007/s13157-018-1078-6
Sabater, S., Butturini, A., Clement, J.-C., Burt, T., Dowrick, D., Hefting, M., et al. (2003). Nitrogen removal by riparian buffers along a European climatic gradient: Patterns and factors of variation. Ecosystems 6, 0020–0030. doi:10.1007/s10021-002-0183-8
Saggar, S., Jha, N., Deslippe, J., Bolan, N. S., Luo, J., Giltrap, D. L., et al. (2013). Denitrification and N2O:N2 production in temperate grasslands: Processes, measurements, modelling and mitigating negative impacts. Sci. Total Environ. 465, 173–195. doi:10.1016/j.scitotenv.2012.11.050
Saunders, D. L., and Kalff, J. (2001). Nitrogen retention in wetlands, lakes and rivers. Hydrobiologia 443, 205–212. doi:10.1023/A:1017506914063
Schulz-Zunkel, C., Scholz, M., Kasperidus, H. D., Krüger, F., Natho, S., and Venohr, M. (2012). “Nährstoffrückhalt,” in Ökosystemfunktionen von Flussauen - Analyse und Bewertung von Hochwasserretention, Nährstoffrückhalt, Kohlenstoffvorrat, Treibhausgasemissionen und Habitatfunktion. Germany: Bundesamt für Naturschutz (BfN), 48–72.
Schwanghart, W., and Scherler, D. (2014). Short Communication: TopoToolbox 2 - MATLAB-based software for topographic analysis and modeling in Earth surface sciences. Earth Surf. Dynam. 2, 1–7. doi:10.5194/esurf-2-1-2014
Seitzinger, S., Harrison, J. A., Böhlke, J. K., Bouwman, A. F., Lowrance, R., Peterson, B., et al. (2006). Denitrification across landscapes and waterscapes: A synthesis. Ecol. Appl. 16, 2064–2090. doi:10.1890/1051-0761(2006)016[2064:dalawa]2.0.co;2
Senbayram, M., Dittert, K., Well, R., Lewicka-szczebak, D., and Lammel, J. (2015). The effect of soil pH on N2O/(N2O+N2) product ratio of denitrification depends on soil NO3- oncentration. Available at: https://ui.adsabs.harvard.edu/abs/2015EGUGA..1715760S/abstract.1715760
Sgouridis, F., Heppell, C. M., Wharton, G., Lansdown, K., and Trimmer, M. (2011). Denitrification and dissimilatory nitrate reduction to ammonium (DNRA) in a temperate re-connected floodplain. Water Res. 45, 4909–4922. doi:10.1016/j.watres.2011.06.037
Shoun, H., Kim, D.-H., Uchiyama, H., and Sugiyama, J. (1992). Denitrification by fungi. FEMS Microbiol. Lett. 94, 277–281. doi:10.1016/0378-1097(92)90643-310.1111/j.1574-6968.1992.tb05331.x
Shrestha, J., Niklaus, P. A., Pasquale, N., Huber, B., Barnard, R. L., Frossard, E., et al. (2014). Flood pulses control soil nitrogen cycling in a dynamic river floodplain. Geoderma 228-229, 14–24. doi:10.1016/j.geoderma.2013.09.018
Šimek, M., and Cooper, J. E. (2002). The Influence of Soil PH on Denitrification: Progress Towards the Understanding of this Interaction Over the Last 50 Years. Eur. J. Soil Sci. 53, 345–354. doi:10.1046/j.1365-2389.2002.00461.x
Smith, M. S., and Tiedje, J. M. (1979). Phases of denitrification following oxygen depletion in soil. Soil Biol. Biochem. 11, 261–267. doi:10.1016/0038-0717(79)90071-3
Stander, E. K., and Ehrenfeld, J. G. (2009). Rapid Assessment of Urban Wetlands: Do Hydrogeomorphic Classification and Reference Criteria Work? Environ. Manage. 43, 725–742. doi:10.1007/s00267-008-9211-6
Stanford, J. A. (2007). “Landscapes and Riverscapes,” in Methods in Stream Ecology. Editors F. R. Hauer, and G. A. Lamberti (Burlington, San Diego, London: Academic Press, Elsevier), 3–21. doi:10.1016/b978-012332908-0.50003-6
S̆imek, M., Cooper, J. E., Picek, T., and S̆antrůc̆ková, H. (2000). Denitrification in arable soils in relation to their physico-chemical properties and fertilization practice. Soil Biol. Biochem. 32, 101–110. doi:10.1016/S0038-0717(99)00137-6
Tockner, K., Malard, F., and Ward, J. V. (2000). An extension of the flood pulse concept. Hydrol. Process. 14, 2861–2883. doi:10.1002/1099-1085(200011/12)14:16/17<2861::AID-HYP124>3.0
Tockner, K., Pennetzdorfer, D., Reiner, N., Schiemer, F., and Ward, J. V. (1999). Hydrological connectivity, and the exchange of organic matter and nutrients in a dynamic river-floodplain system (Danube, Austria). Freshw. Biol. 41, 521–535. doi:10.1046/j.1365-2427.1999.00399.x
Tomasek, A., Staley, C., Wang, P., Kaiser, T., Lurndahl, N., Kozarek, J. L., et al. (2017). Increased Denitrification Rates Associated with Shifts in Prokaryotic Community Composition Caused by Varying Hydrologic Connectivity. Front. Microbiol. 8, 1–12. doi:10.3389/fmicb.2017.02304
Trauth, N., Musolff, A., Knöller, K., Kaden, U. S., Keller, T., Werban, U., et al. (2018). River water infiltration enhances denitrification efficiency in riparian groundwater. Water Res. 130, 185–199. doi:10.1016/j.watres.2017.11.058
van der Salm, C., Dolfing, J., Heinen, M., and Velthof, G. L. (2007). Estimation of nitrogen losses via denitrification from a heavy clay soil under grass. Agric. Ecosyst. Environ. 119, 311–319. doi:10.1016/j.agee.2006.07.018
VDLUFA (1991). A 6.1.4.1 Bestimmung von mineralischem Stickstoff (Nitrat und Ammonium) in Bodenprofilen (Nmin-Labormethode). Das VDLUFA Methodenbuch -Band I Die Untersuchung von Böden. Darmstadt, Germany, 1655.
Wallenstein, M. D., Myrold, D. D., Firestone, M., and Voytek, M. (2006). Environmental controls on denitrifying communities and denitrification rates: Insights from molecular methods. Ecol. Appl. 16, 2143–2152. doi:10.1890/1051-0761(2006)016[2143:ecodca]2.0.co;2
Walton, C. R., Zak, D., Audet, J., Petersen, R. J., Lange, J., Oehmke, C., et al. (2020). Wetland buffer zones for nitrogen and phosphorus retention: Impacts of soil type, hydrology and vegetation. Sci. Total Environ. 727, 138709. doi:10.1016/j.scitotenv.2020.138709
Welti, N., Bondar-Kunze, E., Singer, G., Tritthart, M., Zechmeister-Boltenstern, S., Hein, T., et al. (2012a). Large-scale controls on potential respiration and denitrification in riverine floodplains. Ecol. Eng. 42, 73–84. doi:10.1016/j.ecoleng.2012.02.005
Welti, N., Bondar-Kunze, E., Mair, M., Bonin, P., Wanek, W., Pinay, G., et al. (2012b). Mimicking floodplain reconnection and disconnection using 15N mesocosm incubations. Biogeosciences 9, 4263–4278. doi:10.5194/bg-9-4263-2012
Wilson, J. S., Baldwin, D. S., Rees, G. N., and Wilson, B. P. (2011). The effects of short-term inundation on carbon dynamics, microbial community structure and microbial activity in floodplain soil. River Res. Applic. 27, 213–225. doi:10.1002/rra.1352
Wold, S., Sjöström, M., and Eriksson, L. (2001). PLS-regression: A basic tool of chemometrics. Chemometrics Intell. Lab. Syst. 58, 109–130. doi:10.1016/S0169-7439(01)00155-1
Wu, X., Liu, G., Butterbach-Bahl, K., Fu, B., Zheng, X., and Brüggemann, N. (2013). Effects of land cover and soil properties on denitrification potential in soils of two semi-arid grasslands in Inner Mongolia, China. J. Arid Environments 92, 98–101. doi:10.1016/j.jaridenv.2013.02.003
Zaman, M., Nguyen, M. L., Imek, M., Nawaz, S., Khan, M. J., Babar, M. N., et al. (2012). Emissions of Nitrous Oxide (N2O) and Di-Nitrogen (N2) from the Agricultural Landscapes, Sources, Sinks, and Factors Affecting N2O and N2 Ratios. In Greenhouse Gases - Emission, Measurement and Management. London: InTech, 2–33. doi:10.5772/32781
Zaman, M., Nguyen, M. L., and Saggar, S. (2008). N2O and N2 emissions from pasture and wetland soils with and without amendments of nitrate, lime and zeolite under laboratory condition. Soil Res. 46, 526. doi:10.1071/SR07218
Keywords: denitrification potential, hydrological connectivity, acetylene inhibition technique, floodplain soils, ecosystem function
Citation: Kaden US, Fuchs E, Geyer S, Hein T, Horchler P, Rupp H, Scholz M, Schulz-Zunkel C and Weigelhofer G (2021) Soil Characteristics and Hydromorphological Patterns Control Denitrification at the Floodplain Scale. Front. Earth Sci. 9:708707. doi: 10.3389/feart.2021.708707
Received: 12 May 2021; Accepted: 09 July 2021;
Published: 26 July 2021.
Edited by:
Paola Passalacqua, University of Texas at Austin, United StatesReviewed by:
Gregory Noe, United States Geological Survey (USGS), United StatesPingping Luo, Chang’an University, China
Copyright © 2021 Kaden, Fuchs, Geyer, Hein, Horchler, Rupp, Scholz, Schulz-Zunkel and Weigelhofer. This is an open-access article distributed under the terms of the Creative Commons Attribution License (CC BY). The use, distribution or reproduction in other forums is permitted, provided the original author(s) and the copyright owner(s) are credited and that the original publication in this journal is cited, in accordance with accepted academic practice. No use, distribution or reproduction is permitted which does not comply with these terms.
*Correspondence: Ute Susanne Kaden, ute-susanne.kaden@ufz.de