
. Introduction
Sedimentary deposits, such as aeolianites or loess, have been extensively dated using optically stimulated luminescence (OSL) signals from quartz (Jacobs, 2008; Roberts, 2008), the dating being almost invariably carried out using a grain size related to the dominant grain size present in the particular sedimentary unit. For aeolianites, sand-sized grains (e.g. 120–180 μm or 180–250 μm) have been chosen. For loess deposits, silt-sized grains (4–11 μm) have usually been used due to the lack of coarse material (>90 μm), because the environmental dose rate from alpha particles can be better assessed than in the case of medium grains that are dominant in the sediment and because the grains can be deposited out of suspension with greater ease. When only one grain size is used, the age estimates are usually found to be in chronological order down section, but there is often little or no independent age control, and thus it is not known if the selected grain size gives the correct age. When the last interglacial palaeosol is identified, as at Luochuan in China, its timing is assumed to be coincident with Marine Isotope Stage 5 (71–130 ka; Lisiecki and Raymo, 2005) and the OSL ages obtained for 45–63 μm quartz grains from the overlying loess have given a basal age in agreement with this interpretation (Lai, 2010; Lai and Fan, 2013). Still, samples below this showed age underestimation.
When two grain sizes (4–11 μm and 63–90 μm) have been extracted from loess sections in southeastern Europe and China, the ages obtained using 4–11 μm quartz as well as the equivalent doses are significantly lower than those for the 63–90 μm quartz when the samples are older than ~40 ka (De of ~100 Gy), e.g. in Romania (Vasiliniuc et al., 2011; Timar-Gabor et al., 2011; Timar-Gabor et al., 2012; Timar-Gabor and Wintle, 2013; Constantin et al., 2014), Serbia (Timar-Gabor et al., 2015a) and China (Timar-Gabor et al., 2017); this is in spite of both grain sizes appearing to have suitable OSL characteristics. In addition, for samples found below the last interglacial palaeosol, even the ages for the coarser grains were showing age underestimation compared with ages inferred from a model based on magnetic susceptibility changes (Timar-Gabor and Wintle, 2013).
It was also observed in these studies that the corrected luminescence signals for fine grains are higher than the ones measured on coarse grains and thus a possible explanation for the lower equivalent doses measured on fine grains could reside in the interpolation of these values on the different single aliquot regenerative (SAR) dose response curves encountered for the two grain sizes at doses higher than 100 Gy. Furthermore, the 4–11 μm fraction has higher saturation characteristics (D0 values) compared to the 63–90 μm fraction and for high doses, the dose response curves for both fractions require fitting with a sum of two saturating exponential function. It has been shown recently that the saturation characteristics for different grain sizes of quartz (4–11, 11–30, 35–50, 63–90, 90–125, 125–180 and 180–250 μm) of different origins depend on the grain diameter, with the characteristic doses increasing for smaller grain sizes (Timar-Gabor et al., 2017).
Comparison of laboratory-generated dose response curves (Lx/Tx) with the measured, sensitivity-corrected natural OSL response (Ln/Tn) plotted as a function of expected dose, based on measured dose rate and independently assessed age, were reported in previous studies on loess from China (Chapot et al., 2012) and Romania (Timar-Gabor and Wintle, 2013; Constantin et al., 2015a). It was found that the natural dose response curves for 4–11, 35–63 and 63–90 μm grain sizes could be fitted with a single saturating exponential, whereas the laboratory-generated curves required two such components. It was also reported that the laboratory generated dose-response curves continue to grow for high doses (>300 Gy), whereas no growth was observed at these doses for the natural OSL response.
In an attempt to understand the main phenomena encountered in these studies of loess, many experiments have been carried out on the quartz grains from these loess sections in Romania and Serbia. These include investigating the response to alpha radiation (Constantin et al., 2015b), observation of time resolved OSL to confirm that the different dose response curves are not the result of feldspar contamination (Timar-Gabor et al., 2015b), application of different thermal treatments (Timar-Gabor et al., 2011), using linearly modulated OSL (Timar-Gabor et al., 2011), the measurement of aliquots which had been given doses on top of the natural dose (Timar-Gabor and Wintle, 2013; Timar-Gabor et al., 2015b) and isothermal luminescence decay experiments to assess the thermal stability of the dosimetric trap (Timar-Gabor et al., 2017).
To gain further insight into the possible processes that might be involved in giving rise to these unexpected results, we have chosen in this paper to study samples containing quartz with a different geological origin, from a different depositional environment and which are expected to have annual dose rates lower than those for loess, namely less than 1 Gy/ka (Fornós et al., 2009). Thus, measurements have been made on fine (4–11 μm) and coarse (63–90, 90–125, 125–180 and 180–250 μm) grains extracted from carbonate-rich aeolianites from two sites on Eivissa (Balearic Islands); we also compare the luminescence properties of the quartz extracted from these samples with those of quartz separates from our previously investigated samples of Chinese loess from Xifeng loess-paleosol section (Timar-Gabor et al., 2017).
. Material and methods
Study area
The island of Eivissa is the third largest (571 km2) and the most western island of the Balearic Archipelago and is located in the southwestern part of the Mediterranean Sea (inset to Fig. 1). The main structure of the island is composed of a series of thrust sheets (mainly of Middle Triassic to Middle Miocene carbonate deposits) emplaced during the Alpine compression (Upper Oligocene to Middle Miocene) and trending NE-SW (Rangheard, 1971; Rangheard, 1984) (Fig. 1). These thrust sheets correspond to the northeasterly continuation of the Subbetic Mountains of southern Spain (Fornós et al., 2002). Since the early Quaternary, sea level oscillations and climate variation resulted in the piling up of alternating aeolianites and colluvial deposits that outcrop extensively along the cliff-lined coast of Eivissa (Fig. 1). The coastal section at Cala Bassa (Fig. 2), located in the southwest of the island (Fig. 1) has been investigated in this study.
Fig. 1
Location of aeolianites (shown in red) that outcrop on the coast of Eivissa, Balearic Islands, Western Mediterranean (inset).
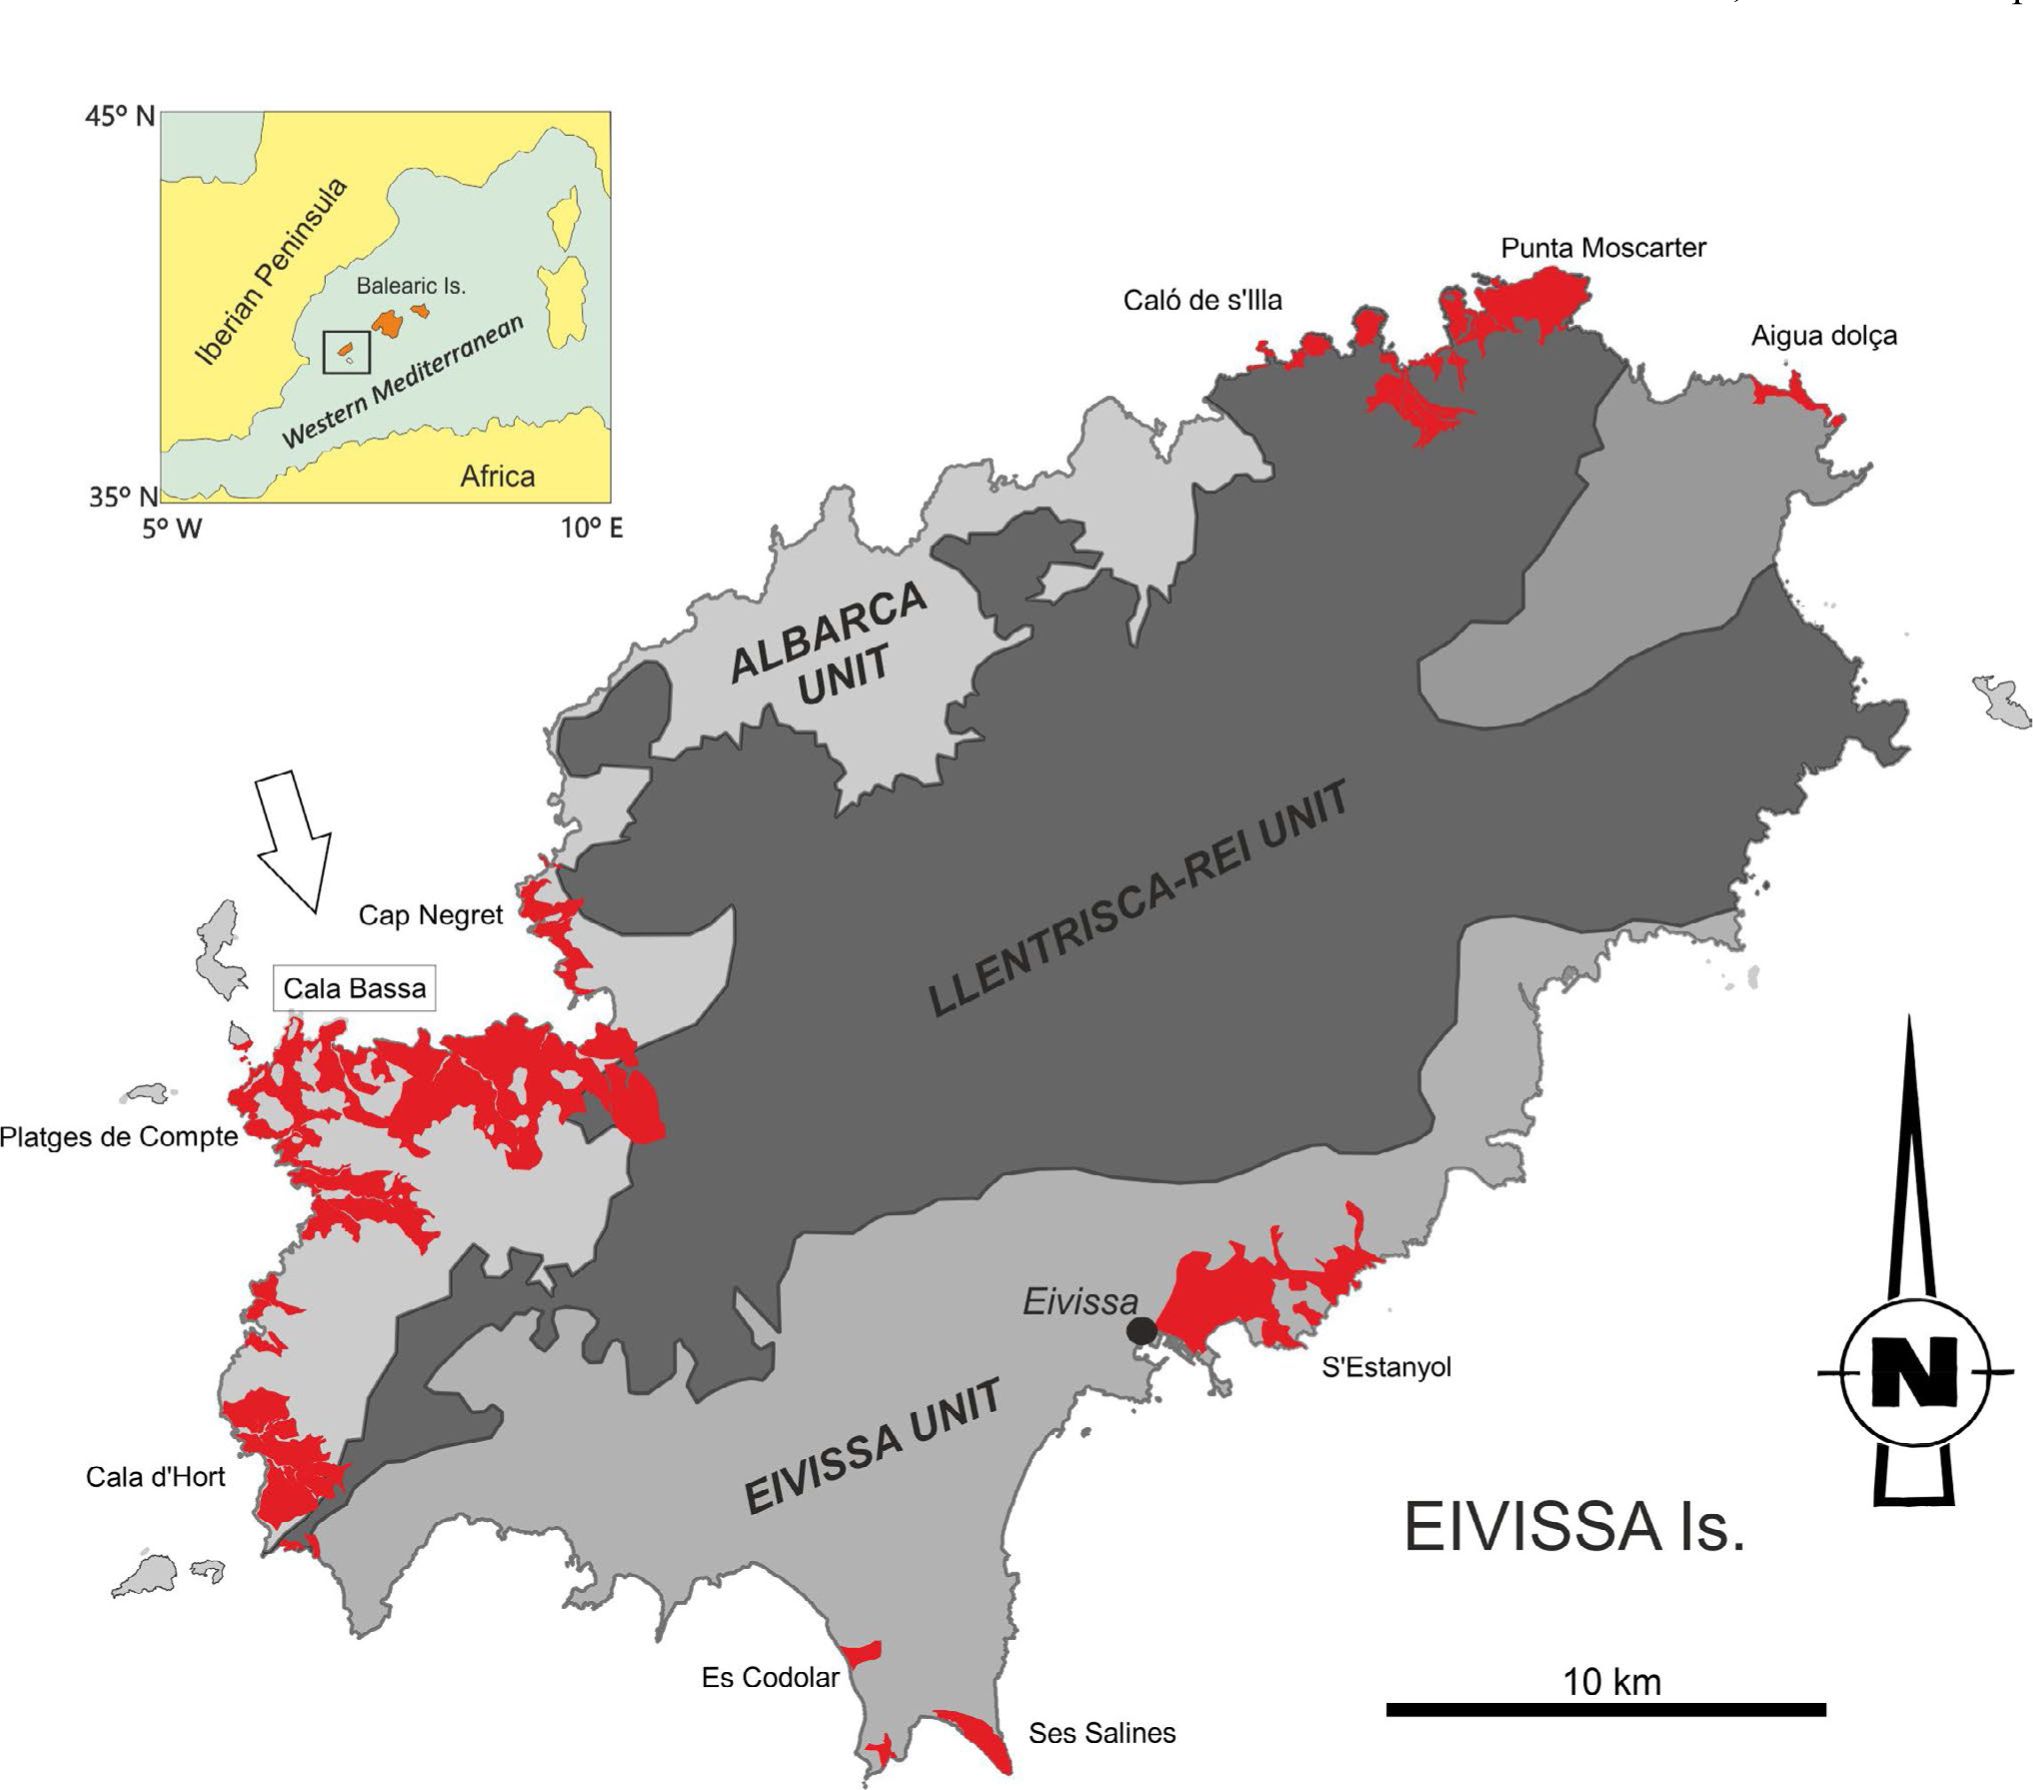
Fig. 2
Simplified stratigraphic log from Cala Bassa showing structural units and location of samples (stars) for OSL measurements. Each OSL age is the weighted average obtained for the fine and coarse quartz fractions.
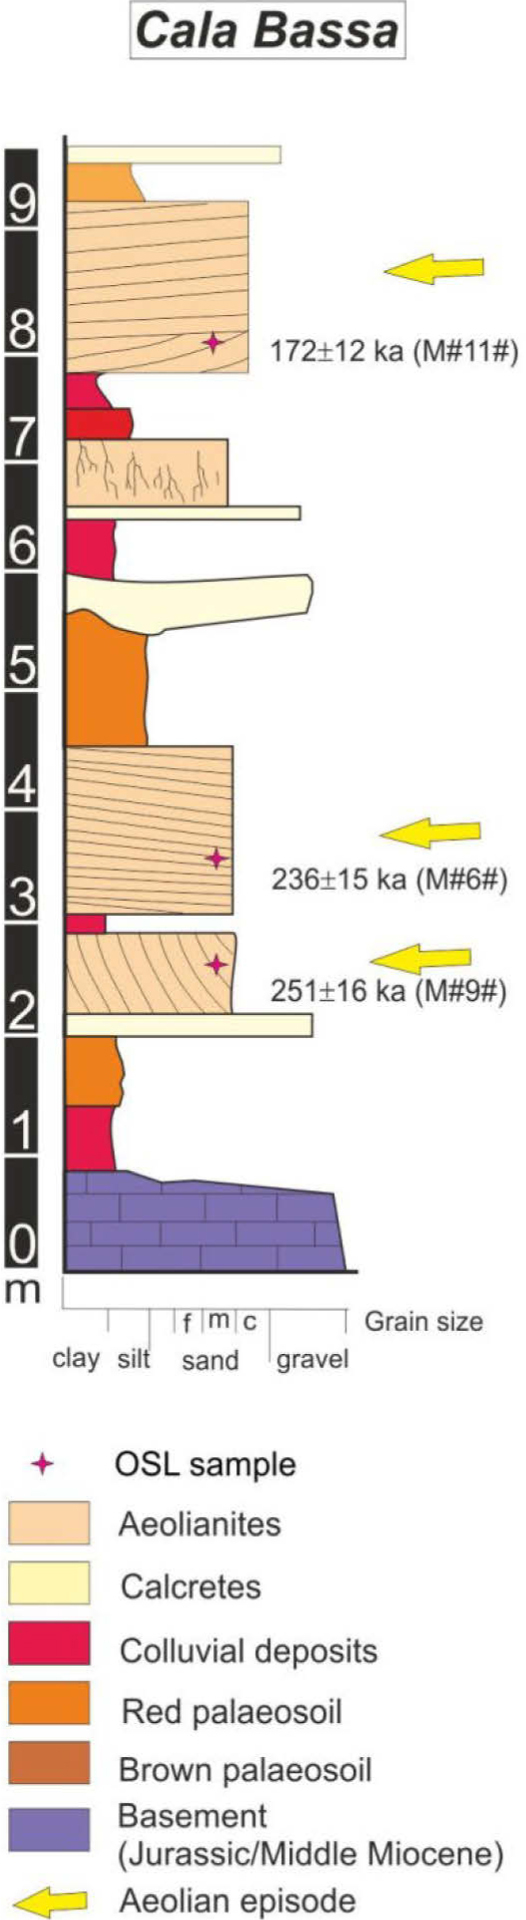
At Cala Bassa there are four overlapping calcareous aeolian deposits interbedded with red and brown paleosols and occasional calcretes, which outcrop along the coast for approximately 2.6 km. The aeolian deposits record inland migrations and the variability of the lateral and vertical facies results in the complex architecture that characterizes all the Pleistocene deposits. The presence of sand-rich palaeosols suggests transitions from arid periods to more stable and humid environmental conditions and the presence of calcretes suggests times of high evaporation related to episodes of increasing aridity.
The aeolian deposits are composed mainly of carbonate fragments (mainly bioclasts) deposited in a marine shallow platform that was exposed during periods of low sea level. The non-carbonate minerals, which make up only a small fraction of the deposit, are thought to have arrived from the Sahara when winds blow from the southwest (Fiol et al., 2005). Deposition of aggregated grains up to 300 μm have been recorded for recent dust storms reaching the Balearic Islands (Fiol et al., 2005). Mineral analysis of this modern dust shows it to contain abundant quartz and grain-size analysis shows silt- and sand-sized grains to have been carried by the wind across this part of the Mediterranean (Fiol et al., 2005, Muhs et al., 2010). Quartz is also present in sediments trapped in karstic caves on Eivissa (Fiol et al., 2005). Thus, well bleached quartz grains of different sizes are likely to be present in the carbonate dune sands at deposition.
Samples and analytical facilities
The three aeolianite samples were collected as blocks (ca. 1 × l × 0.8 m) wrapped in lightproof plastic bags and the entire sample preparation procedure was performed under subdued red light conditions. The inner part of each sample was extracted in the laboratory following chemical treatments with HCl (30%) and H2O2 (10%) for carbonate and organic matter removal, respectively. The remaining material was sieved to obtain material < 63 μm and different fractions in the range 63–250 μm. The coarse fractions (> 63 μm) were subsequently etched with 40% HF for 60 minutes. The fraction less than 63 μm was prepared using published procedures (Lang et al., 1996; Frechen et al., 1996) in order to extract fine-grained (4–11 μm) polymineral material from which quartz grains were isolated by digestion in H2SiF6 for 10 days.
Equivalent dose measurements were undertaken using a Risø TL/OSL-DA-20 (Thomsen et al., 2006). The 90Sr-90Y beta source was calibrated using fine and coarse grains of gamma-irradiated calibration quartz supplied by Risø National Laboratory.
Radionuclide concentrations were derived by high-resolution gamma spectrometry and were converted to dose rates using published conversion factors (Guérin et al., 2011). The samples were checked for radioactive equilibrium in uranium series. U-238 activity was determined by measuring the Th-234 emissions, namely the 63.29 keV peak with a yield of 4.8% and the 92.38 keV and 92.80 keV peaks with yields of 2.8% and 2.7%, respectively. The 63.29 keV peak is interfered with the 63.83 keV peak associated with Th-232, with a yield of 0.2%. Because the ~63 keV peak causes interference of radionuclides from both uranium and thorium series, using this peak for determination by relative calibration is inaccurate. As such, we used the emissions of 92.3 keV and 92.8 keV for determining Th-234 and hence U-238; this was difficult though, due to the very low radioactivity of this material. As these emissions have relatively low yields and are on the Compton edge of the spectrum, it remains very difficult to use them with great confidence for measuring such low activities. Pb-210 is a good indicator for radon loss; however the problems mentioned above apply to this radionuclide as well due to its low energy (46.5 keV). Moreover, these samples are fairly dense and consequently this low energy emission is subjected to attenuation within the sample. We have nevertheless quantified these emissions; the values obtained for all samples were lower than in the case of Ra-226, but due to reasons stated above, we consider that this more likely reflects inaccuracies in the measurement itself of these low energy emissions than a systematic radium gain accompanied with radon loss. In the case of radium measurement, Ra-226 activity was determined from the well defined Pb-214 peaks at 351 keV with a yield of 37.6% and 295 keV with a yield of 19.3% and from the Bi-214 peak at 609.3 keV with a yield of 46.1%. Samples were measured after they have been stored for one month to allow for equilibrium between radium and radon. We consider that due to the nature of the aeolianite material and its formation, radioactive equilibrium is a fair assumption. The cosmic ray contribution was estimated using published formulae (Prescott and Hutton, 1994). Water content estimation was based on the difference between the as found and the oven-dried weight of material from the inner part of the blocks. A time-averaged water content was derived for each sample with a relative error of 25%. The blocks were highly cemented, allowing little water penetration; the presence of rhizoconcretions (pedodiagenetic mineral accumulations around living or dead plant roots; Klappa, 1980) in the investigated profile indicates a quick cementation process. Considering the various sea-level fluctuations during the dated period (see del Valle et al., 2016) and the fact that little water penetration is allowed after lithification, it appears reasonable to use the present-day water content with a relative error of 25%. Moreover, identifying an upper limit for water content is not critical, since the sea-level during the dated period was mostly lower than today (del Valle et al., 2016, Zazo, 1999). We are fully confident that a 25% relative error is sufficiently high to incorporate long term fluctuations in moisture. The information relevant for annual dose estimation is given in Table 1. The average dose rate to fine grains in these three samples is ~0.75 Gy/ka.
Table 1
Equivalent doses (De), dosimetry measurements and OSL ages. The luminescence and dosimetry data are indicated along with the random uncertainties; the uncertainties mentioned with the OSL ages are the overall uncertainties. All the errors correspond to 1σ.
[i] n denotes the number of accepted aliquots.
Beta attenuation and etching factor for 63–90 μm, 90–125 μm, 125–180 μm, 180–250 μm assumed to be 0.94 ± 0.050, 0.90 ± 0.045, 0.88 ± 0.044, 0.87 ± 0.044, respectively; adopted alpha efficiency factor was 0.04 ± 0.02.
Water content estimation was based on the difference between the raw and the oven-dried weight of material from the interiors of the blocks.
The total dose rates include the contribution from the alpha, beta and gamma radiations, and the contribution from the cosmic rays; an internal contribution for the coarse fraction assumed to be 0.01 Gy/ka (Vandenberghe et al., 2008).
Luminescence investigations on the samples from Cala Bassa have been performed on five different grain sizes of quartz (4–11 μm, 63–90 μm, 90–125 μm, 125–180 μm and 180–250 μm). Small aliquots (2 mm diameter) have been used for the measurements performed on coarse quartz grains. For all grain sizes, the error bars often fall within the data point on the graph.
. Results
General behaviour in the SAR protocol
The shapes of the OSL decay curves for these samples are almost identical to that obtained for the calibration quartz measured using the same equipment (inset to Fig. 3a, 3b). The data were obtained when a 220°C preheat was applied for 10 s; for 4–11 μm grains from M#6#, the OSL resulting from the natural dose and the regenerated signals from doses of 250, 1000 and 2000 Gy were measured, and the signal for a 4.81 Gy dose given to the calibration quartz was used (inset to Fig. 3a). The equivalent data for 63–90 μm grains from M#6# are given in the inset to Fig. 3b. The OSL signal used for analyses was the initial 0 to 0.308 s of the decay curve minus a background from the 1.69–2.30 s interval. LM-OSL signals of 4–11 μm and 63–90 μm grains from sample M#6# were also examined (see Fig. S1).
Fig. 3
Representative SAR dose response curves and decay curves for fine and coarse quartz. (a) SAR dose response curve for an aliquot of 4–11 μm quartz extracted from sample M#6# and test results. Inset shows a typical normalised natural OSL signal and response to 250, 1000 and 2000 Gy compared with that for calibration quartz in response to 4.81 Gy. (b) Same data for an aliquot of 63–90 μm quartz extracted from sample M#6#. The error bars often fall within the data point on the graph.
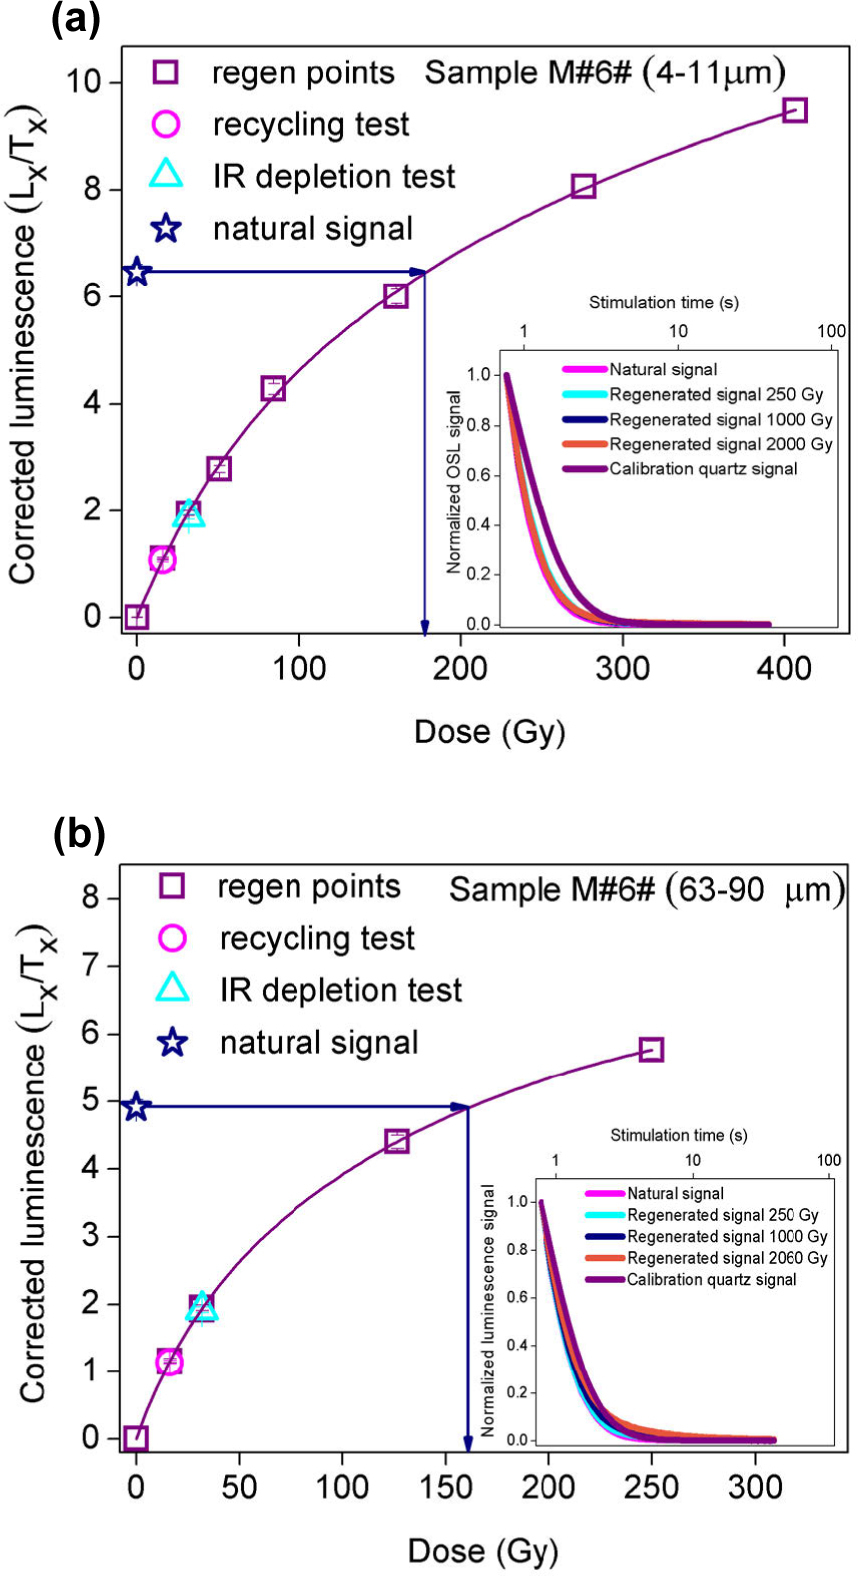
Dose response curves were obtained using the SAR protocol (Murray and Wintle, 2000) with a 220°C preheat treatment for 10 s and a cutheat at 180°C. The test dose was chosen to be 16 Gy and it was chosen based on our previous studies (e.g. Timar-Gabor and Wintle, 2013; Timar-Gabor et al., 2017). An elevated temperature bleach at 280°C for 40 s was performed at the end of each cycle (Murray and Wintle, 2003). The growth of the luminescence signal with dose was best described by the sum of two saturating exponential functions. A representative dose response curve for 4–11 μm grains of sample M#6# using regeneration doses up to 400 Gy is presented in Fig. 3a. The dose response curve for the 63–90 μm grains for this sample is given inFig. 3b. In terms of the routine tests for the SAR protocol, very few aliquots (less than 5%) have been rejected based on the recycling ratio test (Fig. 3a and Fig. 3b, circle); no aliquot has been eliminated due to poor IR depletion ratio (Fig. 3a and Fig. 3b, triangle) and recuperation has not exceeded 0.4% of the natural signal. Within error limits, the values obtained for both recycling and IR depletion ratio tests fell in the range of 0.9 to 1.1. Even when a dose of 1000 Gy was given, IR exposure for 40 s at 60°C did not reduce the OSL and resulted in a ratio of 1.02 ± 0.03.
The preheat temperature of 220°C was selected on the basis of a standard preheat test in which the 10 s preheat was applied at temperatures from 200 to 280°C in 20°C steps, whilst maintaining the cutheat at 180°C. This was performed using 4–11 μm and 63–90 μm quartz grains from samples M#6# and M#11#, respectively. No systematic variation in equivalent dose with preheat treatment was observed over the employed temperature range (Fig. S2). Pulse annealing experiments and isothermal decay experiments were also performed and the results confirm the thermal stability of the OSL signal from the samples used in this study (see Text S1, Fig. S3 and Fig. S4).
In addition, a dose recovery test (Murray and Wintle, 2003) was applied to 4–11 μm and 63–90 μm quartz separates from samples M#6# and M#11#, respectively; the doses were given after two 100 s blue light exposures at room temperature, separated by a 10 ks pause. The given doses were chosen to match the equivalent doses of the samples, namely 175 Gy for sample M#6# and 107 Gy for M#11#; the ratios of the measured to given dose in this test are 1.02 ± 0.02 and 0.95 ± 0.04 for the fine (M#6#) and coarse fraction (M#11#), respectively.
Equivalent doses and OSL ages
Equivalent doses were obtained using the SAR protocol on between 8 and 12 aliquots for both fine and coarse grains. The average De values obtained using the SAR protocol and the OSL ages are presented in Table 1. Equivalent doses for fine grains range between 133 and 179 Gy, whereas for the different coarse fractions the range is between 91–175 Gy. Agreement was obtained within error limits between the ages on the different quartz fractions and a weighted mean age was calculated for each sample following Aitken (1985; Appendix B) (Table 1). The random errors for the fine grain aliquots were between 2.4 and 3.4%; the random errors for the coarse grains were larger, but not more than 6%. An age of 172 ± 12 ka was found for the uppermost sample, and ages of 236 ± 15 ka and 251 ± 16 ka were found for two deeper units, 4–5 m apart (Fig. 2). The good agreement for the ages on this timescale for the two grain sizes is in stark contrast to the results obtained for loess from eastern Europe and China (Timar-Gabor et al., 2017). However, it is important to note that the equivalent doses are fairly low (<200 Gy), due to the low dose rates which are characteristic of quartz from aeolianites.
Laboratory dose-response curves for high doses
As discussed in Introduction, the non-agreement of the ages for fine and coarse grains from loess may be the result of the different dose response curves encountered at higher doses. In this study, dose response curves have been constructed up to 2 kGy for the five grain sizes extracted from the aeolianite sample M#6# (Fig. 4). Curve fitting was carried out using two saturating exponential functions of the form:
Fig. 4
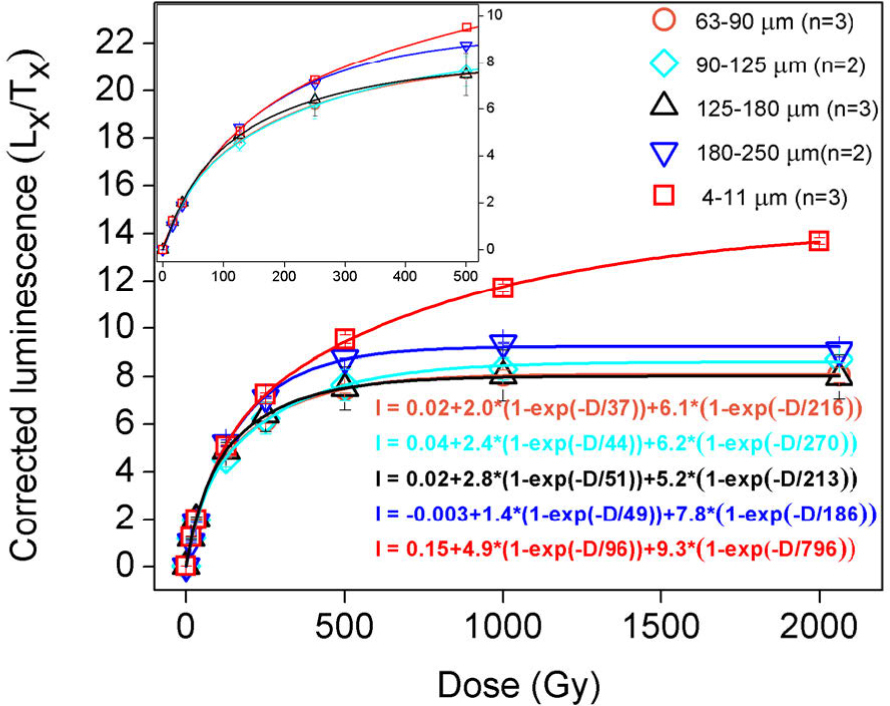
SAR dose response curves for doses up to 2000 Gy for aliquots of 4–11, 63–90, 90–125, 125–180 and 180–250 μm quartz extracted from sample M#6#. The inset shows an enlargement for the dose region up to 500 Gy. The number of aliquots used for each fraction and the equations used to fit the curves are also indicated.
Where I – intensity of the OSL signal corresponding to a dose, D; I0 – intercept; A, B – saturation characteristics of the two exponential components; D01, D02 – doses representing the onset of saturation of each exponential function.
A very different growth pattern was observed for the fine and coarse quartz fractions. The regenerated luminescence signal for the coarse quartz grains reaches 86% of saturation level (equivalent to the 2 × D0 limit for a single saturating exponential growth) (Wintle and Murray, 2006) for doses of ~350 Gy, whereas for the 4–11 μm quartz the regenerated signals attain ~86% of saturation for doses of ~2000 Gy. Thus, the dose response behaviour for the aeolianite appears to be similar to that seen for the loess in eastern Europe (Timar-Gabor et al., 2017) and reported for loess deposits elsewhere in Europe (Kreutzer et al., 2012; Fuchs et al., 2013; Lomax et al., 2014) and also in China (Timar-Gabor et al., 2017). For the coarse grains (63–90, 90–125, 125–180 and 180–250 μm) the values of D01 obtained using the data in Fig. 4 were 37, 44, 51 and 49 Gy, respectively, and for D02 216, 270, 213 and 186 Gy, respectively.
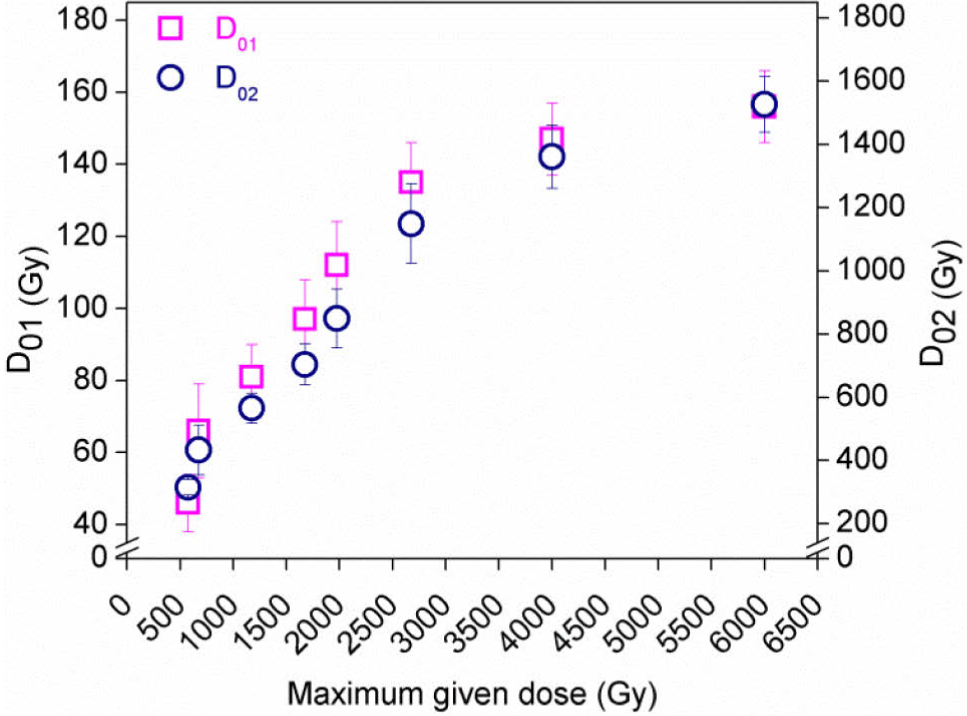
For the fine grains the values for D01 and D02 obtained for the data set in Fig. 4 were 96 and 796 Gy, respectively. However, it was pointed out that the dose response curve needs to be constructed up to saturation of both components for meaningful values of the saturation parameters to be calculated (Timar-Gabor and Wintle, 2013; Timar-Gabor et al., 2017). In a recent study on samples from a drill core in Switzerland (Buechi et al., 2017) it was shown that when a single saturating function is used to describe the dose response of a fine quartz sample, the D0 fitting parameters vary with the size of the maximum regeneration dose; it was also pointed out that the single saturating exponential fit was not the most appropriate in this case and that use of such a fit may account for the dependence observed between the D0 value and the size of the maximum given dose. Thus, a dose response curve for 4–11 μm grains from sample M#6# was constructed using 18 doses up to 6 kGy (Fig. 5) and the combination of two saturating exponential functions was used to characterise the dose response curve. The values for D01 and D02 calculated from this data set are 156 ± 10 and 1527 ± 88 Gy, respectively, about double the values calculated when the maximum dose was 2 kGy (Fig. 4). Using the data in Fig. 5, but restricting the range of doses used for fitting to the first eleven doses, and then adding in one more data point in subsequent analyses, enables examination of the effect of the choice of the maximum dose point on calculation of D01 and D02 (Table S1 and Fig. 6). This clearly exemplifies the need to construct dose response curves up to full saturation in order to obtain meaningful values for the D01 and D02 parameters; this approach is needed to allow comparisons between different studies to be made. When irradiation doses of less than 1 kGy are used, incorrect parameters will be obtained (Fig. 6) and the fitting of an equation with linear component in addition to a saturating exponential component will be equally incorrect. Similar results were previously presented for another aliquot of this sample (Timar-Gabor et al., 2017), for which the dose response curve was constructed up to 10000 Gy.
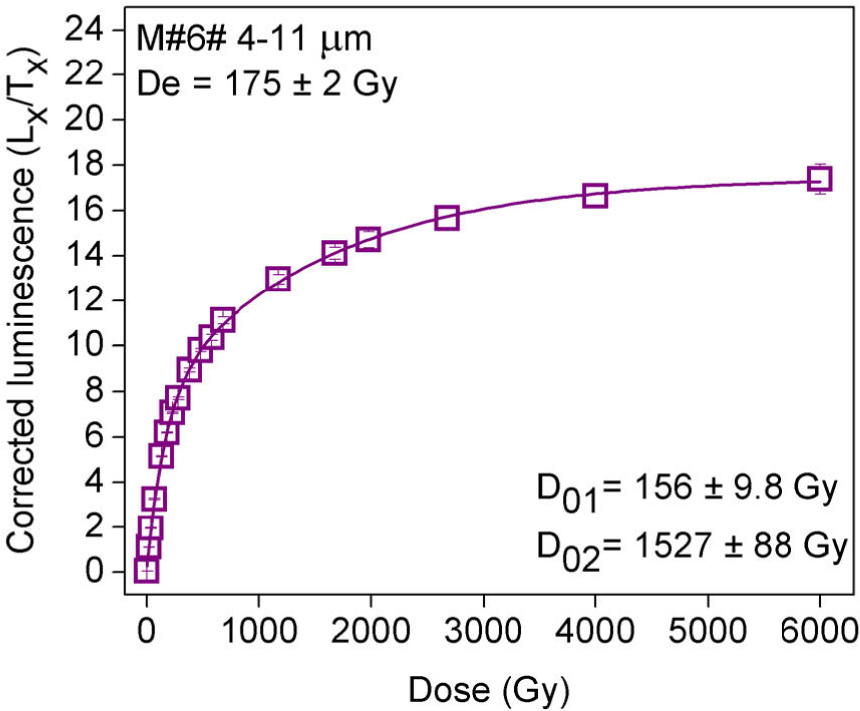
Fig. 6
Saturation characteristics (D01, D02) obtained from the data in Fig. 5, calculated when using increasingly high doses.
Considering the error limits and the uncertainties of fitting using a restricted number of data points, the responses of the fine and coarse grains can be superimposed for doses up to ~200 Gy (inset to Fig. 4); it is for this dose region that values of De were obtained for these samples (M#6#, M#9# and M#11#), resulting in similar ages for both fine and coarse grain sizes.
Adding laboratory doses before measurement
Quartz from aeolianites
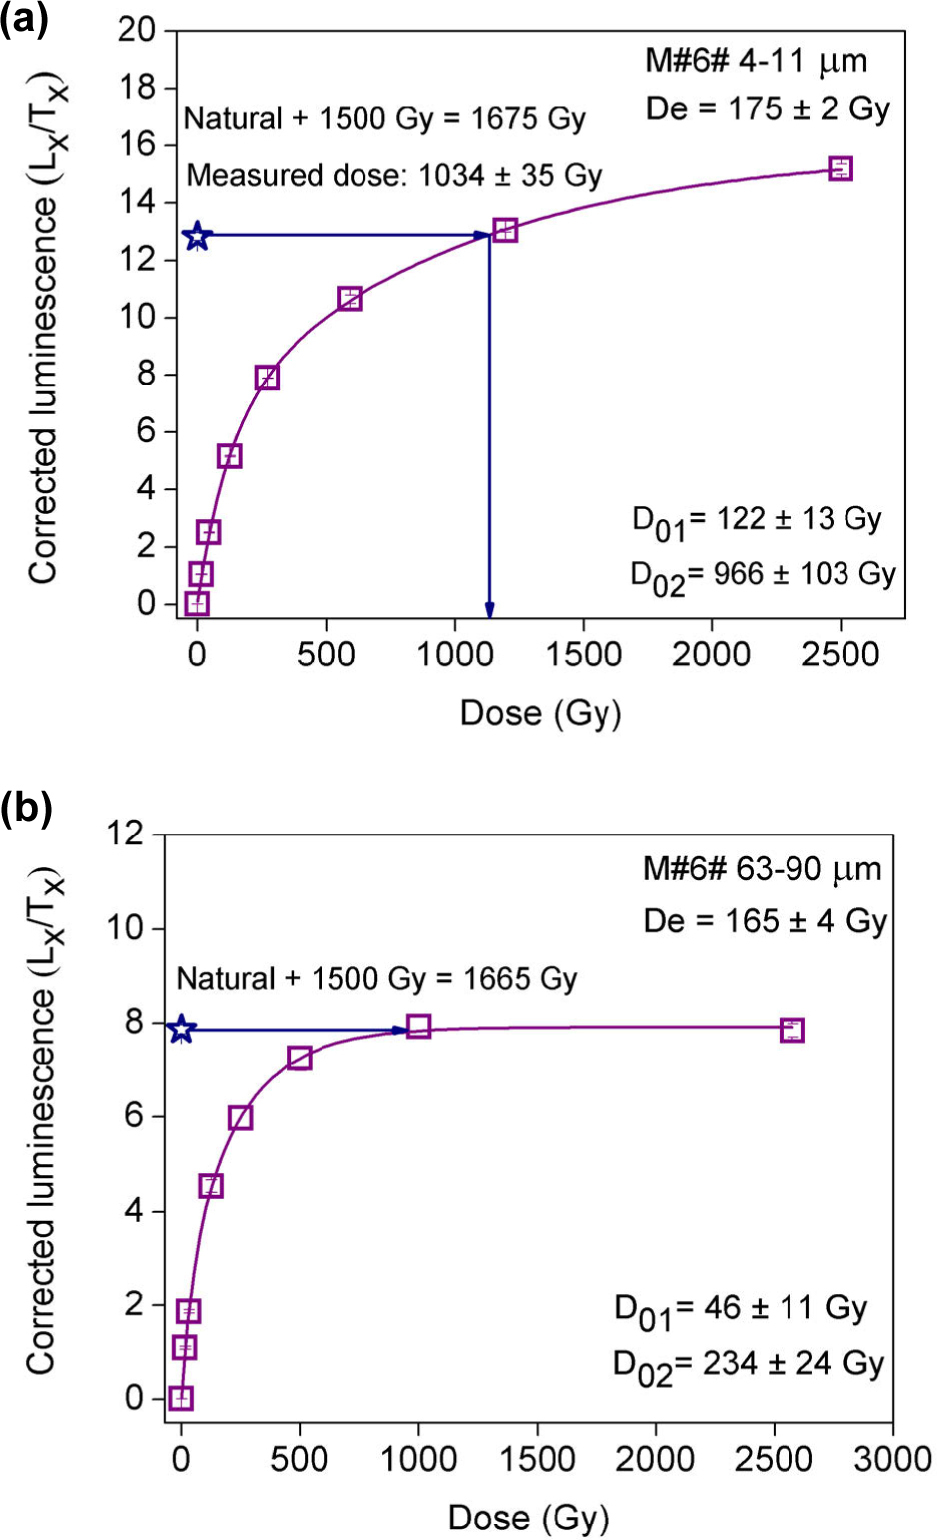
As seen in Fig. 4, the SAR dose response curves for the various coarse grain fractions of sample M#6# reach the saturation level when doses of 1000 Gy are applied. This implies that if a dose of this order is given in addition to the natural dose, the value of the sensitivity corrected signal, denoted by Ln∗/Tn∗, should also be at the same saturation level. Aliquots of 4–11 μm quartz from sample M#6# (De = 175 ± 2 Gy) were given 1500 Gy (Fig. 7a); the response intersects the subsequently constructed dose response curve enabling an apparent equivalent dose to be measured (1040 ± 35 Gy), thus giving a value that is less than the known dose that was given. This behaviour contrasts with the results for the 63–90 μm grains from this sample where the response to the natural plus added dose is at the same level as the saturation level of the subsequently measured SAR dose response curve (Fig. 7b). For this sample it had been shown that the natural signal for both grain sizes was well below the saturation level of the regenerated dose response curve (Fig. 3a and 3b).
Fig. 7
Average (n=3) SAR dose-response curves constructed after giving 1500 Gy in addition to the natural dose. (a) Data for 4–11 μm grains from sample M#6#. (b) Same data for 63–90 μm grains from sample M#6#. The sensitivity corrected signal related to the natural plus 1500 Gy dose is shown as a horizontal line projected onto the dose response curve.
In addition, doses of 50, 100, 200, 300, 400, 500, 1000, 1800, 2500, 3825 and 5825 Gy were given to fresh aliquots of 4–11 μm quartz from sample M#6#, thus providing them with total doses of 225, 275, 375, 475, 575, 675, 1175, 1975, 2675, 4000 and 6000 Gy, respectively. A dose response curve was constructed using the resulting values of Ln∗/Tn∗ where n indicates the values measured for natural plus added laboratory dose for each dose (Fig. 8a, squares).
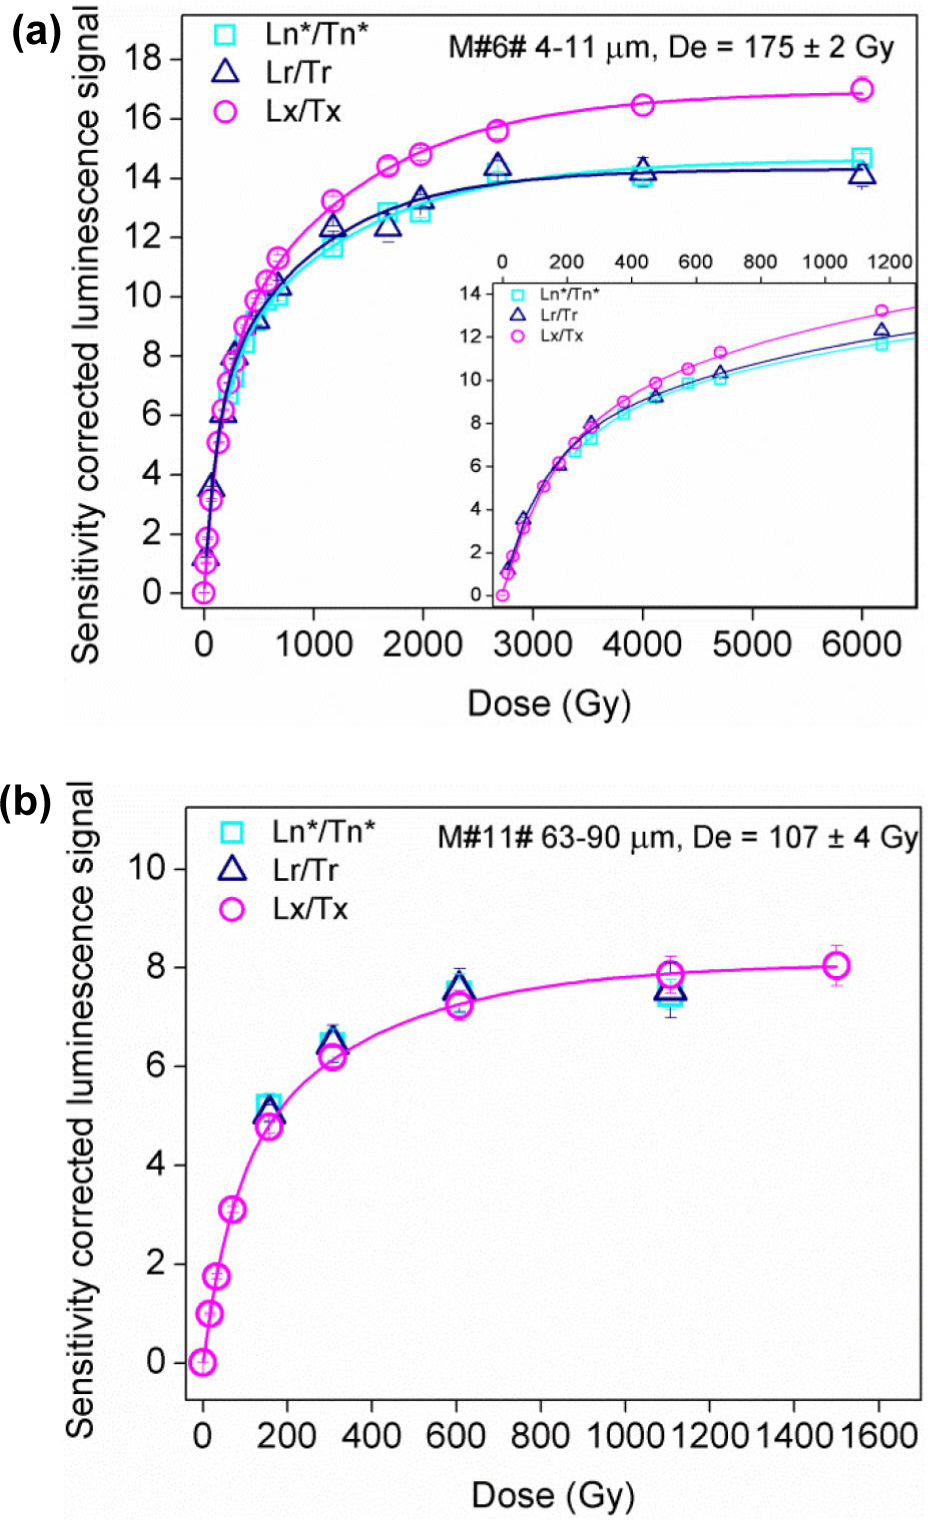
Fig. 8
Average Ln∗/Tn∗ plotted as a function of equivalent dose + laboratory dose, average Lr/Tr measured after one bleach as in dose recovery test and average Lx/Tx measured in a SAR sequence. (a) Data for 4–11 μm quartz from sample M#6#. (b) Same data for 63–90 μm quartz from sample M#11#. Each measurement on fine quartz is the average of three to thirteen aliquots, whereas for the coarse fraction between three and seven aliquots have been used for measurements. The dose response curves were fitted using the sum of two saturating exponential functions. Inset in Fig. 9a presents the same data but enlarged for the low dose region.
The experiment was repeated on aliquots of 63–90 μm quartz from sample M#11# (De = 107 ± 4 Gy), with doses of 50, 200, 500 and 1000 Gy given in addition to natural aliquots. The resulting values of Ln∗/Tn∗ are plotted in Fig. 8b (squares) as function of the total dose (N+added dose). The doses given in addition to the natural were selected so that the total dose matched the doses used to construct corresponding SAR dose response curves (Fig. 8a and 8b for fine and coarse quartz, circles). These values are designated Ln∗/Tn∗ as they can be regarded as equivalent to Ln/Tn values taken for different samples down a section, as previously obtained for Romanian loess at Costineşti (Timar-Gabor and Wintle, 2013) and Lunca (Constantin et al., 2015a). The SAR dose response curves constructed for aliquots of fine and coarse quartz after adding doses to the natural are given in Fig. S5 and Fig. S6, respectively. Information on the values of De obtained for the natural plus added doses for both fine and coarse quartz is presented in the supplementary material (Text S2, Table S2 and Fig. S7).
A third dose response curve was obtained using measurements made when doses of value equivalent to the natural plus added dose were given after two light exposures similar to those applied in a dose recovery experiment (Murray and Wintle, 2003). The dose response curve derived for the fine fraction from Lr/Tr, where Lr is the response to the dose after this treatment, is also shown in Fig. 8a (triangles). This data set overlaps the dose response curve obtained when doses are added to the natural (Ln∗/Tn∗), but both of them deviate from the SAR dose response curve for doses of over ~300 Gy. The data sets were fitted with two saturating exponential components. For the 63–90 μm fraction of sample M#11#, the Lr/Tr data set is given in Fig. 8b (triangles). The values of both Lr/Tr and Ln/Tn overlap the SAR dose response curve. Again, the extended SAR dose response curve was best represented by the sum of two saturating exponential functions. Dose recovery ratio information for the coarse fraction is presented in Text S2, Table S3 and Fig. S8.
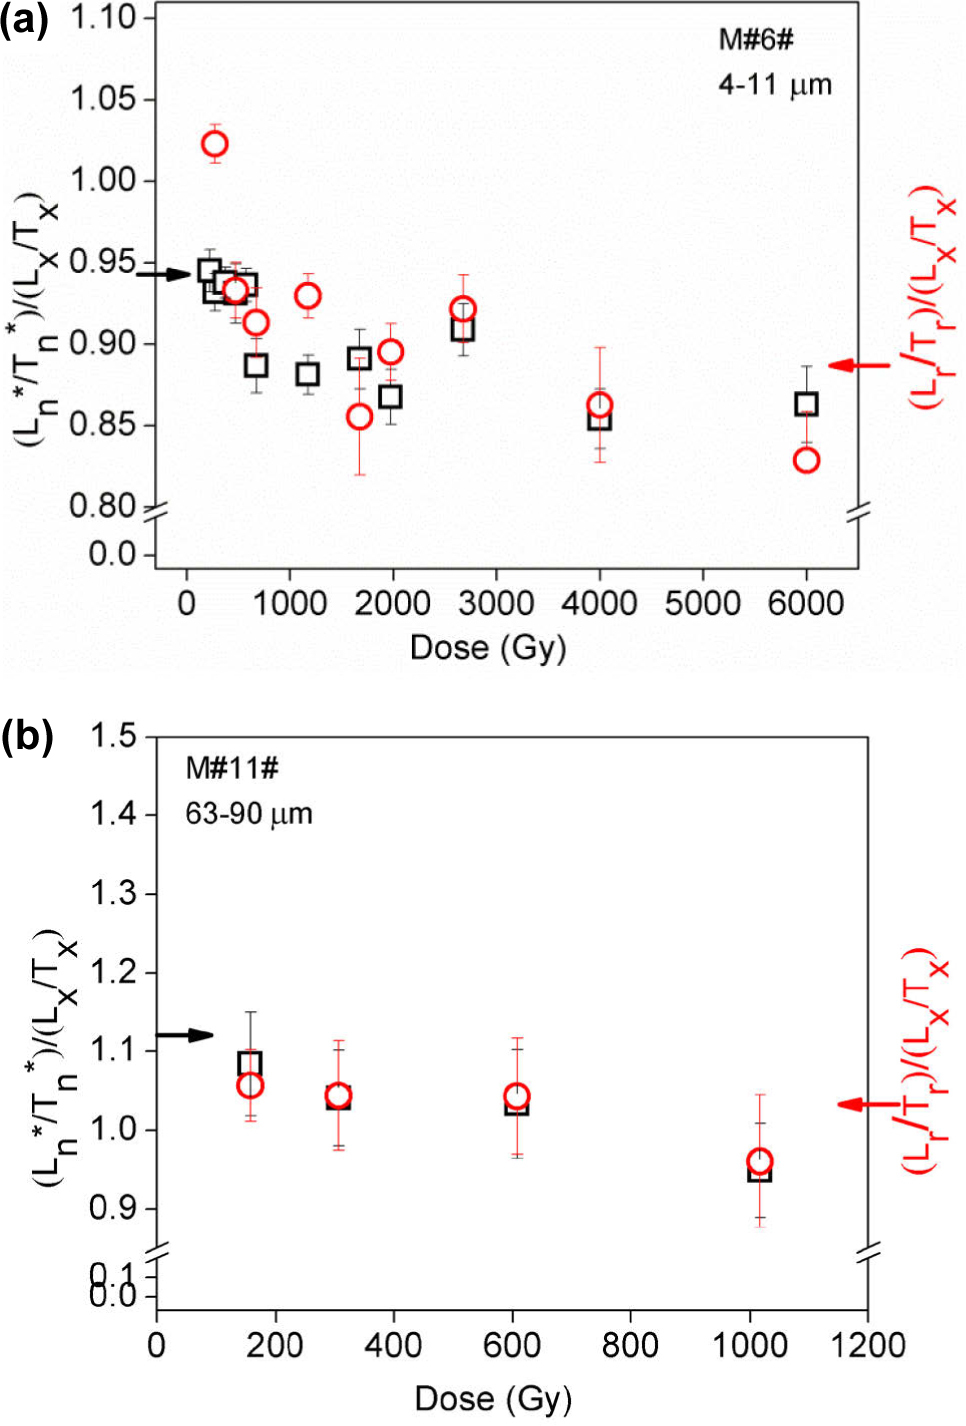
The dose response curves in Fig. 8 can also be compared by plotting the ratios of the data points, i.e. (Ln∗/Tn∗)/(Lx/Tx) and (Lr/Tr)/(Lx/Tx) as a function of dose (Fig. 9). This data is also represented in Table S4. For the fine quartz fraction, both data sets show a greater underestimation compared to the SAR dose response curve when larger doses are given.
Fig. 9
The (Ln/Tn)/(Lx/Tx) and (Lr/Tr)/(Lx/Tx) ratios as a function of dose obtained using the data in Fig. 8 and Table S4. (a) Data for 4–11 μm quartz from sample M#6#. (b) Data for 63–90 μm quartz from sample M#11#.
The effect of bleaching prior to dosing on the shape of the Lr/Tr dose-response curve was tested on three aliquots of fine quartz from sample M#6#. Firstly, the three aliquots were repeatedly bleached and dosed, i.e. 6 blue light bleaching steps of 500 s at room temperature separated by irradiation with doses of 500 Gy. Then, a 6000 Gy dose was measured after two 100 s blue light exposures at room temperature with a 10 ks pause between them, as in a typical dose recovery test (Murray and Wintle 2003). The average ratio of the Lr/Tr value for the given dose of 6000 Gy to the Lx/Tx value measured for the same dose in the subsequently constructed SAR dose response curve is 0.81 ± 0.01. A similar result (0.83 ± 0.03) was reported in the manuscript for the (Lr/Tr)/(Lx/Tx) ratio for a 6000 Gy dose, where Lr/Tr was measured in a dose recovery experiment prior to which no additional bleaching/dosing steps were performed. If the bleaching prior to dosing had any effect on the measured Lr/Tr values, we would expect a much lower value for the (Lr/Tr)/(Lx/Tx) ratio obtained for the dose recovery experiment performed after additional bleaching/ dosing steps. Thus, it is unlikely that the bleaching prior to dosing could cause the different shape of the Lr/Tr dose-response curve compared to the Lx/Tx dose-response curve.
Quartz from loess
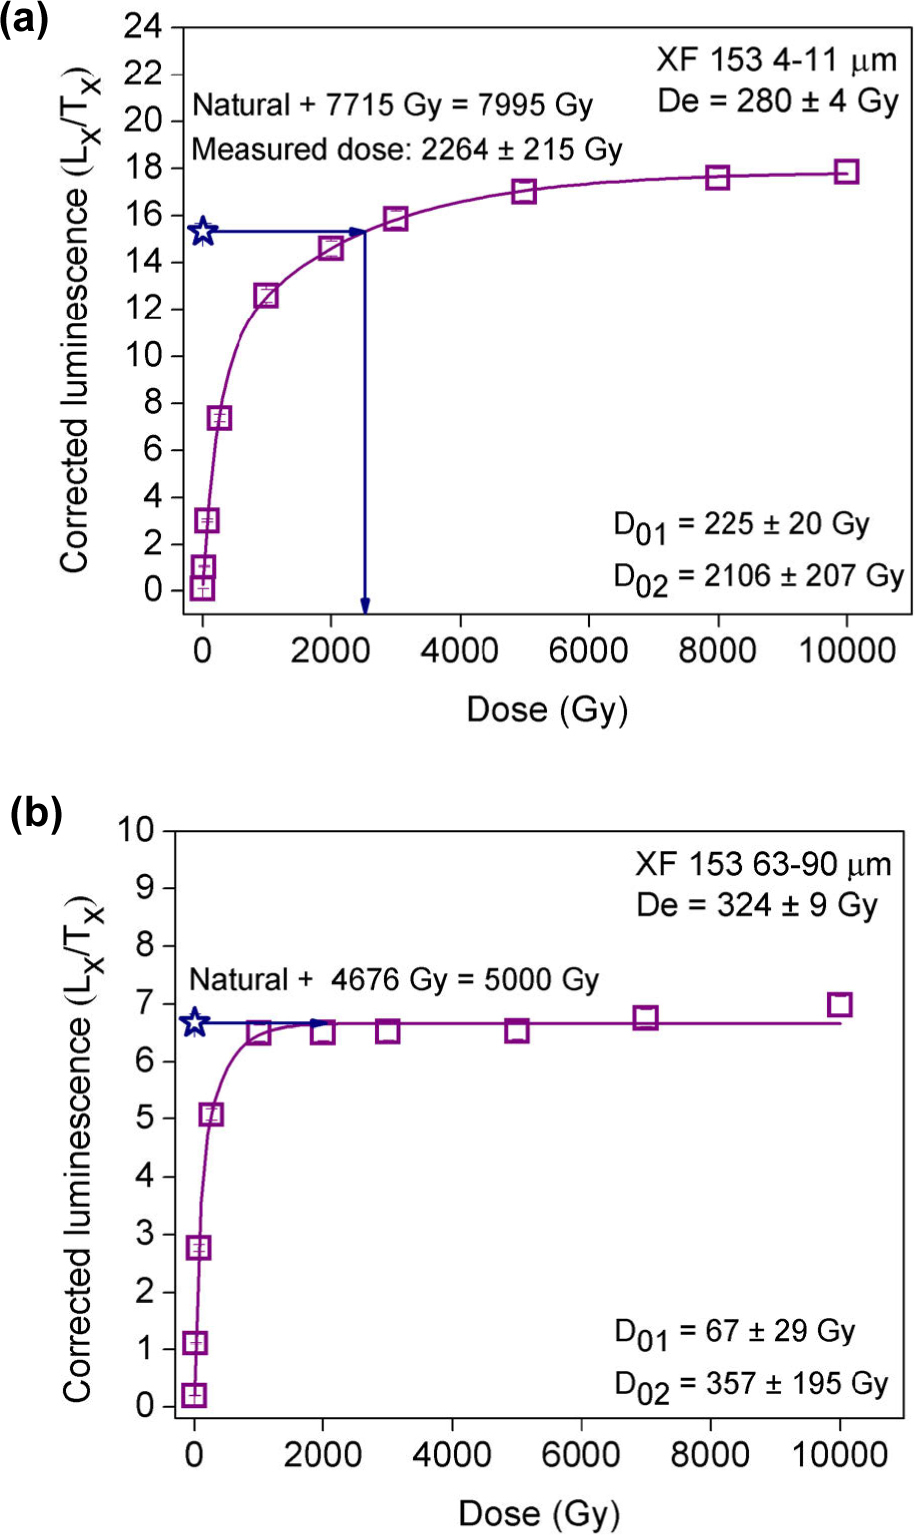
To test whether this dose dependent deviation of the SAR dose response curve from that obtained when doses are added to the natural is a more general effect, similar investigations were carried out on quartz from Xifeng loess-paleosol section in China (Timar-Gabor et al., 2017). We have given additional doses of ~8000 Gy to fine (4–11 μm) quartz from sample XF 153 (De = 280 ± 4 Gy; Timar-Gabor et al., 2017) and 5000 Gy to the coarse (63–90 μm) fraction from the same sample (De = 324 ± 9 Gy; Timar-Gabor et al., 2017). Laboratory dose response curves were then constructed using doses up to 10000 Gy and the sum of two saturating exponential functions was used to fit the data. Unlike signals from coarse quartz given high laboratory doses, signals from the fine material given added doses are below the saturation levels of the laboratory dose responses (Fig. 10a and 10b for fine and coarse quartz, respectively). As seen in this figure, the regenerated luminescence signal for coarse and fine quartz grains reaches 86% of the saturation level for doses of ~400 Gy and ~2000 Gy, respectively.
Fig. 10
SAR dose-response curves constructed for (a) fine and (b) coarse grains from sample XF 153 after adding 7715 Gy and 4676 Gy, respectively, in addition to the natural dose. These results were obtained using one aliquot for each quartz fraction. The sensitivity corrected signal corresponding to the sum of natural and added dose is interpolated on the constructed dose response curve.
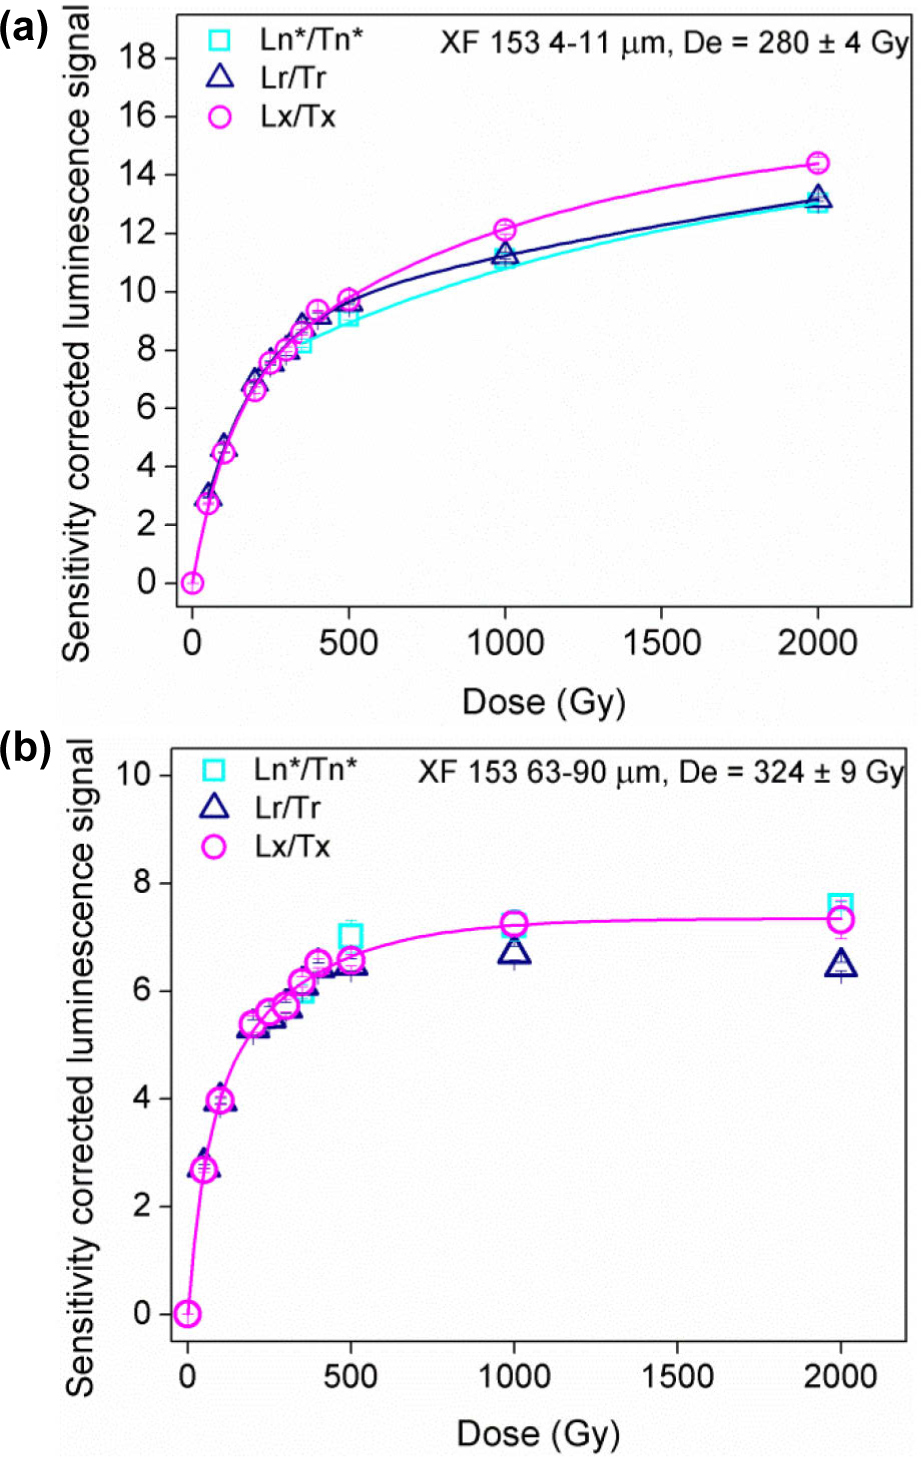
Measurements similar to those performed in Section 3 (Adding laboratory doses before measurement – Quartz from aeolianites) for quartz from aeolianites were also carried out for fine and coarse quartz from sample XF 153. A comparison between the Ln∗/Tn∗, Lr/Tr and Lx/Tx values is given in Fig. 11a and 11b for fine and coarse separates, respectively. As was also found for quartz extracted from aeolianites (Fig. 8), the Ln∗/Tn∗ values obtained for natural plus added doses on fine quartz from loess match the Lr/Tr values obtained when doses are given after removing the natural signal, but both data sets deviate from the Lx/Tx values induced by equal size regenerative doses. This deviation occurs at doses higher than 500 Gy and the degree of underestimation of Ln∗/Tn∗ and Lr/Tr values compared to the Lx/Tx values increases with the given irradiation dose. The data sets were fitted with the sum of two saturating exponential functions. Regarding the coarse material, no significant deviation occurs between the data sets; the Ln∗/Tn∗ and Lx/Tx data sets overlap each other, whereas for the Lr/Tr values a slight dose dependent underestimation was observed compared to the Lx/Tx values. The ratios of the data points, namely (Ln∗/Tn∗)/(Lx/Tx) and (Lr/Tr)/(Lx/Tx), are plotted as function of dose in Fig. 12 and are numerically represented in Tables S5 and S6, respectively. For both fine and coarse quartz, graphical and numerical information on the recovered doses when they are added to the natural dose as well as when they are given after light exposure is presented in the supplementary material (Text S3, Fig. S9, Fig. S10, Table S7 and Table S8).
Fig. 11
Average Ln∗/Tn∗ values plotted as a function of equivalent dose + laboratory dose, average Lr/Tr measured after one bleach as in dose recovery and average Lx/Tx values measured in a SAR sequence. (a) Data for 4–11 μm quartz from sample XF 153. (b) Same data for 63–90 μm quartz from sample XF 153. For both fine and coarse quartz, between two and four aliquots were used for measurements. The dose response curves were fitted using the sum of two saturating exponential functions.

Fig. 12
The ratios (Ln/Tn)/(Lx/Tx) and (Lr/Tr)/(Lx/Tx) as a function of dose obtained using the data in Fig. 11 and Tables S6 and S7. (a) Data for 4–11 μm quartz from sample XF 153. (b) Same data for coarse grains from sample XF 153.
. Discussion
Using the SAR protocol, the 4–11 μm and coarse (63–90, 90–125, 125–180, 180–250 μm) grains from the aeolianites gave ages which were in agreement, allowing average ages to be calculated as given in Fig. 2.
The dose response curves obtained for the 4–11 μm grains and the coarse grained quartz are best represented by the sum of two saturating exponential functions and are quite different (Fig. 4), as was also found for the quartz extracted from Romanian, Serbian and Chinese loess when doses between 1 kGy and 10 kGy were given in the SAR protocol (Timar-Gabor et al., 2017).
The normalised light levels (Ln∗/Tn∗) for a 63–90 μm aeolianite quartz sample (M#11#), obtained when doses are added to the natural dose overlap the Lx/Tx values measured in a typical SAR dose response curve (Fig. 8b). A similar result was obtained for 63–90 μm quartz from loess (XF 153) at Xifeng (Fig. 11b). Moreover, for aeo-lianite quartz, when doses are given after a double exposure to blue light, as in the standard dose recovery test (Murray and Wintle, 2003), the dose response (Lr/Tr) also matches the SAR curve (Lx/Tx), while for the loess quartz sample the Lr/Tr are slightly underestimated when compared to the Lx/Tx data set. This may suggest that the dose response curves for the coarse grains, even though constructed using two saturating exponential components, can be regarded as more reliable for De evaluation than for the fine grains.
Values of Ln∗/Tn∗ obtained for quartz from both aeo-lianite and loess when a dose is added to the natural dose for 4–11 μm grains result in a dose response curve that does not reach the same level of saturation as the SAR response curve Lx/Tx (see Fig. 8a and Fig. 11a). For the aeolianite quartz, this underestimation is less than 8% for doses up to ~600 Gy, but increases to 15% in a way which is dose dependent (Fig. 9a). When quartz from loess is used, the underestimation of the Ln∗/Tn∗ values relative to the Lx/Tx values increases from 4% for 350 Gy to 10% for 2000 Gy (Fig. 12a). A small underestimation in signal in the non-linear dose range would cause a large underestimation in the measured dose; the underestimation of the values of De (when a dose is added to the natural) for aeolianites is about 10%, even for added doses as low as 50 Gy (Fig. S7a), but it is much larger for doses of over 300 Gy where the two response curves Ln∗/Tn∗ and Lx/Tx show greater deviation (inset to Fig. 8a). For the loess samples, the underestimation of the values of De is about 10% for 350 Gy (70 Gy added to the natural dose), increasing to higher values as the two data sets Ln∗/Tn∗ and Lx/Tx show a greater deviation (Fig. S9a and Fig. 11a). This results in it being problematic to recover the correct value for total doses (natural plus added doses) of hundreds of Gy using the SAR protocol.
When samples are given a double exposure to blue light, the dose response Lr/Tr for 4–11 μm quartz grains from aeolianites and loess also deviates from the SAR curve given by Lx/Tx (see Fig. 8a and Fig. 11a). For doses up to ~1200 Gy the underestimation is less than 10%, but increases to 17% for 6000 Gy in the case of quartz from the aeolianite sample (Fig. 9a). Using quartz from loess, this underestimation does not exceed 10% even for doses as high as 2000 Gy, but the degree of underestimation increases with the given irradiation dose (Fig. 12a). Regarding the recovered doses for quartz from loess (this data is not available for the aeolianite sample), there is no significant underestimation up to 500 Gy, but highly underestimated values were obtained for larger doses where the Lr/Tr and Lx/Tx data sets deviate from each other (Table S8). Thus, for 4–11 μm grains, the results presented for the aeolianites and loess suggest that this grain size of quartz should not be used for age determination when the equivalent dose is higher than 300 Gy and 500 Gy, respectively.
Our approach of adding doses in addition to the natural dose is similar to the philosophy of the Australian slide method used for thermoluminescence (TL) dating (Prescott et al., 1993). It is interesting to note that a similar inability to overlay dose response curves was observed in TL studies using the blue emission of coarse quartz (e.g. 90–125, 180–250 μm) (Prescott et al., 1993). In the case of those emissions, an anomalous radiation response of quartz at radiation doses above 300 Gy has been reported (Huntley and Prescott, 2001) based on the observation of a mismatch between the natural plus added dose and the regenerated dose curves. Further experimental observation and study of the supralinear dose response of quartz blue TL for laboratory doses higher than 250 Gy (Chawla et al., 1998) led to the conclusion that this phenomenon is dose rate dependent, occurring at laboratory doses but not during natural irradiation. Despite agreement on this idea (Huntley and Prescott, 2001), the physical phenomenon behind this observation in TL remained unknown. The results shown in this paper (Figs. 8 and 11) indicate that the dose response curves constructed using Lr/Tr and Lx/Tx values deviate from each other for doses higher than 200 Gy; yet, both are built entirely through laboratory irradiation, which implies that the cause of the deviation reported here is not the dose rate. We have also shown that the bleaching prior to dosing is unlikely to cause the different shape of the Lr/Tr and Lx/Tx dose-response curves. Further investigations are needed in the high dose range in order to gain new insights into the cause of these observations.
. Conclusions
The data presented in this paper for a detailed examination of 4–11 μm and larger grain sizes of quartz from aeolianite samples on the Balearic island of Eivissa (southwestern Mediterranean) as well as from fine and coarse quartz from one sample of loess from Xifeng section in China have more general implications for OSL dating of sediments.
The results for the aeolianites from the western Mediterranean confirm that the discrepancies between dose response curves for these two grain sizes in Romanian, Serbian and Chinese loess are part of a widespread phenomenon. For doses up to about ~200 Gy, the laboratory dose response curves for the two grain sizes from the aeolianite are able to be superimposed. In addition, the ages obtained for doses up to 170 Gy using different grain sizes are in agreement. The concordance of the ages implies that the SAR protocol can be applied to either grain size back to about ~250 ka for the aeolianites in the current study. Both results provide support for the last interglacial ages previously obtained for aeolianites on Mallorca (Rose et al., 1999; Fornós et al., 2009).
The dose response curves for all grain sizes were best fitted by the sum of two saturating exponential functions when the doses given were large enough for the OSL to reach saturation (typically ~6 kGy). When doses are not high enough to reach saturation, the parameters for the functions are shown to be meaningless as they vary with the maximum dose.
Based on the dose dependent deviation of the SAR dose response curve from those obtained when doses are added to the natural as well as when they are added after removing the natural signal, 4–11 μm quartz grains should not be used for expected values of De in the high dose range; a clearly defined high dose range cannot be given based on this data, but determining doses of a few hundred Gy using fine quartz and the SAR protocol should be regarded with caution. This dose dependent deviation is much less pronounced for coarse grains and it seems reasonable to infer that the dose response curves for the coarse grains, although saturating earlier, can be regarded as more reliable for equivalent dose calculation than those for the fine grains.