
. Introduction
Anthropogenic radionuclides (137Cs and Pu isotopes) originating from nuclear-weapons testing have been widely applied for dating sediments accumulated since the second half of the 20th century. The 137Cs is the most popular radionuclide used as a chronostratigraphic marker. Basing on the assumption of its negligible post-depositional mobility three dates can be obtained for sediment profiles. The time horizons are associated with the first radiocaesium detection in the global fallout of 1954, the maximum fallout in 1963–64 and with the Chernobyl accident in 1986 (UNSCEAR, 2000). The
plutonium fallout history follows the pattern observed for 137Cs, and for this reason its isotopes, 239Pu and 240Pu, which comprise mostly of Pu activity associated with the nuclear weapons fallout, mark the same time horizons (Hancock et al., 2011). Despite the total activity of plutonium being lower by 1–2 orders of magnitude than 137Cs, it can be precisely determined using α-particle spectroscopy because of the reduced counting time as well as the absence of a background and improved statistical precision of measurements (Everett at al., 2008). These advantages make Pu peaks suitable for validating the 137Cs position in sediment profiles and in many circumstances they compensate the composed analytical procedure (Hancock et al., 2011; Tims et al., 2010). In the future, the application of plutonium isotopes as sediment chronomarkers with their much longer half-life than 137Cs
(24 110 years for 239Pu and 6 561 years for 240Pu) will potentially be of growing importance with the decrease of 137Cs detection.
In principle, sediment chronostratigraphy using heavy metals resembles dating with isotopes in the sense that it typically uses onset, maximum and emission cessation dates as markers of sediment horizons. Heavy metals can be used for sediment dating because the content of heavy metals in sediments accumulated during floods by a river is proportional to the degree of its pollution (Ciszewski, 2003). For this same reason, changes of heavy metals in vertical profiles of overbank or floodplain lake deposits mirror the variability of river pollution in the period of their deposition (Łokas et al., 2010a; Lintern et al., 2016). However, heavy metals originate from almost every kind of human activity, only the rapid changes in the discharge of metals to river systems can be utilized for dating time horizons (Hudson-Edwards et al., 1998). These changes are the most evident in areas of metal mining. In these areas, the distribution of particular elements in vertical profiles can be correlated to historical records of metal extraction and reworking (Ciszewski and Malik, 2004). Such a correlation is the most accurate in floodplain sections with a cm-scale accretion rate, which is constant over a longer time period (Ciszewski, 2003).
Under the assumption that there is a constant sediment supply rate over a period of isotope emission, more detailed chronologies can be constructed (Diaz-Assencio et al., 2014; Yao and Xue, 2016). These conditions, with sufficient rapid accumulation and constant sediment supply rates, commonly occur in water reservoirs like shelf seas, harbors or dam reservoirs (Frignani and Bellucci, 2004; Baeza et al., 2009), whereas the periodical nature of overbank sediment accumulation makes detailed dating of fluvial sediments much more difficult. Usually the sediment thickness left by consecutive floods is highly variable and deposition can be preceded by erosion of the previously accumulated sediment. The deposition rate is affected not only by the flood magnitude but also by the roughness of the floodplain surface, transported sediment load and flow velocity. Due to the extreme variability of the fluvial depositional environment, reconstruction of fluvial sediment deposition should be attempted using more than one dating method. The aim of the present investigations was to use the three dating methods: 239,240Pu, 137Cs and heavy metals to obtain a chronology of overbank sediments and deposits filling the subsidence depression in order to reconstruct pollution changes in a small valley of the Chechło River, which was polluted by a lead-zinc mine in southern Poland.
. Study site
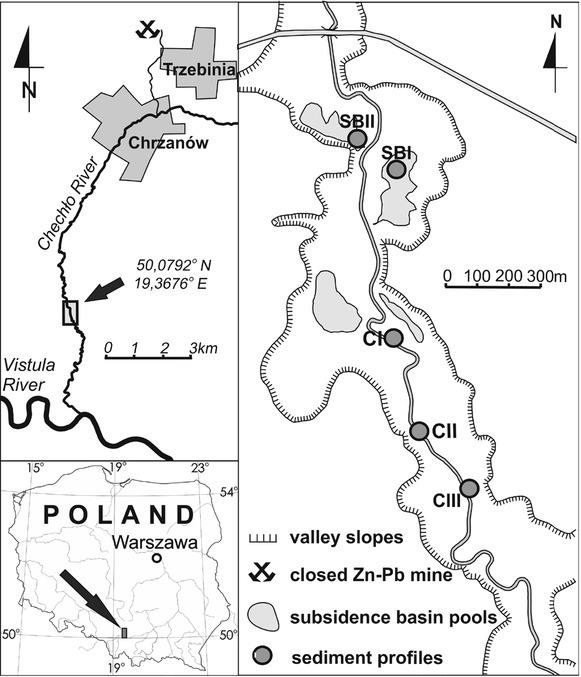
The Chechło River drains a limestone upland area of 110 km2 in southern Poland. The river is 23 km long and its average discharge in its lower course is equal to 1.5 m3·s–1. The river course can be divided into three well defined reaches. In the upper reach the river drains a Tertiary graben filled with fluvioglacial sands overgrown with a forest. The river channel crossing the forested area is weakly modified and the river waters are unpolluted. In the middle reach, the river flows across tectonically dislocated horst hills and receives the tributary formerly heavily polluted by the lead-zinc mine in Trzebinia. Alignment and incision of the channel in the middle river reach constricted the fluvial sediment deposition to the channel itself and the overbank accumulation of fine grained polluted deposits has not taken place as only the river valley widen in the lower river reach. The bottom of the valley in this reach increases up to 200–300 m and the channel gradient decreases. The meandering river reworks fluvioglacial sandy deposits. Coal extraction which takes place under the river bed resulted in the subsidence of the valley bottom over a ca. 500 m long river reach. The ground subsidence by about 1.5 m induced flooding of the whole depression. Presently, it is partially filled with sediments and overgrown with wetland plant communities. The open water surface takes up only about one third of the depression (Ciszewski, 2019).
Lead-zinc mining in Trzebinia started in 1968. The mine, which exploited karstified carboniferous rocks abundant in waters, discharged up to 0.5 m3·s–1 of waters containing sediments polluted mainly with zinc, lead and cadmium into the Chechło River, and the river sediments were characterized in the 1990s by their very high pollution level (Ciszewski, 1997). In 1990s the mine excavated the largest amount of metal ores reaching 2.3 mln tonnes. Since the beginning of the 21st century ore extraction has declined. The process of mine closure started in 2006, but the mine was not closed until 2010.
. Methods
In order to possibly obtain a complete reconstruction of the river pollution chronology, sediments were taken from the floodplain and from the permanently flooded subsidence depression. Fine grained bottom sediments were sampled in two profiles (SBI and SBII) situated in ponded depressions on both riversides, a dozen or so metres from the channel using a Eijkelkamp multisampler (Fig. 1). Profile, SBI, was sampled from a depth of about 70 cm below the water table, whereas the water table at profile, SBII, was only 20 cm above the top of the profile. Both retrieved sediment profiles were 60 cm long. Overbank sediments were sampled from three bank outcrops (CI-CIII) with a φ 80 mm stainless cylinder in distances growing downstream the subsidence basin. Two profiles, CII and CIII, were sampled to the average water table in the river at a depth of 1 m, about 500 m, and 250 m from the basin, respectively. The third profile, CI, at the lower perimeter of the subsided part of the valley, was sampled to a depth of about 60 cm.
Sediment profiles from the bottom sediments were sectioned in intervals increasing with depth from 3 to 6 cm, whereas the overbank sediments were sampled usually each 4–5 cm except the upper part of the profile CIII affected evidently by bioturbation and sampled each 10 cm. The sampled sediments were divided into two subsamples. One part of the sample was wet sieved through a 0.063 mm sieve and digested with HNO3 according to EPA 3051 (USEPA, 1994) and then the Zn and Pb concentrations were determined using atomic absorption spectrometry. A standard quality control procedure was applied, including blind duplicates and reference materials with an error less than 10%.
The other part of each sample was analysed using gamma (137Cs) and alpha (238Pu, 239+240Pu) spectrometry in laboratory of the Institute of Nuclear Physics PAS in Krakow. For 137Cs analyses, the samples were packed into 140 ml polypropylene cylindrical containers and were measured using high-resolution gamma spectrometry with a planar HPGe (high-purity germanium) detector (with a relative efficiency of 10%) with a composite foil window made of carbon fibre, which supports a capon foil covered with ultra-thin aluminium foil (homemade by the Institute of Nuclear Physics PAS Krakow workshop and electronics by Silena S.p.A.). The activities of 137Cs were determined via the 137 mBa emission peak at 662 keV. The spectrometer was calibrated using a Mix Gamma source CBSS-2 produced by Inspectorate for Ionizing Radiation, Prague (Czech Republic), in form of the same vessel. Spectra were collected for 12–72 h, depending on the activity of the samples. The reference year for all measured activities of 137Cs is 2017. The cross-section of the sampling cylinder varied between 0.0063 and 0.0028 m–2, and these values were used in the inventory calculations. Radionuclide inventories in the sediment layers were calculated (Bq·m–2) by summing the products of the radionuclides’ activity concentrations (Bq·kg–1) and appropriate surface dry masses (kg·m–2). The total inventories in the sediment profiles were calculated by summing the inventory of all the layers for which activity concentrations were above MDC.
The contents of 238Pu, 239+240Pu, as well as the silt content and losses on ignition (LOI) at 550°C were also analyzed in the subsamples. The activities of 238Pu and 239+240Pu were determined in about 5 g of the dried samples. The radiochemical procedure was started with a complete wet digestion using concentrated HF, HNO3, HCl with the addition of a small amount of H3BO3. Finally, the sample solution was prepared in 1 M HNO3. The plutonium was separated by anion exchange in 8 M HNO3 after adjustment of the oxidation state to Pu (IV) (LaRosa et al., 1992) using hydrazine and after a decomposition of hydrazine with an additional concentrated nitric acid using NaNO2 and 4M HNO3. The final solution was set to 8M HNO3. Separation of plutonium from the 8M HNO3 solution was carried out using Dowex-1x8 anion exchange resin. The plutonium was removed from the anion-exchange column with a 0.1 M HF – 0.1 M HCl solution, after eluting thorium with 10 M HCl (Mróz et al., 2017; Łokas et al., 2013; Mietelski et al., 2008b). The plutonium alpha sources were prepared with the NdF3 microcoprecipitation method (Sill, 1987; Rao and Cooper, 1995). The chemical recoveries were determined using 242Pu as the yield tracers. Details of the sequential radiochemical procedure used for the determination of the 238Pu and 239+240Pu activities have been described in previous publications (Łokas et al., 2010b, 2013). Measurements of the 238Pu and 239+240Pu activities were carried out using the Silena AlphaQuattro alpha spectrometer with Canberra PIPS (passivated implanted planar silicon) detectors and with an Alpha Duo spectrometer with Ortec detectors (each of 450mm2 area). Typical measurements time were approximately 300,000 to 600,000s.
Data quality was evaluated with the preparation and analysis of IAEA Reference Materials for radionuclides in soils (IAEA-385 and IAEA-444) as well as blanks using the same analytical procedures. The measured activity of 239+240Pu (2.70 ± 0.23 Bq/kg) was within the certified value (2.89–3.00 Bq/kg); the activity of 238Pu (0.41 ± 0.06 Bq/kg) was at the lower limit of the certified value (0.42–0.48 Bq/kg). The activity of 137Cs in IAEA-444 was 67.5 ± 6.6 Bq/kg, at the lower limit of the certified range (67–70 Bq/kg). The reference year for all measured activities was 2017. Uncertainties lower than one sigma counting statistics are presented only. The laboratory of the Institute of Nuclear Physics PAS in Krakow has Polish state accreditation (ISO 17025) for gamma spectrometric measurements and Pu analyses.
. Results
Stratigraphy of the collected sediments differs markedly between the two cores of the bottom reservoir sediments (SBI and SBII) and three overbank sediment profiles (CI, CII and CIII). The cores retrieved from the bottom sediments are characterized by their higher content of fine grained, silty particles <0.063 mm (Fig. 2). These sediments also contain a high proportion of organic material (expressed as losses on ignition) which declines upward with an increased proportion of fine sand. This change manifests in appearance of mm-thick lamination in a dark-coloured matrix in the profiles top. The dark muds rest on a brighter basal, medium-grained sands with a low content of organics. The contrast between the basal and the upper sediment strata at a depth of about 0.5 m is striking in both bottom sediment profiles.
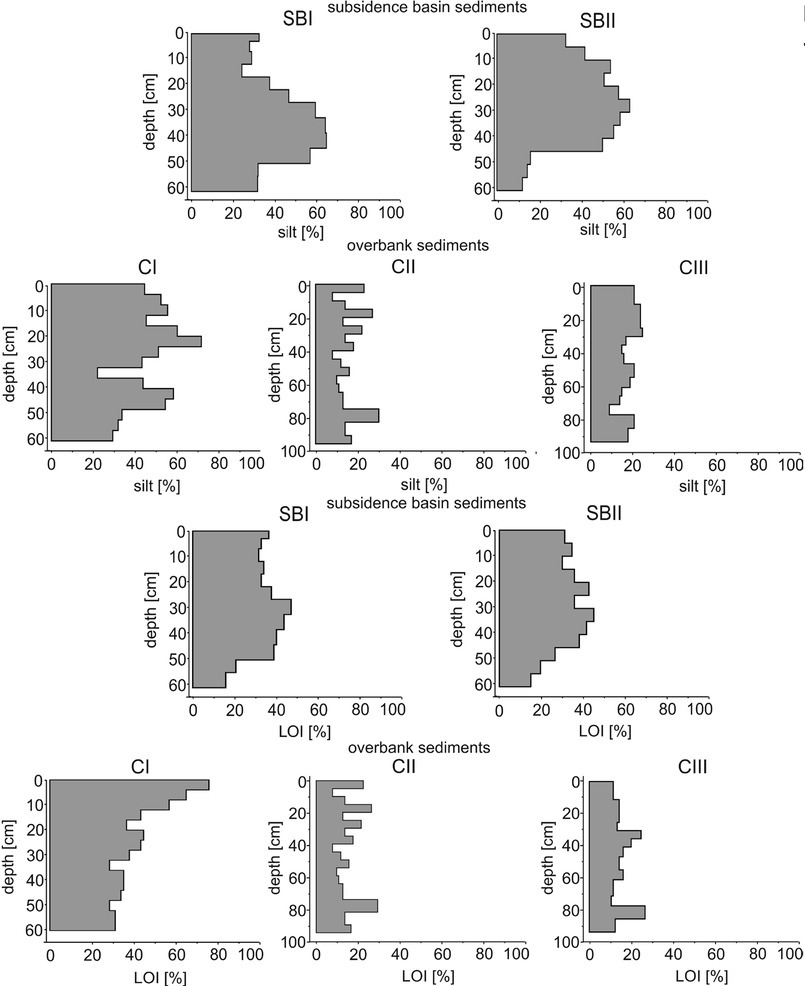
The overbank sediment profiles, CIII and CII, outcropped in the river banks are sandier than in reservoirs. The difference of their stratification from the reservoir deposits manifests in the presence of thicker and lighter sandy strata intercalated with dark organic silts a few cm thick. The top part of these profiles, particularly of CIII, comprise loose, finely laminated sands overgrown with a turf grass, whereas their bottom is compacted with blurred stratification. The sediments in the profile, CI, exhibit a higher proportion of silts in comparison to the profiles, CII and CIII (Fig. 2). These sediments are also not as homogenous as in reservoirs, but the intercalations of cm-thick sands developed towards the base and the basal dozen cm are composed mainly of brown-coloured sands.
The plutonium and caesium activity as well as the zinc and lead concentrations in the investigated sediments are given in Fig. 3. In each of the profiles there is at least one distinct peak of caesium; however, the maximum values differ by one order of magnitude. The highest value reaching almost 840 ± 51 Bq·kg–1 was found in the basal part of the subsidence reservoir profile, SBI, at a depth of 56 cm, while the lowest peak at 35 ± 2 Bq·kg–1 was found in the top part of the overbank profile, CIII, at a depth of 25 cm. The same regularity is also observed in the investigated 239+240Pu activity with a maximum of 3.50 ± 0.40 Bq·kg–1 at a depth of 50 cm in the SBI profile of the reservoir sediments and a minimum of 0.52 ± 0.04 Bq·kg–1 at a depth of about 36 cm in the overbank profile, CIII. In most of the profiles, the 238Pu activity is below the minimum detection concentration (MDC) or very close to this value. In the profile, SBI, at a depth of 56 cm the activity of 238Pu is 0.10 ± 0.03 Bq·kg–1, and the activity ratio of 238Pu/239+240Pu for this sample is 0.028 ± 0.009. It is very close to the expected value for the global fallout, which is about 0.030 (UNSCEAR, 2000). But in the profile, CII, the activity of 238Pu is 0.02 ± 0.01 Bq·kg–1 at a depth of 20 cm, and the activity ratio of 238Pu/239+240Pu is 0.34 ± 0.08. Table 1 presents radionuclides inventories for all the profiles. The inventories vary between 5700 ± 630 and 10130 ± 930 Bq·m–2 for 137Cs, and between 59 ± 7 and 247 ± 22 Bq·m–2 for 239+240Pu. The highest inventory for caesium is observed in the profile, SBI, whereas the maximum 239+240Pu inventory is observed in the profile, CII.
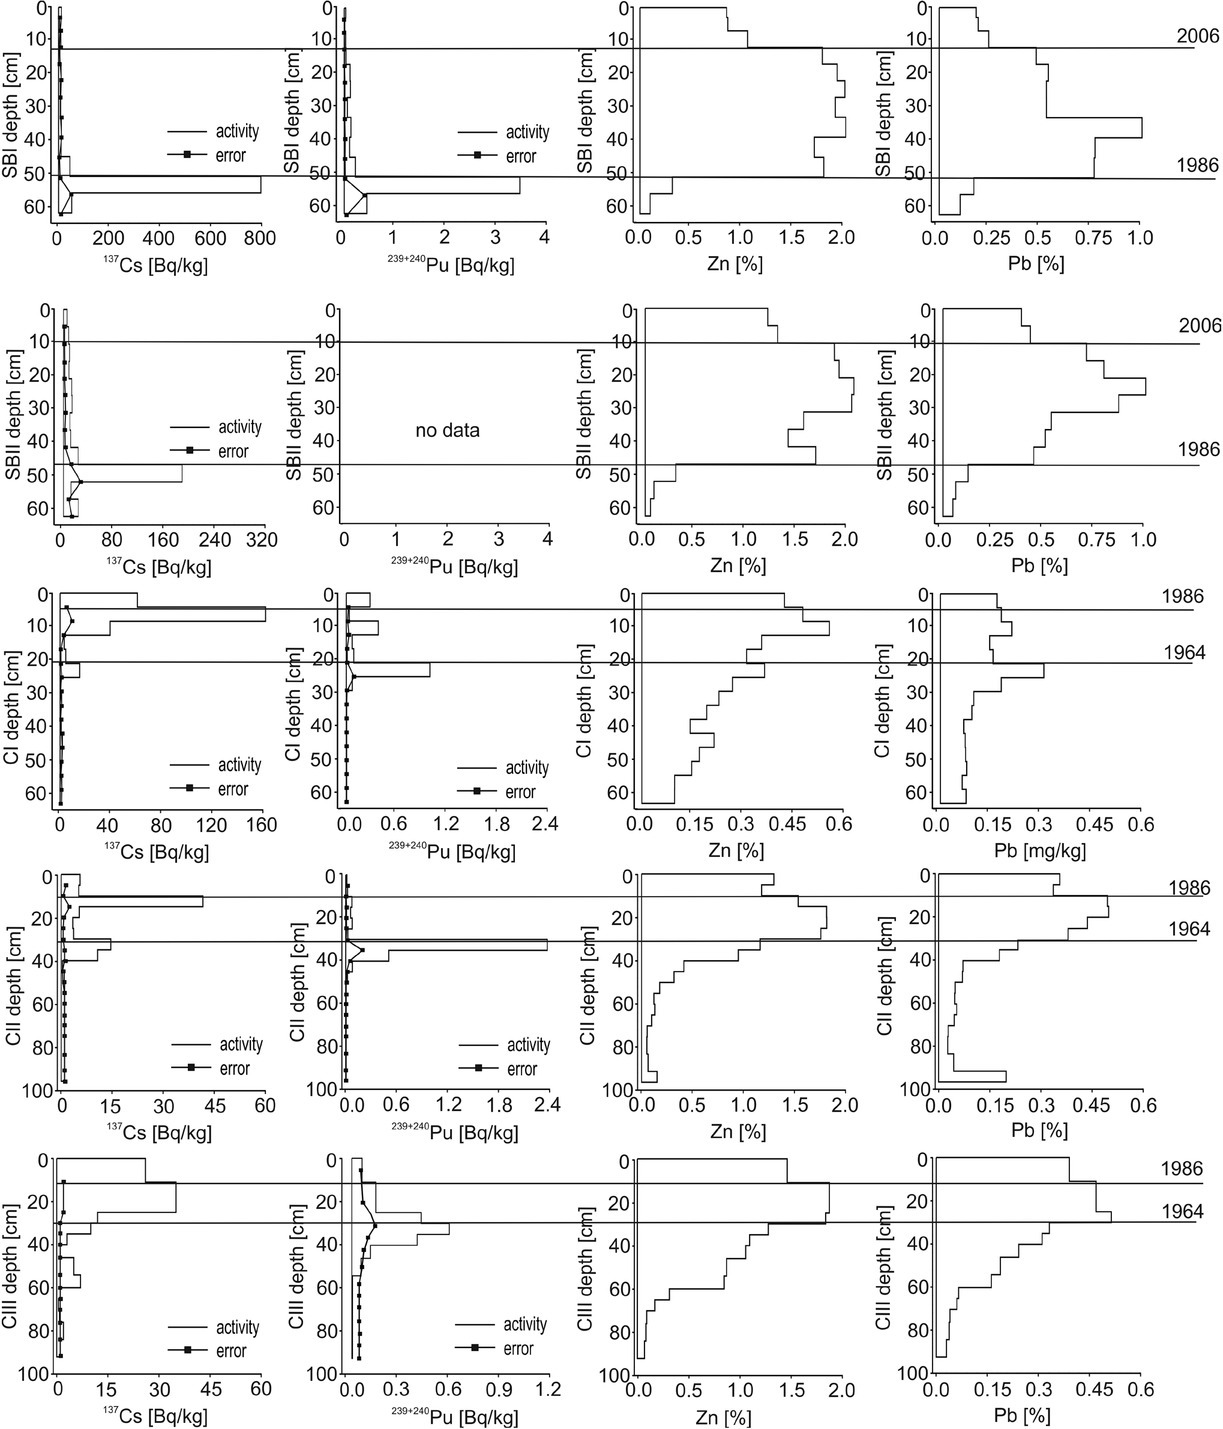
Table 1
Average inventories (Bq·m–2) for overbank sediments and reservoir sediments profiles.
| Profiles | 137Cs inventory (Bq·m–2) | 239+240Pu inventory (Bq·m–2) |
|---|---|---|
| CI | 5480 ± 580 | 62 ± 6 |
| CII | 5700 ± 630 | 247 ± 22 |
| CIII | 7690 ± 730 | 71 ± 6 |
| SBI | 10130 ± 930 | 59 ± 7 |
| SBII | 5780 ± 1000 | nm |
The investigated heavy metals display an extremely variable distribution pattern in all the sediment profiles (Fig. 3). Within every profile, lead concentrations differ by one order of magnitude, whereas zinc concentrations in most of the profiles differ even by two orders of magnitude. The largest peaks of both metals were found in the ponded basin, where zinc content reaches ca. 2% and lead content even exceeds 1% (of mass). The lowest pollution with these metals characterizes sediments of the profile, CI, situated just outside the subsidence basin, where the maximum zinc and lead content is equal to 0.5% and 0.3%, respectively. The other two overbank sediment profiles are characterized with intermediate pollution. Concentrations of both metals exceed local geochemical background from several tens to several hundred times (Ciszewski, 1998) indicating strong river sediment pollution, particularly during the peak of mining.
. Discussion
Chronostratigraphy of subsidence basin sediments
The very high peaks of caesium and plutonium at the bottom of the profiles from reservoirs seem to be the most characteristic features of these sediments. Moreover, the position of these peaks agree with the rapid change in sediment stratigraphy suggesting their in situ occurrence. These peaks are associated with the valley floor, which subsided at the beginning of the 1990s. The process of land subsidence, which resulted from underground coal mining caused the ponding of water flowing in the river, a widespread process in mined areas (Zeng et al., 2017). In the investigated reach of the Chechło River valley, the bottom of the subsidence basin formed ultimately until the end of the 1990s, and the same age of the basal sediment strata is suggested by the high content of caesium and plutonium on the former floodplain surface. It results from a direct fallout of radioactive elements from the atmosphere and from an accumulation of these elements redistributed by surface runoff from the catchment during floods.
There are two main sources for these radionuclides in this region: the global radioactive atmospheric fallout and the Chernobyl accident. The mechanisms of release of Cs and Pu from Chernobyl are different. 137Cs was released as a vapor and widespread all over the world, but Pu is not volatile and was only dispersed in the form of fuel particles. Previous works on plutonium in Poland (Mietelski and Wąs, 1995; Brudecki et al., 2009; Matisoff et al., 2011) revealed the presence of Chernobyl Pu in NE Poland. Pu can also be found in small amounts in the southern part of Poland (Mietelski et al., 2008a). Non-volatile elements like Pu can be transported on larger aerosols, “hot particles” (Cuddlhy et al., 1989; Devell et al., 1986). Because we can expect only small amounts of Chernobyl Pu in the investigated profiles of the Chechło catchment, the parallel occurrence of relatively high peaks of caesium and plutonium in the same strata of the reservoir sediments (SBI) seems to be a little surprising. It may be explained by the slow rate of overbank sediment accretion and an accumulation of radionuclides. Initially, the slow rate of the sediment accretion at both sampling points had been increasing over time as the channel became plugged with sediments and shallower favoring flooding already at lower discharges. Such regularity is suggested by an increased upward proportion of sands in both reservoir profiles. At the beginning of the pond formation and on the former channel floodplain, sediment accretion was slow, albeit persistent.
The peak of radiocaesium in the SBI profile is higher than on the floodplains of other European rivers and much higher than in lakes and estuaries of the southern hemisphere (Hancock et al., 2011; Sanders et al., 2017), whereas the peak of plutonium activity can be comparable to some extreme values from the Rhone River valley, which is affected by pollution from the Marcoule spent-fuel reprocessing plant (Provansal et al., 2010). The very high value of radioisotopes can easily be explained by the topography of the sampling site, which is located outside the levee zone, in the centre of the undrained depression. Conditions favoring flood water stagnation at profile SBI are confirmed by the very high total inventory of 137Cs (10 130 Bq·m–2). This value is much higher than the value characteristic for global fallout (about 2000 Bq·m–2) after more than 50 years (UNSCEAR, 2000). The average deposition of the global fallout of 239+240Pu for the territory in Poland is 58 Bq·m–2 (UNSCEAR, 2000) and this value is comparable to the 239+240Pu total inventory for the SBI profile (59 ± 7 Bq·m–2). The activity ratio of 238Pu/239+240Pu can be used to identify global and regional sources of these radionuclides. For the global fallout the 238Pu/239+240Pu activity ratio for Poland is approximately 0.030 (UNSCEAR, 2000), but for the Chernobyl fallout it is ~ 0.50 (Mietelski and Wąs, 1995). The activity ratio of 238Pu/239+240Pu for this layer indicates that the global fallout component is observed (0.028 ± 0.009).
The estimated weapons caesium deposition for Poland is 982 Bq·m–2, but the mean total (including Chernobyl) value for the 137Cs inventory for Poland is 3770 Bq·m–2 (Stach, 1996) and this is a lower value than in the Upper Odra valley (SW Poland), which is equal to 5230 Bq·m–2 (Poręba and Bluszcz, 2007). The mean inventory value for the other regions of southern Poland, e.g. Opole and Katowice, is equal to 11240 Bq·m–2 and 6800 Bq·m–2, respectively (Stach, 1996), but the contribution of 137Cs from the Chernobyl fallout is about 80% of the total 137Cs fallout. This suggests that in the profiles from the subsidence basin Chernobyl Cs is also prevalent and dates the horizon of the former floodplain surface.
In Fig. 3 the rapid rise of zinc and lead content in the profiles from reservoirs is concordant with the beginning of stagnant sedimentary conditions and has been marked as the horizon 1986. The observed change in metal concentrations results from the accumulation of highly polluted deposits during the peak of mining in the 2nd half of the 1990s. The peak of mining followed by a slow decrease in metal extraction at the break of the 20th century is best mirrored in the profile, SBII, which is situated close to the river channel in a part of the basin connected with the river via a secondary channel. The change is not observed in the profile, SBI, from the centre of the depression probably because part of the deposits transported by flood waters is trapped by a zone of dense macrophytes overgrowing the shoreline of the depression. The simultaneous drop of lead and zinc concentrations in both profiles at a depth of 10–12 cm may be associated with the beginning of the mine closure in 2006 when the drop of metal extraction was accompanied with a rapid decrease of mine waters discharged to the river. Even though the mine was eventually closed down in 2010, we may expect that this drop of channel pollution could have appeared as early as 2006 and the data indicated in Fig. 3 terminates its earliest possible supervention, so the age of the sediments should be interpreted as “the older than” but not of the exact dates indicated for particular horizons. In effect, the declining rate of river sediment pollution is related mainly to the flood frequency and magnitude and the largest floods are the most efficient in inchannel sediment mixing and downstream transport (Ciszewski, 2001). In the case of the Chechło River, the rapid drop of zinc and lead concentrations, even by one order of magnitude, was evidenced in channel sediments less than 10 years after the mine closed down leading also to a drop in their content in sediments filling the offchannel reservoirs formed soon after the beginning of the mine closure process (Ciszewski, 2019). The drop of metals in the sediments in response to the closure of the mine is always followed by a longer period of slower decline in sediment pollution because the metals are commonly associated not only with the channel sediments but also because the overbank sediments constitute an important secondary pollution source (Žák et al., 2009; Foulds et al., 2013). In river systems with long active mining, metals dispersed in catchment soils are slowly eroded by surface runoff maintaining a raised metal pollution in alluvia even for more than one hundred years (Pirrie et al., 1997). This is also the case for the Chechło catchment, in which persistent pollution is predicted with the metals content well above the natural background, for many years to come (Ciszewski, 2019). For this reason, in the top of the overbank profiles a remarkable drop of zinc and lead concentrations is not present (Fig. 3).
Chronostratigraphy of overbank sediments
The relatively poor resolution of the obtained top sediment strata of the overbank sediments results from a low rate of sediment accretion, loose character of fine sands and their possible translocation within the root zone. For this reason, changes in the content of both metals in the surface sediment samples that were observed in all overbank profiles were not suitable for delimitation of postmining horizon, and the reconstruction of the environmental history was based mainly on caesium and plutonium radioisotopes in overbank sediments.
Basing on two caesium peaks in all the overbank profiles, we used the upper one as a marker of the year 1986. The majority of 137Cs in these profiles was found in the upper 15–40 cm of strata. In the CIII and CII profiles the subsurface maximum activity of 137Cs produced by the Chernobyl accident occurs at depths of 10–12 cm, whereas the subsurface maximum activity of 239+240Pu generated from the bomb testing fallout in 1964 is at depths of 30 cm and 35 cm in profiles CIII and CII, respectively. In all of these profiles the activity of 239+240Pu was higher than in other river sediments of southern Poland (Komosa, 1999). The total inventory of 239+240Pu for profiles CI, CIII are very close to the expected value for the global fallout, but for profile, CII, it is much higher (247 Bq/m2). The maximum value of 239+240Pu in profile, CII, is at a depth of 35 cm and this maximum is related to the global fallout deposition. The lower peak of 239+240Pu is found at a depth of 20 cm and the activity ratio of 238Pu/239+240Pu is 0.34 ± 0.08 and it might be related to the Chernobyl Pu origin (most likely in the form of hot particles), but this activity is several times lower than for the global fallout. Similar results were observed in the Tatra Mountains, where excess 238Pu activity was found in soil samples (Mietelski et al., 2008a). The radioisotope peaks indicate that the horizon at a depth of 10–12 cm in profiles, CII and CIII, can be assigned to a date after 1986. Dating of this horizon in all overbank profiles is based mainly on the position of upper cesium peaks and is not confirmed by a significant increase in activity of plutonium isotopes. The data of the horizon 1964 is obtained from both the 137Cs and 239+240Pu peaks and agree well with the distinct rise of zinc and lead content just above this depth in the profile, CII, and could be associated with the construction of the mine in the second half of the 1960s. Even though the construction of the mine was finished in 1968, mine waters were discharged as early as a few years earlier and the data of this level indicates high river pollution with these metals since the very beginning of the mine’s operation. This is the first information regarding metal pollution on this ungauged and never monitored river. The very high river pollution during the whole period of the mine’s operation seems to be confirmed also by similar peaks of zinc and lead in the profile, CIII. In both profiles, the thickness of the sediment strata associated with the mine’s operation is equal to about 20 cm. Considering that the mine was operational for 40 years we can roughly estimate the average rate of annual sediment accretion during that period in CII and CIII to be 0.5 cm.
The profile, CI, differs markedly from the other overbank profiles in respect to sediment stratigraphy and also to a much lower content of metals. The peaks of zinc and lead are even three times lower, and levels with a drop or sharp increase are not noticeable in their distribution pattern. Two peaks of caesium at 4–8 cm and 20–24 cm and one peak of plutonium at the same depth of 20–24 cm are the only time markers. The couple of lower peaks helped determine a time horizon of 1964 as the earliest possible deposition time of the mining era sediments, whereas the distinct upper peak of caesium dated horizon of 1986. The thickness of these sediments constrained by the two dates, although comparable to the other overbank profiles, is a little bit smaller and is equal to 15 cm. These differences are related to the location of this profile at a lower floodplain level. Moreover, during the peak of mining this profile was situated not at the river bank but several metres farther as the channel shifted over the 2nd half of the 20th century. The distance from the channel is known to be a factor controlling the sediment accretion rate (Łokas et al., 2010a) and could explain the determined lower sediment thickness.
The high accretion rate of reservoir sediments, exceeding on average 2–3 times the accretion of mining era overbank sediments, was beneficial for accurately dating the recent 30 year-long period of sedimentation. In turn, the relatively slow and periodical nature of overbank flood deposition with a significant multi-annual delay resulted in sedimentation gaps and difficulties in building environmental reconstruction based on the overbank sediments. Nevertheless, by considering several profiles from different topographic situations, we eliminated some uncertainties due to a lack of some peaks of radioisotopes or blurred original zinc and lead concentration horizons. A similar thickness of the mining-era sediments, in particular fluvial sub-environments, confirmed the correctness of dating and the reconstructed most recent pollution history did not suffer from a poorer sample resolution in the top of the overbank profiles.
The accuracy of the obtained fluvial sediment dating could also be affected to some extent by post-depositional mobilization. Generally, plutonium and caesium are considered to be good time markers because they strongly bind to mineral or organic particles and remain immobile over a significant time period (Tims et al., 2010; Everett et al., 2008). Heavy metals like zinc and lead can be more easily remobilized particularly under frequent changes of the water table as well as between oxic and anoxic conditions and migrate downward in overbank profiles (Rinklebe and Du Laing, 2011; Ciszewski et al., 2008). In most of the presented profiles distinct radioisotope peaks correspond reasonably with the peaks of metals; however, the long tails of metals below the peaks in the CIII and CII profiles and the blurred peaks in CI exhibit the important role of post-depositional metal migration processes in overbank sediments. Such processes are negligible in reservoir sediments with stable anoxic conditions hampering organic matter degradation, which is able to affect the fate and transport of radionuclides and heavy metals (Sanders et al., 2017; Kalbitz and Wenrich, 1998).
. Conclusions
Dating of overbank and reservoir sediments helped to reconstruct the history of pollution in the Chechło River by the lead and zinc mine. However, the obtained dates give the earliest possible age of particular horizons with the actual sediment deposition delayed by several to a dozen years. The dating indicates a very high river pollution with zinc and lead over the entire period of the mine’s operation with a rise possibly to occur simultaneously with the maximum ore extraction in the second half of the 1990s.
Gaps in overbank sedimentary sequences preclude extending of the sedimentation rate 0.5 cm/year obtained for the mining period on longer sections of these profiles. Instead we may compare this sedimentation rate with that observed in both subsidence reservoirs in a similar period of time, which is about 2–3 times higher.
The results indicate a lower accuracy and higher uncertainty of the overbank than reservoir sediment dating.
The application of plutonium isotopes provided very important information validating caesium peaks or, as in one profile, providing the only reliable information regarding horizon dating. This example has shown that plutonium radioisotopes can be a useful tool for dating particularly the youngest overbank sediments where numerous sedimentation gaps cause uncertainties in the application of other methods, e.g. radiocaesium.