
. Introduction
Volcanological studies require dating of volcanic ejecta to within several tens of kiloyears (ka). However, such dating presents difficulties because of adequate methods are few and sampling problems are inherent. Radiocarbon (14C) dating is applicable for ages from several hundred years to a few tens of thousands of years. Nevertheless, the possible occurrence of contaminants such as mold, mildew, and fungus on samples complicates the interpretation of dating results. Moreover, during 14C dating, one frequently encounters difficulties in collecting datable organic material in volcanic contexts. Although thermoluminescence (TL) and optically stimulated luminescence (OSL) dating have been used widely for archaeological studies, this method entails difficulties because it requires quartz for accurate dating (e.g., Tsukamoto et al., 2011). Applying both TL and OSL dating is possible even for basic lava. Actually, TL dating using quartz xenoliths in scoria (Rufer et al., 2012) and quartz xenocrysts in basaltic lava (Shitaoka et al., 2014) were performed. There is, however, no quartz in Kannabe scoria, as described below.
Paleomagnetic dating represents an alternative. Volcanic materials deriving from eruption can acquire stable thermoremanent magnetization (TRM) during their initial cooling. The Earth’s magnetic field changes its direction by several degrees to a few tens of degrees over timescales of 100–1,000 years, which represents secular variation. Paleosecular variation (PSV) can thereby be reconstructed, as described in numerous earlier reports of the literature (e.g., Jackson and Finlay, 2007). Comparison of the PSV with the paleomagnetic direction inferred from TRM of volcanic materials can suggest the age at which magnetic minerals in the materials acquired the remanence. Paleomagnetic age determination can be done directly from the material for which the age is sought.
One shortcoming inherent in the method, however, has often troubled us and other researchers: PSV varies at most by a few tens of degrees around a direction that is generally derived from the axial dipole component of the Earth’s magnetic field. Even if the paleomagnetic direction could be determined with high accuracy, the paleomagnetic age could not be identified uniquely because several candidates for age can be inferred from paleomagnetic data. Ascertaining the correct age using paleomagnetic methods alone is difficult. Age estimation based on PSV must be combined with other dating techniques.
An almost perfect target as an attempt for a combined age estimation is Kannabe volcano (Fig. 1), located 120 km west of Lake Biwa. In fact, PSV data for the last 40 ka have been reported from the Lake Biwa sediment (Hayashida et al., 2007). Although the latest eruption age of Kannabe volcano has been estimated using K-Ar dating and loess stratigraphy (Furuyama et al., 1993), the age-determination precision can be improved.
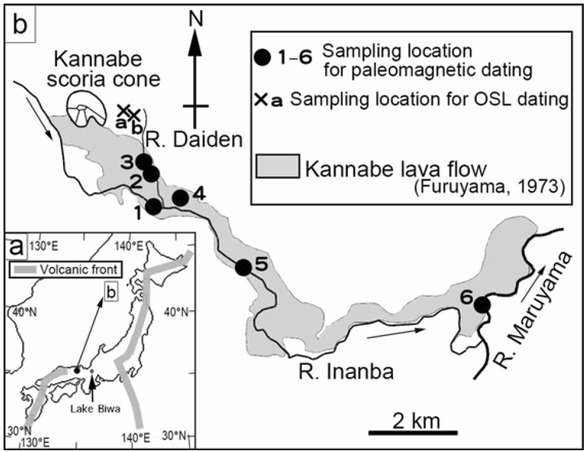
Fig. 1
Index (a) and locality (b) maps. Sampling locations of Kannabe scoria cone in southwestern Japan for paleomagnetic samples (locs. 1–6) and OSL dating (loc. a). Outcrop of loc. b is shown as AT tephra under Kannabe scoria (see Fig. 2).
We attempted paleomagnetic dating to estimate the Kannabe volcano eruption age. Furthermore, we applied OSL dating to sediments associated with the Kannabe scoria cone.
. Geological setting
Kannabe volcano in southwestern Japan (N 35°30’20.1”, E 134°40’29.0”), the youngest volcano in Kannabe monogenetic volcano group (Fig. 1), has been the locus of alkali basalt volcanism since ca. 12 Ma after the opening of Japan Sea (e.g., Kimura et al., 2005). Although the Philippine Sea plate subducts northwestward beneath the southwestern Japan arc, no seismic slab of the subducting plate is observed beneath this volcano. Tomographic evidence indicates that a low-velocity mantle zone exists beneath it at depths of ca. 60–200 km, which is interpreted as upwelling asthenosphere and as a primary source region for magmatism (Nakajima and Hasegawa, 2007).
The Kannabe monogenetic volcano group comprises seven scoria cones (Nishiki, Yamanomiya, Buri, Otsukue, Tada, Kiyotaki, and Kannabe volcanoes) and one scoria bed (Nishibashi-kita) (Kawamoto, 1990; Furuyama et al., 1993). Basement rocks of these volcanoes are Miocene sediments and rhyolitic–dacitic tuff (Wadatsumi and Matsumoto, 1958). The volcanic activity of Kannabe volcano is characterized by the eruption of a lava flow (Kannabe lava flow) after scoria cone formation (Kannabe scoria cone; see Fig. 1). Furuyama (1973) reported Kannabe lava as divided into four lava flow units based on geomorphologicalogical features: Hidaka, Arakawa, Jyugo, and Shiwagano. We designate lava of the Kannabe volcano as “Kannabe lava”, as Kawamoto (1990) did in earlier work. Furuyama (1973) and Kawamoto (1990) described Kannabe lava as directly overlying Kannabe scoria.
These volcanoes erupted alkali olivine basalts with phenocrysts of olivine and plagioclase (e.g., Kawamoto, 1990; Furuyama et al., 1993). Kawamoto (1990) showed that volcanic ejecta from the Kannabe monogenetic volcano group, except for Kannabe volcano, are covered by an Aira-Tn ash bed (AT, 30.009 ± 0.189 ka; Smith et al., 2013, ca. 30 ka). The following reported K-Ar ages of these volcanoes are consistent with the stratigraphic relation: Nishiki volcano, 0.685–0.741 Ma; Otsukue volcano, 0.218 ± 0.008 Ma; Buri volcano, 0.173 ± 0.009 Ma; Tada volcano, 0.103 ± 0.004 Ma; and Kiyotaki volcano, 0.055 ± 0.007 Ma; Furuyama et al., 1993). Although Furuyama et al. (1993) reported the K-Ar ages of the rock samples from Kannabe lava as 0.022 ± 0.015 Ma, 0.026 ± 0.009 Ma, 0.072 ± 0.012 Ma, 0.086 ± 0.014 Ma, two of them are considerably older than the AT tephra (ca. 30 ka), which underlies Kannabe Scoria (0.072 and 0.086 Ma). This inconsistency is probably attributable to excess 40Ar (Furuyama et al., 1993). It is noteworthy that these young K-Ar ages were measured from whole-rock samples of the lava using the isotope dilution method, which is thought to be less reliable than recent K-Ar dating of groundmass samples using the unspiked method. Kawamoto (1990) inferred that volcanic ejecta from Kannabe volcano are sandwiched between AT (ca. 30 ka) and Kikai-Akahoya ash (K-Ah, 7,165–7,303 cal. ka BP; Smith et al., 2013, ca. 7.2–7.3 ka) beds (Fig. 2).
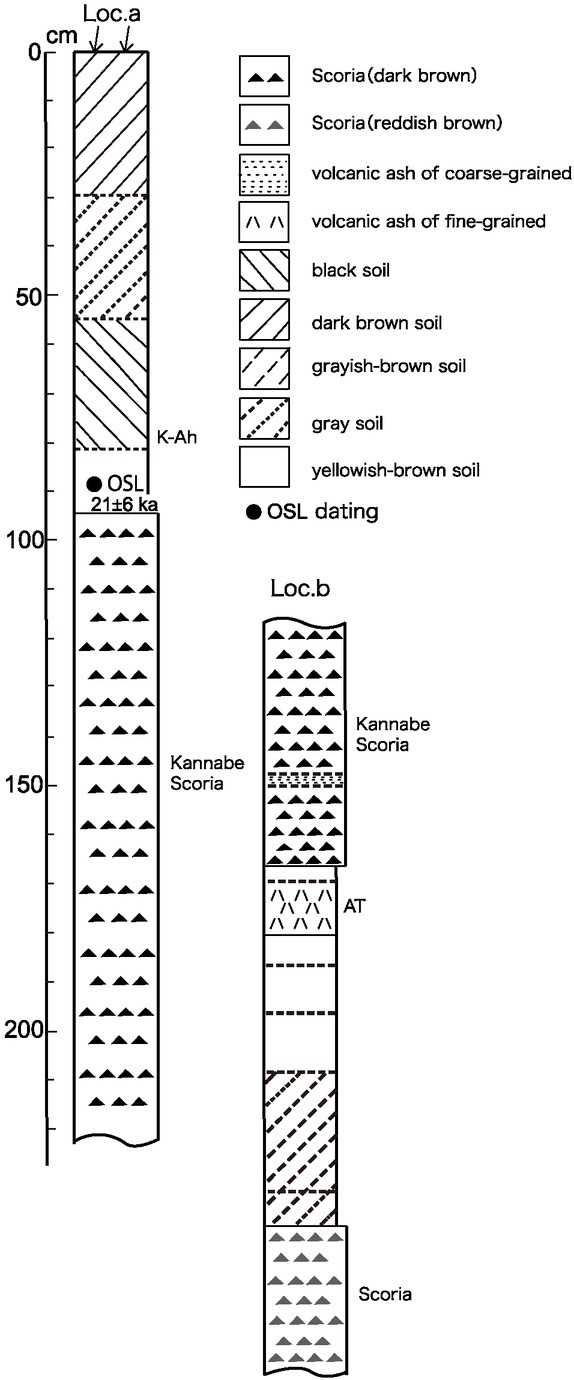
Fig. 2
Geological columnar sections in locs. a and b of Fig. 1. Closed circle show sampling positions for OSL dating. The estimated OSL age is also shown.
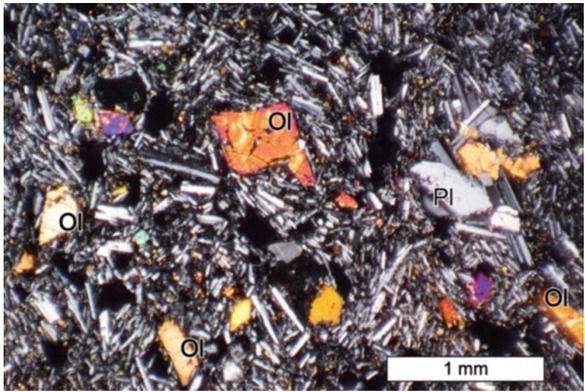
The Kannabe lava sample 4 (Fig. 3) has crystal contents of 5 vol.%, including phenocrysts of plagioclase (3 vol.%; <2 mm) and olivine (2 vol.%; <1.5 mm). The olivine is euhedral or subhedral, sometimes exhibiting a skeletal texture. Clear euhedral plagioclase coexists with minor dusty anhedral plagioclase. The groundmass shows an intergranular texture with microlites of pyroxene, olivine, plagioclase, and opaque minerals. Quartz was not observed, even as a xenocryst.
. Analytical procedures
Paleomagnetic dating
Paleomagnetic samples were taken from six outcrops of Kannabe lava flows. Sampling locations are presented in Fig. 1. Twenty-three lava clasts were oriented using a magnetic compass. In the laboratory, specimens of 25 mm diameter and 22 mm height were cut from the orientated lava clasts. The natural remanent magnetization (NRM) of each specimen was measured using a spinner magnetometer (SMD-88; Natsuhara Giken Co. Ltd.). Specimens were demagnetized thermally (TDS-1; Natsuhara Giken Co. Ltd.) and magnetically (DEM-97; Natsuhara Giken Co. Ltd.). From demagnetization results displayed as vector end-point diagrams (Zijderveld, 1967), we ascertained the components of remanent magnetization. Then we applied principal component analysis to each component (Kirschvink, 1980). A stable magnetic
component was defined as follows: (1) a linear segment consisting of more than three vector end points; and (2) maximum angular deviation (MAD) of less than 5°.
OSL dating
An OSL sample was collected at loc. a (N 35°30’20.9”, E 134°41’02.2”) in Fig. 1. Minerals in the collected sample were separated into sand and silt matter by wet sieving in water. After silt matter was treated with 10% hydrogen peroxide for 16 hr, fine silt (fine grain; FG, ca. 4–10 μm) was separated using Stokes’ law of setting in acetone. After fine silt of the sample was treated with 10% hydrochloric acid for 90 min, it was immersed in 20% hydrofluorosilicic acid for 8 days to separate the fine-grained quartz. The quartz extract purity was verified using infrared stimulation luminescence (IRSL) measurement (Shitaoka and Nagatomo, 2013). Conditions used for IRSL measurements to check the feldspar mixture were 60°C reading temperature with infrared stimulation power of 86.9 mW/cm2. It was an IRSL signal at the instrumental background level.
The OSL measurements were taken using an OSL reader (NRL-99-OSTL; Neoark Corp.) equipped with an array of 32 blue LEDs (470 nm, 18.1 mW/cm2) (Nagatomo et al., 2007; 2009). The OSL from a sample was detected using a photomultiplier tube (R1140P; Hamamatsu Photonics K.K.) housed in a cooling unit, through two condensing lenses and a glass filter (2 mm, Hoya U-340; Kenko Tokina Corp.). Irradiation was conducted using a Risø 90Sr-90Y beta source (dose rate 4.8 Gy/min). We used OSL dating with a single aliquot regenerative-dose protocol (SAR, Table 1; Murray and Wintle, 2000). To select an appropriate preheating condition using the SAR protocol, a preheat plateau test was conducted between 220°C and 280°C for 60 s at an interval of 20°C (Fig. 4). Because a plateau was obtained across the entire preheat range of 220–260°C, we selected 240°C.
Fig. 4
Preheat temperature plateau measurement. Averages of three aliquots are shown at the respective temperatures. A preheating plateau is apparent at 220–260°C.
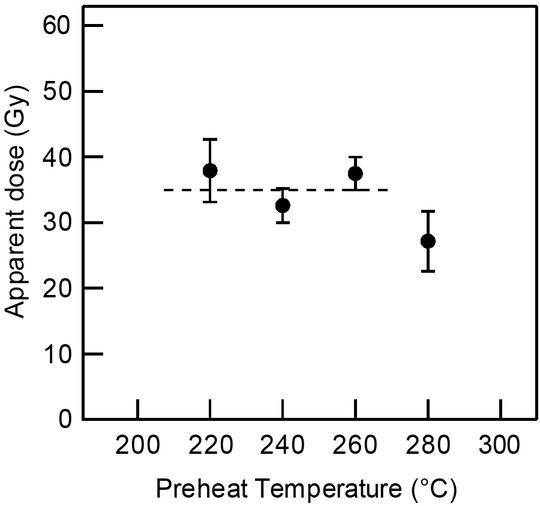
Table 1
Protocol for SAR measurement.
The annual dose (dose rate) was measured using a high-resolution gamma-ray spectrometer. The concentrations of 238U, 232Th, and 40K in the soil sample were analyzed using a Ge gamma-ray detector (EGSP 8785; Eurisys Mesures). The annual dose was calculated using the dose-rate conversion factors reported by Guérin et al. (2011). Present water contents of samples were used. Water contents (assuming an uncertainty of ± 10%) were estimated as the water weight over the dry soil weight. We assumed that environmental changes relative to the water content of the sample sediment were unlikely. Contributions of the cosmic dose rate to the annual dose were assumed according to methods proposed in earlier reports by Prescott and Hutton (1994), Nagatomo et al. (2009), and Shitaoka et al. (2009).
. Results
Paleomagnetic direction
Results of demagnetization experiments show that all specimens had strong and stable magnetizations, with NRM intensities of 1.0–5.0 × 10⁻³ Am2/kg. Magnetization of ten samples decayed linearly toward the origin. Single magnetic components with low MAD of less than 0.5° were obtained (Fig. 5a). Six samples showed noisy trajectories with considerable scatter (Fig. 5b). A trend of data points toward the origin is apparent, with identified single magnetic components, although they have higher MAD of about 1–5°. These magnetic components were adopted as thermal remanent magnetization (TRM) acquired during initial cooling of the lava. Four samples have two magnetic components (Fig. 5c). Magnetic components removed at lower demagnetization levels are not well resolved and are distributed randomly. We interpret the components as showing viscous remanent magnetization (VRM) acquired after lava emplacement. However, magnetic components removed at higher demagnetization levels showed a straight line toward the origin. Their
Fig. 5
Vector end-point diagrams of demagnetization results for typical Kannabe samples. Solid and open circles respectively represent projections onto the horizontal and N–S vertical planes: (a) one magnetic component with smooth decay to the origin; (b) noisy trajectories with scatter; and (c) two magnetic components.
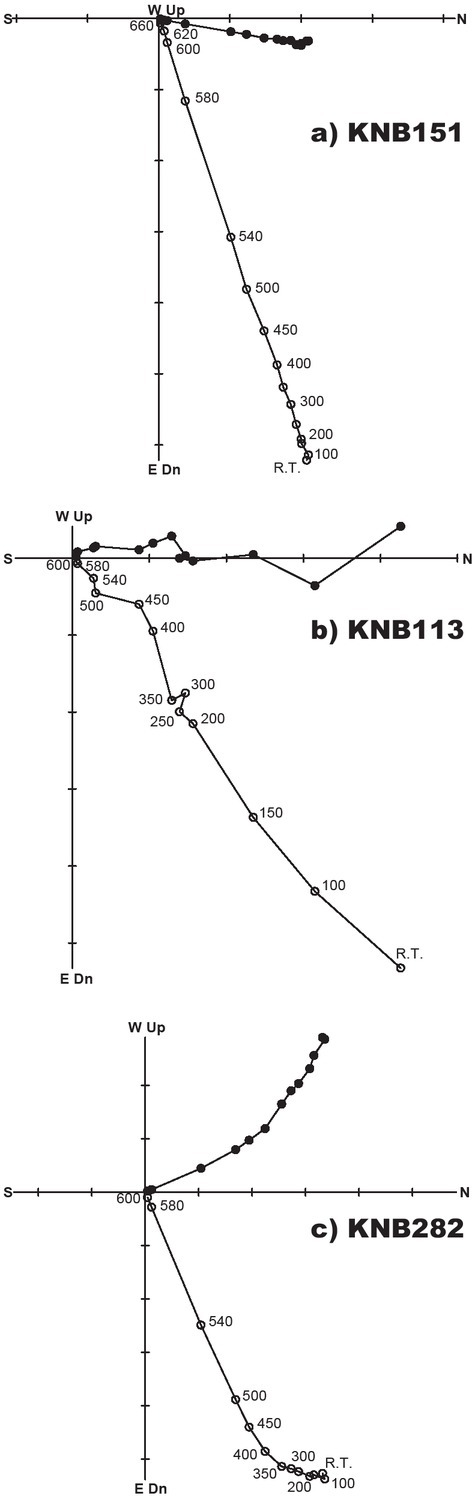
directions are almost parallel to the directions of magnetic components from the other samples. Therefore, the components removed at higher demagnetization levels are adopted as TRM (Table 2).
Table 2
Sampling localities and demagnetization results.
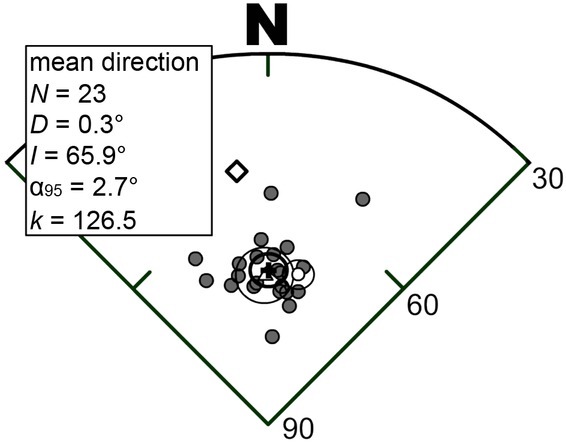
Magnetic components derived from TRM at the origin show better grouping of the direction (Fig. 6). The mean directions are D = 0.3°, I = 65.9°, α95 = 2.7°, and k = 126.5. The inclination is steeper than the present Earth’s magnetic field direction at this location (49.7°), which also suggests the remanence origin as TRM, not VRM. The steep inclination is characteristic of Kannabe lava, consistent with previous studies: 66.6° reported by Torii et al. (1978) and 66.3° by Morinaga et al. (2000).
Fig. 6
Equal-area projection onto the lower hemisphere of magnetic components (solid circles) showing the mean direction (cross), its 95% confidence circle and present Earth’s magnetic field (square) around the studied area are shown. The mean direction and its 95% confidence limit from Torii et al. (1978) and from Morinaga et al. (2000) are also shown respectively as open triangles and open circles.
OSL dating
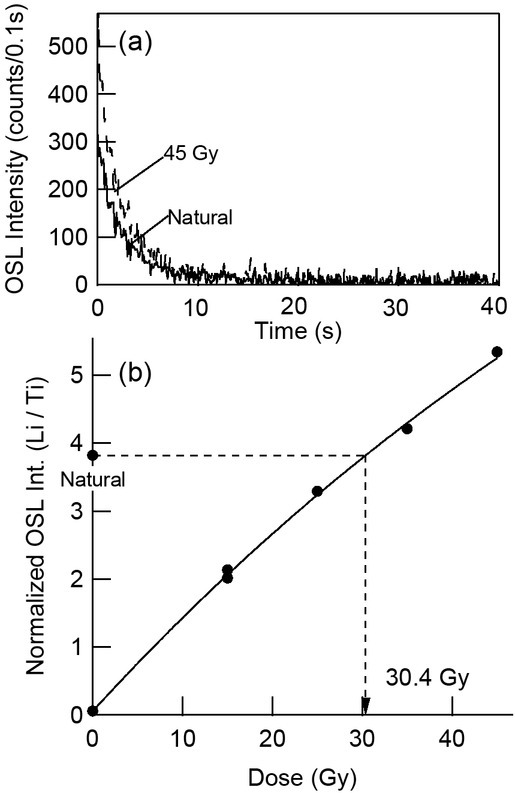
Sensitivity-corrected OSL signals were calculated by dividing Li by the respective Ti (i.e., Li / Ti) using software (IGOR Pro version 6.03; Wavemetrics, Inc.). The SAR protocol consists of a series of regenerative and test dose measurements to create a sensitivity-corrected growth curve onto which the sensitivity-corrected natural OSL signal (Lnatural / Tnatural) is projected. The paleodose value is obtained from the point of intercept, which is then interpolated onto the dose axis (Fig. 7). The values of the paleodose and the error of each aliquot were estimated using measurement conditions reported by Wintle and Murray (2006) and found using a Monte Carlo method (Duller, 2007). Of 15 aliquots, 6 aliquots were rejected, as estimated by extrapolation over a 45 Gy regeneration dose. A radial plot (Vermeesch, 2009) of paleodoses is presented in Fig. 8. The overdispersion value was
Fig. 7
a) OSL decay curve of natural and 45 Gy as regeneration dose. b) Growth curve of an aliquot for regenerative doses of 0, 15, 25, 35, and 45 Gy.
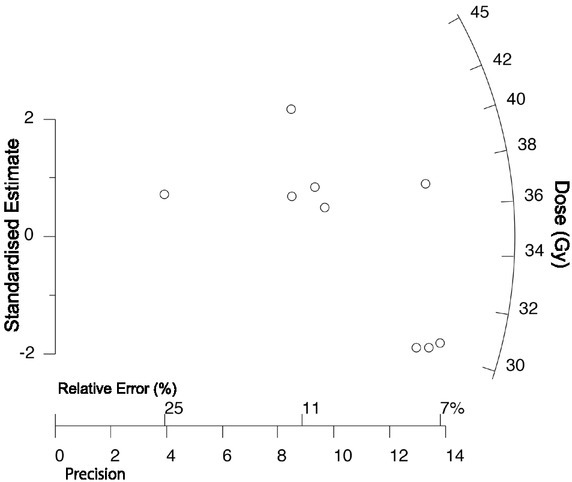
9.2%. Following procedures reported by Olley et al. (2004), a sedimentary sample with overdispersion of less than 20% was fully bleached. Presumably, this sample was well-bleached sediment. The paleodose of the sample was calculated using the central age model (Galbraith et al., 1999; Vermeesch, 2009).
The OSL age, 21 ± 6 ka, is presented in Table 3. This result is consistent with tephrostratigraphy of the period between ca. 7.2–7.3 and ca. 30 ka.
. Discussion
We investigated the eruption age of the Kannabe volcano in Japan. The Kannabe scoria lies between widespread tephras of K-Ah (ca 7.2–7.3 ka) and AT (ca. 30 ka) (Fig. 2). The OSL dating indicates the age of the clay bank soil layer overlying the Kannabe scoria as 21 ± 6 ka. These data suggest that the eruption age of the Kannabe scoria lies between ca. 21 and 30 ka.
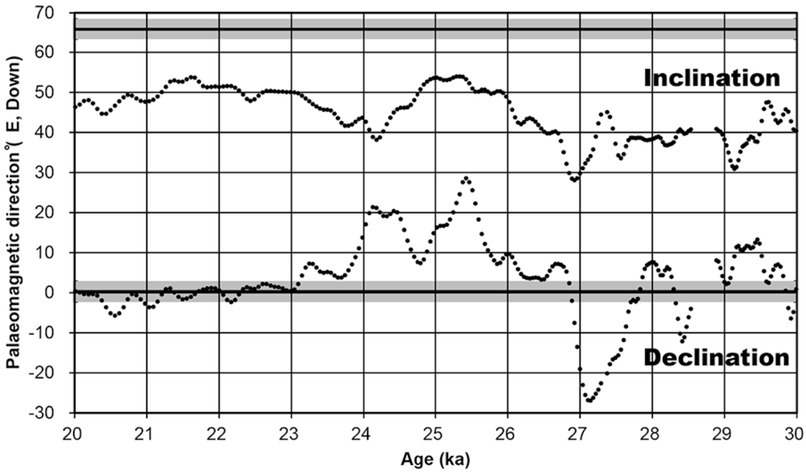
The paleomagnetic age was estimated by comparing our results with PSV data obtained from Lake Biwa sediments (Hayashida et al., 2007). Lake Biwa is nearby: about 120 km east of the studied area. The PSV from Lake Biwa has a high temporal resolution for the past 40 ka. Consequently, the PSV is potentially applicable for estimating the paleomagnetic age of Kannabe lava. According to OSL dating, the Kannabe volcano eruption is estimated to have occurred before 21 ± 6 ka. AT tephra underlying the Kannabe scoria indicates that its eruption occurred after 30 ka. Therefore, PSV during 20–30 ka was compared with our data. Inclination of the PSV does not reach 60° during 20–30 ka, despite our results indicating 65.9° (Fig. 9). The PSV data is derived from detrital remanent magnetization, which can be affected by smoothing effect on the magnetic signal. The amplitudes of the 40 ka PSV data seem to be attenuated compared to the Holocene PSV data, which has a 2.5 times higher sedimentation rate (Hayashida et al., 2007). A short-term variation may disappear in the 40 ka PSV data. Also, inclination error (e.g. Dunlop and Özdemir, 1997) possibly occurs in the 40 ka PSV data because the average inclination for 4–23 ka is about 6° shallower than the geocentric axial dipole field (Hayashida et al., 2007). Therefore, we sought the period showing steep inclination from the PSV from Lake Biwa. During 20–30 ka, two peaks in steep inclination with more than 50° are apparent at ca. 21.5 ka and ca. 25 ka (Fig. 9). Declination of the PSV at ca. 21.5 ka is about -1°, which closely approximates our results of 0.3°, whereas that at ca. 25 ka is about 7–29°. Therefore, the paleomagnetic age of Kannabe lava is estimated as ca 21.5 ka.
Fig. 9
Paleomagnetic direction from Kannabe lava shown on paleosecular variations from Lake Biwa after Hayashida et al. (2007). Bold lines and gray bars respectively represent the paleomagnetic direction and its 95% confidence angle.
Within the age range, the remanent magnetization (declination and inclination) of the Kannabe lava accords exactly with the environmental magnetic record at around 22 ka. Consequently, we can infer the eruption age of the Kannabe scoria cone as ca. 22 ka.
. Summary
Identification of active volcanoes is extremely important not only for volcanology but also for disaster prevention. A method for precise age determination of young volcanic rocks must be established. In this study, the eruption age of young basaltic lava was ascertained using paleomagnetic dating, OSL dating, and tephrochronology. Tephrochronological estimation results indicate to us that the eruption occurred between 7.2–7.3 and 30 ka. The OSL age of sediment on Kannabe scoria was
21 ± 6 ka. The paleomagnetic age was found to be ca. 21.5 ka by comparison with PSV from Lake Biwa. Consequently, the eruption age of Kannabe volcano is inferred as ca. 22 ka.
This study demonstrated that multi-method dating is an effective tool for the age determination of young volcanic rocks.