Effects of Wave–Current Interaction on Storm Surge in the Pearl River Estuary: A Case Study of Super Typhoon Mangkhut
 Zhifa Luo1,2,3,4*
  Bensheng Huang2,3,4 Xiaohong Chen1 Chao Tan2,3,4 Jing Qiu2,3,4 Guangling Huang2,3,4
- 1School of Civil Engineering, Sun Yat-sen University, Guangzhou, China
- 2Guangdong Research Institute of Water Resources and Hydropower, Guangzhou, China
- 3Guangdong Key Laboratory of Hydrodynamic Research, Guangzhou, China
- 4Southern Marine Science and Engineering Guandong Laboratory, Zhuhai, China
This study explored the effects of interactions between waves and current on storm surge in the Pearl River Estuary (PRE) using a fully coupled wave–current model. The model was validated based on in situ observations during the traverse of super typhoon Mangkhut. The results indicated that the model could reproduce the storm surge and wave setup processes. Numerical experiments showed that simulations of storm surge are minimally affected by wave setup. The wave setup during super typhoon Mangkhut reached up to 0.23 m and contributed to the total near shore storm surge by up to 8%. The simulations of the coupled model showed a better correlation with observations compared to those of an uncoupled model. The storm surge increased with transport upstream in a tidal-dominated outlet, whereas it decreased in a river-dominated outlet. The storm surge and wave setup increased and decreased, respectively, during spring tide as compared to that during a neap tide. The storm surge increased with increasing runoff in the upper river reaches, whereas there was little change in the tidal-dominated lower river reaches. This research emphasizes the importance of integrating the effects of multiple dynamic factors in the forecasting of storm surge and provides a reference for similar studies in other estuaries with multiple outlets and a complex river network.
Introduction
The interactions between waves, surge, and tide during storm events can be significant in coastal waters due to enhancement by complex hydrodynamic and geomorphic features (Raubenheimer et al., 2001; Malhadas et al., 2009; Tanim and Akter, 2019; He et al., 2020). There is interaction between tide surge and waves through their effects on the mean water depth/water level and currents. Wave propagation and refraction in shallow water strongly depend on water depth and consequently on tide and surge level. Therefore, waves influence water level through wave setup and drive long-shore and cross-shore current through the excess momentum flux induced by waves. This is parameterized as wave radiation stress (Longuet-Higgins and Stewart, 1962, 1964). Water levels have a profound effect on wave height through distinct mechanisms. In the coastal area, significant weight height is strongly influence by time-varying water depth (Bolaños et al., 2014; Yu et al., 2017). Therefore, storm surge and wave setup are strongly influenced by tides in shallow water areas (Park and Suh, 2012). Surge strength tends to vary during the spring-neap cycle. In coastal areas, and particularly in estuary regions, river flow can combine with storm surges to present a combined hazard. This combined risk is likely to be more prominent in estuaries in which fluvial freshwater input originates from catchments in hilly regions where elevation has a statistically significant effect on extreme river discharge (Svensson and Jones, 2004).
The Pearl River Estuary (PRE, see Figure 1), in Guangdong, southern China, is characterized by a microtidal range and a complex coastline and terrain. The PRE is frequently exposed to intense tropical storms originating in the Northwestern Pacific, resulting in severe economic damage in the region (Li et al., 2020). In addition, typhoons have become more intense compared to those in the past because of global warming and sea-level rise, with their intensity and frequency of landfall increasing in the Northwestern Pacific (Guan et al., 2018). For example, super typhoon Mangkhut made landfall at the PRE with wind speeds reaching over 45 m s–1. This super typhoon resulted in a direct economic loss of ∼5 billion yuan and claimed ∼3 million victims (data from the Ministry of Emergency Management of the People’s Republic of China). Therefore, gaining an improved understanding and prediction of storm surge is important and there have been many past efforts to further understand the factors affecting storm surge (Yu et al., 2017; Liu and Huang, 2020; Zhang et al., 2020). Gong et al. (2018) determined that typhoon Hagupit in 2008 significantly increased landward transport of water and salt intrusion in the Modaomen waterway. Typhoon intensities and sizes were considered to significantly contribute to the generation of storm surge (Li et al., 2020). Zheng et al. (2020) indicated that quadratic bottom friction plays the most important role in tidal-surge interaction in the PRE, followed by the effects of shallow water and non-linear advection. Chen et al. (2019) analyzed the effects of wave–current interaction (WCI) during severe storms and the recovery processes in the PRE.
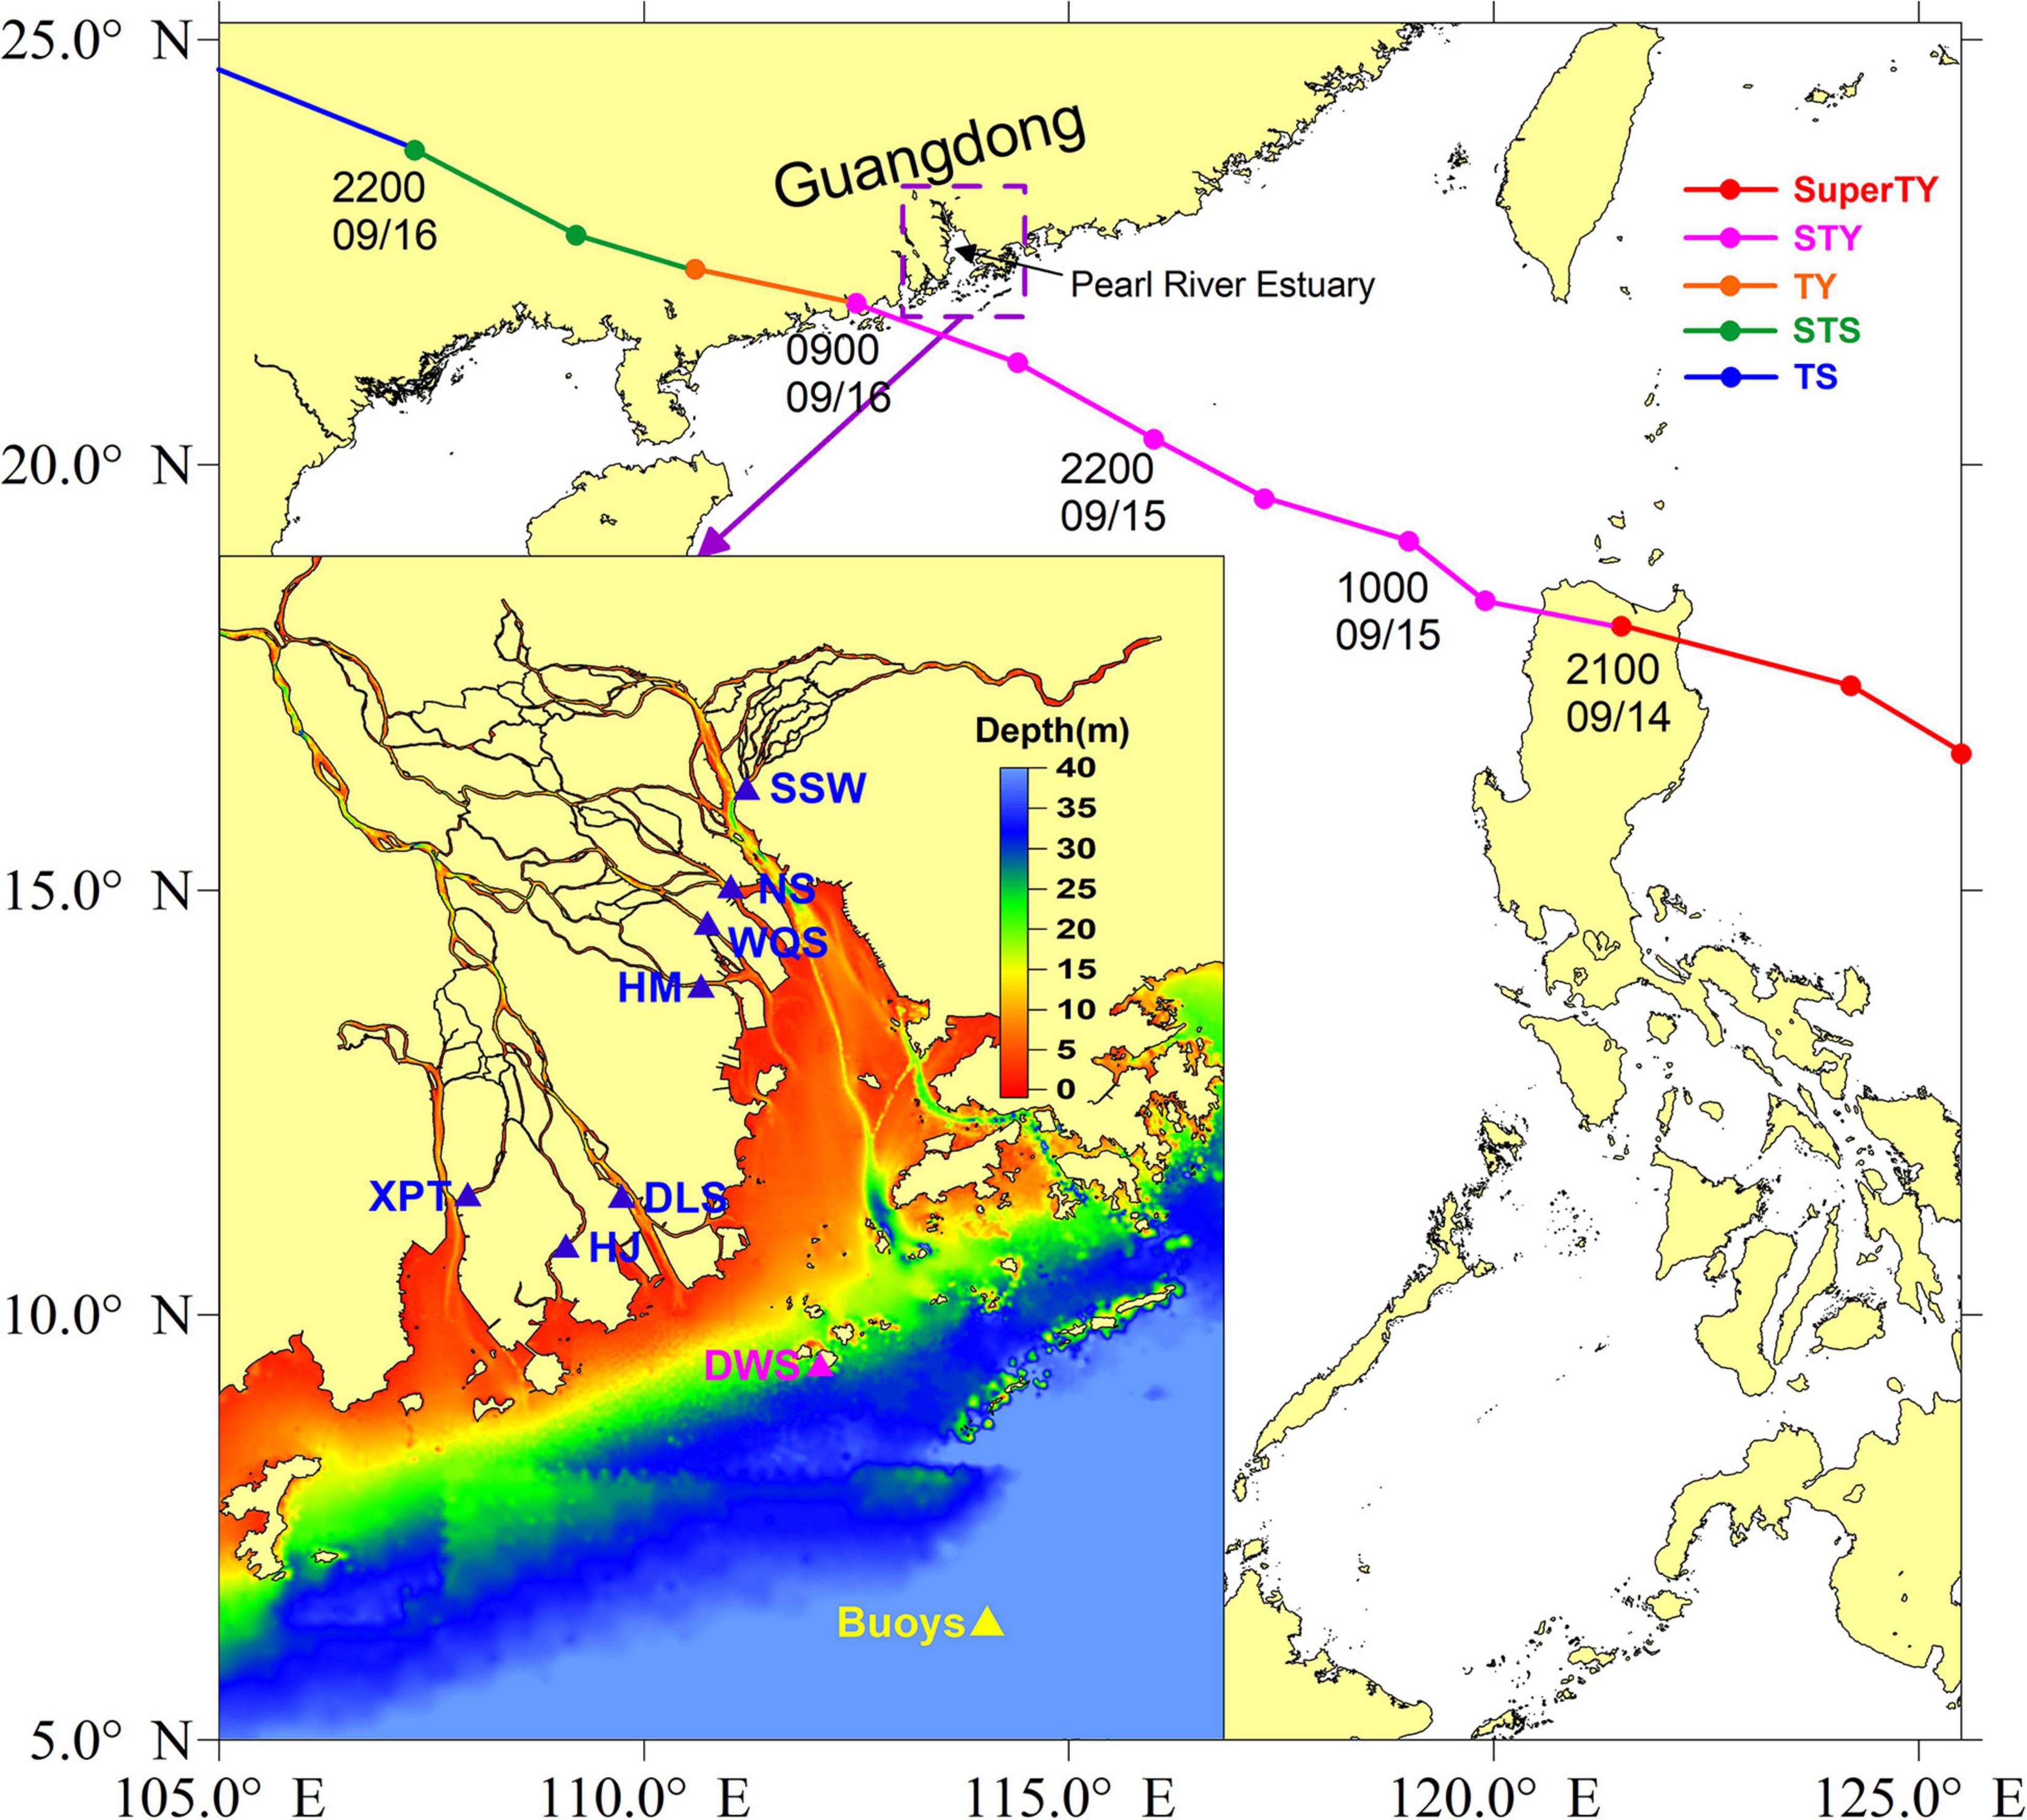
Figure 1. Track (color dot curve) and intensity of super typhoon Mangkhut (2018) in the Pear River Estuary, Guangdong, southern China. The intensity of the typhoon is abbreviated as: TS, tropical storm; STS, severe tropical storm; TY, typhoon; STY, severe typhoon; Super TY, super typhoon. The inset shows a zoomed-in plot of the locations (color triangle) of buoy, oceanographic, and tidal gauges in the computational domain. The blue triangles represent the locations of tidal gauge stations for water levels; the magenta triangle denotes an oceanographic station for wind measurements; the yellow triangle indicates the location of a buoy station measuring wind and significant wave height (SWH). The station names are abbreviated as: SSW, Sishengwei; NS, Nansha; WQS, Wanqinsha; HM, Hengmen; DLS, Denglongshan; HJ, Huangjin; XPT, Xipaotai; DWS, Dawanshan; ZD, Zhongda; HP, Huangpu; DS, Dasheng; DH, Dahu; TH, Tianhe; BQT, Baiqingtou; DHQ, Dahengqin.
Although there have been many studies on the responses of estuary processes to severe storms, few have focused on the transport of storm surge along a river channel. For example, storm surge has been shown to reach the Zhongda station 60 km upstream of Humen (Figure 1). In addition, storm surge responds to river discharge. The present study employed a fully coupled wave–current model to explore the role of WCI in the PRE and the associated river network. In addition, the influence of discharge on the surge was evaluated. The paper is structured as follows: section “Methods and Data” briefly describes the in-situ observations made and the coupled model. Section “Model Validation” describes the process followed for model validation. Section “Results and Discussion” present and discuss WCI during super typhoon Mangkhut. Finally summarizes the conclusions.
Methods and Data
Super Typhoon Mangkhut and Data
Super typhoon Mangkhut is the most intense and extreme typhoon within recorded history in China and made landfall in Guangdong in 2018. Figure 1 describes the traverse and intensity of super typhoon Mangkhut [data from the National Meteorological Center of the China Meteorological Administration (CMA)]. Mangkhut formed in the Pacific Ocean (165.3° E, 12.9° N) and was first recognized as a tropical storm at 1200 UTC on September 7, 2018. The depression steadily intensified and transformed into a super typhoon, with a maximum wind speed exceeding 52 m s–1 at 0000 UTC on September 11. Super typhoon Mangkhut first made landfall north of the Philippines at 2100 UTC on September 14. Subsequently, it degraded to a severe typhoon and moved northwest toward Guangdong, China. The center of super typhoon Mangkhut made its second landfall at Jiangmen, Guangdong at around 0900 UTC on September 16, 2018. The maximum wind speed of the typhoon upon landfall exceeded 45 m s–1.
Measurements of water levels were collected from tidal gauge stations around the PRE. Parallelly, wind, and significant wave height (SWH) measurements were obtained from oceanographic and buoy stations. Figure 1 shows the locations of in-situ stations. The present study used the observations to verify the simulations of the proposed coupled model (see section “Coupled Wave–Current Model”).
Coupled Wave–Current Model
The Semi-Implicit Cross-Scale Hydroscience Integrated System Model
The Semi-implicit Cross-scale Hydroscience Integrated System Model (SCHISM) is a hydrodynamic model derived from the Semi-implicit Eulerian–Lagrangian Finite-Element (SELFE) model (Zhang and Baptista, 2008). SCHISM is distributed with an open-source Apache v2 license and incorporates several enhancements, including an extension to examine the large-scale eddying regime and a seamless cross-scale capability from creek to ocean (Zhang et al., 2016). The model uses an accurate and efficient semi-implicit finite-element/finite-volume method incorporating a Eulerian–Lagrangian algorithm for solving the hydrostatic form of the Navier–Stokes equations. This allows the model to represent a wide variety of physical and biological processes. SCHISM has been extensively applied to several bays, regional seas, and estuaries globally for the simulation of general circulation, tsunamis, storm surge, WCI, sediment transport, and coastal ecology.
WAVEWATCH-III
WAVEWATCH-III (WWM-III) is a third-generation wave model that solves the wave action equation on an unstructured mesh. Interesting features of the model include: (1) many different source term formulations; (2) provision of several advection schemes that can be both explicit and implicit and; (3) the ability to couple with several different geoscience models. The wave action equation is the governing equation in WWM-III (Chen et al., 2017):
In Equation 1, N is wave action, Cgx and Cgy are the wave group velocities in the x, and y directions, respectively, u and v are the horizontal velocities in the x and y directions, respectively, σ is the wave relative angular frequency, θ is the wave direction, Cσ and Cθ are the propagation velocities in the σ and θ space, respectively, and Stot is the sum of the source terms for wave variance. The maximum wave direction in WWM-II is 360° and this measure is discretized into 36 bins. The low- and high-frequency limits of the discrete wave period are 0.03 and 1.0 Hz, respectively. The coefficient of bottom friction is set to 0.67 based on the Joint North Sea Wave Project (JONSWAP) formulation. Wave breaking in the shallow water area is computed in WWM-III using the presented method with a constant wave breaking coefficient of 0.78.
The SCHISM-WWM-III Coupled Model
The SCHISM-WWM-III coupled model was used to simulate WCI in the PRE. The model domain extended between 111.5°E–115.5°E and 21°N–23.7°N, encompassing the entire PRE and adjacent waters (Figure 2B). The unstructured mesh comprised 101,752 nodes and 173,045 elements in the horizontal dimension. The model grid resolution varied from 50 m inside the PRE to 1–2 and 10–15 km in the coastal waters and in the open sea, respectively. Approximately 11 σ levels were divided in the vertical direction, with refined surface and bottom layers. The river boundary was set at Gaoyao, Shijiao, Boluo, Shizui, and Renhe, which represent the limits of the tide current of the PRE. The open ocean boundaries were provided by tidal and residual water levels. Tidal levels were derived by eight major tidal constituents (M2, S2, N2, K2, K1, O1, P1, and Q1) obtained from the Oregon State University (OSU) Tidal Inverse System (OTIS; Egbert and Erofeeva, 2002). Residual water levels were provided by a large model encompassing the entire South China Sea (Figure 2A). Further details on the model boundary and initial conditions can be found in Luo et al. (2020). The timesteps of the SCHISM and WWM-III were set to 200 and 1,800 s (30 min) after extensive model calibration. Therefore, WWM-III exchanged information with SCHISM at an interval of nine hydrodynamic time steps. An exchange frequency of 30 min is appropriate for the simulation of WCI (Chen et al., 2005). The coupled model simulated a period of 10 days from the 10th to 20th September, 2018.
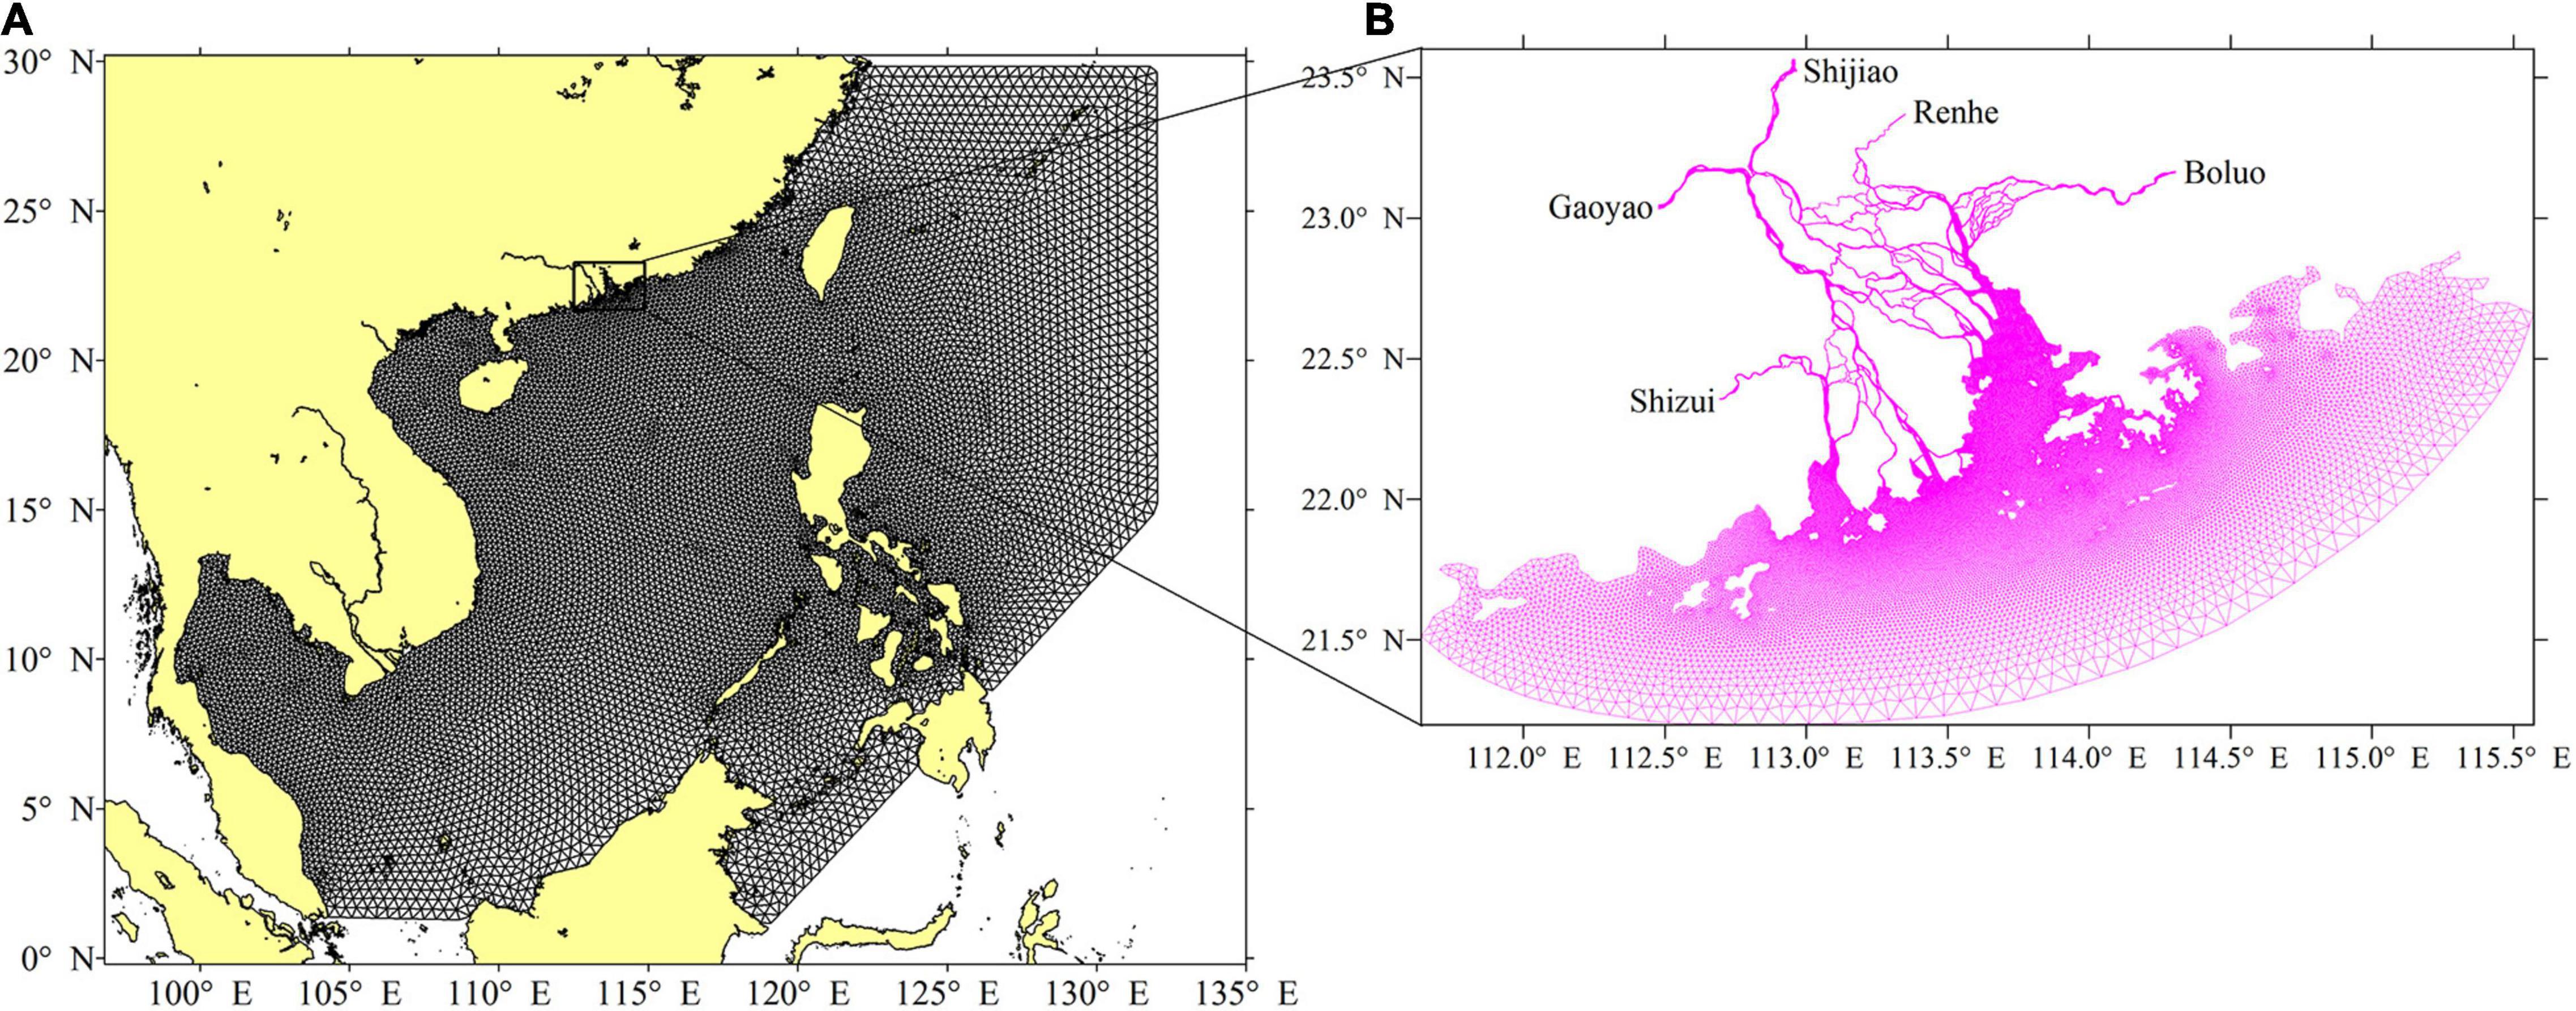
Figure 2. Numerical model mesh in the South China Sea (A) and its nested model mesh in the Pearl River Estuary (B).
Numerical Experiments
Fifteen experiments (Table 1) were conducted to explore the WCI in the PRE. Experiment 1 (control run) was driven by hourly river discharge, meteorological forcing, and tidal and residual water levels. The experiment also considered coupled wave–current. The control run assisted in obtaining a realistic evolution of the typhoon-generated storm surge in the PRE. Experiment 2 excluded the wave effects of experiment 1. The effects of waves on the storm surge were investigated by comparing the results of the control run to that of experiment 2. Experiment 3 was driven by river discharge and tide levels. The results of the storm surge were obtained by subtracting the simulations of experiment 3 from that of the control run. Experiment 4 involved the running of WWM-III on its own, driven by meteorological forcing. Experiment 5 considered the typhoon landfall during spring tide and compared the simulations of the model to that of the control run to explore variations in wave setup and storm surge due to the spring-neap tide. Experiments 6–9 increased river discharge by a factor of 5 to allow a discussion of the response of storm surge to river discharge. In Table 1, Q represents flow at Gaoyao, Shijiao, Boluo, Renhe, and Shizui of 5,000, 1,500, 1,000, 100, and 60 m3 s–1, respectively, and these flow values were chosen according to the observed timeseries of runoff process.
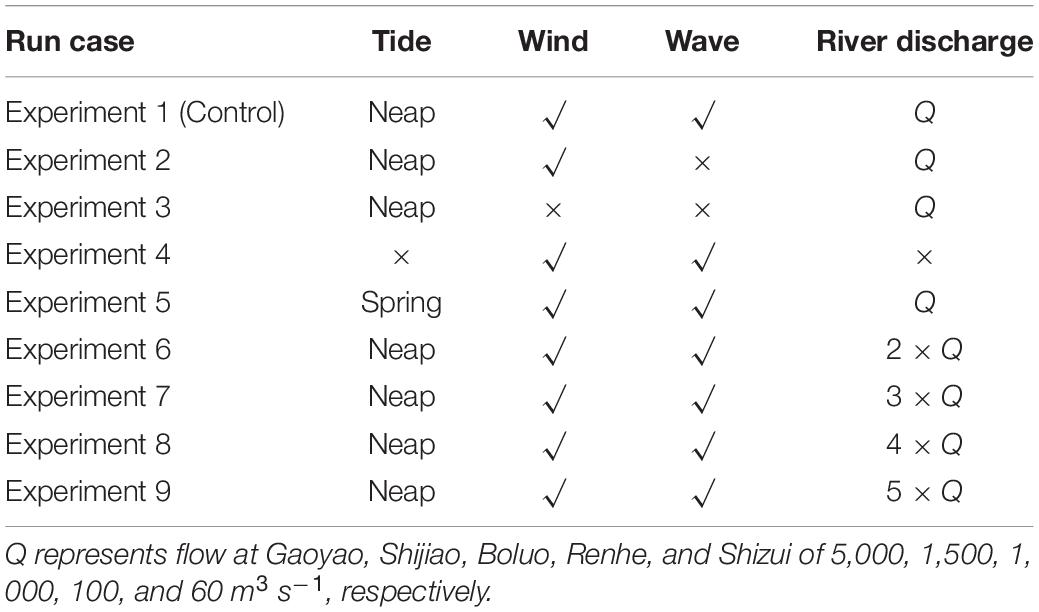
Table 1. Settings of numerical experiments conducted in the present study to simulate storm surge in the Pear River Estuary, Guangdong, southern China.
Meteorological Forcing
Following Fujita (1952), the pressure field was calculated as:
In Equation 2, r represents the distance from the typhoon center, P0 represents the pressure in the typhoon center, P∞ represents the pressure far from the typhoon center, which was a constant of 1,010 hPa in the current study, and R is the radius of maximum wind speed. R is expressed as: R = Rk − 0.4 × (P0 − 900) + 0.01 × (P0 − 900)2 (Gao et al., 2012), Rk is empirical constant with a value ranging between 30 and 60 and was considered to be 45 in the current study.
By combining the formulas for the gradient wind field and typhoon mobile speed (Ueno, 1981), the wind field can be expressed as:
In Equations 1, 2, (Wx, Wy) is the wind speed vector, Vx and Vy are the components of wind mobile speed in the x and y directions, respectively, f is the Coriolis parameter, ρa is the air density, C1 and C2 are constants, with both having a value 0.8, x0 and y0 are the coordinates of the typhoon center, xr and yr are the coordinates at a distance of r to the typhoon center, and A and B are expressed as:
Model Validation
The hydrodynamic model used in the present study has been extensively calibrated and validated against observations of elevation and current velocity in previous studies (Huang et al., 2018, 2020). The mean absolute error of model simulated water level was less than 10 cm, whereas the average relative error (RE) of model simulated flow velocity was less than 10%. The model has also been successfully applied to simulations of storm surge in the PRE (Luo et al., 2020). The present study further validated simulations of wind, wave, and water level. Modeled outputs were evaluated by means of the RE, root-mean-square-error (RMSE), and the correlation coefficient (CC) between observations and simulations.
Validations of Simulations of Wind and Waves
Figure 3 shows a comparison between observed and simulated wind. Maximum observed and simulated wind speed at the Dawanshan station were 31.1 and 35.7 m s–1, respectively, providing an RE, RMSE, and CC of 14.7%, 4.8 m s–1, and 0.82, respectively, whereas those at the buoy station were 15.1%, 3.1 m s–1, and 0.92, respectively. It should be noted that the simulations of wind speed agreed well with the observed data.
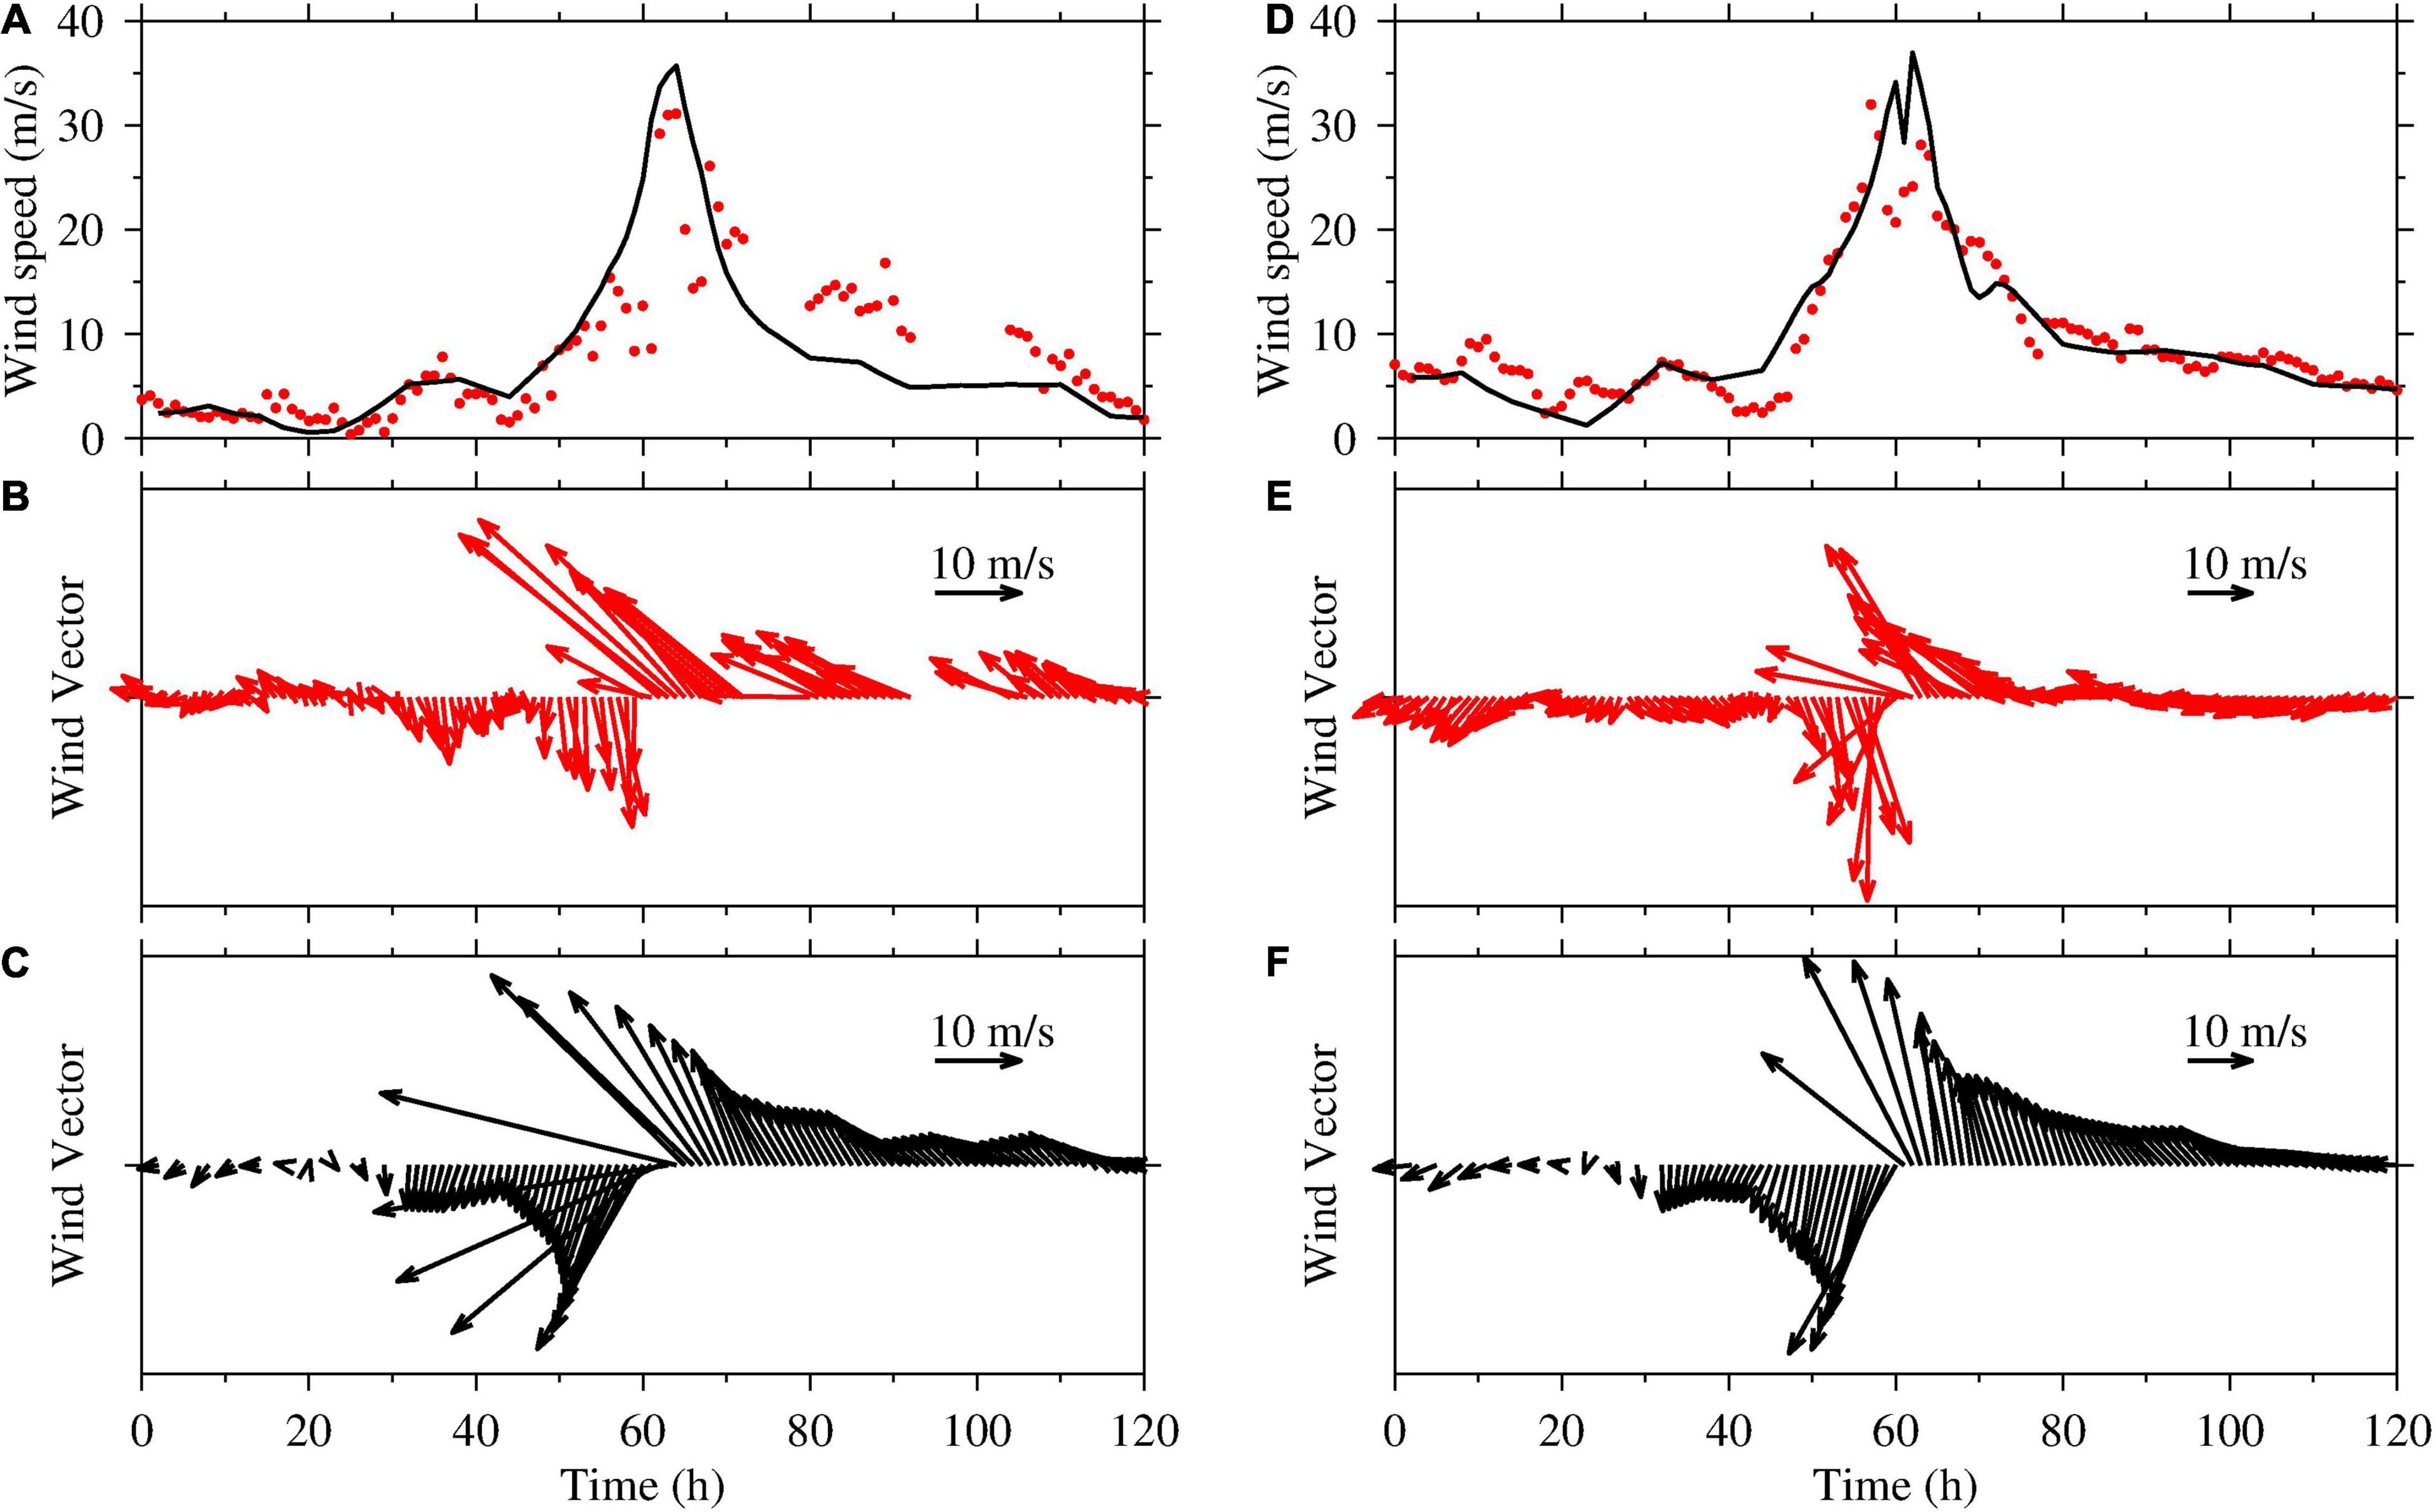
Figure 3. Comparisons between the observed data (red) and the simulated results (black) for September 14–19, 2018 during super typhoon Mangkhut in the Pear River Estuary, Guangdong, southern China. The left and right plots represent the wind data at the Dawanshan and buoy stations, respectively. (A,D) depict the measured (red dot) and simulated (black line) wind speeds, (B,E) show the measured wind vectors, and (C,F) show simulated wind vectors.
As illustrated in Figure 4, the maximum observed and simulated SWHs at the buoy station were 9.4 and 9.9 m, respectively, with an RE and RMSE of 5.3% and 0.88 m, respectively. This result implied that the coupled model accurately predicted the maximum values of SWH. A CC of 0.93 indicated that the model simulations agreed well with the temporal evolution of the SWH during super typhoon Mangkhut.
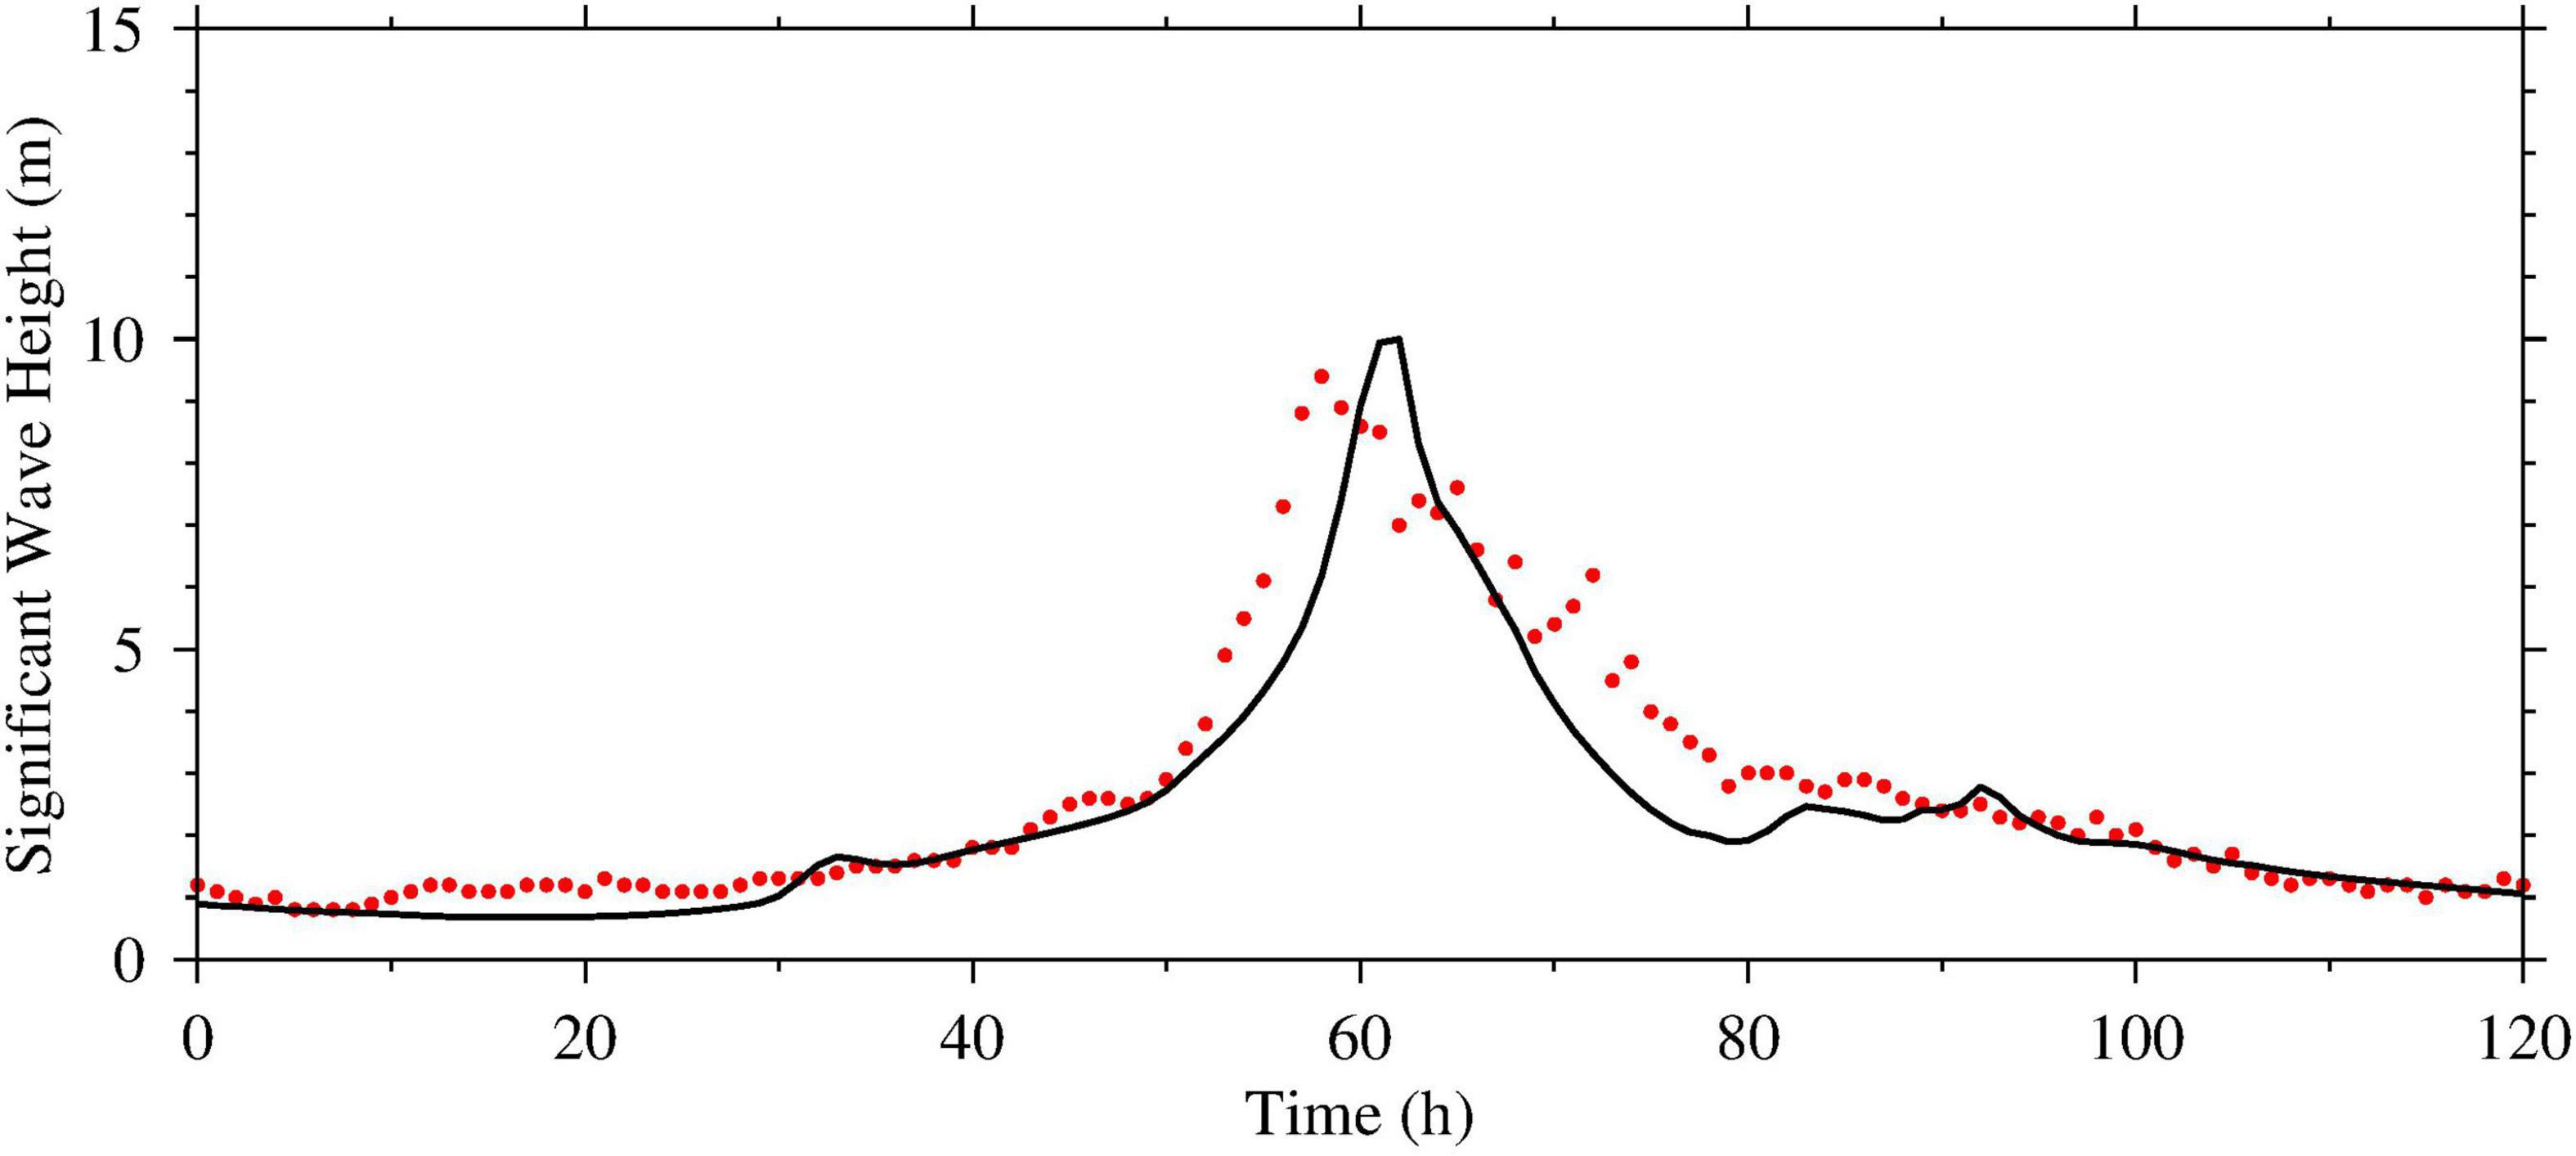
Figure 4. Comparisons between observed (red dot) and coupled model-simulated (black line) significant wave height (SWH) from September 14–19, 2018 at the buoy during super typhoon Mangkhut in the Pear River Estuary, Guangdong, southern China.
Validation of Simulations of Water Level
Figure 5 shows the observations (red dot), simulations by the coupled model (blue line), and simulations by the uncoupled model (black dash line) of water levels and storm surges at different stations. The simulations of the coupled model showed a higher correlation with observations compared to that of the uncoupled model. For example, the error between observations and simulations of maximum water levels decreased from 0.24 to 0.06 m and the RE decreased from −7.29 to −1.82% at Hengmen station when the wave effect was included. Similarly, the simulations of water level of the coupled model at the Nansha station matched the observed water levels well. Furthermore, the simulations of the coupled model indicated that wave setup plays an insignificant role in the simulation and forecasting of storm surge.
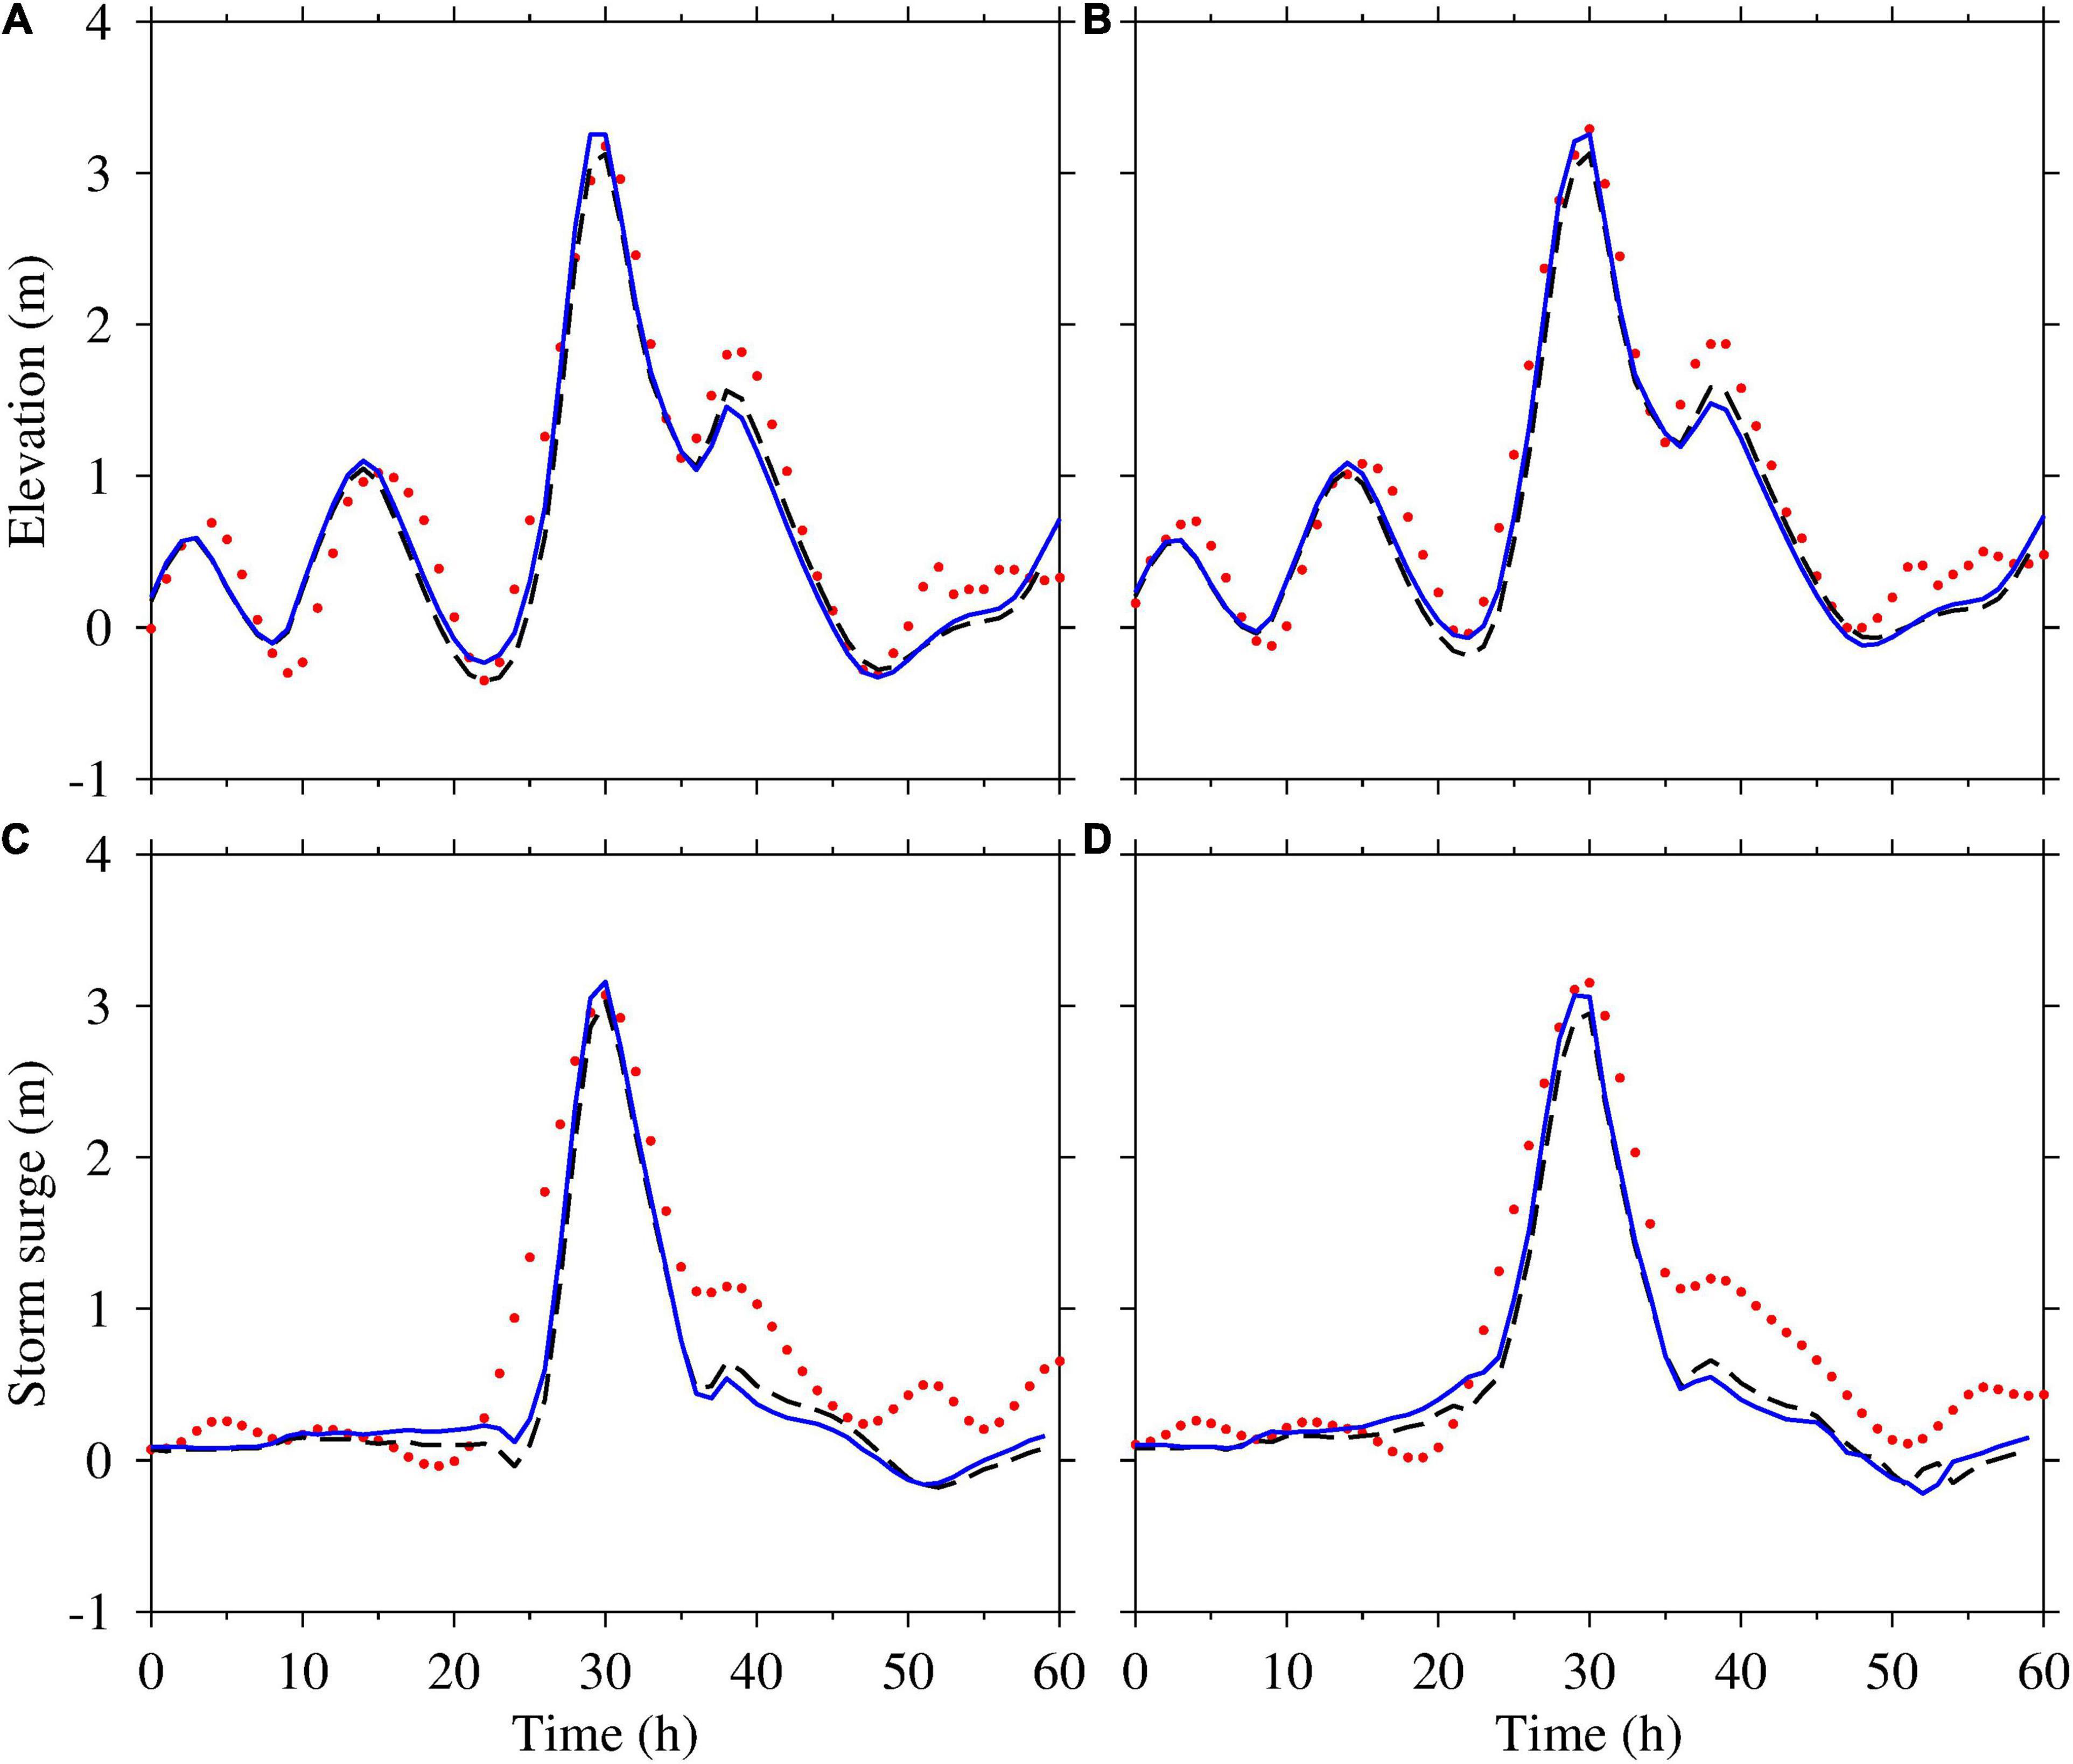
Figure 5. Observations (red dots), simulations by the coupled model (blue line), and simulations by the uncoupled model (black dash line) of water levels (A,B) and storm surge (C,D) from 1200 UTC on September 15 to 0000 UTC on September 18, 2018 at Nansha (A,C) and Hengmen (B,D) during super typhoon Mangkhut in the Pear River Estuary, Guangdong, southern China.
To summarize, the proposed model reproduced the magnitude and temporal variations in observed water levels. This indicates that the coupled SCHISM-WWM-III model is capable of simulating wave processes and storm surges induced by super typhoon Mangkhut in the PRE and that the model can be used to explore the effect of WCI on storm surge.
Results
Simulations of Wind and Waves
Figure 6 shows the simulated results of SWH, storm surge, and wave setup at 0500 UTC and at 0900 UTC on September 16, 2018, 4 h before and precisely when typhoon Mangkhut made landfall on the PRE.
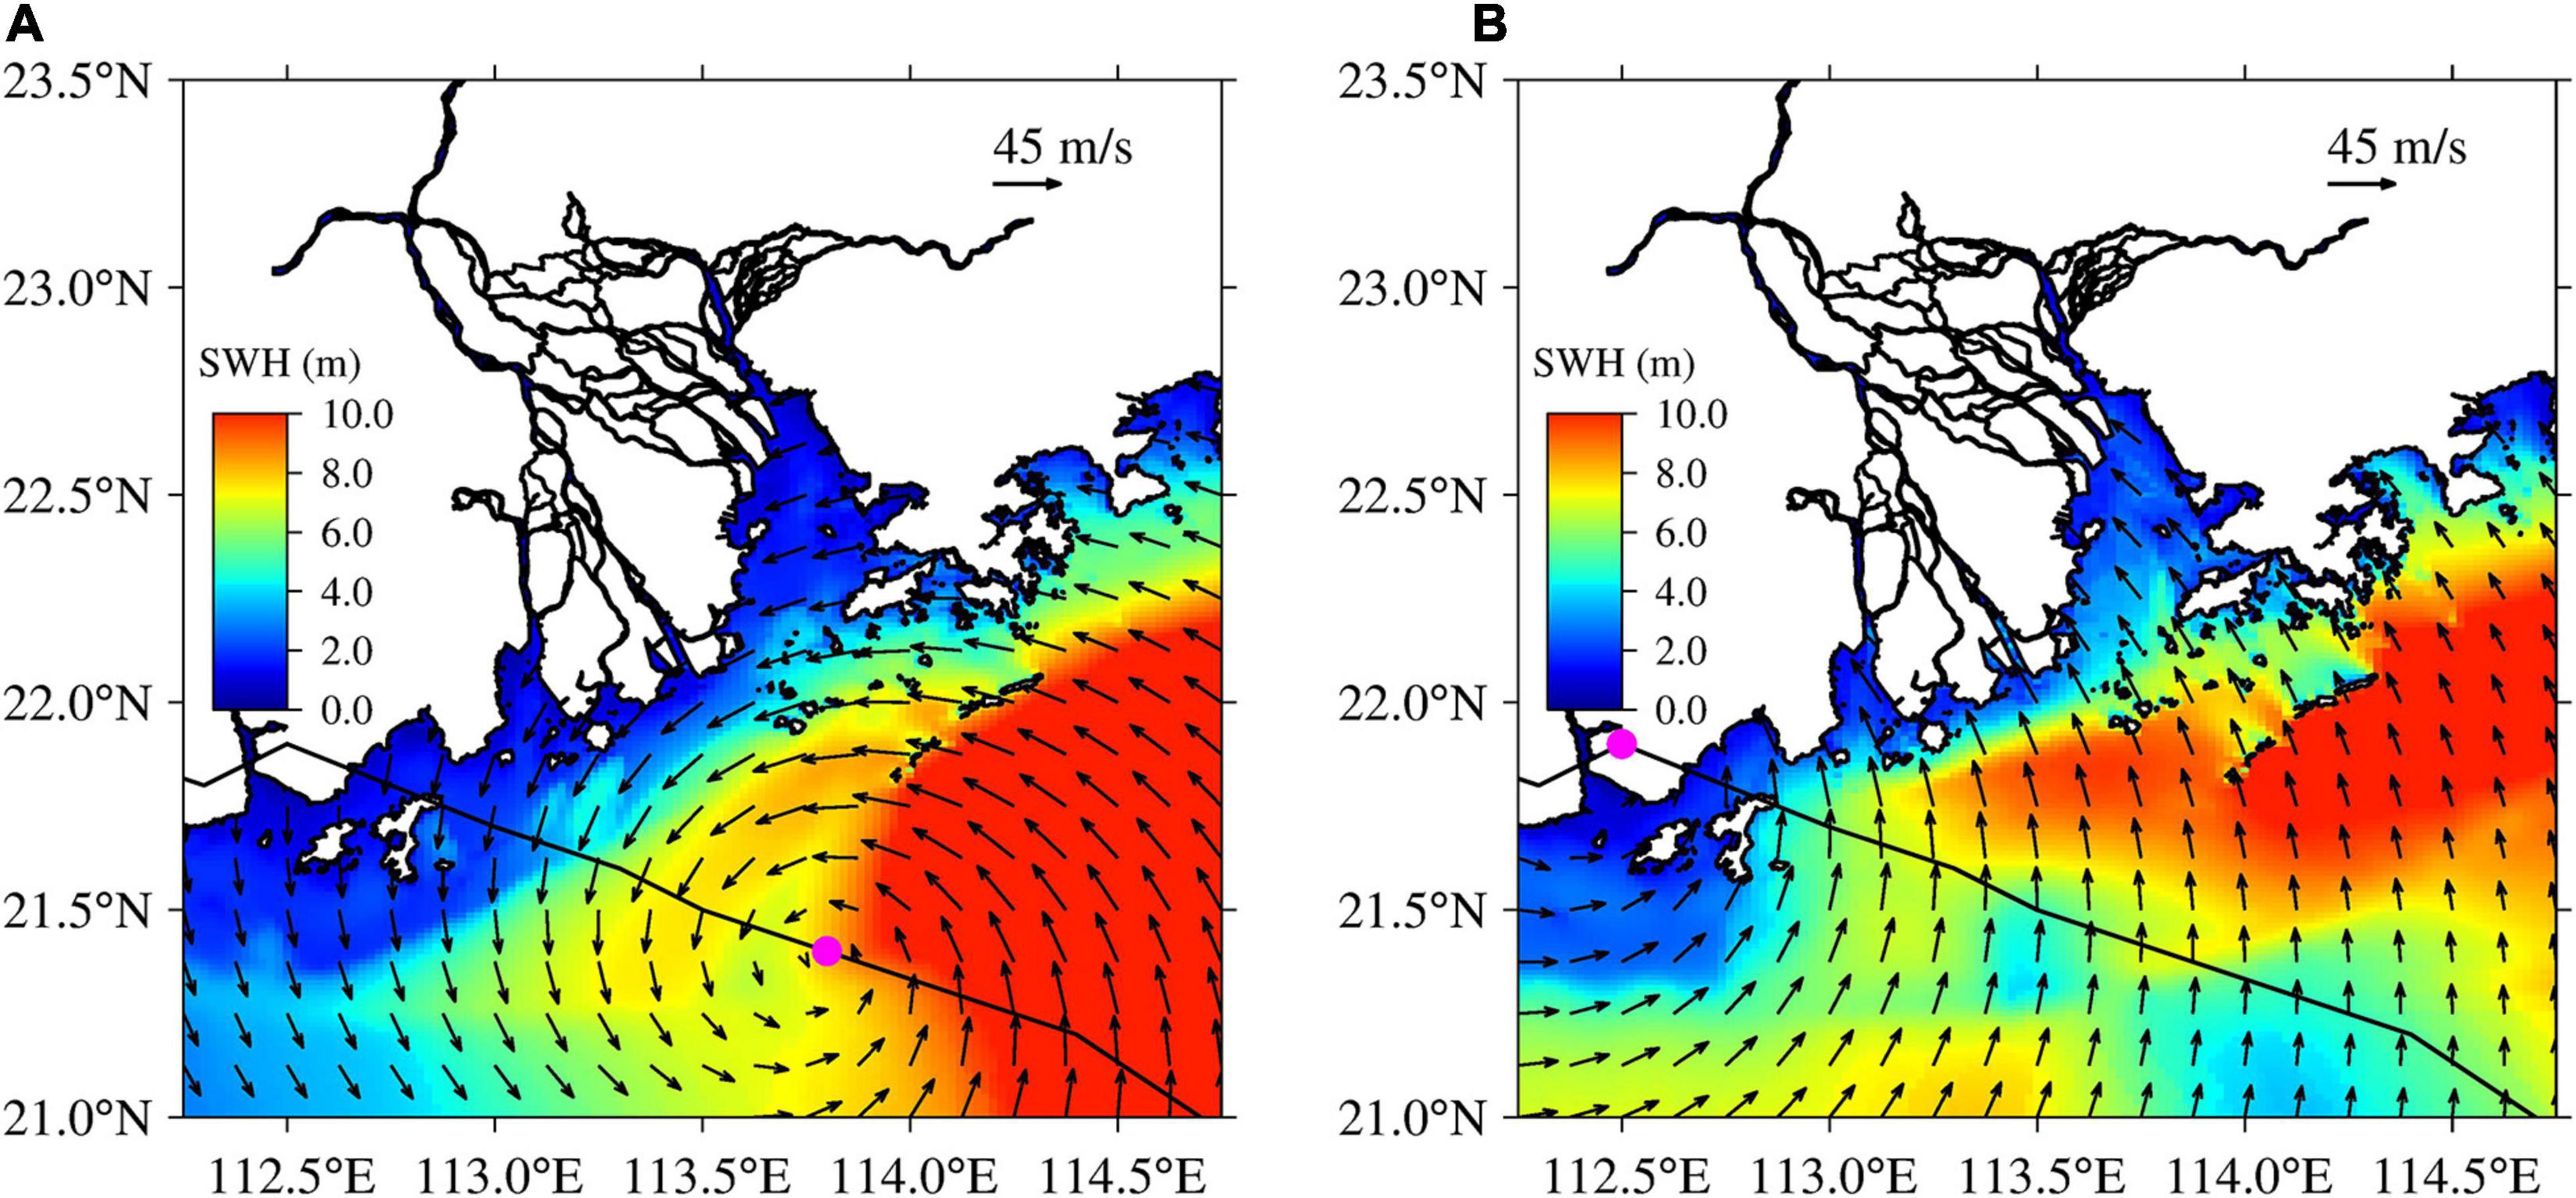
Figure 6. Simulations of significant wave height (SWH) by the coupled model during super typhoon Mangkhut in the Pear River Estuary, Guangdong, southern China. (A) 0500 UTC on September 16, 2018, (B) 0900 UTC on September 16, 2018. Wind speed vectors are superimposed as black arrows, the track of super typhoon Morakot is shown as a black line, and the typhoon center is represented by a magenta dot.
Figures 6A,B show the coupled SWHs with wind fields. A distinct anti-clockwise 6-wind structure was seen around the typhoon center off the PRE at 0400 UTC on September 16 (Figure 6A). A large section of easterly winds blew against the PRE. The largest waves, exceeding 10 m, were generated on the right-hand side of the center of super typhoon Mangkhut. The SWH of the PRE was relatively small, falling between 2 and 4 m under an unfavorable wind condition. Favorable southeasterly winds prevailed at the PRE when typhoon Mangkhut made landfall, resulting in a maximum SWH of 4–5 m (Figure 6B). The simulated wind speeds were of the order of 30 m s–1, consistent with observed values at the Dawanshan station. The area affected by super typhoon Mangkhut was increased and wave heights of up to 9 m were generated.
Storm Surge and Wave Setup
The storm surge was simulated as the difference between the outputs of the control run and the simulations of experiment 3 (Figure 7). A generally widespread and large storm surge occurred during the typhoon. The storm surge was only 1.5 m in the open sea but increased rapidly toward land. The storm surge exceeded 3 m along the west coast of the PRE and extended to upstream river reaches. The storm surge in the upper estuary exceeded that in the lower estuary, mainly due to water convergence.
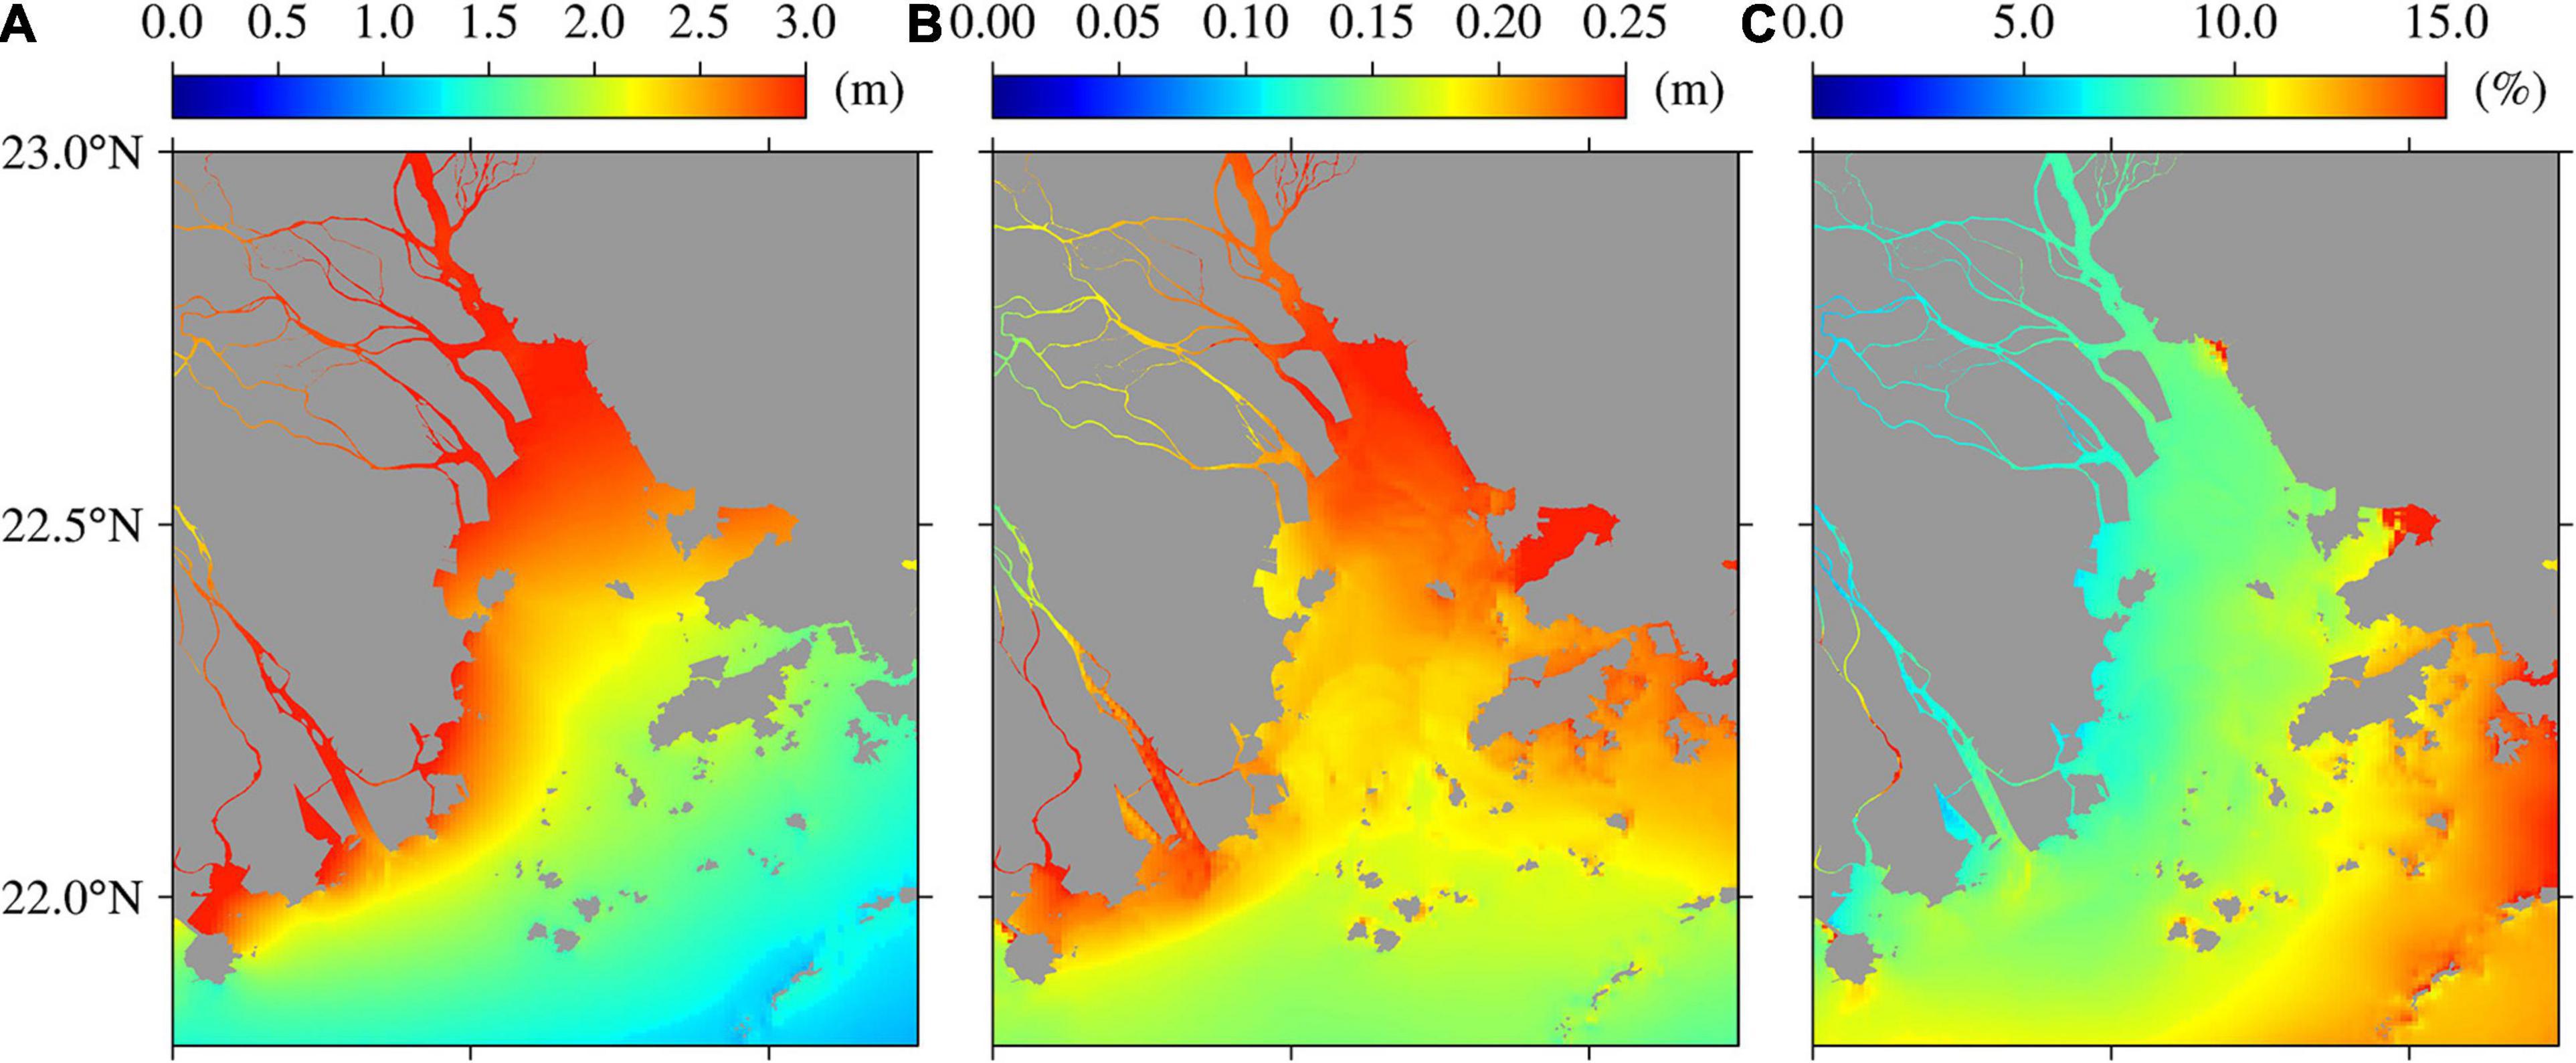
Figure 7. Maximum storm surge (A), maximum wave setup (B), and wave contribution (C) during super typhoon Mangkhut (2018) in the Pear River Estuary, Guangdong, southern China.
A wave breaks as it propagates from deep to shallow waters, thereby transferring wave-related momentum to the water column. This results in an increase in water level, consequently inducing wave setup. The wave setup was computed as the difference in water levels between the control run and simulations of experiment 2 (Figure 7). The mean wave setup in the PRE was 0.16 m, reaching up to 0.23 m. The importance of wave setup increased in the nearshore area, particularly in the shoal waters, with its contribution to overall storm surge ranging from 3 to 8%. This result is similar to those obtained in previous studies. Sheng et al. (2010) showed that additional storm surges resulting from hurricane Isabel in Chesapeake Bay reached 5–20%. Yu et al. (2017) noted that wave setup during Typhoon Morakot potentially contributed to 4–24% of the total storm surge. Chen et al. (2019) showed that the maximum storm surge near the western shore of the PRE increased by 20–30% due to the interaction between waves and currents.
Impact of Waves on Storm Surge
Section “Storm Surge and Wave Setup” considered wave setup to be a minor component of total storm surge under extreme typhoon conditions. Further analysis was conducted to understand the effects of waves on storm surge. Figure 8 shows that the wave setup and SWH varied significantly with time and area. Larger values of wave setup and SWH were evident near the shallow waters compared to those relatively far from the coastal area (i.e., Dawanshan). The maximum wave setup (∼0.23 m) occurred in shallow waters (i.e., Nansha, Hengmen, and Denglongshan). This result could be attributed to wave breaking due to the sharp decrease in water depth. The wave setup broadly followed the evolution of SWH. The effect of wave setup was positively related to SWH.
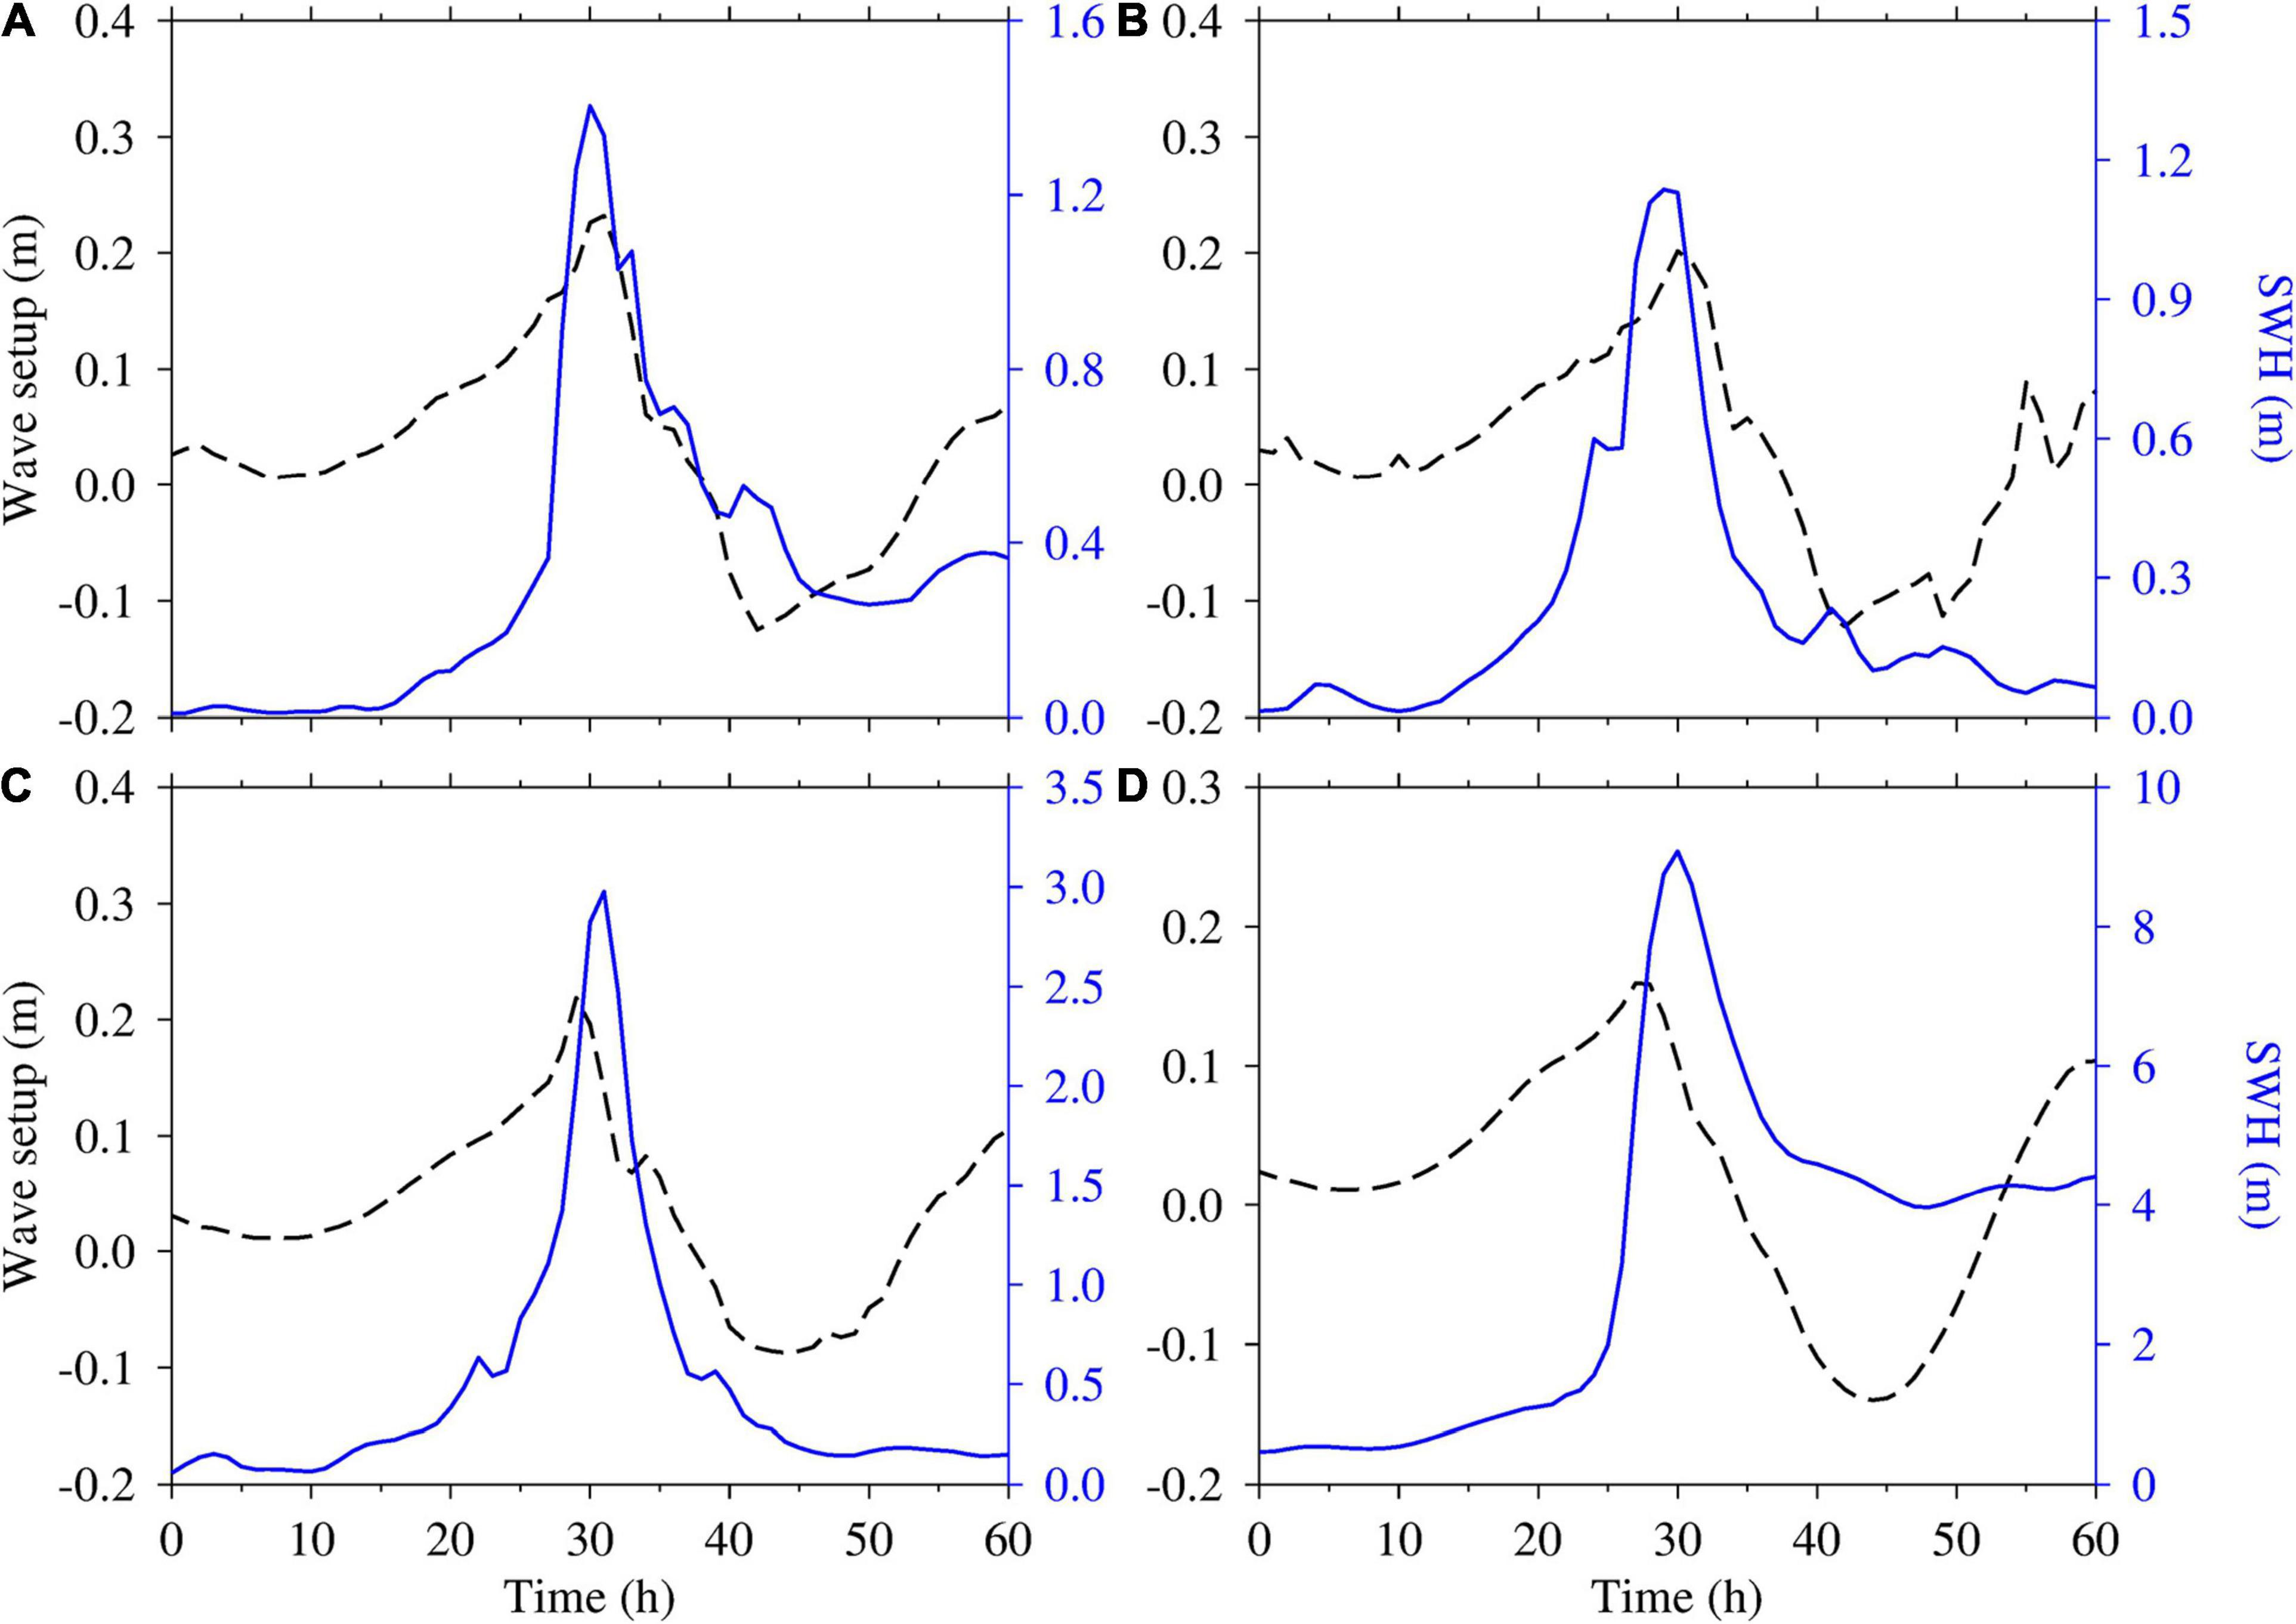
Figure 8. Timeseries of wave setup (black dash line) and significant wave height (SWH) (blue line) at the (A) Nansha, (B) Hengmen, (C) Denglongshan, and (D) Dawanshan stations during super typhoon Mangkhut (2018) in the Pear River Estuary, Guangdong, southern China.
Effect of Storm Surge on Waves
The difference in SWH was obtained by subtracting the simulated results of experiment 4 from those of the control run. The resulting scatter plots show the relationship between the difference in SWH and elevations (Figure 9). The difference in SWH and elevation were strongly correlated in the nearshore area (Figures 9C,D). Large values of difference in SWH were observed at high water levels, indicating that water levels regulate modulations in wave height in this area, consistent with findings in nearshore waters (Yu et al., 2017). A large increase in wave height of ∼1.5 m occurred at the Dawanshan station during high-water levels. The difference in SWH at the Denglongshan station was also significant at −0.25 and 0.4 m at low and high water levels, respectively. A much weaker correlation was observed at the Nansha and Hengmen stations, which can be attributed to the sheltering effect of the shoreline.
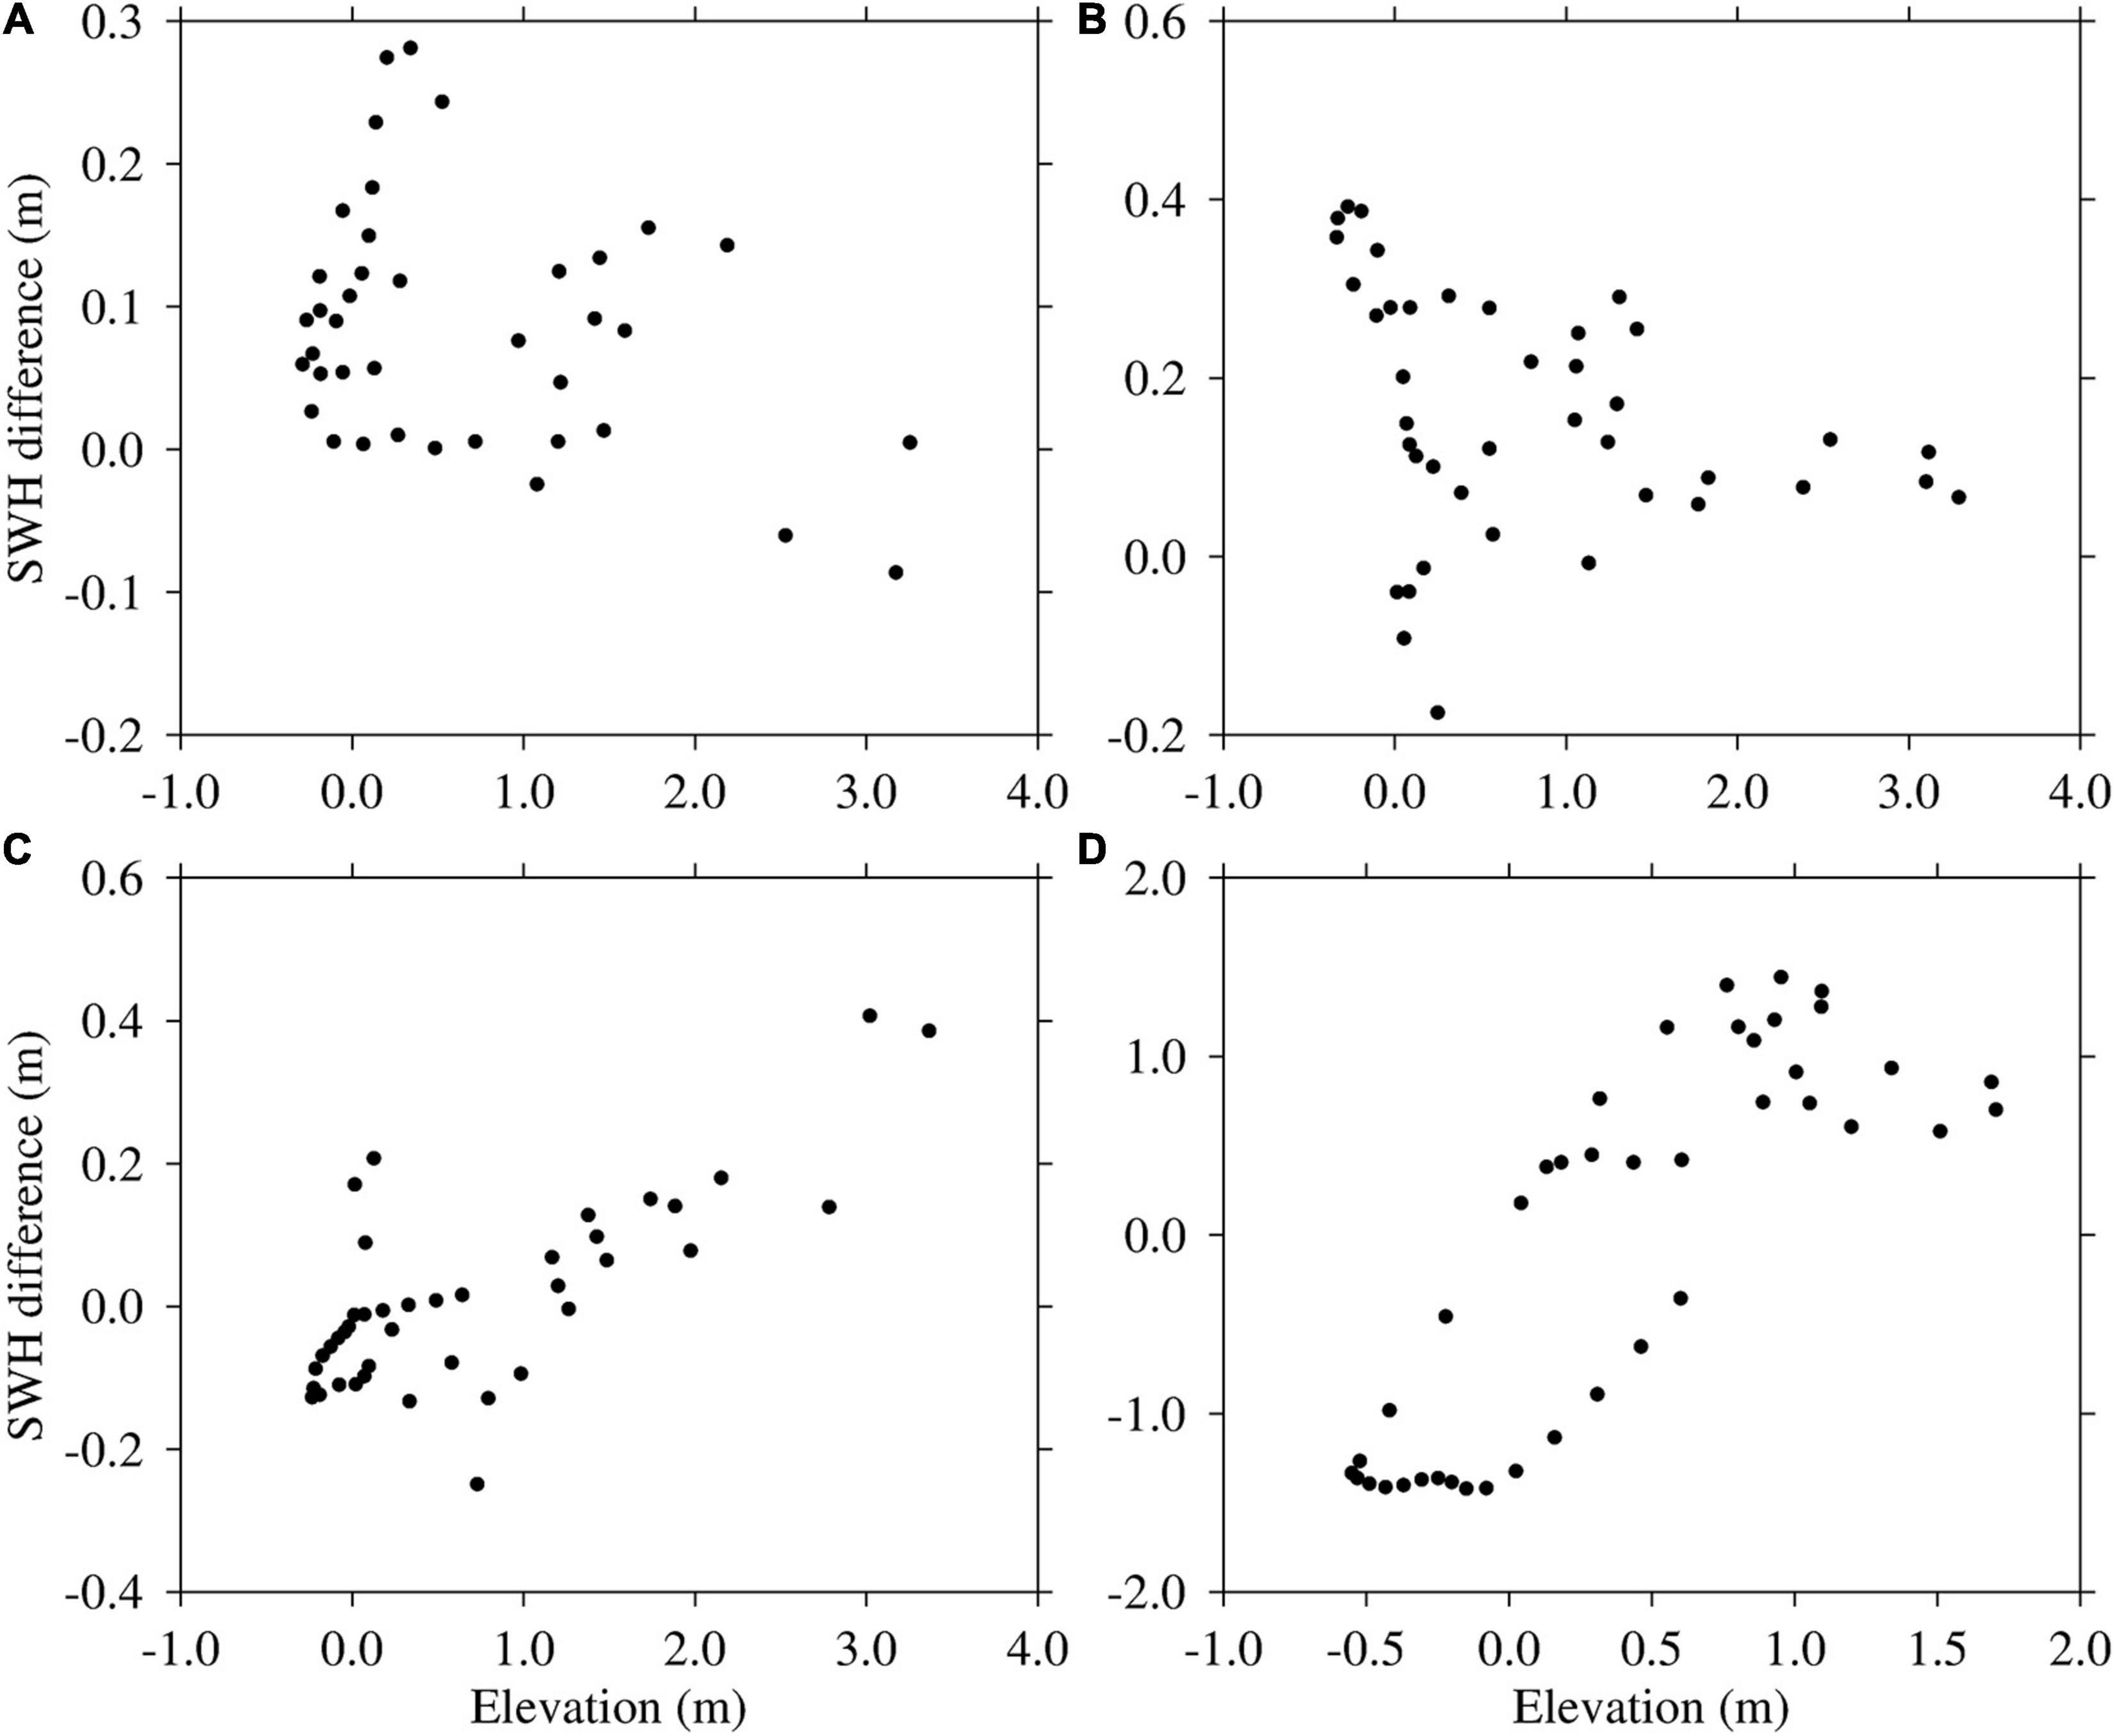
Figure 9. Relationship between the difference in significant wave height (SWH) and elevation at the (A) Nansha, (B) Hengmen, (C) Denglongshan, and (D) Dawanshan stations during super typhoon Mangkhut (2018) in the Pear River Estuary, Guangdong, southern China.
Discussion
Influence of the Spring–Neap Cycle
Figure 10 shows the propagation of storm surge along the river channel. Several sites were selected along Sec. 1 and Sec. 2 (shown in Figure 1). The characteristics of the propagation of storm surge and wave setup along river channels were different among different areas during the spring-neap cycle. The storm surge gradually increased during spring tide, reaching a maximum of 3.5 m at Denglongshan in Sec. 1 (Modaomen waterway), following which it decayed upstream along the waterway. The travel of the storm surge upstream along the Modaomen waterway was inhibited since this waterway is a river-dominated outlet. The wave setup reached a maximum value of 0.13 m at DHQ, following which it rapidly decreased upstream along the waterway. The contribution of wave setup to total storm surge decreased from 4% (DHQ) to 1% (TH), illustrating that the contribution of waves was negligible. In Sec. 2 (Shiziyang-Houhangdao), the storm surge gradually increased from DH to the upper reaches of the river, reaching a maximum of 4.0 m around ZD. As described in previous studies (e.g., Gong et al., 2018), the PRE is a funnel-shaped estuary, with its width decreasing from 50 km at the mouth to 6 km at the head (the Humen outlet Figure 1). It is further connected to the upstream river network. The water depth of the PRE ranges from <5 m in the shoals to >20 m in the channels. Ou et al. (2016) found that 51.2% of the total tidal wave energy is transported to the upstream river network through Humen, which is a tidal-dominated outlet. The tidal wave energy converged, resulting in a rise in water level from the lower to the upper river channels. The change in wave setup along the river channel was minimal, with the maximum value remaining at ∼0.1 m. The contribution of wave setup to total storm surge decreased from 4% (DH) to 2% (ZD).
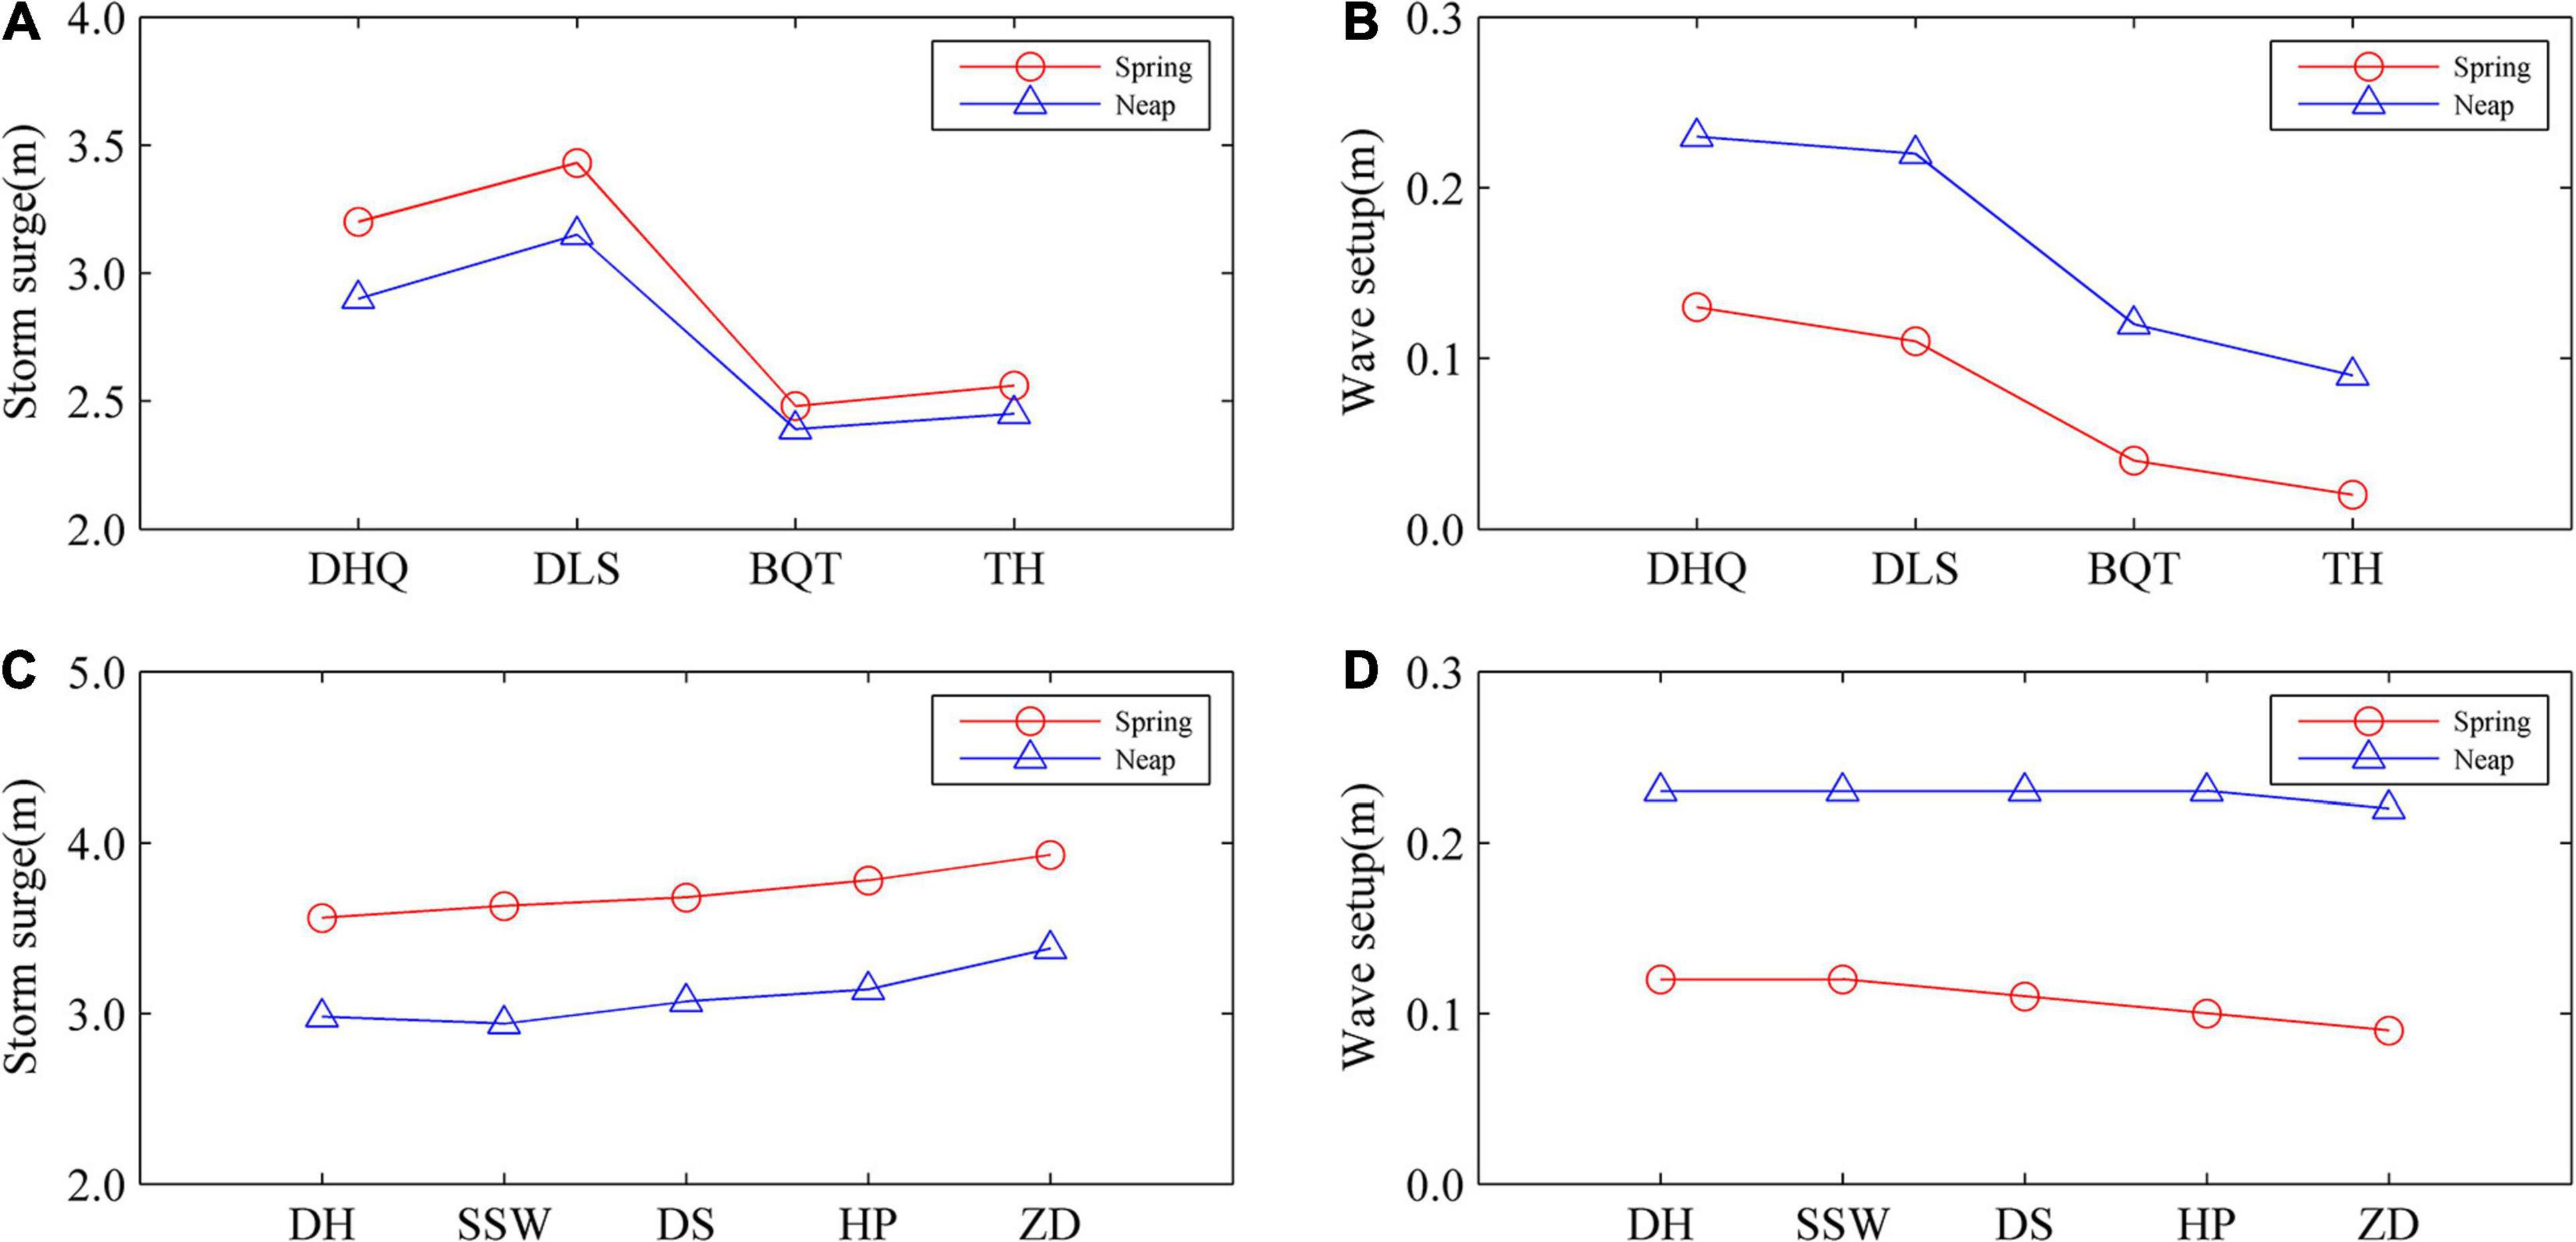
Figure 10. Longitudinal distribution of maximum storm surge and maximum wave setup at Sec. 1 (A,B) and Sec. 2 (C,D) during super typhoon Mangkhut (2018) in the Pear River Estuary, Guangdong, southern China.
The longitudinal variation in storm sure during neap tide was similar to that during spring tide. The maximum storm surge along the river in Sec. 1 declined compared to that at spring tide. The maximum storm surge ranged from 3.2 m (DLS) to 2.4 m (BQT). However, the wave setup increased compared to that at spring tide, ranging from 0.23 m (DHQ) to 0.12 m (TH). The contribution of waves to storm surge increased slightly from 5 to 8%. The storm surge ranged from 3.0 to 3.4 m in Sec. 2, approximately 0.5 m lower than that during the spring tide. Wave setup increased along the river to ∼0.22 m. This contributed to the relatively lower water level during neap tide, whereas wave height increased due to the shoaling effect and decreased due to directional spreading, bottom friction, and wave breaking, thereby generating wave radiation stress. Thus, wave height generated a greater radiation stress compared to that during the spring tide, which contributed to a greater wave setup.
Influence of River Discharge
The interaction between runoff and storm surge in the river network may enhance the water level, thereby increasing the risk of storm surges. Five groups of experiments (Table 1) were established to explore the influence of runoff on storm surge and wave setup. The maximum elevation was increased in Sec. 1, with an increase in runoff at the TH and BQT stations (Figure 11). Although the TH and BQT stations are located in the upstream reaches of the river and are greatly affected by runoff, the elevations of the DHQ and DLS stations were almost unaffected by runoff, indicating that these stations were mainly affected by tidal dynamics. The maximum storm surge decreased with increasing runoff at the TH and BQT stations. This result could be attributed to the effect of runoff increasing and the effect of storm surge decreasing with increasing runoff. The storm surges at the DHQ and DLS stations were almost unaffected by runoff, indicating that the surge was mainly regulated by wind stress. There was little change in wave setup, implying that river discharge had little effect on wave setup.
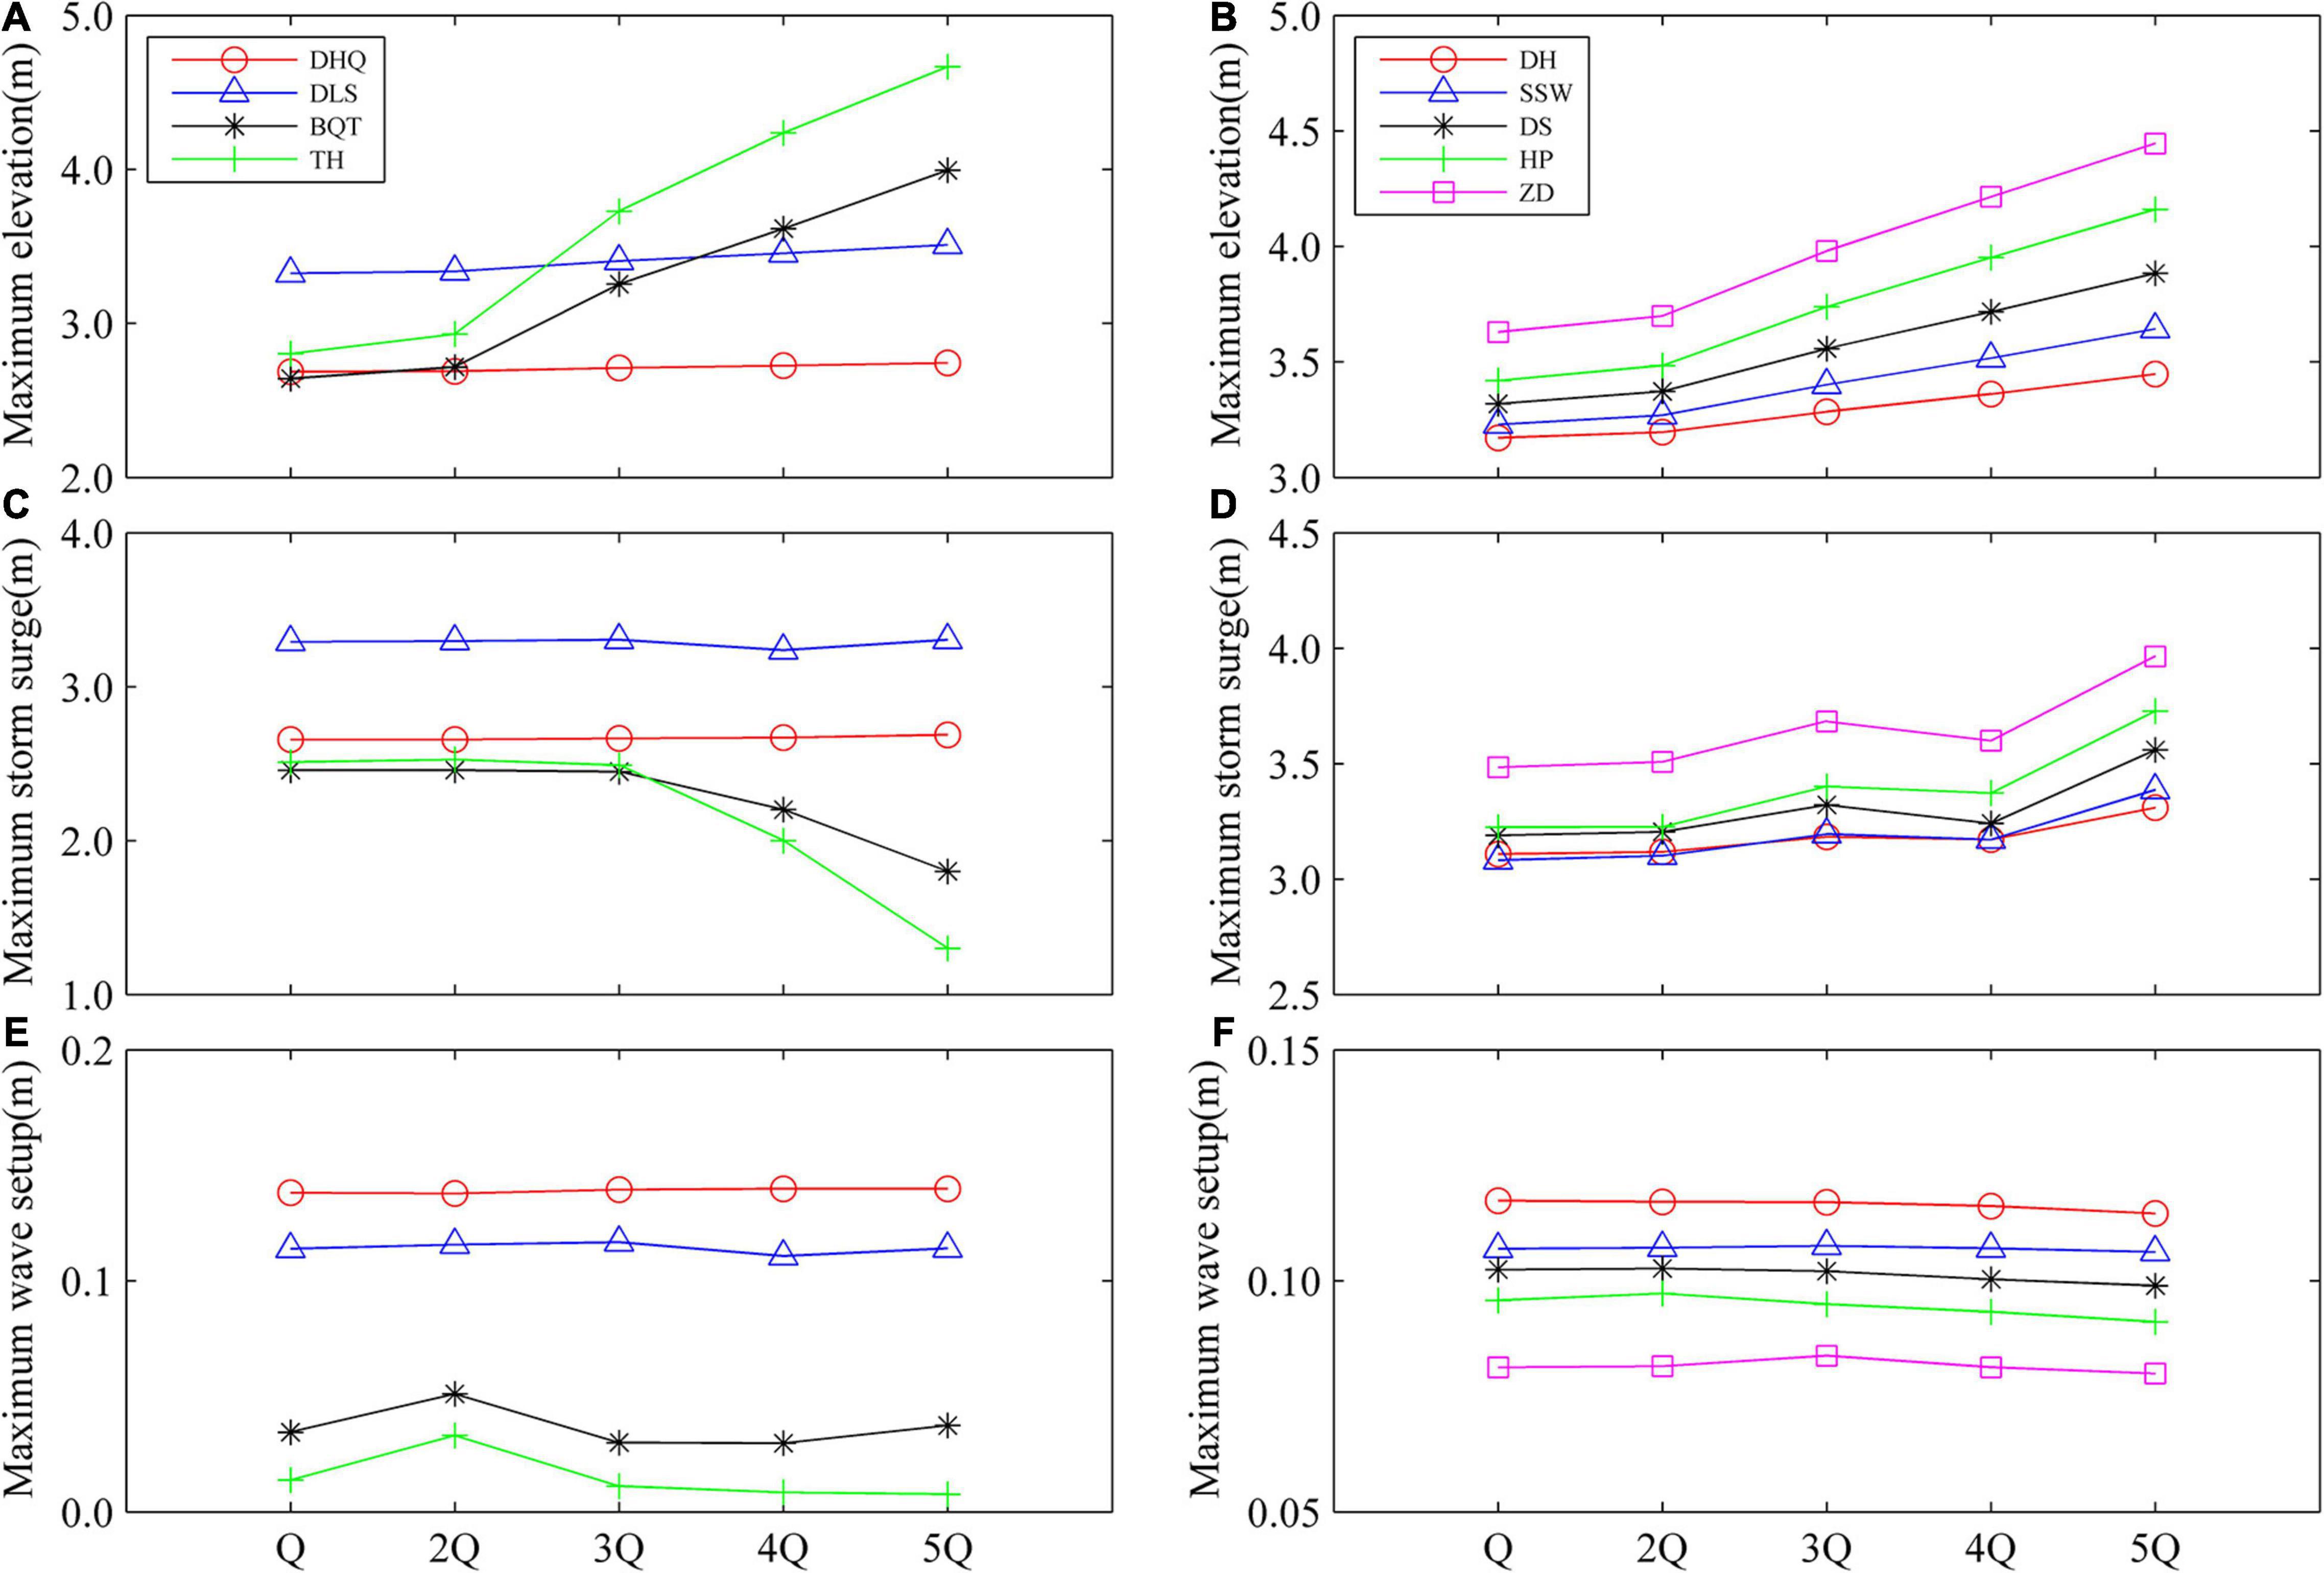
Figure 11. Longitudinal distribution of maximum elevation, maximum storm surge and maximum wave setup at Sec. 1 (A,C,E) and Sec. 2 (B,D,F) under different runoff conditions during super typhoon Mangkhut (2018) in the Pear River Estuary, Guangdong, southern China.
The maximum elevation in Sec. 2 increased with increasing runoff at all stations. The maximum elevation increased linearly when runoff exceeded 2Q. Storm surge showed a rising trend similar to that of elevation. Shiziyang-Houhangdao is a tidal-dominated channel that is affected by upstream flow. Since the river-surge interaction is stronger, the water level and storm surge increased with increasing runoff. The change in wave setup was minimal, implying that river discharge has little effect on wave setup in Sec. 2.
Conclusion
The present study examined the effects of WCI on storm surge in the PRE using a fully coupled SCHISM-WWW-III model. The validation of the model simulations against wind vector, wave, and water level observations around the PRE demonstrated the ability of the coupled model to reproduce the storm surge and SWH during super typhoon Mangkhut. By including the wave effect, the simulations of the coupled model were more closely correlated with observations compared to that of the uncoupled model. Four case studies were examined to assess the influence of WCI in simulating a storm surge. The results showed that wind waves play an insignificant role in generating the wave setup. The waves break gradually with propagation toward the shore, resulting in the generation of wave radiation stress. This stress is exerted on the mean flow, thereby inducing wave setup. The maximum wave setup was ∼0.23 m and could contribute up to 8% of the total near-shore storm surge. The wave setup broadly followed the evolution of SWH. The effects of wave setup were positively related to SWH. Although water levels regulated offshore wave modulations, they had little influence in the coastal area. The storm surge increased with transport upstream in a tidal-dominated outlet, whereas it decreased in a river-dominated outlet. The storm surge and wave setup increased and decreased during spring tide compared to that during neap tide, respectively. The storm surge increased with increasing runoff in the upper river reaches, whereas there was little change in the tidal-dominated lower river reaches. The present study highlights the multiple dynamic factors that play critical roles in the forecasting of storm surge and provides a reference for similar studies in other estuaries with multiple outlets and a complex river network. In addition, the results of the present study can contribute to regional coastal protection and environmental management.
Data Availability Statement
The raw data supporting the conclusions of this article will be made available upon formal request to the correspondence author.
Author Contributions
ZL: conceptualization, methodology, and original draft. BH, XC, and JQ: review and editing. CT: formal analysis. GH: data curation. All authors contributed to the article and approved the submitted version.
Funding
This work was supported by the National Key Research and Development Program of China (2016YFC0402603), the National Natural Science Foundation of China (42076171), the Guangdong Science and Technology Project (2017A070701011 and 2018B020207004), the Guangdong-Hong Kong Joint Laboratory for Water Security (2020B1212030005), and the Open Research Foundation of Guangdong Key Laboratory of Hydrodynamic Research [gdsky(2018)001].
Conflict of Interest
The authors declare that the research was conducted in the absence of any commercial or financial relationships that could be construed as a potential conflict of interest.
Publisher’s Note
All claims expressed in this article are solely those of the authors and do not necessarily represent those of their affiliated organizations, or those of the publisher, the editors and the reviewers. Any product that may be evaluated in this article, or claim that may be made by its manufacturer, is not guaranteed or endorsed by the publisher.
Acknowledgments
We deeply acknowledge the reviewers for their valuable comments and suggestions.
References
Bolaños, R., Brown, J. M., and Souza, A. J. (2014). Wave-current interactions in a tide dominated estuary. Cont. Shelf Res. 87, 109–123. doi: 10.1016/j.csr.2014.05.009
Chen, Q., Wang, L., Zhao, H., and Douglass, S. (2005). “Prediction of storm surges and wind waves in mobile bay. AL,” in Proceedings of the Solutions to Coastal Disasters Conference, (Virginia: American Society of Civil Engineers).
Chen, W. B., Lin, L. Y., and Jang, J. H. (2017). Simulation of typhoon-induced storm tides and wind waves for the Northeastern coast of taiwan using a tide–surge–wave coupled mode. Water 9:549. doi: 10.3390/w9070549
Chen, Y., Chen, L., Zhang, H., and Gong, W. (2019). Effects of wave-current interaction on the Pearl river Estuary during Typhoon Hato. Estuar. Coast. Shelf Sci. 228:106364. doi: 10.1016/j.ecss.2019.106364
Egbert, G. D., and Erofeeva, S. Y. (2002). Efficient inverse modeling of barotropic ocean tides. J. Atmos. Oceanic Technol. 19, 183–204. doi: 10.1175/1520-0426(2002)019<0183:eimobo>2.0.co;2
Gao, J. J., Zhu, J. R., and Duan, Y. H. (2012). Impacts of the symmetrical and unsymmetrical typhoons on the storm surge simulation in the East China and the South China Seas (in Chinese with English abstract). J. East China Normal Univer. 06, 57–72.
Gong, W., Chen, Y., Zhang, H., and Chen, Z. (2018). Effects of wave–current interaction on salt intrusion during a typhoon event in a highly stratified estuary. Estuaries Coasts 41, 1–20.
Guan, S. D., Li, S. Q., Hou, Y. J., Liu, Z., and Feng, J. (2018). Increasing threat of landfalling typhoons in the western North Pacific between 1974 and 2013. Int. J. Appl. Earth Obs. Geoinf. 68, 279–286. doi: 10.1016/j.jag.2017.12.017
He, Z., Yanling, T., Yuezhang, X., Chen, B., Xu, J., and Yu, Z. (2020). Interaction impacts of tides, waves and winds on storm surge in a channel-island system: observational and numerical study in Yangshan Harbo. Ocean Dyn. 70, 307–325. doi: 10.1007/s10236-019-01328-5
Huang, G. L., Huang, B. S., and Tan, C. (2018). Response of saltwater activity of Modaomen Estuary of Pearl River to Inter-basin Water Transfer Project(in Chinese with English abstract). Water Resour. Power 36, 66–70.
Huang, G. L., Tan, C., and Huang, B. S. (2020). Numerical simulation of sand-erosion and silting process in Modaomen estuary during a storm wave(in Chinese with English abstract). Trans. Oceanol. Limnol. 6, 27–36.
Li, A. L., Guan, S. D., and Mo, D. X. (2020). Modeling wave effects on storm surge from different typhoon intensities and sizes in the South China Sea. Estuar. Coast. Shelf Sci. 235:106551. doi: 10.1016/j.ecss.2019.106551
Liu, W. C., and Huang, W. C. (2020). Investigating typhoon-induced storm surge and waves in the coast of Taiwan using an integrally-coupled tide-surge-wave model. Ocean Eng. 212:107571. doi: 10.1016/j.oceaneng.2020.107571
Longuet-Higgins, M. S., and Stewart, R. W. (1962). Radiation stress and mass transport in gravity waves, with application to ‘surf beats’. J. Fluid Mech. 13, 481–504. doi: 10.1017/s0022112062000877
Longuet-Higgins, M. S., and Stewart, R. W. (1964). Radiation stresses in water waves; a physical discussion, with applications. Deep Sea Res. 11, 529–562. doi: 10.1016/0011-7471(64)90001-4
Luo, Z. F., Huang, B. S., and Tan, C. (2020). Development and application of the storm surges numerical model around Guangdong-Hong Kong-Macao Greater Bay Area(in Chinese with English abstract). Guangdong Water Resour. Hydropower 11, 58–63.
Malhadas, M. S., Leitao, P. C., Silva, A., and Neves, R. (2009). Effffect of coastal waves on sea level in Óbidos Lagoon. Portugal. Cont. Shelf Res. 29, 1240–1250. doi: 10.1016/j.csr.2009.02.007
Ou, S. Y., Tan, F., and Guo, X. J. (2016). Propagation and damping of tidal energy in the pearl river delta. Haiyang Xueba 38, 1–10. doi: 10.3969/j.isn.0253-4193.2016.12.001
Park, Y. H., and Suh, K. D. (2012). Variations of storm surge caused by shallow water depths and extreme tidal ranges. Ocean Eng. 55, 44–51. doi: 10.1016/j.oceaneng.2012.07.032
Raubenheimer, B., Guza, R. T., and Elgar, S. (2001). Field observations of wave-driven setdown and setup. J. Geophys. Res. 106, 4629–4638. doi: 10.1029/2000jc000572
Sheng, Y. P., Alymov, V., and Paramygin, V. A. (2010). Simulation of storm surge, wave, currents, and inundation in the outer banks and chesapeake bay during hurricane isabel in 2003: the importance of waves. J. Geophysical Res. Oceans 115.
Svensson, C., and Jones, D. A. (2004). “Sensitivity to storm track of the dependence between extreme sea surges and river flows around Britain,” in Hydrology: Science & Practice for the 21st Century, eds W. Arnell, O. MacIntyre, and G. Kirby (London: British Hydrological Society).
Tanim, A. H., and Akter, A. (2019). Storm surge modeling for Cyclone Mora in the northern Bay of Bengal using a coupled hydrodynamic model. Maritime Eng. 172.
Ueno, T. (1981). Numerical computations of the strom in tosa bay. J. Oceanogr. 37, 61–73. doi: 10.1007/bf02072559
Yu, X. L., Pan, W. R., and Zheng, X. J. (2017). Effects of wave-current interaction on storm surge in the Taiwan Strait: insights from Typhoon Morakot. Cont. Shelf Res. 146, 45–57.
Zhang, L., Shang, S., Zhang, F., and Xe, Y. (2020). Tide-surge-wave interaction in the Taiwan Strait during Typhoons Soudelor (2015) and Dujuan (2015). Appl. Sci. 10:7382. doi: 10.3390/app10207382
Zhang, Y., and Baptista, A. M. (2008). SELFE: a semi-implicit eulerian-lagrangian finite-element model for cross-scale ocean circulation. Ocean Model. 21, 71–96. doi: 10.1016/j.ocemod.2007.11.005
Zhang, Y., Ye, F., Stanev, E. V., and Grashorn, S. (2016). Seamless cross-scale modeling with SCHISM. Ocean Model. 102, 64–81. doi: 10.1016/j.ocemod.2016.05.002
Keywords: tide-surge-wave coupled model, storm surge, wave–current interaction, river discharge, Pearl River Estuary
Citation: Luo Z, Huang B, Chen X, Tan C, Qiu J and Huang G (2021) Effects of Wave–Current Interaction on Storm Surge in the Pearl River Estuary: A Case Study of Super Typhoon Mangkhut. Front. Mar. Sci. 8:692359. doi: 10.3389/fmars.2021.692359
Received: 08 April 2021; Accepted: 08 July 2021;
Published: 29 July 2021.
Edited by:
Zeng Zhou, Hohai University, ChinaReviewed by:
Guoxiang Wu, Ocean University of China, ChinaJennifer M. Brown, National Oceanography Centre, United Kingdom
Copyright © 2021 Luo, Huang, Chen, Tan, Qiu and Huang. This is an open-access article distributed under the terms of the Creative Commons Attribution License (CC BY). The use, distribution or reproduction in other forums is permitted, provided the original author(s) and the copyright owner(s) are credited and that the original publication in this journal is cited, in accordance with accepted academic practice. No use, distribution or reproduction is permitted which does not comply with these terms.
*Correspondence: Zhifa Luo, luozf_sky@foxmail.com