Gas Discharge Resistance and Medium Damage Degree as Hydrate Dissociation at Different Ambient Conditions
 Xueping Chen
 Peng Zhang1*
  Qingbai Wu
- 1State Key Laboratory of Frozen Soil Engineering, Northwest Institute of Eco-Environment and Resources, Chinese Academy of Sciences, Lanzhou, China
- 2University of Chinese Academy of Sciences, Beijing, China
- 3Western China Energy and Environment Research Center, Lanzhou University of Technology, Lanzhou, China
For the investigation on some hydrate dissociation behaviors at different ambient conditions, methane hydrates formed inside porous media with different saturations were dissociated by depressurizations. Plots of the instantaneous flow rate of gas as dissociation versus production pressure as well as deformation of experimental sample versus accumulative amount of released gas were drawn. These two lines slopes are, respectively, characterized as gas discharge resistance and reciprocal of the latter one as damage degree of experimental samples. The results show that these formed hydrates at higher ambient conditions, that is, temperature and pressure, and possess a higher saturation, which is beneficial to discharge gas and to keep experimental samples undamaged. And the nonuniformity of dissociation processes at different layer positions induced by depressurization is inhibited significantly, especially while combining extra heating. Hydrate saturation dominates the total volume loss of these samples under loadings. These conclusions can provide reference for the prediction in gas discharge capability and media damage degree as hydrate dissociation at different experimental and natural ambient conditions.
Introduction
Natural gas hydrates are one kind of ice-like crystalline solids composed of water and gas molecules (Sloan and Koh, 2008). Under high pressure and low temperature, water molecules form polyhedral cavities through hydrogen bonds and gas molecules are encaged inside (Koh, 2002). Various species of gas, ranging from light hydrocarbons like methane, ethane, and carbon dioxide to heavy isobutane and noble gases, can be enclathrated within the water lattices (Reed and Westacott, 2008). Explorations via bore holes in marine sediments confirmed that natural gas hydrates occur widely in nature (Max and Lowri, 1996; Makogon et al., 2007). These reservoirs mainly exist within marine and freshwater sediments at depths greater than 300 m (Khlystov et al., 2013; Naudts et al., 2012). Natural gas hydrate is also called methane hydrate (Kvenvolden and Rogers, 2005) because the main gas component is methane. As estimated, the amount of carbon stored in natural gas hydrate is about twice the total amount of exploitable hydrocarbon reserves stored in the form of fossil fuels (Kvenvolden, 1988; Milkov, 2004; Wallmann et al., 2012).
Initially, owing to considerable amounts of plugs formed within the pipelines, natural gas hydrates attracted a great deal of attention. These plugs caused severe economic losses such as the production and transportation of natural gas and oil (Sloan, 2005; Gbaruko et al., 2007; Mokhatab et al., 2007; Gao, 2008). Methane hydrate has subsequently ignited great interest of enormous amount of research groups around the world as one of the most potential substitutes for the traditional fuels. For the high efficiency exploitation, many research studies have been done to develop the production methods of gas and investigate the production behaviors as hydrate dissociation. The most common methods to dissociate hydrate are 1) thermal stimulation, in which the hydrate reservoirs are heated above the temperature of equilibrium decomposition, and 2) depressurization, the pressure of reservoir is reduced below that of equilibrium decomposition (Wang et al., 2016). Under these two methods, the local P‒T conditions remaining hydrate stable are altered and then hydrate is dissociated into water and gas.
At a laboratory scale, hydrate dissociation behaviors have been widely investigated by the controlled thermal stimulation and depressurization (Chong et al., 2016). In general, thermal stimulation includes change in environmental temperature by water or air bath heating (Pang et al., 2009; Linga et al., 2009; Mekala et al., 2014; Zhao et al., 2012), hot fluid injection into the hydrate sample (Tang et al., 2005), and heat supplying through point sources (Fitzgerald and Castaldi, 2005). Of these, water or air bath heating is just a research method used in the laboratory but not feasible in the field (Chong et al., 2016). However, these methods can be used to simulate the ambient temperature changes under which methane hydrate is exploited in the laboratory. And the depressurization can be performed in different temperature ranges. For example, at 273–275 K, the dissociation behaviors of methane hydrate when being depressurized to three different pressures, that is, 0.1, 0.93, and 1.93 MPa, were compared (Tang et al., 2007), which showed that the dissociation rate at the lowest pressure 0.1 MPa was the fastest. With production pressure ranging from 4.5 to 5.6 MPa, the gas production behavior from methane hydrate in a porous sediment was also investigated at 281.15 K (Li X. S. et al., 2012). Further research shows that the gas production process was mainly influenced by the depressurization rate, heat from ambient environment, and free gas saturation in hydrate deposits (Li et al., 2014). In a range between 272 and 289 K, a significant thermal buffering phenomenon, that is, the temperature decreased to and maintained below 272.7 K until above 95% of the dissociation process was completed, was observed in the middle section of the samples during methane hydrate dissociation by rapid depressurization to 0.1 MPa (Circone et al., 2000). The authors highlighted that for the depressurization method, heating is required. A combination of these two methods is finally widely deemed as an effective technique to enhance the gas production efficiency significantly. Effectiveness of the combined method, named the huff and puff, in enhancing the production of gas has been investigated by some groups (Li et al., 2011; Li B. et al., 2012; Wang et al., 2014). By comparing the energy efficiency difference among the single-well depressurization, five-spot thermal stimulation, and the combination of them, under similar saturation and environment conditions, it was found that efficiency of the combination was enhanced by 15 times comparing with the sole thermal stimulation (Wang et al., 2013).
In nature, methane hydrate is generally deemed to exist within marine and freshwater sediments below water depths more than 600 m and in intermediate water depths 1,000–3,000 m (Kvenvolden, 1993). Some exceptions have, however, also been found, for example, one location in the Arctic Ocean where hydrate occurs at depths of only 250 m and the ambient temperature is −1.5°C (Buffett and Archer, 2004). The ambient temperature in sediments under the sea or lake floor changes as a function of the geothermal and hydrothermal gradients of specific natural environment. These gradients have location or seasonality properties (Milkov et al., 2000; Buffett and Archer, 2004). The influence of specific ambient conditions on the dissociation behaviors of methane hydrate should therefore be taken into account during actual exploitation. Besides, the enhancement on gas production efficiency is the most important research target of methane hydrate dissociation in general. The flow behaviors of gas and liquid through porous sediments also have significant importance to the hydrate reservoir exploitation. As pointed out by Chong et al. (2016), the change patterns of them at different pressure conditions and hydrate saturation should also be well understood. Along with changes in measured resistivity, Li B. et al. (2012); Li X. S. et al. (2012) analyzed the water flow property in the porous sediment during dissociation processes of methane hydrate. Chen et al. (2019) pointed out that depressurization decreases the flow resistance of the water phase and optimizes the water flow environment during the hydrate dissociation. By comparison, change patterns of gas flow resistance in media as dissociation have rarely been reported, and damage situation of media following continuous gas discharge has rarely been mentioned.
For the thorough understanding on gas discharge law and medium damage as a hydrate dissociation process, methane hydrate was formed within porous media using an air-cooling method at different temperatures. The ambient temperature of the experimental sample was then regulated through an electric heating board on top, and the as-formed hydrate was dissociated through different production pressures. The change patterns of gas, the flow resistance, and the sample deformation were investigated during the entire hydrate dissociation. Possible influence of the hydrate dissociation process on its sediment skeleton was analyzed through gas discharge resistance and sample deformation. This study provides some guidance for the safe gas extraction from methane hydrates formed in porous structures. The main conclusions of this article can be summarized as follows:
1) Hydrates formed at high temperatures and pressures possess high saturations; 2) higher condition (i.e., high pressure and temperature) is beneficial to discharge gas and keep the sample undamaged as hydrate dissociation; and 3) the gas discharge resistance is mainly controlled by the viscosity of dissociation product—water, and the total loss of sample volume under some loading is dominated by hydrate saturation.
Experiments
Experimental Apparatus and Materials
The apparatus used in this work has been employed to investigate the influence of temperature on methane hydrate formation in porous media (Zhang et al., 2017). As shown in Figure 1, the apparatus involves a high-pressure reactor, a digitally controlled gas pump, a back pressure valve and a digital gasometer. The reactor has a diameter of 6.2 cm and a height of 19 cm, and is fixed in an air bath with a size of 80 cm × 50 cm × 80 cm, which is made of 316 stainless steels. The top cover of the reactor is unfixed, and a mechanical load ranging 0–50 MPa can be exerted with a digital hydraulic pump. A digital displacement meter is mounted on the top, ranging 0–100 mm with a resolution of 0.01 mm. Three pin-type temperature sensors, labeled T1, T2, and T3 in Figure 1, are vertically mounted on the reactor, ranging −20–50°C, the resolution is 0.01°C, and the heights are 7.0, 5.1, and 3.1 cm, respectively. An electric heater is mounted on the top of the reactor. Two pressure sensors, P1 and P2, connect to the top and bottom ends through a stainless steel conduit, respectively, with a range of 0–50 MPa and a precision of 0.001 MPa. The reactor is pressurized through a digital gas pump. Through the software Falcon, the pumps and heater are controlled, and all the parameters are logged and stored at intervals of 5 s.
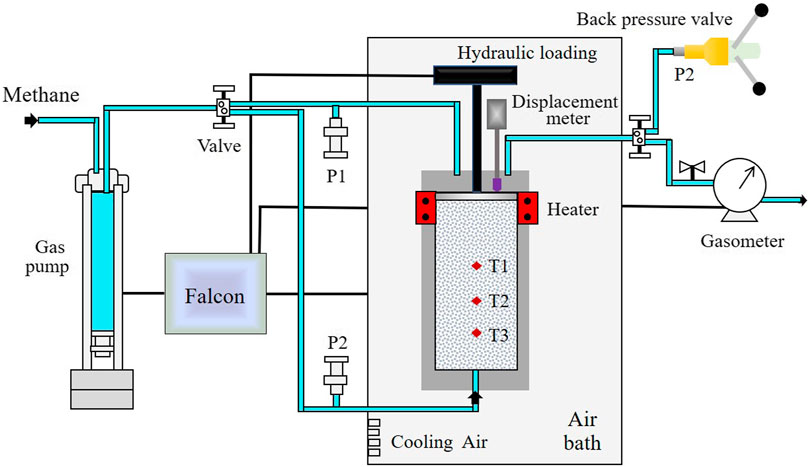
FIGURE 1. Schematic of the apparatus.
Silica gel powder with an average particle size of 25–58 μm was chosen as the experimental medium. The density is 0.35 g/cm3 and the porosity is 77.44%. Being water saturated, the mass ratio of water to silica gel (Wwater/Wmedia) is 2.2:1. A fixed ratio of 1.5:1 was used in the all experiments, that is, 68% water saturation. Specific used amounts of water are exhibited in Table 1. The methane gas purity is 99.99%.
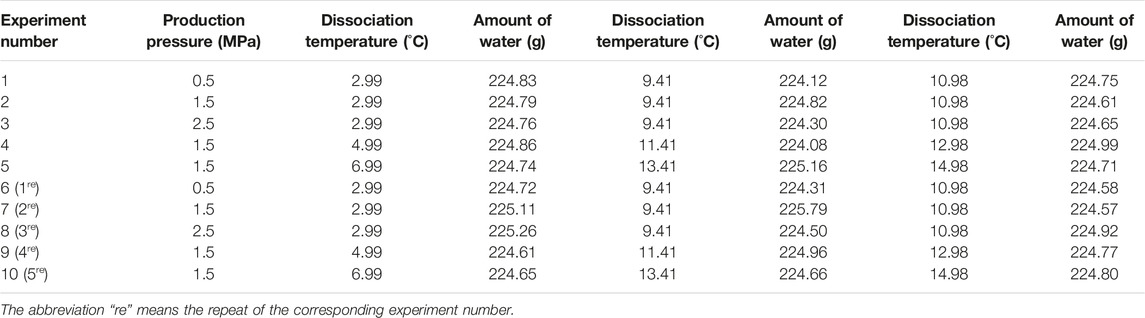
TABLE 1. Specific dissociation conditions of experimental media containing hydrate.
Experimental Procedure
Three predetermined pressures, that is, 5, 10, and 12 MPa, were chosen, and the corresponding equilibrium temperatures were calculated as 6.49, 12.91, and 14.48°C by the software CSMGem (Gas Hydrate Center, Colorado School of Mines). Before hydrate formation, the mixed medium was charged into the reactor until the height reached 14 cm. The whole experimental system was then slowly purged for about 5 min with the methane gas at atmospheric pressure, removing the residual air. A mechanical load of 3 MPa higher than the predetermined pressure was exerted on the sample top to compact through the hydraulic pump (Figure 1). The temperature of the reactor was rapidly reduced to the initial preparatory value with the air bath. After the sample was slowly pressurized to the predetermined pressure, the pump volume was maintained at a constant volume of 450 ml. The whole system was left undisturbed overnight to make the gas dissolve sufficiently. Subsequently, the temperature was uniformly reduced by 3.5°C at a fixed cooling rate of 1°C/h and maintained constant for more than 36 h to form hydrates completely. Hence, the final temperatures at which the formed hydrates were dissociated were 2.99, 9.41°C, and 10.98°C, corresponding to the predetermined pressure 5 MPa, 10 MPa, and 12 MPa, respectively.
Before hydrate dissociation, the valve between the gas pump and reactor was closed. Two methods, that is, sole depressurization and a combination with top heating, were employed to dissociate the as-formed hydrates at different ambient conditions. Three production pressures, that is, 0.5, 1.5, and 2.5 MPa, were manually set by a back pressure valve. Two combinations were performed as follows: the reactor top was heated by 2 and 4°C under a constant production pressure 1.5 MPa. The gasometer measured the instantaneous flow rate of released gas during the dissociation, at atmospheric pressure and room temperature. To ensure the results reliability, all the dissociation experiments were repeated, and the detailed conditions are exhibited in Table 1.
Calculation Methods
The unit of data measured by the gasometer was in L/min. The amount of gas was calculated through the following gas equation:
Through calculation, the compressibility factor Z of methane gas at atmospheric pressure and room temperature is 0.9982. At standard temperature and pressure conditions, the per unit volume of hydrate releases 164 volumes of methane gas after dissociation. The conversion ratio of water was then calculated with the accumulative volumes of released gas. The saturation of hydrates formed in the medium was calculated with the following equation:
where Sh is the hydrate saturation, Vw is the volume of liquid water in the sample, η is the calculated conversion ratio of water to hydrate, V is the volume of the experimental sample, and ϕ is the porosity, which is 77.44%. The coefficient 0.99 expresses the volume difference between solid hydrate and liquid water.
Using Darcy’s law (Eq. 3) for reference, the permeability capability of gas during the dissociation processes of hydrate can be expressed with the permeability coefficient of medium K. The expression of Darcy’s law is as follows:
where Q is the amount of liquid flowed out in unit time, K is the permeability coefficient, ω is the wetted cross section, h is the water head loss, and L is the permeability path. In this work, the water contents (Table 1) and heights of the media are almost similar. The cross section of the reactor is fixed (Figure 1). Hence, the permeability of gas during dissociation is expressed as follows:
where Q is the measured instantaneous flow rate of gas (L/min) and h is the set production pressure (MPa). Because the measured parameter during dissociation is the gas flow rate, the reciprocal of permeability coefficient K, that is, 1/K ((min·MPa)/L), characterizes the gas discharge resistance.
While dissociating into gas and water, the hydrate volume shrinks by 1%. Hence, the change pattern of the experimental sample volume along with the released gas amount was also investigated. Because the cross section of the reactor is fixed (Figure 1), the volume can be expressed with the sample length. The change pattern is hence expressed as follows:
where Vc is the change degree of the experimental sample volume (mm/L), D is the deformation of the sample (mm), and Vg is the accumulative amount of the released gas (L). Vc also characterizes the sample damage degree while discharging unit volume of gas.
By plotting Q versus h and D versus Vg using Excel, the gas discharge resistance and damage degree of the sample along with hydrate dissociation processes were calculated and discussed. For simplicity, the specific ambient condition while dissociating was symbolized with the predetermined pressure value to form hydrates, that is, 5, 10, or 12 MPa, in the following sections.
Results and Discussion
Influence of Different Conditions on the Hydrate Formation Process
Using a semi-batch cooling method, methane hydrate was formed in porous media. As shown in Figure 2, the hydrate formation process shows two distinct stages (AB and CD). After undergoing an induction period (denoted by sections AB and PC) of rapid temperature reduction, hydrate begins nucleating, and the temperatures at three different layer positions rise suddenly (BC section). Then, the temperatures slowly decrease along with a significant pressure drop (CD section). All the parameters finally tend to remain stable (after point D) when the hydrates are thoroughly formed. Because the change patterns of pressure and temperatures at other formation conditions are similar, the representative formation process at the predetermined pressure 10 MPa with a dissociation production pressure 2.5 MPa was only exhibited in Figure 2. The sudden temperatures rise from B to C is caused by the rapid heat releasing while nucleating. After that, hydrate crystals slowly grow, and methane gas is fiercely consumed. The curves of pressure and temperatures remain stable after the formation process is finally completed. The high similarity between the three temperature curves indicates that hydrates were uniformly formed at the different layer positions inside the porous medium.
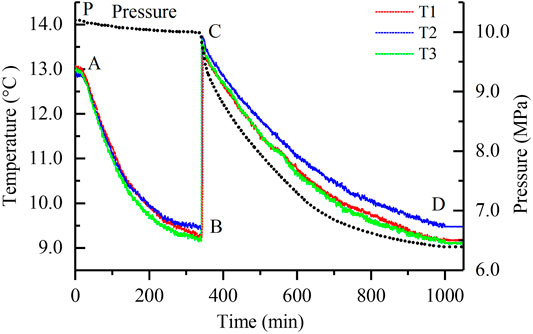
FIGURE 2. Changes in temperature and pressure inside the reactor during the hydrate formation at the predetermined pressure 10 Mpa.
The experimental results show that formation conditions at which hydrate was formed have a significant influence on saturation. As shown in Figure 3, the saturations tend to gradually increase along with pressure rise. The average value of saturation is 26.7% at 5 MPa, 38.6% at 10 MPa, and 44.1% at 12 MPa, that is, when pressure increases by 5 and 7 MPa, the hydrate saturation increased to 1.45 and 1.65 times of the original, respectively. Studies have shown that lower temperatures lead to the easier generation of such hydrate clathrate structures including some unstable pseudocages (defective structures) that are empty, or occupied by water molecules; while at higher temperature, these defective structures are efficiently inhibited (Guo and Rodger, 2013). As stated above, these symbolized pressures in Figure 3 correspond to the dissociation temperatures 2.99, 9.41°C, and 10.98°C (Table 1), from low to high. In this work, a fixed cooling magnitude of 3.5°C and a cooling rate of 1°C/h were employed to form hydrates. These hydrates formed at higher temperatures hence have the higher saturations and less structure defects.
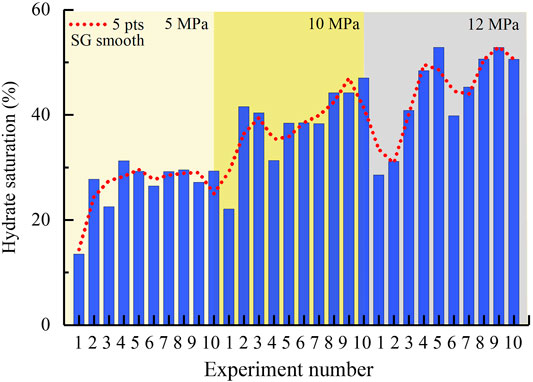
FIGURE 3. Saturations of hydrates formed at different ambient conditions. The smooth curve was calculated with points of window five and polynomial order 3.
Gas Discharge Resistance and Medium Damage Degree as Dissociation
With a back-pressure valve, different production pressures were regulated to dissociate the as-formed hydrates. As shown in Figure 4, for one complete hydrate dissociation, several times of depressurization performances are required. During each one, the change patterns of production pressure show obvious synchronism with that of gas releasing, showing that the stability of hydrates is significantly affected by the pressure decline (Figure 4A). A fixed production pressure corresponding to the pressure inside reactor was provided to dissociate hydrate (Figure 4B). Because the valve was manually regulated, some slight differences occur between the two different performances (Figures 4A,B). But, the pressure difference between the top and bottom of the reactor (P1 and P2 in Figure 1) remains less than 0.01 MPa constantly (Figure 4B) over the entire dissociation process. Based on the synchronism between the gas releasing and production pressure, the releasing rates (Q, L/min) were then plotted against the corresponding production pressures (h, MPa). As shown in Figure 5A, there is a significant linear relationship between them during each depressurization (Figure 4A) as well as between the sample deformation (D, mm) and accumulative amount of released gas (Vg, L) (Figure 5B). The slopes of these two types of lines were then calculated to characterize the gas permeability capability (K, L/(min·MPa)) and the sample damage degree caused by gas discharge (Vc, mm/L), respectively. Among them, the gas discharge resistance as dissociation was characterized by the reciprocal of K. Because one complete hydrate dissociation requires several depressurizations (Figure 5), the calculated values were averaged at each experimental condition.
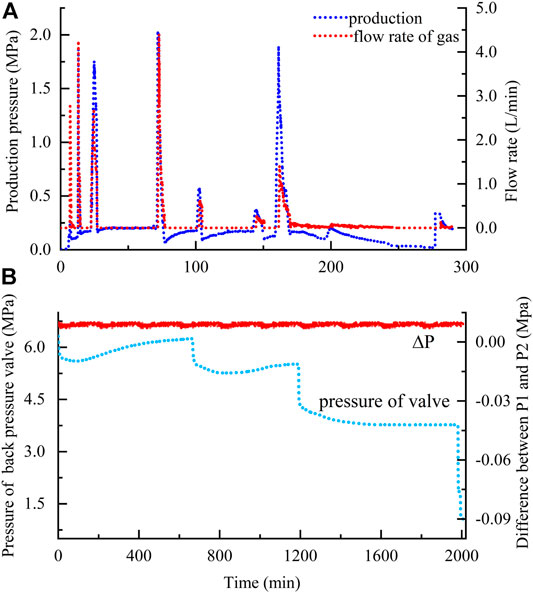
FIGURE 4. Changes in measured parameters as a function of time during dissociation processes: (A) production pressure and flow rate at predetermined pressure 5 MPa through production pressure 2.5 MPa; (B) regulations of a back pressure valve at 5 MPa with production pressure 1.5 MPa in the repeated experiment and pressure difference between P1 and P2 in Figure 1.
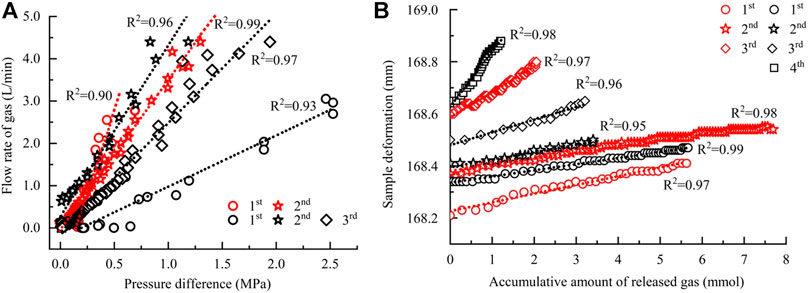
FIGURE 5. Linear relation between the flow rate of gas and production pressure and between deformation of the sample and accumulative amount of gas during dissociation: (A) the former; (B) the latter. More details are listed in Supplementary Table S1.
As shown in Figure 6, along with pressure rise, both the gas discharge resistance (1/K) and sample damage degree (Vc) decrease gradually. The average values are, respectively, 1.05 (min·MPa)/L, 0.062 mm/L at 5 MPa, 0.52 (min·MPa)/L, 0.052 mm/L at 10 MPa, 0.30 (min·MPa)/L, and 0.041 mm/L at 12 MPa. Besides, among all the dissociation methods, the combination of 1.5 MPa production pressure and top heating by 2.0°C is the most favorable for hydrate dissociation, according to the minimum value of gas discharge resistance at each condition in Figure 6, that is, 0.28 (min·MPa)/L at 5 MPa (Point A), 0.25 (min·MPa)/L at 10 MPa (Point B), and 0.144 and 0.145 (min·MPa)/L at 10 MPa (Points C and D). They are all generated by this combined method. By comparison, the performances corresponding to the minimum of the sample damage degree do not have obvious regularity. Basing the similarity between two trend lines in Figure 6, the ratios of discharge resistances to damage degrees were calculated. As shown in Figure 7, both the change pattern and minimum values of ratios are similar with those of the discharge resistances in Figure 6. The ratio gradually decreased along with the rise in pressure condition with an average value 18.30 at 5 MPa, 9.76 at 10 MPa, and 7.68 at 12 MPa, reduced by about 1.8 and 2.4 times, respectively. Due to the significant hydrate saturation difference in all experiments (Figure 3), the relationships among gas discharge resistance, total sample deformation, and hydrate saturation were additionally considered. As shown in Figure 8, along with the rise in saturation, the gas discharge resistance tends to decrease gradually as dissociation, while the total sample deformation shows an obvious increase, with R2 equals to 0.81.
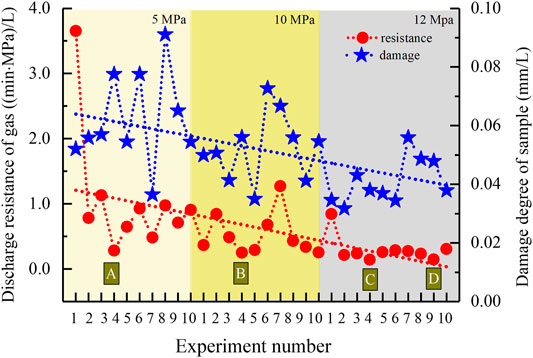
FIGURE 6. Calculated discharge resistance of gas and damage degree of the sample volume during dissociation in all the experiments.
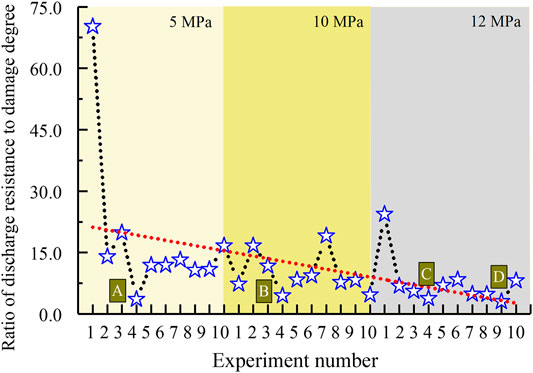
FIGURE 7. Calculation results on ratios of the discharge resistance to damage degree in Figure 6.
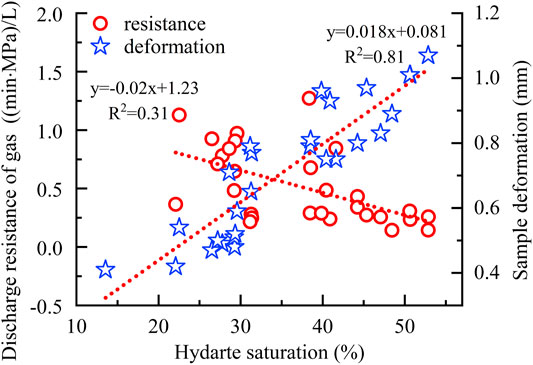
FIGURE 8. Relation among discharge resistance of gas, total sample deformation, and hydrate saturation during the all dissociation. The trend lines were fitted without three obvious abnormal points in experimental results (Supplementary Figure S1).
During each depressurization, the excellent linear relationships in Figure 5 imply the reliability of statistic results in Figure 6. It can be found that the higher ambient condition is beneficial to discharge gas and keep the experimental sample undamaged as hydrate dissociation. The main reason is that higher formation conditions lead to higher hydrate saturations (Figure 3), thus less total pore volume that gas needs to pass inside the sample remains. In accordance with the relation between hydrate saturation and specific ambient condition (Figure 3), the gas discharge resistance logically presents a reverse correlation with hydrate saturation (Figure 8). However, the constant pressure difference between P1 and P2 (Figure 4) in fact means that the released gas can disperse instantly in entire space inside the sample once hydrate dissociates, suggesting that the gas discharge resistance is actually not predominated by the remaining pore spaces after deducting these occupied by solid hydrate. In addition, comparing Figures 6 and 7, it can be found that the change pattern of the ratio during all experiments is similar to that of single gas discharge resistance, especially the four minimum points A to D. Conclusively, the gas discharge resistance is not dominated by the sample damages as hydrate dissociation but the specific dissociation process.
Because the gas discharge resistance has no direct relation with these physical properties of experimental samples to contain hydrate, we infer that the above conclusion is mainly induced by the product properties from dissociation, for example, liquid water and gas released during dissociation of hydrates. Because when the temperature is lowered, the flow activation energy of water molecules reduces significantly, and the molecular collisions and other motions inside the water become more moderate, which enhances the viscosity of liquid water significantly. Relevant measurements showed that when the temperature drops from 10 to 0°C, the viscosity of water increases by 37%, from 1.3069 to 1.7916 (Korson et al., 1969). In addition, a decrease in temperature results in a reduction in the distance between molecules, and the chemical bonds of gas–water and water–medium will be strengthened, leading to a further increase in the viscosity of water. Moreover, because the hydrates were all formed above 0°C, the liquid water existing in the media could not be converted into hydrate absolutely (Figure 3). As a consequence, the lower the temperature is, the more residual liquid water remains in the pores of samples after hydrate formations. It is then more difficult for the released gas to escape from the liquid water at the lower ambient temperature. And the samples will be damaged more seriously by these dissociations with a longer discharging process, that is, greater skeleton deformation of hydrate sediments. Additionally, the loss of the total sample length exhibits a significant positive correlation with hydrate saturation (Figure 8), implying that in all experiments, the total loss of the sample volume under some mechanical loadings after dissociation is dominated by the hydrate saturation.
Influence of Different Dissociation Methods on Each Layer
Using the three pin-type temperature sensors mounted in the reactor vertically, changes in temperature at different layers inside one sample were measured during dissociation. Owing to the similarity with the change patterns of temperatures at other ambient conditions, only two representatives at 10 and 12 MPa are exhibited in Figure 9. As shown, the change patterns are significantly influenced by the dissociation methods. Like the pressure curves in Figure 4, the change patterns of temperature curves also show that several times of depressurizations are required to dissociate the as-formed hydrate completely, that is, the sections AB, BC, DE, and EF at 12 MPa and AʹBʹ, CʹDʹ, and EʹFʹ at 10 MPa. During the first depressurization (AʹBʹ), the extremely approximation between the slopes of three curves, 0.86 (T1), 0.86 (T2), and 0.88 (T3), suggests that the hydrate formed at the predetermined pressure 10 MPa is uniformly dissociated at three different layer positions. In contrast, the change patterns of the three curves show a high diversity during the second depressurization (CʹDʹ). The curves slopes are, respectively, 0.79 and 0.90 of T3 and T2, being 2.3 and 2.6 times higher than those of T1, 0.34. During the final performance (EʹFʹ), the temperatures almost remain stable even if the accumulative volumes of gas continue to increase. By comparison, at 12 MPa, the change patterns of curves in the two former periods are contrary to those at 10 MPa. During the first depressurization, the smallest slope among the three layers is T3, 0.03, and then the immediate T2, 0.17, which are 11 and 1.9 times smaller than that of the biggest one T1, 0.33, respectively. During the second performance, the three curves tend to converge, with the almost similar slopes of T1, 0.67; T2, 0.68; and T3, 0.66. The latter sections DE and EF are similar to the final EʹFʹ at 10 MPa.
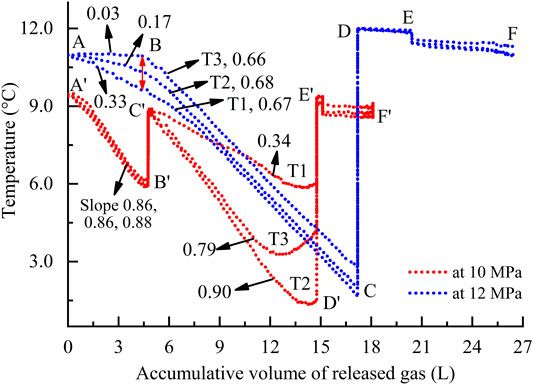
FIGURE 9. Changes in the temperatures at different positions as a function of the accumulative volume of gas during dissociation. The red line denotes the depressurization through a production pressure of 1.5 MPa. The blue denotes the combination of 1.5 MPa and top heating by 4°C. The number is the absolute value of the slope of lines in different sections. The specific fitted equations are exhibited in Supplementary Table S2.
The gas source for hydrate formation is a digital gas pump (Figure 1); all the experimental samples had been compacted with a loading by 3 MPa higher than the predetermined pressure before formation. Before dissociation, the valve between the gas pump and reactor was closed; as a result, only a very small amount of free gas in the system is released during the first depressurization period. The significant temperature reduction inside the reactor in Figure 9 is mainly attributed to the endothermic hydrate dissociation but not the free gas releasing (Li X. S. et al., 2012). Hence, these slopes in fact denote the hydrate dissociation efficiency at the different layer positions inside the sample. Because the average saturation at predetermined pressure 10 MPa is lower than that at 12 MPa (Figure 3), the hydrate with lower saturation is uniformly dissociated during first depressurization. The thermal buffering effect induced by depressurization (Circone et al., 2000) subsequently lowers the dissociation efficiency significantly, and the first depressurization is then forced to end. During the second depressurization, the hydrate with lower saturation at layer positions T2 and T3 dissociates much faster than that at T1. By comparison, the hydrate with higher saturation at 12 MPa is dissociated in a layer sequence T1 to T3 during the first depressurization and with lower dissociation efficiencies, that is, the three slopes less than 0.33. The thermal buffering effect (Circone et al., 2000) is significantly weakened by the combined dissociation method of 1.5 MPa production pressure and top heating by 4°C, as shown by the red double head arrow at Point B in Figure 9. In the subsequent second depressurization, the nonuniformity of dissociation processes at different layer positions is also inhibited significantly. This means that during methane hydrate dissociation by depressurization at the higher ambient condition, the nonuniformity of dissociation processes appearing at different layer positions can be inhibited significantly, especially when combing an extra energy source (Holder et al., 1982).
Conclusion
Methane hydrates formed inside porous media with different saturations were dissociated through different depressurization methods at different ambient conditions. During dissociation, the instantaneous gas flow rate was plotted versus production pressure and the experimental sample deformation versus accumulative amount of released gas to investigate some new dissociation behaviors. The plotted relationships exhibit excellent linear properties, and the lines slopes are then used to characterize the gas discharge resistance, that is, the reciprocal of slope, and the damage degree of the sample volume during dissociation. The results show that under higher ambient condition, that is, higher temperature and pressure, the hydrates formed have higher saturation. The higher condition is beneficial to discharge gas and keep the sample undamaged during dissociation. The main reason is that the viscosity of the dissociation product, that is, liquid water, is significantly decreased at that condition. And the nonuniformity of dissociation processes by depressurization at different layer positions can be inhibited significantly, especially if combing extra heating.
Data Availability Statement
The raw data supporting the conclusion of this article will be made available by the authors, without undue reservation.
Author Contributions
XC carried out most of the experiments and prepared all of the figures. Manuscripts were prepared by XC and PZ. PZ and QW conceived the research. PZ directed specific experiments. LZ and SL provided constructive suggestions for the English translation. JZ and YW did some data analysis. All authors reviewed and approved the final manuscript.
Funding
The authors thank the National Key R&D Program of China (Grant No. 2017YFC0307303) and the National Natural Science Foundation of China (41571072, 41601079, and 41661103) for their financial support.
Conflict of Interest
The authors declare that the research was conducted in the absence of any commercial or financial relationships that could be construed as a potential conflict of interest.
Publisher’s Note
All claims expressed in this article are solely those of the authors and do not necessarily represent those of their affiliated organizations, or those of the publisher, the editors and the reviewers. Any product that may be evaluated in this article, or claim that may be made by its manufacturer, is not guaranteed or endorsed by the publisher.
Supplementary Material
The Supplementary Material for this article can be found online at: https://www.frontiersin.org/articles/10.3389/fenrg.2021.712156/full#supplementary-material
References
Buffett, B., and Archer, D. (2004). Global Inventory of Methane Clathrate: Sensitivity to Changes in the Deep Ocean. Earth Planet. Sci. Lett. 227, 185–199. doi:10.1016/j.epsl.2004.09.005
Chen, B., Sun, H., Li, K., Wang, D., and Yang, M. (2019). Experimental Investigation of Natural Gas Hydrate Production Characteristics via Novel Combination Modes of Depressurization With Water Flow Erosion. Fuel 252, 295–303. doi:10.1016/j.fuel.2019.04.120
Chong, Z. R., Yang, S. H. B., Babu, P., Linga, P., and Li, X.-S. (2016). Review of Natural Gas Hydrates as an Energy Resource: Prospects and Challenges. Appl. Energ. 162, 1633–1652. doi:10.1016/j.apenergy.2014.12.061
Circone, S., Stern, L. A., Kirby, S. H., Pinkston, J. C., and Durham, W. B. (2000). Methane Hydrate Dissociation Rates at 0.1 MPa and Temperatures above 272 K. Ann. N. Y. Acad. Sci. 912, 544–555. doi:10.1111/j.1749-6632.2000.tb06809.x
Fitzgerald, G. C., and Castaldi, M. J. (2013). Thermal Stimulation Based Methane Production From Hydrate Bearing Quartz Sediment. Ind. Eng. Chem. Res. 52, 6571–6581. doi:10.1021/ie400025f
Gao, S. (2008). Investigation of Interactions Between Gas Hydrates and Several Other Flow Assurance Elements. Energy Fuels 22, 3150–3153. doi:10.1021/ef800189k
Gbaruko, B. C., Igwe, J. C., Gbaruko, P. N., and Nwokeoma, R. C. (2007). Gas Hydrates and Clathrates: Flow Assurance, Environmental and Economic Perspectives and the Nigerian Liquified Natural Gas Project. J. Pet. Sci. Eng. 56, 192–198. doi:10.1016/j.petrol.2005.12.011
Guo, G.-J., and Rodger, P. M. (2013). Solubility of Aqueous Methane Under Metastable Conditions: Implications for Gas Hydrate Nucleation. J. Phys. Chem. B 117, 6498–6504. doi:10.1021/jp3117215
Holder, G. D., Angert, P. F., John, V. T., and Yen, S. (1982). A Thermodynamic Evaluation of Thermal Recovery of Gas from Hydrates in the Earth (Includes Associated Papers 11863 and 11924). J. Pet. Technol. 34, 1127–1132. doi:10.2118/8929-PA
Khlystov, O., Batist, M. D., Shoji, H., Hachikubo, A., Nishio, S., Naudts, L., et al. (2013). Gas Hydrate of Lake Baikal: Discovery and Varieties. J. Asian Earth Sci. 62, 162–166. doi:10.1016/j.jseaes.2012.03.009
Koh, C. A. (2002). Towards a Fundamental Understanding of Natural Gas Hydrates. Chem. Soc. Rev. 31, 157–167. doi:10.1039/b008672j
Korson, L., Drost-Hansen, W., and Millero, F. J. (1969). Viscosity of Water at Various Temperatures. J. Phys. Chem. 73 (1), 34–39. doi:10.1021/j100721a006
Kvenvolden, K. A., and Rogers, B. W. (2005). Gaia's Breath-Global Methane Exhalations. Mar. Pet. Geology. 22, 579–590. doi:10.1016/j.marpetgeo.2004.08.004
Kvenvolden, K. A. (1988). Methane Hydrate - A Major Reservoir of Carbon in the Shallow Geosphere? Chem. Geology. 71, 41–51. doi:10.1016/0009-2541(88)90104-0
Kvenvolden, K. A. (1993). Gas Hydrates-Geological Perspective and Global Change. Rev. Geophys. 31 (2), 173–187. doi:10.1029/93RG00268
Li, B., Li, G., Li, X.-S., Li, Q.-P., Yang, B., Zhang, Y., et al. (2012). Gas Production from Methane Hydrate in a Pilot-Scale Hydrate Simulator Using the Huff and Puff Method by Experimental and Numerical Studies. Energy Fuels 26, 7183–7194. doi:10.1021/ef301258w
Li, X.-S., Zhang, Y., Li, G., Chen, Z.-Y., and Wu, H.-J. (2011). Experimental Investigation into the Production Behavior of Methane Hydrate in Porous Sediment by Depressurization With a Novel Three-Dimensional Cubic Hydrate Simulator. Energy Fuels 25, 4497–4505. doi:10.1021/ef200757g
Li, B., Li, X.-S., Li, G., Feng, J.-C., and Wang, Y. (2014). Depressurization Induced Gas Production From Hydrate Deposits With Low Gas Saturation in a Pilot-Scale Hydrate Simulator. Appl. Energ. 129, 274–286. doi:10.1016/j.apenergy.2014.05.018
Li, X.-S., Yang, B., Li, G., Li, B., Zhang, Y., and Chen, Z.-Y. (2012). Experimental Study on Gas Production from Methane Hydrate in Porous Media by Huff and Puff Method in Pilot-Scale Hydrate Simulator. Fuel 94, 486–494. doi:10.1016/j.fuel.2011.11.011
Linga, P., Haligva, C., Nam, S. C., Ripmeester, J. A., and Englezos, P. (2009). Recovery of Methane from Hydrate Formed in a Variable Volume Bed of Silica Sand Particles. Energy Fuels 23, 5508–5516. doi:10.1021/ef900543v
Makogon, Y. F., Holditch, S. A., and Makogon, T. Y. (2007). Natural Gas-Hydrates - A Potential Energy Source for the 21st Century. J. Pet. Sci. Eng. 56, 14–31. doi:10.1016/j.petrol.2005.10.009
Max, M. D., and Lowrie, A. (1996). Oceanic Methane Hydrates: a "Frontier" Gas Resource. J. Pet. Geol 19, 41–56. doi:10.1111/j.1747-5457.1996.tb00512.x
Mekala, P., Babu, P., Sangwai, J. S., and Linga, P. (2014). Formation and Dissociation Kinetics of Methane Hydrates in Seawater and Silica Sand. Energy Fuels 28, 2708–2716. doi:10.1021/ef402445k
Milkov, A. V., Sassen, R., Novikova, I., and Mikhailov, E. (2000). Gas Hydrates at Minimum Stability Water Depths in the Gulf of Mexico: Significance to Geohazard Assessment 2000. Gcags Trans. 3, 217–224. doi:10.2307/1936103
Milkov, A. V. (2004). Global Estimates of Hydrate-Bound Gas in marine Sediments: How Much Is Really Out There?. Earth-Sci. Rev. 66, 183–197. doi:10.1016/j.earscirev.2003.11.002
Mokhatab, S., Wilkens, R. J., and Leontaritis, K. J. (2007). A Review of Strategies for Solving Gas-Hydrate Problems in Subsea Pipelines. Energy Sourc. A: Recovery, Util. Environ. Effects 29, 39–45. doi:10.1080/009083190933988
Naudts, L., Khlystov, O., Granin, N., Chensky, A., Poort, J., and De Batist, M. (2012). Stratigraphic and Structural Control on the Distribution of Gas Hydrates and Active Gas Seeps on the Posolsky Bank, Lake Baikal. Geo-mar Lett. 32, 395–406. doi:10.1007/s00367-012-0286-y
Pang, W. X., Xu, W. Y., Sun, C. Y., Zhang, C. L., and Chen, G. J. (2009). Methane Hydrate Dissociation experiment in a Middle-Sized Quiescent Reactor Using Thermal Method. Fuel 88, 497–503. doi:10.1016/j.fuel.2008.11.002
Reed, S. K., and Westacott, R. E. (2008). The Interface Between Water and a Hydrophobic Gas. Phys. Chem. Chem. Phys. 10, 4614–4622. doi:10.1039/b801220b
Sloan, E. D., and Koh, C. A. (2008). Clathrate Hydrates of Natural Gases. 3rd Edition. New York: Taylor & Francis Group, 1.
Sloan, E. D. (2005). A Changing Hydrate Paradigm-From Apprehension to Avoidance to Risk Management. Fluid Phase Equilib. 228-229, 67–74. doi:10.1016/j.fluid.2004.08.009
Tang, L. G., Xiao, R., Huang, C., Feng, Z. P., and Fan, S. S. (2005). Experimental Investigation of Production Behavior of Gas Hydrate under thermal Stimulation in Unconsolidated Sediment. Energy Fuels 19, 2402–2407. doi:10.1021/ef050223g
Tang, L.-G., Li, X.-S., Feng, Z.-P., Li, G., and Fan, S.-S. (2007). Control Mechanisms for Gas Hydrate Production by Depressurization in Different Scale Hydrate Reservoirs. Energy Fuels 21, 227–233. doi:10.1021/ef0601869
Wallmann, K., Pinero, E., Burwicz, E., Haeckel, M., Hensen, C., Dale, A., et al. (2012). The Global Inventory of Methane Hydrate in marine Sediments: A Theoretical Approach. Energies 5, 2449–2498. doi:10.3390/en5072449
Wang, Y., Li, X.-S., Li, G., Zhang, Y., Li, B., and Feng, J.-C. (2013). A Three-Dimensional Study on Methane Hydrate Decomposition With Different Methods Using Five-Spot Well. Appl. Energ. 112, 83–92. doi:10.1016/j.apenergy.2013.05.079
Wang, Y., Li, X., Li, G., Huang, N., and Feng, J. (2014). Experimental Study on the Hydrate Dissociation in Porous Media by Five-Spot Thermal Huff and Puff Method. Fuel 117, 688–696. doi:10.1016/j.fuel.2013.09.088
Wang, Y., Feng, J.-C., Li, X.-S., Zhang, Y., and Li, G. (2016). Large Scale Experimental Evaluation to Methane Hydrate Dissociation Below Quadruple Point in Sandy Sediment. Appl. Energ. 162, 372–381. doi:10.1016/j.apenergy.2015.10.099
Zhang, P., Wu, Q., and Mu, C. (2017). Influence of Temperature on Methane Hydrate Formation. Sci. Rep. 7, 7904. doi:10.1038/s41598-017-08430-y
Keywords: methane hydrate, discharge resistance, damage degree, porous medium, depressurization, ambient condition
Citation: Chen X, Zhang P, Wu Q, Zhang L, Li S, Zhan J and Wang Y (2021) Gas Discharge Resistance and Medium Damage Degree as Hydrate Dissociation at Different Ambient Conditions. Front. Energy Res. 9:712156. doi: 10.3389/fenrg.2021.712156
Received: 20 May 2021; Accepted: 08 July 2021;
Published: 13 August 2021.
Edited by:
Jiang Bian, China University of Petroleum, ChinaReviewed by:
Chungang Xu, Guangzhou Institute of Energy Conversion (CAS), ChinaAhmet Arısoy, Istanbul Technical University, Turkey
Copyright © 2021 Chen, Zhang, Wu, Zhang, Li, Zhan and Wang. This is an open-access article distributed under the terms of the Creative Commons Attribution License (CC BY). The use, distribution or reproduction in other forums is permitted, provided the original author(s) and the copyright owner(s) are credited and that the original publication in this journal is cited, in accordance with accepted academic practice. No use, distribution or reproduction is permitted which does not comply with these terms.
*Correspondence: Peng Zhang, Zhangpeng@lzb.ac.cn; Qingbai Wu, qbwu@lzb.ac.cn