Research on the Failure Evolution Process of Rock Mass Base on the Acoustic Emission Parameters
 Xiaohui Liu
 Xiaoping Zhao
 Shishu Zhang3
 - 1Key Laboratory of Fluid and Power Machinery, Xihua University, Ministry of Education, Chengdu, China
- 2Key Laboratory of Deep Earth Science and Engineering, Sichuan University, Ministry of Education, Chengdu, China
- 3Chengdu Hydroelectric Investigation and Design Institute Corporation, Chengdu, China
Fracture mechanics behavior and acoustic emission (AE) characteristics of fractured rock mass are related to underground engineering safety construction, disaster prediction, and early warning. In this study, the failure evolution characteristics of intact and fracture (e.g., single fracture, parallel fractures, cross fractures, and mixed fractures) coal were studied and contrasted with each other on the basis of the distribution of max amplitude of AE. The study revealed some meaningful results, where the value of
Introduction
As an important strategic resource in China, coal plays a very important role in primary energy consumption. In the National Energy Development Strategy (2030∼2050), it was predicted that China’s coal output will reach 3.4 ∼4 billion tons in 2020∼2030. In 2030 and 2050, coal will maintain about 55 and 50% of China’s primary energy structure, respectively, so coal will remain the main energy resource in China for a long time in the future. Due to the influence of geological structure and mining, fracture development occurs in the surrounding rock mass. Compared with the intact rock mass, the fractured rock mass has become very sensitive to blasting or mechanical disturbance load. Therefore, the study on the instability evolution characteristics of fractured coal–rock mass has important practical significance for efficient coal mining.
In general, the problem of rock mechanics was the mechanical behavior of fracture rock mass in the engineering scale, especially characters of strength, deformation, and failure of fracture rock mass. And the mechanical behavior of fracture rock mass was always a hotspot and difficult problem in rock mechanical field, where the hotspot was its strong application value and the difficulty lay in obtaining the fracture rock mass specimens. At present, the primary research methods for the fracture rock mass were fastened on the physical simulating test [1–5], numerical analysis [6, 7], in situ test, and others. Many achievements have been acquired through those methods, but their drawbacks are also obvious. For the physical simulation experiment, similar material and prefabricated crack were used to simulate the fracture rock mass specimens. But compared with the rock materials, the differences of similar material in the internal crystal structure, composition, and cementing material led to the essential difference on crack enlargement. Numerical methods were effective ways to study the mechanical behavior of fracture rock mass in recent years; however, the inhomogeneity of rock materials, parameter selection, and the failure criterion were problems that cannot be ignored. For the in situ test, the main problems were as follows: expensive, time consuming, and others. In this study, the fractured rock mass specimens were obtained through preloading the intact specimens to avoid the difficulty of obtaining fractured rock mass.
However, the fracture rock mass was cut by all kinds of structural surfaces, such as primary structural plane and secondary structural plane. This is bound to make the failure mechanism of fracture rock mass different with the intact rock. It must be more complex and diverse. It is very important to analyze this problem more reasonably and effectively. With the development of science, new technologies were also used in the research on rock mechanics, such as CT and AE [8–11]. Especially, since the AE technology was introduced into the field of rock mechanics by Goodman in the 1960s, the AE technique had become an indispensable methodology to study rock behaviors.
At present, there are many studies on the AE response of the rock failure process [12–16]. Chen [17] and Zhang [18] discussed the application of AE technology in rock mechanics research. Li et al. [19] studied the fracture development of intact shale in the fracturing process by using the AE ring number ratio and energy rate, and determined the damage evolution law of shale according to the AE ring number, and characterized the shale degradation behavior. Zhou [20], Zhang [21], and Xu et al. [22] by using AE monitoring system, such as breaking process of rock, studied the AE response of different stress stages. In particular, the AE b value is one of the important parameters; studying the characteristics of rock AE can reflect the change of micro-cracks on rock internal scale, and the b value of mutations usually could be used as rock macroscopic failure precursors [23–25]. Lei et al. [26] showed that the sudden drop of the b value indicated that the interaction between the cracks inside the rock was enhanced, indicating that the rock was about to be unstable and might be destroyed soon. Yang et al. [27] found that the AE b value was relatively small at the early stage of loading, indicating the rock crack compaction behavior. The b value gradually increased in the elastic stage, indicating the elastic deformation behavior of the rock crack. When the stress level reaches 70% in the late loading period, the sudden drop of the b value corresponded to the crack propagation behavior. When the stress level reaches 90%, the low level of the b value indicated the macroscopic failure of rock. Xue et al. [28] found that the b value was abnormal in the early loading stage and was at a high value in the early loading stage. When the stress reached about 80% in the plastic stage, the b value began to decrease rapidly, indicating the rapid development of the number of large-scale cracks. Zha et al. [29] and Zhang et al. [30] believed that in the process of uniaxial compression of rock, the b value dropped sharply with the increase of stress at the late loading period, indicating the fracture of the rock. Lisjak et al. [31] obtained through numerical results that the b value of rock dropped sharply twice in the process of failure. The first time was at the pre-peak stress level of 75%, and the second time was at the pre-peak stress level of 97%. The decrease of the b value indicated that the crack on the main fracture plane was transformed from diffusion nucleation to crack coalescence.
However, the existing studies on AE response and the b value of rock are basically focused on intact rock mass, and there are few studies on AE characteristics during deformation and failure of fractured rock mass. In this study, the fractured coal–rock mass was acquired by preloading the intact coal rock. According to the different combinations of cracks in the fractured coal–rock mass, the specimens could be divided into single fracture, parallel fracture, cross fracture, and mixed fractured coal–rock mass, statistically. Based on rock material with the acoustic emission phenomenon in the failure process under loading, the maximum amplitude of AE events (i.e., the
Test Specimens and Equipment
Feasibility Analysis and Scheme of Preparation of Fractured Coal–Rock Mass
Technical and Test Equipment Feasibility
Fracture mechanical behavior of rock mass plays an important role in engineering practice. The fracture rock mass specimens were mainly obtained by direct or indirect methods presently. Affected by factors such as sampling and specimen processing, the direct method used to obtain fracture rock mass specimens during manufacturing was difficult. And so, the indirect method was the main method to obtain fracture rock mass specimens.
As the anisotropic materials controlled by the structural plane, the fractured rock mass was obviously different from that of the conventional rock. In order to obtain the fractured rock mass by the loading of conventional rock, it was necessary to analyze and classify the deformation and failure process. For general rock materials, due to their relatively high strength, they had brittle fracture characteristics, most of which were “II” deformation and failure curves. The damage was severe, and the process from cracking to penetrating the specimen was very short. The success rate of obtaining fractured rock specimens was low. For the soft coal rock, the deformation and damage severity were relatively low, showing the “I” type deformation failure curve (Figure 1). It was feasible to stop the loading before the cracks penetrated the test piece to obtain the fractured rock specimen.
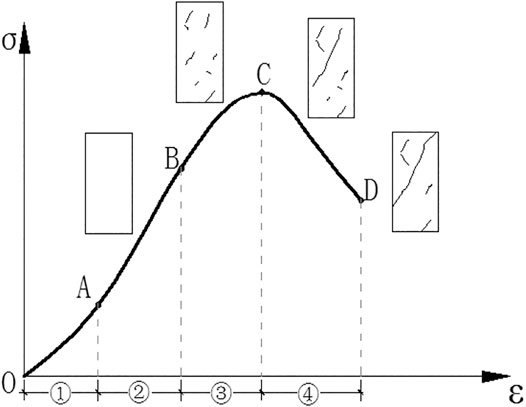
FIGURE 1. Failure evolution of rock in the whole process.
Based on it, the method for obtaining the fractured rock mass specimens was as follows: considering the failure process of coal–rock mass as the development and expansion of internal micro-cracks, and the process of macro-cracking through the test piece. Then by preloading the intact rock specimens, the fracture rock specimens could be obtained by stopping the loading process before cracks penetrated the specimens (Figure 2).
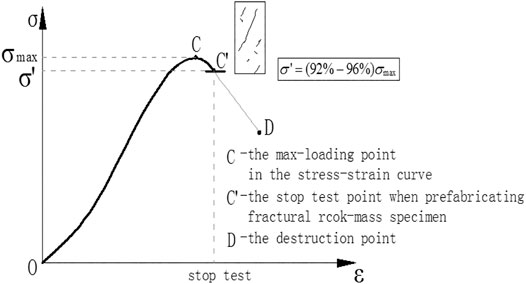
FIGURE 2. Indirect method of fracture rock mass specimen manufacturing.
As mentioned above, it was feasible to obtain fracture rock mass on a laboratory scale when the test equipment loading system could stop loading after the max loading point and before the destruction point, and then, rock mass specimens with fracture and without destruction could be obtained. In this study, the early prefabricated and later loading of the fracture rock mass specimens were conducted by MTS815 rock mechanics test system (Figure 3) from Sichuan University. The testing system has a higher integral rigidity and electro-hydraulic servo control system, which can achieve a variety of control conditions such as stress, strain, and transformation. The testing system could also be made to stop loading before rock specimens are destroyed completely. Therefore, indoor prefabricated fractured rock specimens are also feasible on the test equipment. In order to avoid other influence of the fracture rock mass on failure evolution, uniaxial compression loading scheme to the specimens was adopted, with the axial loading rate of 10 kN/min before the loading arrived at the peak, and then, lateral deformation control was used after max loading point with the rate of 0.02 ∼ 0.04 mm/min. In addition, in order to capture AE space location points, a total of 8 AE sensors were arranged on the upper and lower parts of the samples in the direction of vertical diameter.
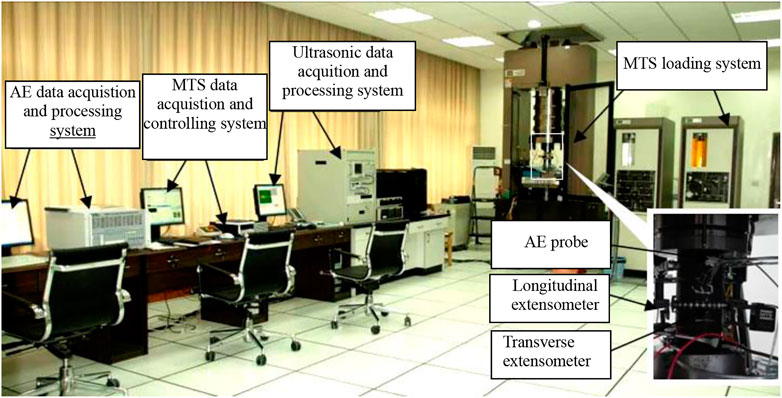
FIGURE 3. MTS815 rock mechanics test system.
Therefore, whether it was technical feasibility or the requirements of the test equipment, it was feasible to obtain the samples of the fractured coal–rock mass by loading the intact coal rock by laboratory test means.
Preparation Scheme of Fractured Coal–Rock Mass
Based on the MTS815 rock mechanics test system, different loading methods were used to perform fractured coal–rock mass samples of Pingdingshan and Tashan intact coal rock. The loading methods include uniaxial, conventional triaxial, and three different mining methods (the caving, no pillar, and protective layer mining). The relevant loading schemes are as follows [32]:
1) Uniaxial loading test
The axial compression was loaded to the peak load at a rate of 10 kN/min, and the post-peak stage was controlled by transverse deformation. The loading was stopped after the set stress value (
2) Conventional triaxial loading test
It mainly included two stages: adding confining pressure stage, in which the internal confining pressure was loaded to 25 MPa at a rate of 3 MPa/min; in the axial compression stage, when the confining pressure was loaded to 25 MPa, the axial compression was loaded to the peak stage at a rate of 30 kN/min. After the peak, the lateral deformation control was adopted, and the loading was stopped at a rate of 0.02∼0.04 mm/min to the preset stress value (
3) Indoor simulation loading of three mining methods in coal mine
There were mainly three stages: confining pressure loading stage, in which the confining pressure was loaded to 25 MPa at a rate of 3 MPa/min. In the first stage of confining pressure unloading, the confining pressure was unloaded at a rate of 1 MPa/min, and the axial load was loaded to 37.5 MPa at a loading rate of 2.25 MPa/min. In the second stage of confining pressure unloading, the confining pressure continues to be unloaded at a rate of 1 MPa/min. The axial load was loaded at a rate of 2.25, 3.5, and 4.75 MPa/min, respectively, according to the three mining methods of protective layer, top coal caving, and no coal pillar, until the peak. After the peak, the lateral deformation control was adopted. Loading was performed at a rate of 0.02∼0.04 mm/min to the preset stress value (
Through the above indirect method, fractured coal–rock mass specimens could be obtained and classified, and then the failure evolution and difference of intact rock and fracture rock mass could be studied.
Fractured Rock Mass Classification
For the sake of better research on the failure evolution of the fracture rock mass, the fracture rock mass could be divided into single fracture, parallel fracture, cross fracture, and mixed fracture rock mass in the statistical sense based on the space composition and complexity of fracture in rock mass by pre-casting. And the typical specimen photos, CT scans, and their classification of the intact coal and fractured coal–rock mass specimens with different compositions are shown in Table 1. For distinguishing the intact coal and fractured coal–rock mass specimens conveniently, specimen number F represents the specimens were fractured coal–rock mass after pre-casting.
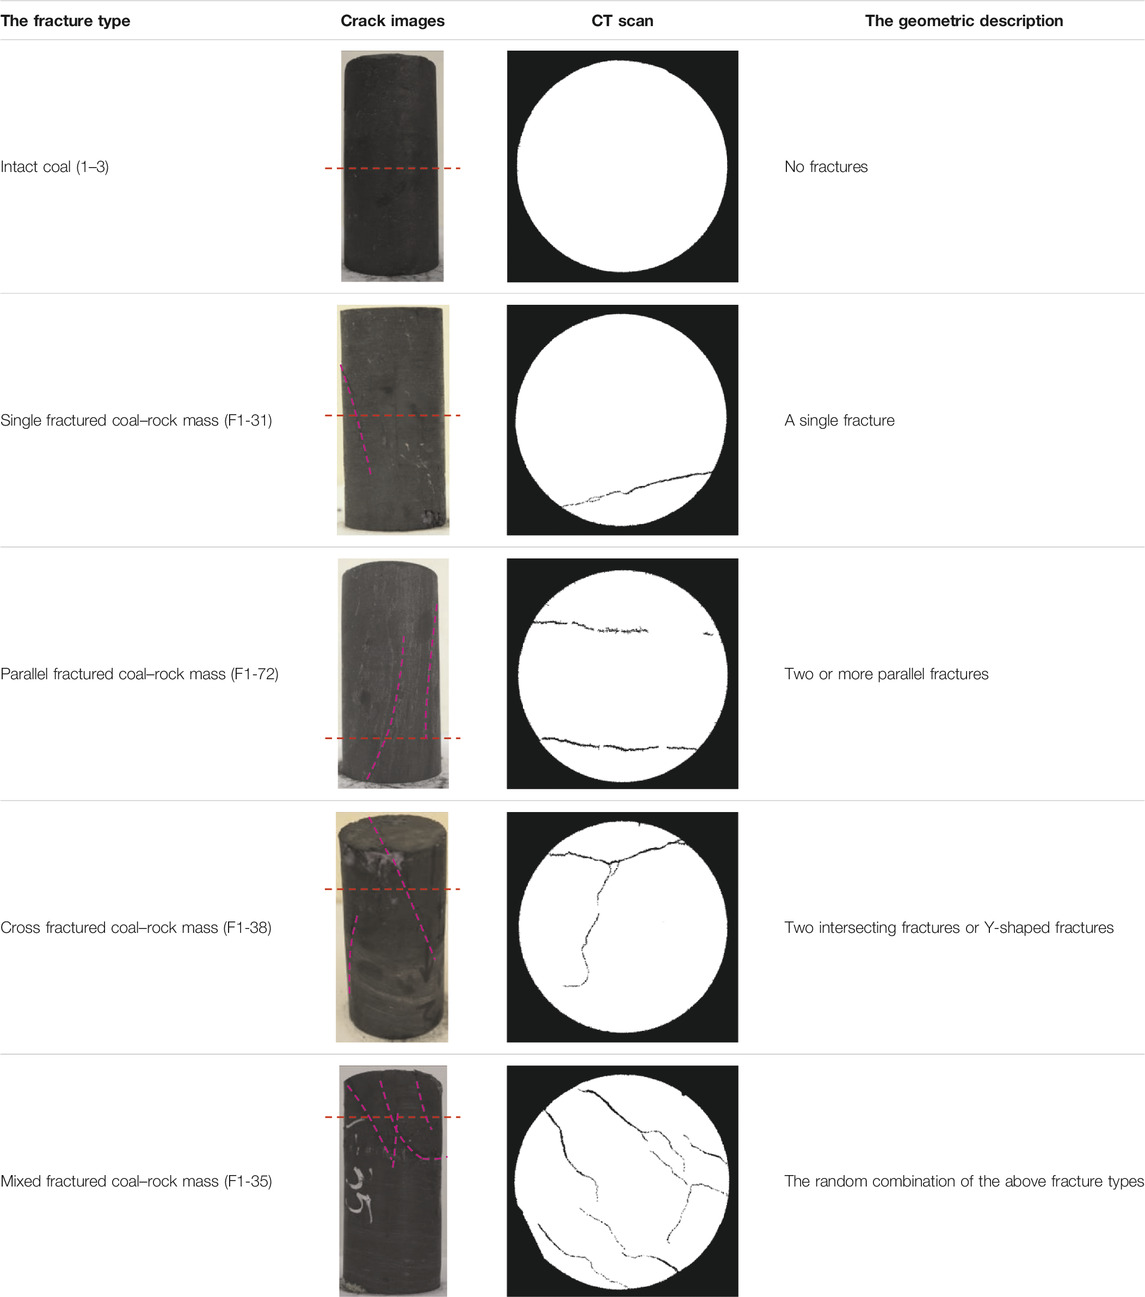
TABLE 1. Photos and CT scans of typical specimens and their classification.
In order to avoid the deviation of the analysis results caused by different rock types, the hard rock and soft rock samples were, respectively, collected from Tashan coal mine and Pingdingshan coal mine, and the fractured rock samples were prefabricated. The physical characteristics and microscopic composition are shown in Table 2. On this basis, the study carried out experimental research through 26 effective specimens, including six intact coal-rock specimens, five single fracture rock masses, three parallel fracture rock masses, five cross fracture rock masses, and seven mixed fracture rock masses.
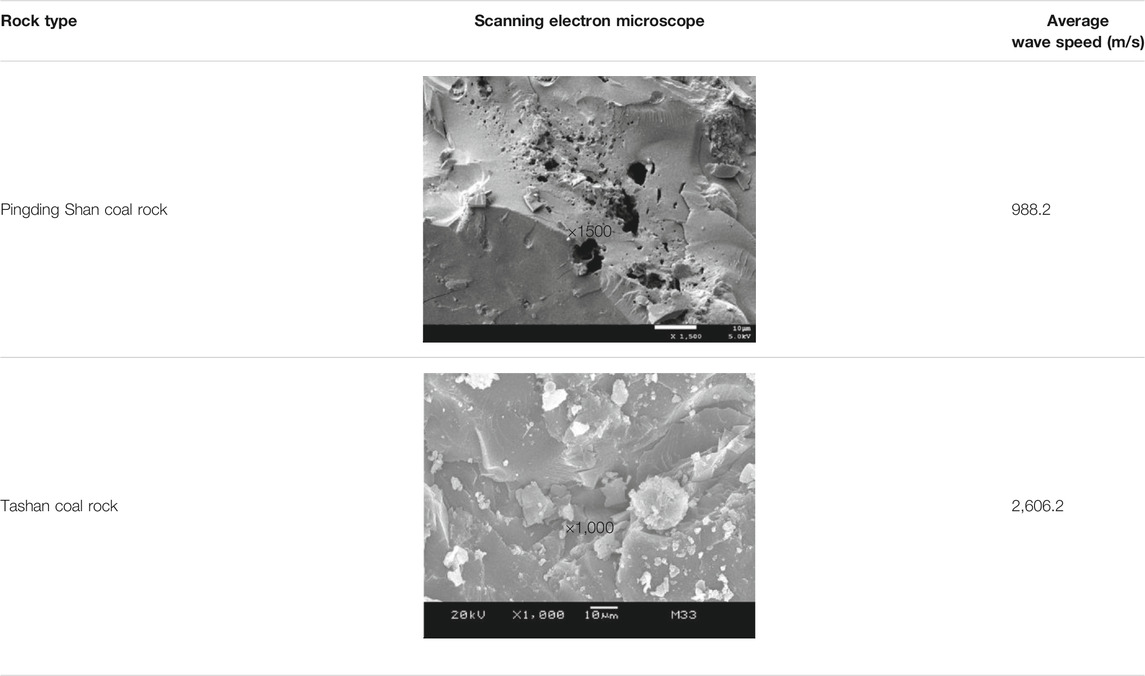
TABLE 2. Physical and microscopic features of rock specimens.
The Quantitative Description of the Maximum Amplitude Distribution of Acoustic Emission
The maximum amplitude of a single AE event was analyzed during the loading process. For a single AE event, analyzing its maximum amplitude was meaningless, but the significance lies in the distribution of all the maximum amplitude of AE events during the failure process, which could reveal the failure evolution regularities and difference of fracture rock mass. As rock materials, Katsuyama [33] represented the distribution of maximum amplitude of AE through the following Eq. 1.
where
Through Eq. 1, amount of N (A) which was greater than the maximum amplitude of A could be infinite integrals by Eq. 1 as follows:
Therefore,
where
When letting
Then, log on both sides of Eq. 4:
Therefore, by collecting AE events during the process of failure evolution, Eq. 5 could be used to obtain a quantitative description index (i.e., the value of b) of maximum amplitude distribution of AE events, where the b value was equivalent to the probability of hindering to the specimen failure. As a quantitative evaluation index, this parameter was used to analyze the failure evolution regularities and difference of fracture rock mass.
Test Result and Analysis
Based on the uniaxial loading condition, the maximum amplitude distribution characteristics of intact coal rock and four different fractured rock mass were analyzed.
Amplitude Variation Regularities Under Different Stress Levels
As a quantitative description of the maximum amplitude distribution characteristics of AE events in the loading failure process of rock, the b value could reflect the change of crack scale inside rock. In order to explore the similarities and differences in the crack evolution process of coal–rock mass with different fracture degrees in the loading failure process, the amplitude distribution of intact, single fracture, parallel fractures, cross fractures, and mixed fractures coal under different stress levels in the uniaxial loading process is listed in Table 3. Using the above method to calculate the b value, the fitting correlation coefficient under different stress levels was above 0.8, and part could reach 0.9, which showed that the b value error was small, to meet the requirements of the error [34]. Due to the length of the article and considering the small difference of the correlation coefficient of the value at different stress levels, the average correlation coefficient of various coal–rock masses at different stress levels is listed in Table 3. Due to the few AE events in the initial loading stage of individual samples, the b value was partially missing. The results showed that the b value was lower when the stress level was higher, which meant that the b value trended to decrease with the increasing of stress levels.
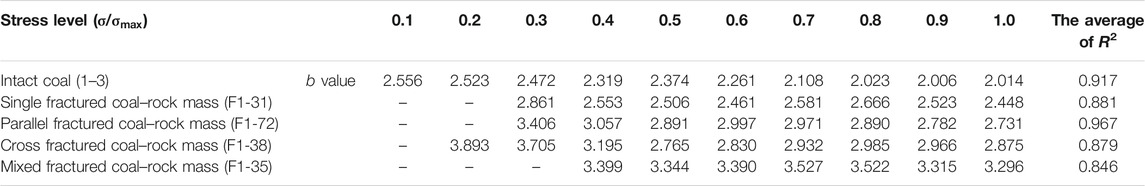
TABLE 3. Results of the b value under different stress levels of fractured coal–rock mass.
The distribution regularity of the b value for the intact coal and four kinds of fractured coal–rock mass under different stress levels is shown in Figure 4, where
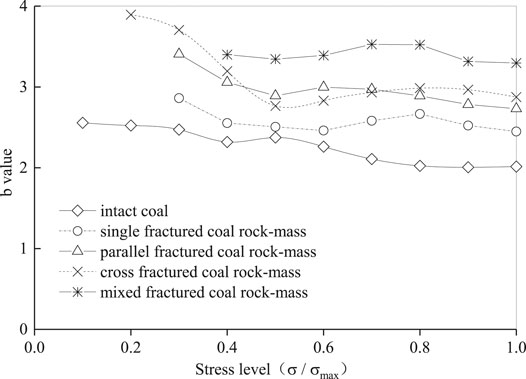
FIGURE 4. Distribution of the b value under different stress levels of fractured coal rock mass.
The more complex the fracture (i.e., in sequence of intact, single fracture, parallel fractures, cross fractures, and mixed fractures coal) in coal–rock mass, the greater b value it was under the same stress level. For example, when the loading reached the peak, the b value of the fracture rock mass from complex to simple was 3.296, 2.875, 2.731, and 2.448, respectively, while the b value of the intact coal was 2.014. In addition, compared with the results of distribution regularity of the b value for the intact coal, single fracture, parallel fracture, cross fracture, and mixed fractured coal–rock mass had a similar trend during the process of failure evolution at the stress level from 0 to the peak.
In conclusion, the characteristic parameter b of maximum amplitude distribution of AE events changing regularities under different stress levels showed that the damage of intact coal and fractured coal–rock mass were embodied as the increasing scale of cracks inside on the microscopic and increasing AE events with large amplitude. During the changing process, the growth of micro-cracks was restrained when the stress had increased to a certain level, and then, micro-cracks inside started to propagate until the stress reached the peak strength. In addition, the b value decreased before the specimen reached instability, which was also consistent with the existing literature reports [35–37]. The decrease of the b value represented the large-scale development of high-energy acoustic emission events. Before the failure, the b value dropped sharply, indicating that the proportion of high-energy large-scale micro-cracks increased gradually, and the development of micro-cracks changed from disorder to order. When the micro-crack size distribution was relatively constant, the b value gradually tended to be stable. Finally, crack penetration led to specimen instability and failure.
The Frequency of Amplitude Distribution in Different Stress Intervals
Due to similar changing regularities of the characteristic parameter b of AE events in intact coal and fractured coal–rock mass during the failure evolution process, in order to study furthermore, the intact coal specimens 1–3# were used as an example to analyze the failure evolution process reflected by the b value in different stress intervals. During the uniaxial loading, the frequency of maximum amplitude distribution of AE events in different intervals is shown in Figure 5.
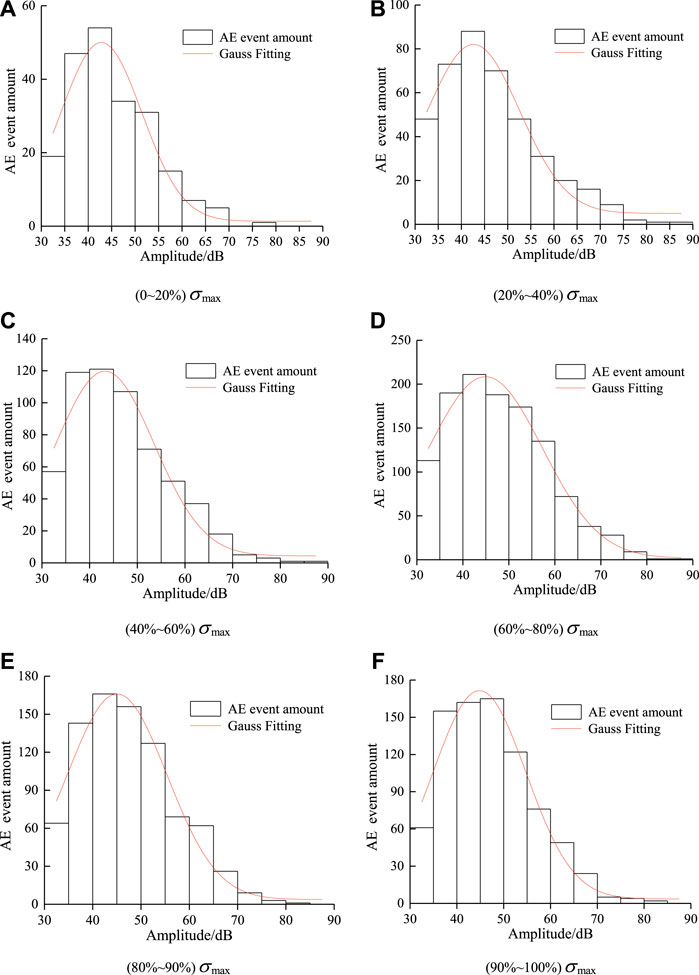
FIGURE 5. Maximum amplitude distribution frequency and probability distribution curves of AE in different stress intervals of intact coal-rock mass (1-3).
Combined with the b value of intact coal rock in Table 2, when the stress level was in the interval of 0 ∼ 20%, there was few of AE events with maximum amplitude about 35 ∼ 45 dB mainly. As the stress level was loaded to the interval of 20 ∼ 40%, the amount of AE events and amount of AE events with larger amplitude had increased, where the maximum amplitude was about 35 ∼ 50 dB primarily, and the value b was reduced comparing with the previous interval. When the stress level was in the interval of 40 ∼ 60%, the amount of AE events continued to increase, and the increasing of the low amplitude of the events was faster than that with larger amplitude, which suggested that the propagation of micro-cracks in this interval was restrained, and reflected with the increasing b value. When the stress level was in the interval of 60 ∼ 80%, the amount of AE events with large amplitude had increased rapidly compared with the previous interval, especially the AE events with maximum amplitude about 50 ∼ 60 dB, which embodied that the large scale of cracks were developing rapidly on the microscale, and reflected with the reducing b value. After loading the stress level to the interval of 80 ∼ 100%, the growth of AE events with maximum amplitude was getting to be stable, and the reducing of the b value was also gently. And comparing with the previous interval with larger scale of cracks developed, the crack development was dominated by adjustment and began to expand along the existing large scale of cracks on the microscale.
In order to better reflect the amplitude distribution characteristics of coal–rock mass, the Gaussian normal distribution function “
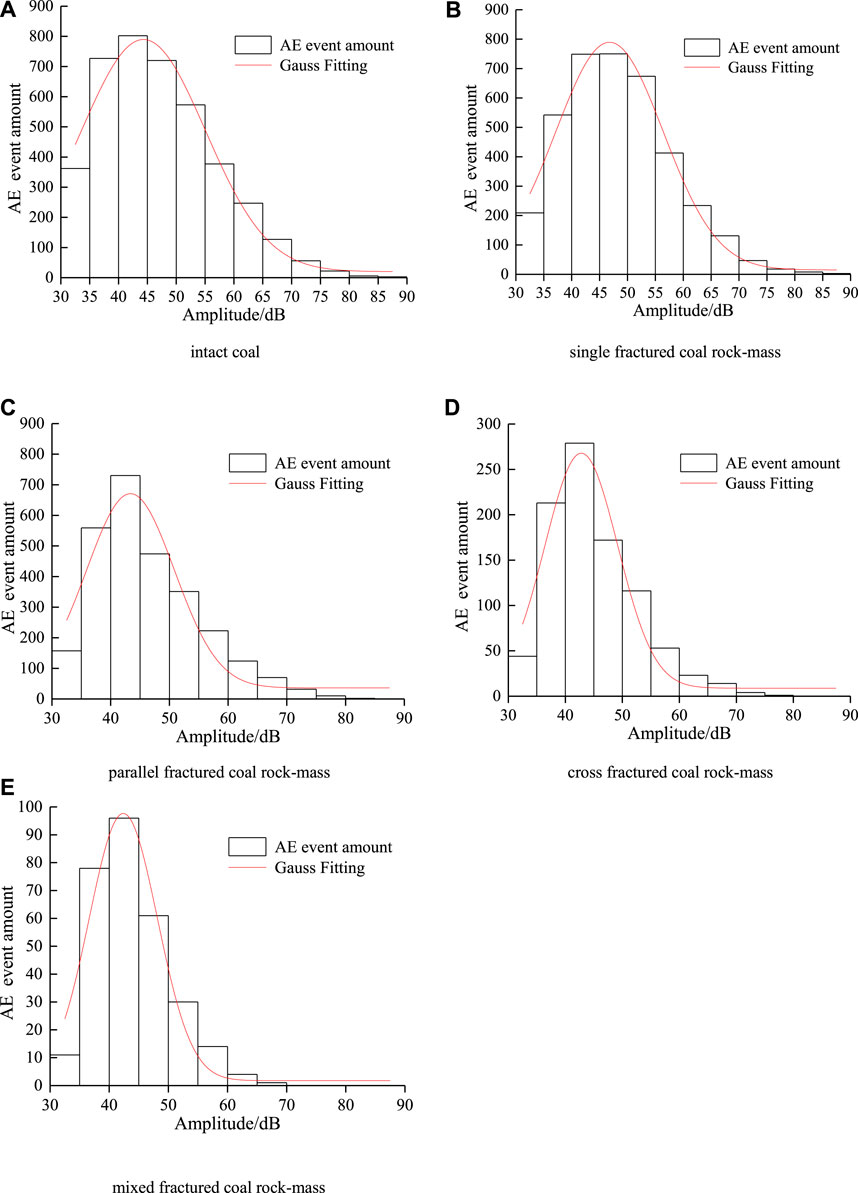
FIGURE 6. Maximum amplitude distribution frequency and probability distribution curves of AE events from 0 to peak of intact coal and fractured coal-rock mass.
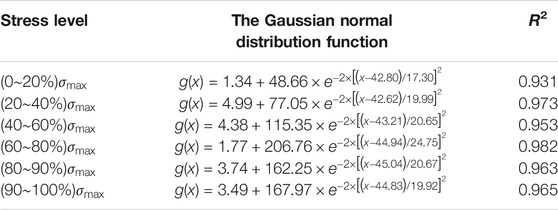
TABLE 4. Gaussian normal distribution function of frequency distribution of AE maximum amplitude in different stress zones of intact coal–rock mass (1–3).
In summary, the quantitative evaluation index b value could reflect very well in the distribution regularities of maximum amplitude of AE events during the failure evolution process of coal, and the maximum amplitude of AE events could directly reflect the expanding intensity of cracks in the coal. Therefore, the characteristic parameter b of AE events could describe the failure evolution process of coal well. In addition, the stress interval with a large amplitude increase could be used as a precursor to the peak of the specimen through the maximum amplitude distribution frequency of the AE event. Then, the b value that characterizes the maximum amplitude distribution of the AE event was drastically reduced to the stress level when it was gradual as a pre-destruction.
The Variation Regularities of Maximum Amplitude Between Different Fractured Rock Mass
The maximum amplitude distribution frequency of AE events for intact coal and fractured coal–rock mass during the stress level from 0 to the peak loading is shown in Figure 6.
As shown in Figure 6, the distribution frequency of maximum amplitude of intact coal was more “full” than that in fractured coal–rock mass from the distribution shape, where it was more “slender” in fractured coal–rock mass. And comparing the shape in different fracture rock mass, the more complex the fracture (i.e., in sequence of intact coal, single fracture, parallel fractures, cross fractures, and mixed fractures) in coal–rock mass, the more “slender” it was. Based on the distribution characteristics of maximum amplitude of AE events, the intact coal had more AE event amount and more distribution range, where the amplitude of AE events was distributed mainly in the interval of 35 ∼ 55 dB, and there were 87 AE events with amplitude more than 70 dB. For the fractured coal–rock mass with more complex fracture, the decrease of AE event amount was more obvious, and the AE events with large amplitude reduced more. Taking mixed fracture of coal–rock mass as an example, the maximum amplitude of AE events was mainly from 35 to 45 dB, where the amount of AE events declined steeply when the amplitude was larger than 45 dB, and there were no AE events with amplitude greater than 70 dB. So, compared with intact coal and fractured coal–rock mass, the more complex the fracture (i.e., in sequence of intact coal, single fracture, parallel fracture, cross fracture, and mixed fractured coal–rock mass), the more reduction of the total AE events and the amount with large amplitude of AE events. The reason for this was that with more complex fracture inside, the internal cracks could expand along the existed fracture more easily, and the cracks expanding with large scale were reduced more for the low bearing capacity of rock bridge cut by fractures.
In order to better reflect the amplitude distribution characteristics, through statistical probability fitting of the distribution frequency of the maximum amplitude, the Gaussian normal distribution law of the maximum amplitude distribution frequency with a high degree of fit can be obtained. Table 5 shows the Gaussian normal distribution function and fitting degree of coal–rock mass with different fracture combinations. It was observed that the probability of the maximum amplitude event of AE occurred at about 45 dB was the largest.
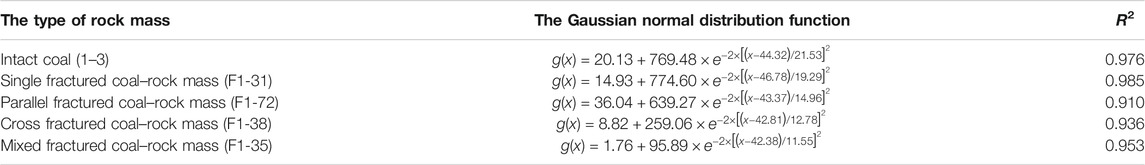
TABLE 5. Gaussian normal distribution function of maximum amplitude distribution frequency of intact coal and fractured coal–rock mass.
Based on the characterization of the maximum amplitude distribution at the range from 0 to the peak loading, the b value characteristics at the peak stress of coal–rock mass with different fractures were further analyzed. As shown in Figure 7, under uniaxial loading, the b value at the peak stress of intact coal, single fracture, parallel fracture, cross fracture, and mixed fractured coal–rock mass was 2.014, 2.448, 2.731, 2.876, and 3.269, respectively. Thus, the b value of intact coal was the smallest, while the b value of coal–rock mass with mixed fractures with the most complex fractures was the largest. Thus, the more complex the primary fractures were, the greater the b value was, where the physical meaning was that the more complex the fracture inside, the more barriers existed to restrain crack propagation caused by internal crack distribution. On the microscale, the main reason for this was that the more the fractures existed in the coal–rock mass, the lower the capacity of bearing the load and storing less energy inside, and the cracks could be better adjusted during the crack propagation for the more the fractures existed, which led that the more complex the fractures inside, the less scale cracks happened. In addition, as shown in Figure 8, the b value distribution of single fracture coal–rock mass was more discrete, where the reason was that the bearing capacity of single fractured rock mass was influenced by the direction between the load and fracture, and the characteristics of anisotropic were reflected. For mixed fractured coal–rock mass, the discrete degree of the b value was lower than the single fracture inside, where it was shown that the effects were reduced which was caused by the direction between the loading and fracture with lower characteristics of anisotropic.
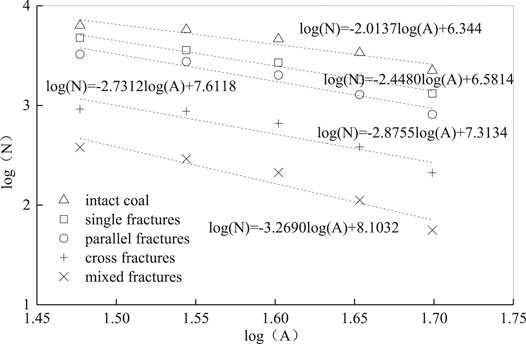
FIGURE 7. The b value of intact coal and fractured coal–rock mass at the peak loading (σ = σmax).
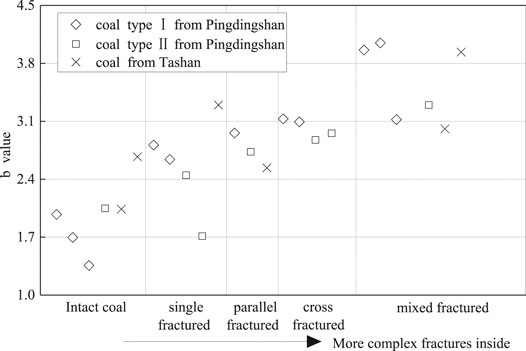
FIGURE 8. The b value distribution of intact coal and fractured coal–rock mass.
Temporal and Spatial Distribution Characteristics of Acoustic Emission Events
In order to reflect the relationship between the evolution of internal fractures and the degree of main fractures in the process of coal–rock failure, the spatial distribution of AE events and energy in the process of failure evolution of intact coal and coal–rock mass with different fractures is shown in Figure 9. By correcting the accuracy of the AE positioning system in the test process, the experiment was carried out under the condition that the absolute errors of the AE source in X direction, Y direction, and Z direction were all less than 2 mm. As for the energy of AE events, the energy and quantity of AE events in the failure process of intact coal rock were the largest. Compared with the coal–rock mass with different combinations of fractures, the amount of AE events and its energy had shown a trend of decrease when the fractures were more complex. Compared with fractured coal–rock mass, the spatial distribution of AE events in intact coal rock was discrete, and the crack propagation was random, which would not be affected by fracture. However, the spatial distribution of AE events reflected the correlation between the spatial location of fractures and AE events. Taking single, cross, and mixed fractured coal–rock mass as examples, under the condition of uniaxial loading, the expansion of the micro-cracks was controlled by the existing fractures, which led that the AE events were mainly distributed along the penetration failure surface presenting with concentrated distribution on the macroscale. For single fracture coal–rock mass, the AE events were mainly distributed along the surface of existing fracture, while for cross and mixed fractured coal–rock mass, the AE events were mainly distributed in the locked segment.
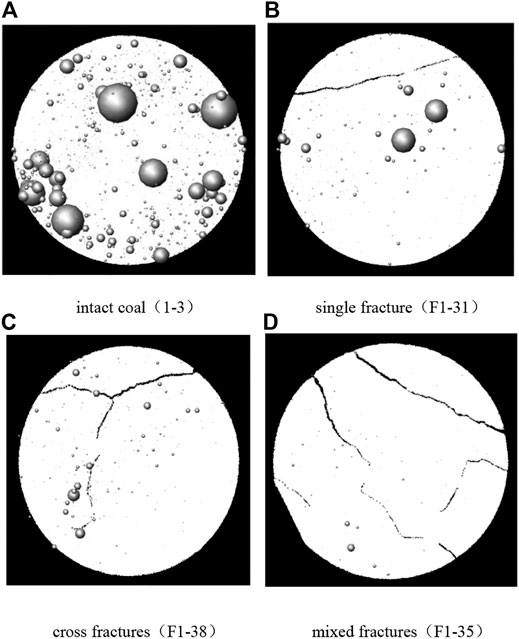
FIGURE 9. Spatial distribution of AE events and its energy of intact and fractured specimens. (The size of the sphere reflects the amount of energy).
The amplitude, energy, and the b value of AE events were combined to reflect the failure evolution process of intact coal and coal–rock mass with different fracture combinations and the relationship between the parameters. The relationship among AE event amplitude, energy, and the b value in different stress levels of intact coal and fractured coal–rock mass with different fracture combinations under uniaxial loading is shown in Figure 10.
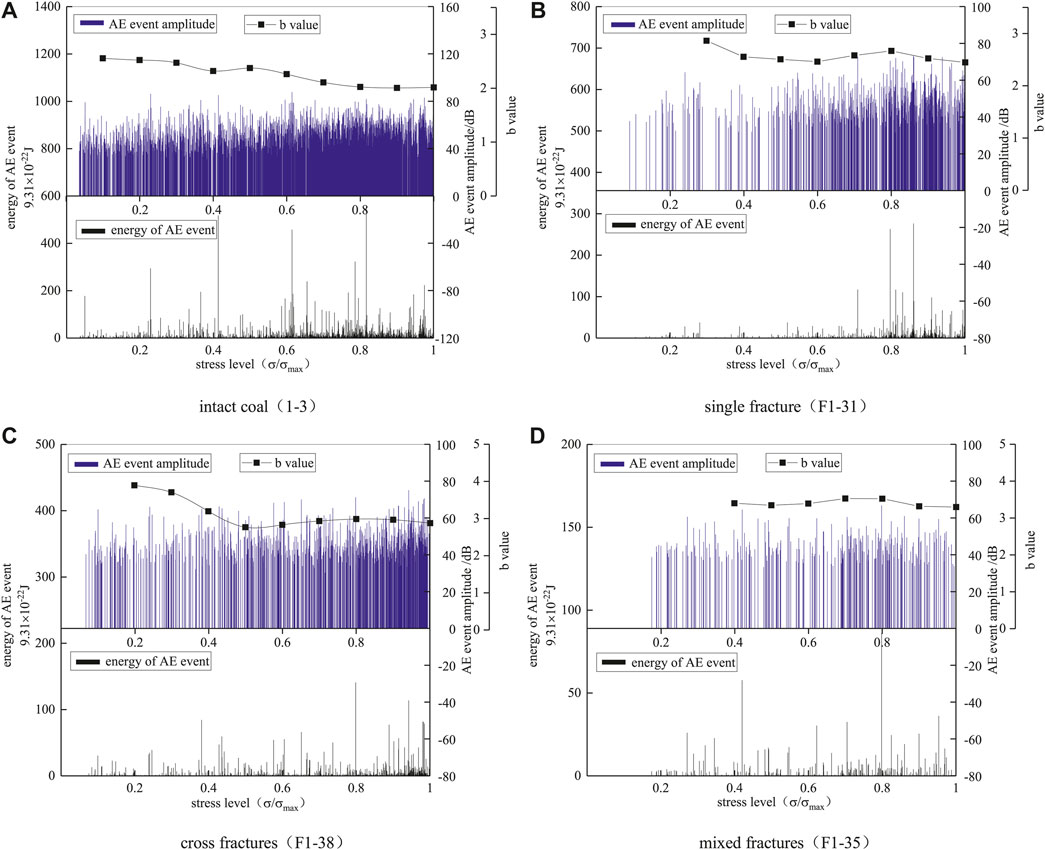
FIGURE 10. The distribution of AE event amplitude, energy, and the b value of intact and fractured specimens at pre-peak stress level.
As shown in Figure 10, the energy of AE events in intact coal–rock mass was greater than that in fractured coal–rock mass significantly, and the more complex the fracture was, the lower the AE energy was. At the low stress level, the more complex the fracture was, the deformation in the failure process was mainly adjusted along the existing fracture, and the lower the energy of acoustic emission event was. When the stress level was loaded to 0.6∼0.8 times of the peak strength (
As shown in Figure 10, no matter how intact coal or fractured coal–rock mass occurred with different fracture combinations, the energy of AE events showed a decreased trend after reaching the maximum value during the failure evolution process, and it indicated that the failure evolution was dominated by development and extension of cracks with smaller size and breakthrough the rock bridge between cracks after the AE event with maximum energy arrived. In general, the acoustic wave was the external macroscopic representation of crack extension in rock material during its failure process, where the maximum amplitude of the AE event was positively related to its energy. Combined with the distribution of the b value at different stress levels, the b value of AE events showed an increased trend at the stress level of 0.6∼0.8 in fractured coal–rock mass, and it showed that the amount of AE events with large amplitude was decreasing and the internal energy was accumulating during this stress interval. When the stress level was loaded up to about 0.8, the b value was reducing obviously, where the amount of AE events with large amplitude was increasing conspicuously, and it was in accordance with the energy of AE event distribution in this stress level. After the stress level was about 0.8, the failure evolution was dominated by development and extension of cracks with smaller size, and the b value represented the distribution regularities of AE events were decreasing gradually and trending to be gentle finally. Therefore, based on the characteristics during the failure evolution process in fractured coal–rock mass, some regularities could be presented, where the b value would decrease and then increase and then decrease in the pre-peak phase, and the stress level could be considered as the precursor of the b value occurred. For intact coal, internal cracks were extended randomly under uniaxial loading caused by no constraint of existed fractures and higher strength inside, and the AE events with large energy were distributed during the whole failure process, where the b value was decreased on the whole and distinguished from fractured coal–rock mass. When the stress level was loaded up to about 0.8, the b value trended to be gentle after the AE event with largest energy happened, which was in accordance with fractured coal–rock mass. So, based on the variation regularity of the b value reflected and the maximum amplitude distribution of AE events in intact coal and fractured coal–rock mass during the failure evolution process, it could be considered that the second decrease and flattening of the b value is the premonitory criterion of failure.
Conclusion
As we know, one of the difficulties in studying the mechanical behavior of fractured rock mass was on how to obtain the fractured rock mass specimens. In this study, the fractured rock mass specimens were obtained by preloading intact rock (coal) in the rock mechanic rigidity servo testing system (MTS815). Then through the acoustic emission phenomenon of rock during loading failure and the maximum amplitude distribution law of the AE event, the failure evolution process of intact rock and fractured rock mass specimens under uniaxial loading condition was studied on the basis of the maximum amplitude distribution of AE events. The main characteristics during the failure process could be concluded as follows:
1) Based on the quantity and spatial distribution of fractures, the fractured rock mass could be categorized into four types from simple to complex, such as single fracture, parallel fractures, cross fractures, and mixed fractures successively in the statistical sense.
2) The b value which represented the characteristics of the maximum amplitude distribution of AE events could be used to reflect the failure evolution process of the rock mass, where the more the fractures inside, the more obvious damage effect and the larger b value were.
3) Under different stress levels, the b value of intact rock and fractured rock mass showed a decreasing trend with the increase of load on the whole. Under the condition of the same stress level, the more complex the fractures inside, the larger the b value was. That is, the value b of intact coal rock < single fractured rock mass < parallel fractured coal–rock mass < cross fractured rock mass < mixed fractured coal–rock mass.
4) During the uniaxial loading, the cracks inside intact rock were extended randomly, and the distribution of AE events was discrete, where the AE events of the cracks inside fractured rock mass were concentrated under the influence of existed fractures.
5) Before the loading reached the peak value, in the process of failure evolution of intact rock mass and fractured rock mass, the b value decreased, then increased and then decreased, and finally tended to be flat. The feature that the b value decreased for the second time and gradually flattened out could be regarded as an early warning signal that the loading reached the peak.
Data Availability Statement
The original contributions presented in the study are included in the article/Supplementary Material; further inquiries can be directed to the corresponding author.
Author Contributions
All authors listed have made a substantial, direct, and intellectual contribution to the work and approved it for publication.
Funding
This article was financially supported by the Key Scientific Research Fund of Xihua University (Grant No: Z17113), the Key Project of Sichuan Education Department (Grant No: 18ZA0457), the Opening Fund of Key Laboratory of Deep Earth Science and Engineering Ministry of Education of Sichuan University (Grant No: DESE202003), and Chengdu Engineering Corporation Limited (CHIDI), POWERCHINA.
Conflict of Interest
XZ, SZ, and RC were employed by Chengdu Hydroelectric Investigation and Design Institute Corporation.
The remaining authors declare that the research was conducted in the absence of any commercial or financial relationships that could be construed as a potential conflict of interest.
Publisher’s Note
All claims expressed in this article are solely those of the authors and do not necessarily represent those of their affiliated organizations, or those of the publisher, the editors and the reviewers. Any product that may be evaluated in this article, or claim that may be made by its manufacturer, is not guaranteed or endorsed by the publisher.
Acknowledgments
The authors wish to acknowledge the significant contributions to this study by all colleagues of Sichuan University and CHIDI who provided large amounts of original data.
References
1. Singh M, Rao KS, Ramamurthy T. Strength and Deformational Behaviour of a Jointed Rock Mass. Rock Mech Rock Engng (2002) 35(1):45–64. doi:10.1007/s006030200008
2. Lajtai EZ. Shear Strength of Weakness Planes in Rock. Int J Rock Mech Min Sci Geomech Abstr (1969) 6(7):499–515. doi:10.1016/0148-9062(69)90016-3
3. Savilahti T, Nordlund E, Stephansson O. Shear Box Testing and Modeling of Joint Bridges. Int J Rock Mech Min Sci Geomech Abstr (1990) 28:295–300. doi:10.1016/0148-9062(91)92236-r
4. Zhu WS, Liang ZY, Wang P, Caizhao z. Research on Strength Behavior of Jointed Rock Mass by Numerical and Physical Simulation. Proc of the Intern Conf on Mechanics of Jointed and Faulted Rock, Vienna (1990) 29:389–397. doi:10.1016/0148-9062(92)93749-a
5. Reyes O, Einstein H. Failure Mechanism of Fracture Rock – A Fracture Coalescence Model. In: Proceedings 7th International Congress of Rock Mechanics; 16-20 Sep 1991; Germany, Aachen: Balkema Publishers (1991). p. 333–40.
6. Min K-B, Jing L. Numerical Determination of the Equivalent Elastic Compliance Tensor for Fractured Rock Masses Using the Distinct Element Method. Int J Rock Mech Mining Sci (2003) 40(6):795–816. doi:10.1016/S1365-1609(03)00038-8
7. Shi GH. Discontinuous Deformation Analysis: A New Numerical Model for the Statics and Dynamics of Block System. Berkeley: University of California at Berkeley (1988).
8. Ge XR, Ren JX, Pu YB, Ma W, Zhu Y. A Real in Time CT Triaxial Testing Study of Meso-Damage Evolution. Chin J Rock Mech Eng (1999) 18(5):497–502. doi:10.3321/j.issn:1000-6915.1999.05.001
9. Kawakata H, Cho A, Kiyama T, Yanagidani T, Kusunose K, Shimada M. Three-dimensional Observations of Faulting Process in Westerly Granite under Uniaxial and Triaxial Conditions by X-ray CT Scan. Tectonophysics (1999) 313:293–305. doi:10.1016/s0040-1951(99)00205-x
10. Labuz JF, Biolzi L. Experiments with Rock: Remarks on Strength and Stability Issues. Int J Rock Mech Mining Sci (2007) 44(4):525–37. doi:10.1016/j.ijrmms.2006.09.005
11. Feng X-T, Chen S, Zhou H. Real-time Computerized Tomography (CT) Experiments on sandstone Damage Evolution during Triaxial Compression with Chemical Corrosion. Int J Rock Mech Mining Sci (2004) 41:181–92. doi:10.1016/S1365-1609(03)00059-5
12. Kim J-S, Lee K-S, Cho W-J, Choi H-J, Cho G-C. A Comparative Evaluation of Stress-Strain and Acoustic Emission Methods for Quantitative Damage Assessments of Brittle Rock. Rock Mech Rock Eng (2015) 48(2):495–508. doi:10.1007/s00603-014-0590-0
13. Wang C, Chang X, Liu Y. Experimental Study on Fracture Patterns and Crack Propagation of Sandstone Based on Acoustic Emission. Adv Civil Eng (2021) 2021:1–13. doi:10.1155/2021/8847158
14. Wang J, Xie L, Xie H, Ren L, He B, Li C, et al. Effect of Layer Orientation on Acoustic Emission Characteristics of Anisotropic Shale in Brazilian Tests. J Nat Gas Sci Eng (2016) 36:1120–9. doi:10.1016/j.jngse.2016.03.046
15. Zhang G, Li H, Wang M, Li X, Wang Z, Deng S. Crack-induced Acoustic Emission and Anisotropy Variation of Brittle Rocks Containing Natural Fractures. J Geophys Eng (2019) 16(3):599–610. doi:10.1093/jge/gxz031
16. Zhang H, Lu C-P, Liu B, Liu Y, Zhang N, Wang H-Y. Numerical Investigation on Crack Development and Energy Evolution of Stressed Coal-Rock Combination. Int J Rock Mech Mining Sci (2020) 133:104417. doi:10.1016/j.ijrmms.2020.104417
17. Chen Y. Application of Acoustic Emission Techniques to Rock Mechanics Research. J Mech Strength (1977) 05:312–22. (in chinese).
18. Zhang BQ. Principle and Application of Acoustic Emission. Petro-chemical Equipment (1980)(06) 47–57.
19. Li Y, Xue L, Wu X. Study on Acoustic Emission and X-ray Computed-Tomography Characteristics of Shale Samples under Uniaxial Compression Tests. Environ Earth Sci (2019) 78(5):173. doi:10.1007/s12665-019-8185-4
20. Zhou HW, Wang ZH, Ren WG, Liu ZL, Liu JF. Acoustic Emission Based Mechanical Behaviors of Beishan Granite under Conventional Triaxial Compression and Hydro-Mechanical Coupling Tests. Int J Rock Mech Mining Sci (2019) 123:104125. doi:10.1016/j.ijrmms.2019.104125
21. Zhang Y, Feng X-T, Yang C, Zhang X, Sharifzadeh M, Wang Z. Fracturing Evolution Analysis of Beishan Granite under True Triaxial Compression Based on Acoustic Emission and Strain Energy. Int J Rock Mech Mining Sci (2019) 117:150–61. doi:10.1016/j.ijrmms.2019.03.029
22. Xu J, Liu Y, Peng S. Acoustic Emission Parameters of Three Gorges Sandstone during Shear Failure. Acta Geophys (2016) 64(6):2410–29. doi:10.1515/acgeo-2016-0094
23. Liu X, Gu Q, Tan Y, Ning J, Jia Z. Mechanical Characteristics and Failure Prediction of Cement Mortar with a Sandwich Structure. Minerals (2019) 9(3):143. doi:10.3390/min9030143
24. Zhang Q, Zhang X-P. A Numerical Study on Cracking Processes in limestone by the B-Value Analysis of Acoustic Emissions. Comput geotechnics (2017) 92:1–10. doi:10.1016/j.compgeo.2017.07.013
25. Zhou Z, Wang H, Cai X, Chen L, E Y, Cheng R. Damage Evolution and Failure Behavior of Post-Mainshock Damaged Rocks under Aftershock Effects. Energies (2019) 12(23):4429. doi:10.3390/en12234429
26. Lei X, Kusunose K, Rao MVMS, Nishizawa O, Satoh T. Quasi-static Fault Growth and Cracking in Homogeneous Brittle Rock under Triaxial Compression Using Acoustic Emission Monitoring. J Geophys Res (2000) 105(B3):6127–39. doi:10.1029/1999JB900385
27. Yang J, Mu Z-L, Yang S-Q. Experimental Study of Acoustic Emission Multi-Parameter Information Characterizing Rock Crack Development. Eng fracture Mech (2020) 232:107045. doi:10.1016/j.engfracmech.2020.107045
28. Xue Y, Dang F, Cao Z, Du F, Ren J, Chang X, et al. Deformation, Permeability and Acoustic Emission Characteristics of Coal Masses under Mining-Induced Stress Paths. Energies (2018) 11(9):2233. doi:10.3390/en11092233
29. Zha E, Zhang R, Zhang Z, Ai T, Ren L, Zhang Z, et al. Acoustic Emission Characteristics and Damage Evolution of Rock under Different Loading Modes. Energies (2020) 13(14):3649. doi:10.3390/en13143649
30. Zhang L, Yang D, Chen Z. Deformation and Failure Characteristics of Weathered Granite under Uniaxial Compression. AIP Adv (2019) 9(7):075222. doi:10.1063/1.5113661
31. Lisjak A, Liu Q, Zhao Q, Mahabadi OK, Grasselli G. Numerical Simulation of Acoustic Emission in Brittle Rocks by Two-Dimensional Finite-Discrete Element Analysis. Geophys J Int (2013) 195(1):423–43. doi:10.1093/gji/ggt221
32. Zhao XP. Study on Mechanics Behavior of Fractured Coal Rock-Mass. Chengdu: Sichuan University (2013).
33. Katsuyama K. Application of AE Techniques. Beijing: China Metallurgical Industry Press (1996). Translated by Feng Xiating.
34. Liu XL, Liu Z, Li XB, Si HM. Acoustic Emission B-Values of limestone under Uniaxial Compression and Brazilian Splitting Loads. Rock Soil Mech (2019) 40(S1):267–74.
35. Kong X, Wang E, Hu S, Shen R, Li X, Zhan T. Fractal Characteristics and Acoustic Emission of Coal Containing Methane in Triaxial Compression Failure. J Appl Geophys (2016) 124:139–47. doi:10.1016/j.jappgeo.2015.11.018
36. Su G-s., Gan W, Zhai S-b., Zhao G-f. Acoustic Emission Precursors of Static and Dynamic Instability for Coarse-Grained Hard Rock. J Cent South Univ (2020) 27(10):2883–98. doi:10.1007/s11771-020-4516-6
37. Triantis D. Acoustic Emission Monitoring of marble Specimens under Uniaxial Compression. Precursor Phenomena in the Near-Failure Phase. Proced Struct Integrity (2018) 10:11–7. doi:10.1016/j.prostr.2018.09.003
38. Meng H, Yang Y, Wu L, Wang F, Peng L. Study of Strength and Deformation Evolution in Raw and Briquette Coal Samples under Uniaxial Compression via Monitoring Their Acoustic Emission Characteristics. Adv Civil Eng (2020) 2020:1–16. doi:10.1155/2020/8868754
Keywords: fractured coal–rock mass, failure evolution, acoustic emission, maximum amplitude, distribution regularity
Citation: Liu X, Zhao X, Zhang S, Congyan R and Zhao R (2021) Research on the Failure Evolution Process of Rock Mass Base on the Acoustic Emission Parameters. Front. Phys. 9:635306. doi: 10.3389/fphy.2021.635306
Received: 30 November 2020; Accepted: 07 July 2021;
Published: 24 August 2021.
Edited by:
Yunlai Zhou, Universidade Lusófona, PortugalReviewed by:
Srutarshi Pradhan, Norwegian University of Science and Technology, NorwayTao Lai, Nanjing Tech University, China
Ferenc Kun, University of Debrecen, Hungary
Copyright © 2021 Liu, Zhao, Zhang, Congyan and Zhao. This is an open-access article distributed under the terms of the Creative Commons Attribution License (CC BY). The use, distribution or reproduction in other forums is permitted, provided the original author(s) and the copyright owner(s) are credited and that the original publication in this journal is cited, in accordance with accepted academic practice. No use, distribution or reproduction is permitted which does not comply with these terms.
*Correspondence: Xiaoping Zhao, 2013012@chidi.com