On the Determination of Coordination Numbers of Coupled DEM-DFN Model for Modeling Fractured Rocks
 Xiaoyi Xu
 Li-Yun Fu
 Ning Liu4*
 - 1State Key Laboratory of Ore Deposit Geochemistry, Institute of Geochemistry, Chinese Academy of Sciences, Guiyang, China
- 2University of Chinese Academy of Sciences, Beijing, China
- 3Key Laboratory of Deep Oil and Gas, China University of Petroleum (East China), Qingdao, China
- 4College of Mechanical and Electrical Engineering, Beijing University of Chemical Technology, Beijing, China
Natural fractured rocks usually contain background granular media and multi-scale fractures. The coordination number is a crucial factor to characterize the connection of microstructural elements. The determination of coordination numbers for modeling fractured rocks is essential to interpret the distribution of cracks related to micromechanical properties. We have built a consistent workflow of discrete element models (DEMs) coupled with discrete fracture networks (DFNs). This DEM-DFN model could provide a simple formulation for high calculation efficiency to model a more realistic and detailed description of fracture system. A series of numerical experiments are set up, aiming to correlate window radius, particle size, and crack length, which will benefit the window selection for measuring coordination numbers based on the crack characteristics. The coordination number determined in the DEM-DFN modeling can be used to identify crack patterns in the spatial distribution.
Introduction
Natural fractured rocks in sedimentary basins generally consist of background granular media and a cluster of multiscale fractures. The former consists of irregular mineral (rock) grains jointed each other, composing the main body of rock masses. The latter refers to the microgeometry configuration of crack surfaces which control the mechanical behavior of rock masses. Continuum- and discrete-based methods have been widely used to model rocks. The former, mainly including finite-difference and finite-element numerical approaches, takes matter to be continuously distributed throughout a body. It provides a reasonable assumption for analyzing the macroscale behavior of rocks, with a high computational efficiency but suffering from strong homogenization. The latter regards rocks as an assembly of microstructural elements that interact with each other by microstructural forces, where equilibrium, kinematics, and constitutive equations are generated for each microstructural element. In the discrete-based model, the coordination number is a crucial factor to characterize the connection of microstructural elements. In this study, we address the determination of coordination numbers for modeling fractured rocks.
Such jointed media as rocks are natural to treat in a more fundamental and numerically intensive manner (Brown, 2008) that can specifically account for individual factors that affect the mechanical behavior of rocks. A discrete element method (DEM) (Cundall, 1971; Cundall, 1988) has the potential to meet this need and is now often used to model rock deformations (Mühlhaus and Vardoulakis, 1987; van Baars, 1996; Donzé et al., 1997; Williams and Rege, 1997; Oda and Iwashita, 2000; Bolton et al., 2004; Shiu et al., 2008; Scholtès and Donzé, 2013). In this method, the rock mass is represented as an assembly of discrete elements. Granular textures, particle-scale kinematics, and force transmission can be correlated at the microlevel (Cowin, 2004), constituting a powerful tool to study the effect of microstructures on the macroscopic properties of rocks. The DEM now appears as an efficient numerical method to handle most of the problems with rock masses, such as material heterogeneities, irregularly geometric characteristics, nonlinear large deformations, and progressive failure through nucleation and propagation of microcracks (Zhao, 2010; Jiang et al., 2017; Liu and Fu, 2020a; Liu et al., 2021). It is worth to mention that Murphy and Fehler (1986) conduct a DEM modeling for hot dry rocks of enhanced geothermal systems and attribute microseismic responses to shear slip along the joints in rocks. In this study, we use the 2D DEM code PFC2D (Itasca, 2014) to implement the coupled DEM-DFN modeling of fractured rocks.
Even a few cracks can significantly impact on the mechanical behavior of rock masses. Current digital imaging techniques can map heterogeneous rock properties in detail, including both microcracks and grain structures at micrometer resolutions. Spatial heterogeneities, aligned configurations, stress orientations, rough fracture surfaces, and material anisotropies strongly affect crack patterns and effective elastic characteristics of fractured rocks. To model such intersecting and multiscale fractures with a high density, we have to resort to discrete-based models (Jing and Hudson, 2002). A discrete fracture network (DFN) has been proposed for this purpose, which allows simulation of very complex fracture networks. The DFN refers to a microgeometry configuration of crack surfaces that explicitly represents the topological relationship between individual fractures or fracture sets. Combined with continuum- and discrete-based approaches, the DFN has been widely used in various engineering analyses with fractured rocks (Brady and Brown, 1993; van Baars, 1996; Jing, 2003; Gale et al., 2007; McClure, 2012; Alghalandis et al., 2017; Liu and Fu, 2020a). Continuum-based approaches coupled with DFN could model fractured rocks with only a sparsely connected DFN, but become difficult for high-density and complex DFNs because of the intrinsic limit of continuum-based methods (Jiang et al., 2017). For more complex DFNs, discrete-based approaches seem more suitable (Jing and Hudson, 2002), especially for fractured rocks with a wide range of mineral compositions and fabric anisotropies. In discrete-based methods coupled with a DFN, the positions of fractures and cracks are predefined by the DFN where the discrete elements crossing the DFNs are replaced by the corresponding joint particles (i.e., DEs), then solving the resulting system as a set of interacting elements according to Newtonian mechanics. Lei et al. (2017) conduct a DFN modeling for the mechanical and hydrological behavior of fractured rocks. Harthong et al. (2012) propose a coupled DEM-DFN model for strength characterization of rock masses.
The DEM connects elements through contact surfaces, with a flexibility to handle the contact complexity of granular materials (Zhao, 2010). Coordination number, defined as the average number of contacts per grain, is one of the important microstructural indexes of jointed media and contributes largely to particle-scale kinematics and microscopic mechanisms. The contact grid structure by coordination number in a granular system reflects the tightness and strength (e.g., Donzé et al., 1997; Scholtès and Donzé, 2013), critical state (Rothenburg and Kruyt, 2004), dynamic strength (Olson Reichhardt et al., 2015; Lemrich et al., 2017), and pore throat connectivity (Andriamihaja et al., 2019) of rocks. Zhang (2015) identifies the spatial distribution of cracks based on the change of coordination numbers in the measurement window, which shows a specific correlation between coordination numbers and crack distributions. This motivates us to estimate the coordination number in the measurement window for predicting the distribution of cracks from a simple two-dimensional (2D) scenario. For this purpose, we conduct a series of numerical experiments by applying the coupled DEM-DFN 2D model to emulate fractured rocks. We assume a homogeneous rock matrix, which is widely used in the available studies (Lei et al., 2017; Liu and Fu, 2020a; Liu and Fu, 2020b; Liu et al., 2021). Also, we keep a simple formulation of the DEM (i.e., spherical particles and linear elastic contact laws) for high calculation efficiency. The DFN is used to realize a more realistic and detailed description of the fracture system. The objective of this work is to optimize the window size with attempts to determine the distribution of coordination numbers, which captures the structural characteristics of cracks. In general, too large or too small windows cannot be able to localize the contact characteristics accurately and efficiently. We aim to correlate window radii, particle sizes, and crack lengths, which will facilitate the window selection for measuring coordination numbers based on the crack characteristics. It provides us an easy way to monitor the variation of coordination numbers to identify crack patterns in the spatial distribution.
After a brief description of the coupled DEM-DFN model, sensitivity analyses for single-crack and double-crack models with different arrangements will be provided to emphasize the effect of window sizes on the response, with the simulated crack information compared to the actual crack information obtained by digital imaging techniques. The resulting scale dependence of coordination numbers on the window sizes helps to quantify the correlation of window radii, particle sizes, and crack lengths for the single-crack and double-crack models. We then apply rock-fracturing and Brazilian splitting experiments with microcracks to validate our numerical scheme.
Theory of Coupled DEM-DFN Model
The coupled DEM-DFN model for fractured rocks combines the rock matrix and fracture geometries represented by DEs and DFs, respectively. The DFN is merged into the background DEM in a simple yet efficient way, where the DE links that cross DFs are removed (Curtin and Scher, 1990; Liu and Fu, 2020a; Liu et al., 2021). In this section, we will introduce the coupled DEM-DFN model in detail.
DEM for Intact Rock Modeling
We use the DEM to model intact rock because of its ability of simulating the large deformation of jointed rock masses and expressing the geometric property of rock grains. In the present DEM model, intact rock is represented by a set of bonded spherical particles where elements interact through normal and shear springs at contact surfaces. The density of interaction bonds is controlled by coordination numbers to represent the main aspects of different rock types’ behavior (Scholtès and Donzé, 2013). Every unitary force is accumulated for interaction where an explicit central finite difference is introduced to integrate individual motion equations for every element.
In this study, the optimal window of coordination-number measurements for a specific fractured rock is investigated based on the DEM code PFC2D platform (Itasca, 2014) with regular hexagonal packings. The software uses rigid particles with a soft-contact mode, which cannot change their shapes or sizes, but allowing to overlap at contact surfaces. A brief description of the DEM model is given in Supplementary Appendix A for its particle-scale kinematics and equilibrium. The DEM algorithm involves two steps. First, interaction forces between DEs are calculated according to the force-displacement law. Second, Newton’s law of motion is applied to each DE to update its velocity and position based on the force and moment, which is then time integrated to find its new position. This process is repeated until the simulation is finished. Figure 1A demonstrates the calculation cycle system of any DE, connecting with the normal and shear springs (see Figure 1B) at contact surfaces. The force-displacement law applied to each contact to update the contacting force using the microscale constitutive law, as shown in Figure 1C.
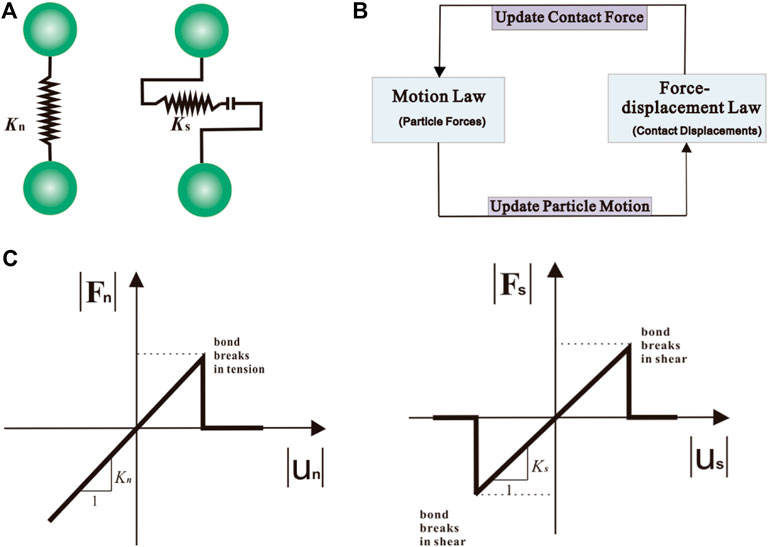
FIGURE 1. Calculation cycle system (A) with normal and shear springs at contact surfaces (B) by microscale constitutive law (C).
The DEs do not correspond to real mineral grains with distinct angularities and different sizes. The DEM formulation phenomenologically describes the particle-scale contact behavior of jointed media by ignoring size-dependent effects for fast computations. The matrix of intact rock is emulated as an elastic, homogeneous, and isotropic medium. Even though this kind of element arrangement is one of the most convenient way to model discontinuum media, it may cause artificial anisotropy (Zhao, 2010). Harthong et al. (2012) generate polydisperse packings to avoid the anisotropic effect linked to regular packings.
DFN for Complex Fracture Modeling
The DFN starts with spatial statistics associated with a fracture network (fracture orientation, size, density etc.) measured by high-resolution SEM (scanning electron microscope) of cores or surface outcrops. These statistics reconstruct the topological relationship between individual fractures or fracture sets and can be used to generate realizations of fracture network with the same spatial properties. Therefore, the resultant DFN is a geometry configuration of fracture surfaces that explicitly represents the geometric property of individual fractures.
As shown in Figure 2, the DFN geometry is expressed by discrete surface elements, generated usually based on the point process represented by Baecher model (Baecher et al.,1977). For 3D cases, the Baecher model describes a crack as a disk (see Figure 2A) with inclination and area. In the 2D plane, the crack can be simplified as a line segment with different lengths and dip angles (see Figure 2B). The point process determines the center position of the crack, associated with the attributes of the point, such as crack length, direction, inclination, and other crack properties. It is worth noting that Harthong et al. (2012) do not consider the discontinuity thickness of 2D and 3D models. In this study, we could represent the crack aperture by the relative normal displacement of joint particles on each side of the fracture. We produce single-crack and double-crack models with different lengths and dip angles. We optimize the window size to estimate coordination numbers that capture the structural characteristics of cracks based on a series of numerical experiments.
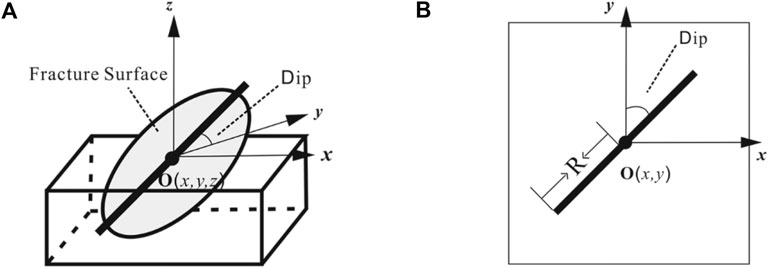
FIGURE 2. Baecher model for crack characterization. (A) 3D Baecher disk. (B) 2D simplification.
The obtained DFN can be inserted into the background DEM. The entire calculation process for the coupled DEM-DFN modeling is illustrated in Figure 3. First, the coordinates of mass DEs are generate within a specific area, with the contacts between DEs defined properly. Then, the corresponding DFN, created by fracture attributes, is merged into the DEM, where the contact links crossing the DFs are removed (Curtin and Scher, 1990; Liu and Fu, 2020a; Liu et al., 2021). The force and moments acting on each DE are calculated, such that the position of DEs can be updated by a central difference scheme. The updated forces acting on every contact are estimated from the relative displacement of DEs. More details are given in Supplementary Appendix A. The resultant DEM-DFN coupling model can be used to simulate fractured rocks.
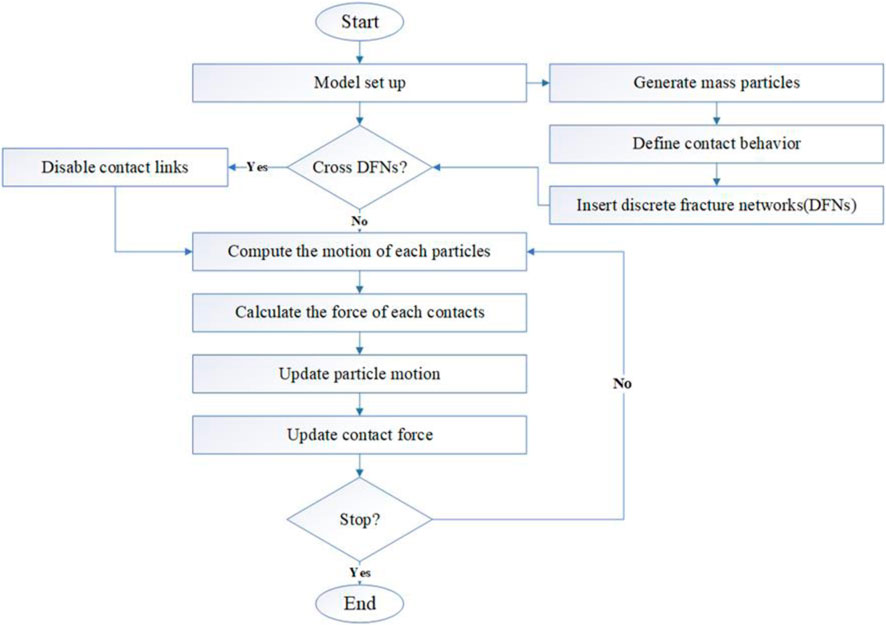
FIGURE 3. Flowchart for DEM-DFN modeling.
Coordination Number
Oda (1977) experimentally investigates the coordination number of random assembly of particles, which is defined as the mean number of contacts between a particle and other particles around. Interaction forces between every pair of particles are transferred through their contact surfaces (Cundall, 1988). Therefore, the coordination number is an important parameter to describe the micromechanical behavior of materials. Previous studies have given several typical formulas to compute the coordination number (e.g., Scholtès and Donzé, 2013). Bathurst (1987) defines the average coordination number in the particle aggregation system as M/N, where M and N are the total numbers of contacts and particles, respectively.
Some particles in a particle system are often in the state of no contact or only one contact. Such contacts have no effect on the force transmission in the particle system. These inaction particles should not be considered when analyzing the coordination number of particles in the system. Therefore, Thornton (2000) excludes the inaction particles by defining the average coordination number Cn in the particle system as,
where Mc is the number of contact pairs, N is the total number of particles, N1 is the number of particles with only one contact, and N0 is the number of suspended particles with no contact. To eliminate suspended particles for the accuracy of measurements, the sample is compacted prior to the start of measurements. In a compact system without suspended particles, the mean coordination number can be calculated as (Itasca, 2014)
where Mi (
Measurement Window Generation and Coordination Number Estimation
Mauldon et al. (2001) propose a method of characterizing the crack geometry with circular scanlines and circular windows. Here, we generate a measurement window by specifying a radius at the coordinate center in a similar way. Then, we use a control variable to quantify the relationship between window radii and particle sizes. For a given particle size, we change the window radius and extract crack properties to investigate the effect of window radii. In this way, we can achieve an optimal measurement window.
Aparicio and Cocks (1995) demonstrate that the coordination value of a single particle system under the quasi-static state is 6. That is, when the time step is small enough, the whole movement process under a quasi-static loading is regarded as the static calculation with a constant acceleration and speed. The contact number between each particle and its surrounding particles is approximatively six for a system with the same particle radius according to Eq. 2. Figure 4A shows a measurement layout covered uniformly with a number of circular measuring windows for a sample (Length × Height in size). We aim to use fewer measuring windows to monitor more particles, achieving the optimal size of measurement windows, as shown in Figure 4B for an enlarged view of a circular window.
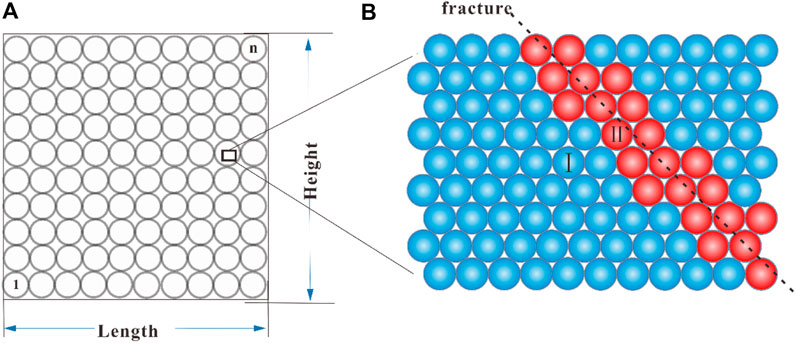
FIGURE 4. A measurement layout for a sample with Length × Height in size. (A) Circular measuring windows. (B) Enlarged view of a circular window. Particles with normal contacts are indicated in blue and particles affected by fractures are shown in red.
In Figure 4B, we see a crack across the DE link of red particles. Two different types of DEs are defined in this measuring window. Type I away from the crack denotes the regular DEs with a normal contact to the surrounding DEs. Type II near the crack represents the DF-DEs with a joint (removed) contact to the surrounding DEs. Figure 5 shows the contact pattern for these two types of DEs, respectively. We see that these two types of contact patterns have different contact numbers that cause the difference in estimating coordination numbers because the measuring window does not count these joint (removed) contacts. Therefore, we can judge whether there are cracks in the measuring area according to the decrease of coordination numbers. Theoretically, the methodology is suitable for any case where the background medium shares the same or almost the same coordination numbers, even if DEs are in hexagonal, orthogonal, or polydisperse packings with a minimal size ratio that represents different material types, such as rocks (Liu and Fu, 2020b), concrete (Nitka and Tejchman, 2015), or even Martian regolith (Lai and Chen, 2017). In other words, the modeled matrix could be isotropic or anisotropic in 2D or 3D, as long as the measurement window placement is optimized. Specifically, this coordination-number-based crack inversion method is also suitable for the case in that the rock matrix with approximately the same coordination numbers is not isotropic and homogenous media as mentioned in the references (e.g., Liu et al., 2017; Liu and Fu, 2020b).
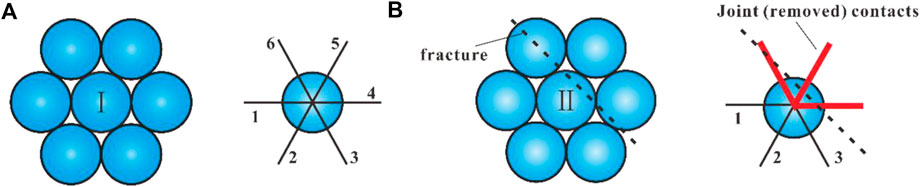
FIGURE 5. Contact patterns for two different types of DEs away from and near the crack, respectively. (A) Normal contacts for Type Ⅰ. (B) Joint (removed) contacts for Type Ⅱ.
Guidelines for Optimal Measurement Window Selection
This section provides clear guidelines for selecting optimal windows in the modeling of fractured media based on the single and double crack DEM-DFN models. We use measuring windows with different radii for a sample to produce groups of coordination data. For each measurement, crack characteristics could be identified by the estimated coordination number image and then extracted using digital image processing techniques. Comparisons between the extracted and the realistic crack properties allow us to select a reasonable measuring window radius.
Single-Crack DEM-DFN Model
We conduct a series of uniaxial tensile tests (see Figure 6A) for a sample of L = 10 mm in length using equal-radius (R = 0.5 mm) particles set in a regular hexagonal grid. In the DFN model, we couple a single crack into the DEM model. As shown in Figure 6B, the single crack is designed with four different lengths of 20, 30, 40, and 50 mm (denoted by I, II, III, and IV in the figure, respectively) and four different dip angles of 0°, 15°, 30°, and 45°. Noted that, the crack length in the DEM-DFN simulation is generally suggested to be more than ten times the particle radius and less than half the length of the sample (Harthong et al., 2012). It ensures that the pre-existing fractures modeled do not cross the whole sample with enough resolution. We have 16 parameter models in total for uniaxial tensile tests.
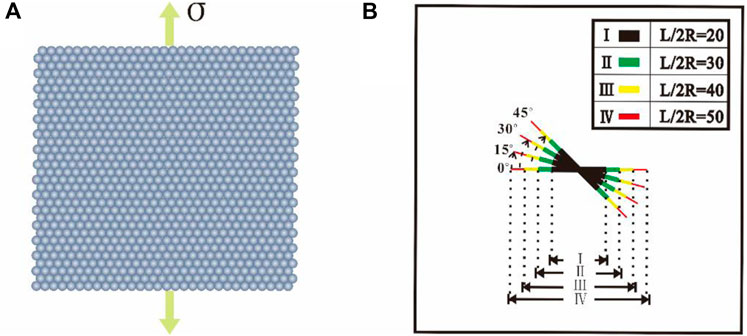
FIGURE 6. Loading path and single crack diagram. (A) Uniaxial tensile test. (B) Single-crack design.
For each parameter model, we use 12 different-radius measuring windows to monitor its coordination numbers, respectively. A dimensionless parameter, the size ratio of the measurement window to particles, is introduced to measure the optimization of results. For each simulation, the coordination number is retrieved from the resulting coordination cloud chart and processed by image binarization. Figure 7 shows the error of estimated and realistic crack lengths vs. dimensionless parameter for four different dip angles, respectively. We see that the different radius measuring windows lead to different deviations in measuring the crack length, implying a metric match between measuring windows and inversion errors for a given crack length. We aim to use fewer measuring windows to monitor more particles. Larger windows cause more significant errors but with fewer computational costs. The errors become quite small for the dimensionless parameter less than 1, with their distribution concentrated around 0.05, as displayed in Figure 7.
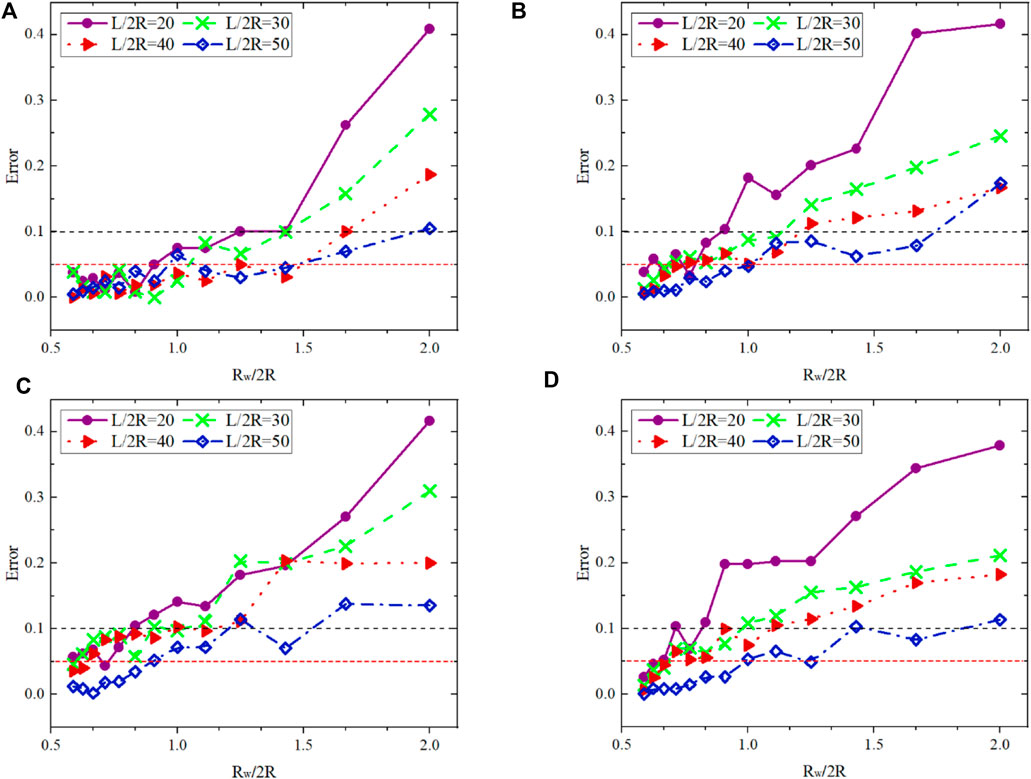
FIGURE 7. Errors of estimated and realistic crack lengths vs. dimensionless parameter for four different dip angles in the single crack DEM-DFN model. (A) 0° single-crack measurement error. (B) 15° single-crack measurement error. (C) 30° single-crack measurement error. (D) 45° single-crack measurement error.
The simulated data in Figure 7 are used for first-order differentiation analyses to determine the optimal radius of measuring windows. We take the initial value at the starting point of Rw/2R as the basis for differentiation calculations. The results for different dip angles are shown in Figure 8, where two dimensionless parameters are correlated each other. We see that for the regular orthogonal window with the compression direction along the vertical axis, the optimal radius of measuring windows is related to the projection length of a crack in the horizontal direction. Among these cracks with the same length, the 0°crack presents a relatively small radius for the optimization window. The optimal radius is also affected by the size and proportion of cracks. We note that L/2R = 40 corresponds to an inflection point, with the corresponding crack length up to 40% of the sample length. Compared to the model size used in this paper, the crack size for L/2R > 40 is relatively large. We can choose a larger window radius with fewer windows for a rough estimation of coordination numbers that can capture approximately the position of cracks in the sample. This facilitates the estimation of local mechanical properties.
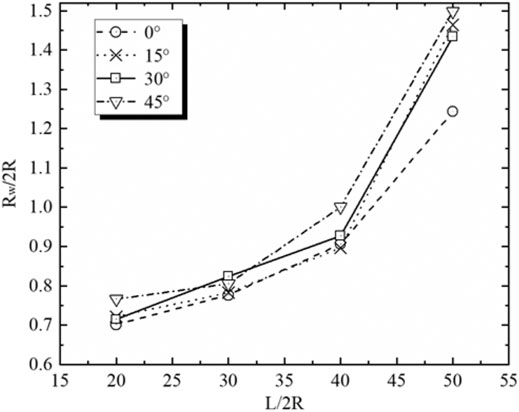
FIGURE 8. Crossplot of two dimensionless parameters (Rw/2R and L/2R) for the determination of optimal measuring windows in the single-crack DEM-DFN model.
The optimal Rw/2R ranges from 0.7 to 1.5 for given crack lengths. In conclusion, we can select the optimal radius of measuring windows for different-length cracks based on the crossplot of two dimensionless parameters (Rw/2R and L/2R), as shown in Figure 8.
Double-Crack DEM-DFN Model
The single-crack numerical experiments addressed previously are extended to a double-crack DEM-DFN model using the same mechanical and testing parameters. Two cracks are coupled into the DEM model by three types of spatial arrangements (Zhao et al., 2016) to characterize different stress interactions, where the distant, collinear, and stacked double cracks represent non interaction, stress amplification, and stress shielding, respectively. Figure 9 shows different spatial arrangements for double cracks with different lengths and dip angles, with each having 16 parameter models in total for uniaxial tensile tests.
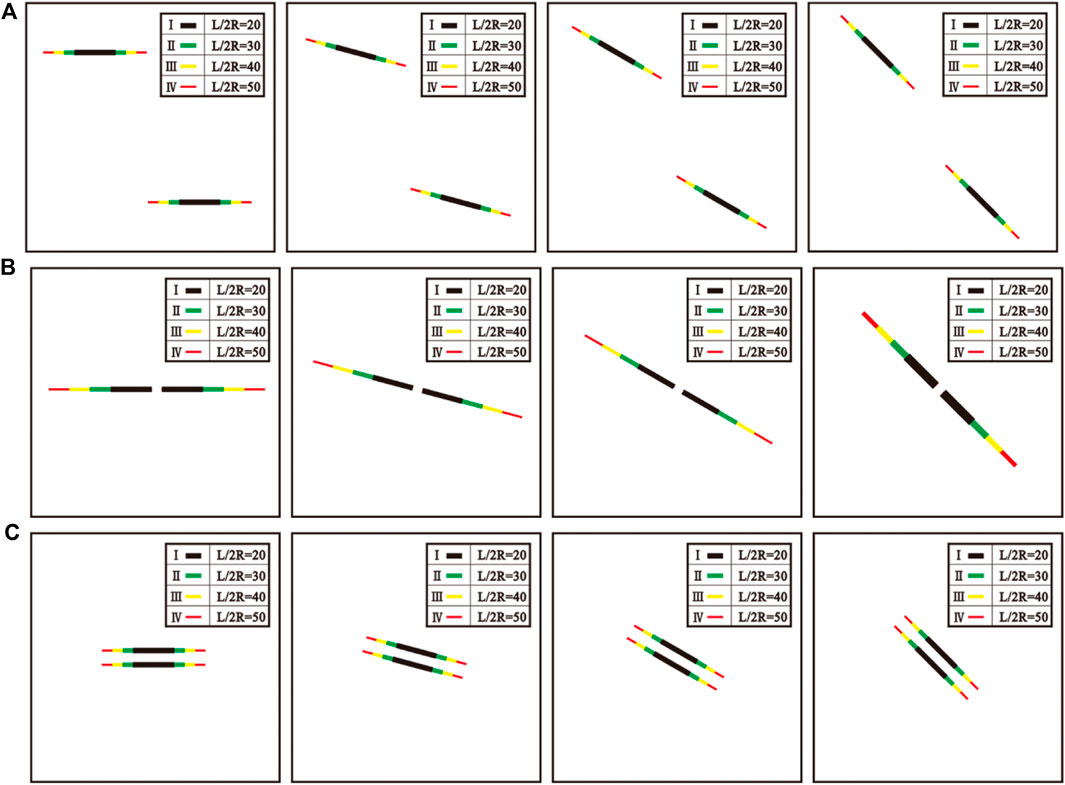
FIGURE 9. Three types of spatial arrangements of double cracks with different lengths (20, 30,40, and 50 mm) and dip angles (0°, 15°, 30°, and 45°). (A) Distant double cracks. (B) Collinear double cracks. (C) Stacked double cracks.
Similarly, for each parameter model, twelve different-radius measuring windows are used to monitor its coordination numbers, respectively. The coordination number for each model is retrieved from the resulting coordination cloud chart, and in turn, is used to estimate the crack length. Errors of the estimated and realistic crack lengths are related to the dimensionless parameter (Rw/2R), as shown in Figure 10 for the three spatial arrangements of double cracks. We see that the deviations of crack lengths by different-radius measuring windows become more complex than those of the single-crack model (see Figure 7), though both the models share similar features. Different spatial arrangements of double cracks show a similar trend of error variations. Smaller measuring windows for longer cracks produce smaller measurement errors. However, the interaction between different arrangements of double fractures leads to a worse consistency of error variations than the single-crack model. As shown in Zhao et al. (2016), the double cracks with different spatial arrangements represent different types of stress interactions. Unlike distant double cracks and collinear double cracks, the stacked double cracks show larger errors possibly because of the stress shielding. The change in angles seems to have no obvious effect on the measurement error. The cracks with four different angles share similar trends in error variations. Shorter cracks have a larger measurement error, whereas longer cracks have a smaller measurement error. For the dimensionless parameter less than 1, however, the errors become small with their distribution concentrated around 0–0.1.
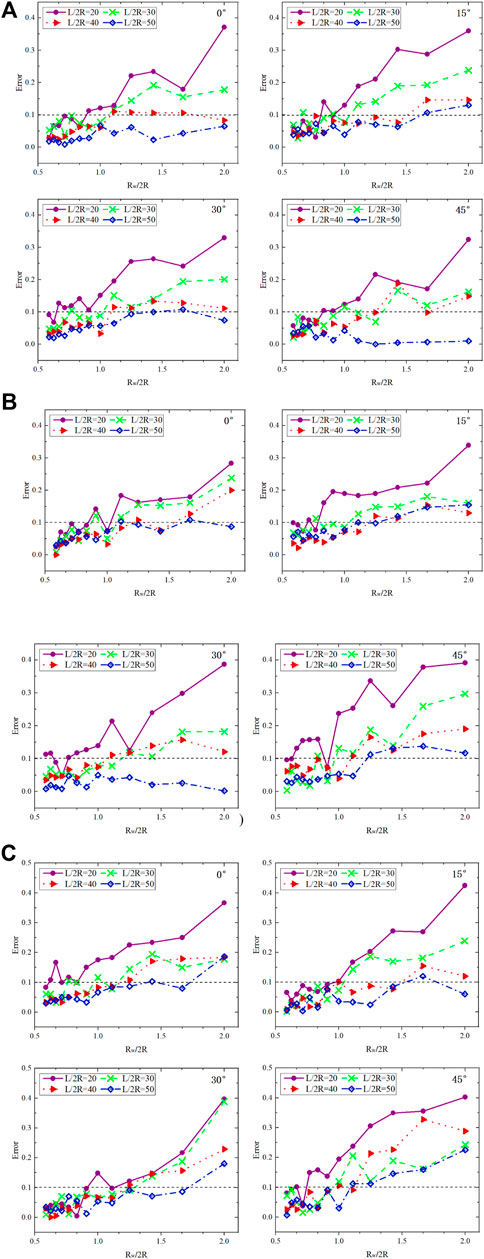
FIGURE 10. Errors of estimated and realistic crack lengths vs. dimensionless parameter for these three double-crack DEM-DFN models as shown in Figure 9. (A) Distant double cracks. (B) Collinear double cracks. (C) Stacked double cracks.
The simulated data in Figure 10 are used for first-order differentiation analysis in terms of the dimensionless parameters Rw/2R and L/2R to determine the optimal radius of measuring windows. The results are shown in Figure 11 for the three modes of double cracks. We see that unlike Figure 8 for the single-crack model the optimal window radius for double cracks doesn’t change much across different crack lengths and dip angles. Particularly, the effect of dip angles is rather small perhaps because of the interaction between cracks. The measurement error changes slowly with increasing window radii. The optimal Rw/2R ranges from 0.6 to 1.1 for given crack lengths.
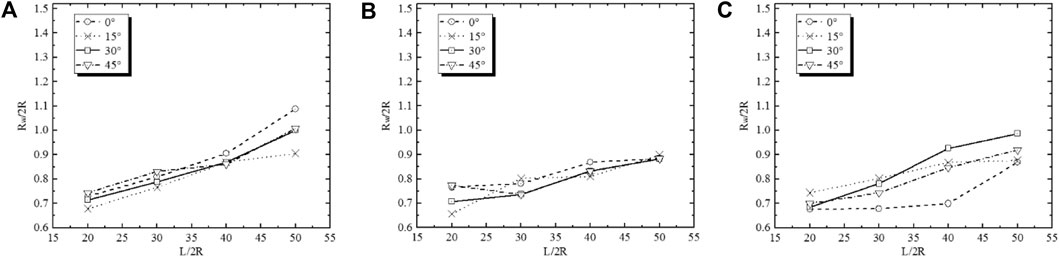
FIGURE 11. Crossplots of dimensionless parameters (Rw/2R and L/2R) for the determination of optimal measuring windows in these three double-crack DEM-DFN models as shown in Figure 9. (A) Distant double cracks. (B) Collinear double cracks. (C) Stacked double cracks.
Method Verification and Application
Direct tension tests are believed to be reliable, but it is difficult to prepare samples and configurate tests (Patel and Martin, 2017). Uniaxial compression and Brazilian split tests have been widely used as a simple and effective way to determine rock tensile strengths (Bieniawski and Hawkes, 1978; ASTM D3967-08, 2008). In this section, we conduct these tests of realistic rock samples to estimate coordination numbers with different-radius measuring windows based on the guidelines in Guidelines for Optimal Measurement Window Selection.
Case 1: Uniaxial Compression Test
A rock sample with natural cracks (including crossed fractures) from a real outcrop is imaged by high-resolution SEM techniques. The resulting digital section, as shown in Figure 12A is used for uniaxial compression tests. We see groups of complex cracks that distribute over the rock matrix in white. Based on the crossplot (see Figures 8, 11) of dimensionless parameters (Rw/2R and L/2R) for the determination of optimal measuring windows, we select four different-radius measuring windows for tests.
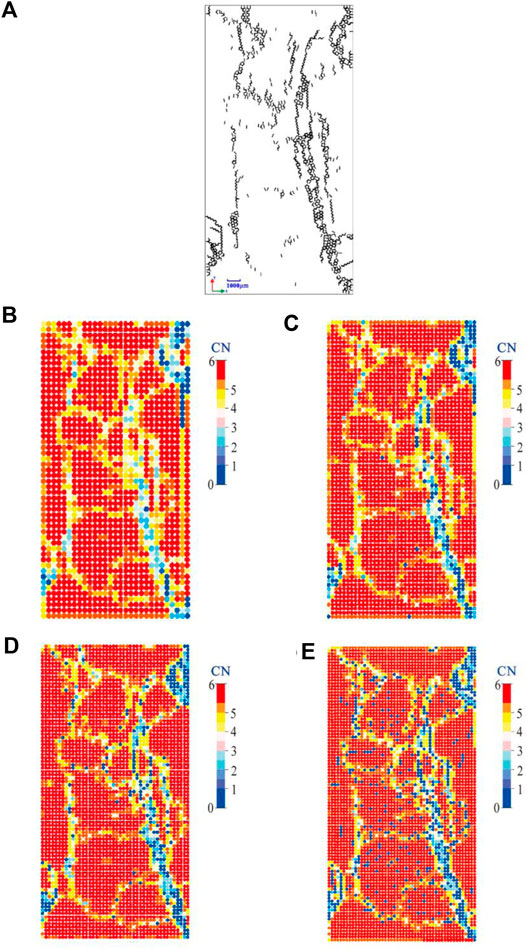
FIGURE 12. Rock sample with microcracks (A) with estimated coordination number (CN) maps for four different-radius measuring windows. (B)
The estimated distribution of coordination numbers is shown in Figures 12B–E for different values of Rw/2R, respectively. We see that the most area of sample image can be modeled by normal-contact particles without cracks crossing, leading to the maximum coordination number (in red), whereas the fractured areas by joint particles with cracks crossing cause the decrease of coordination numbers, which becomes more evident for the crossed fracture areas. Compared to Figure 12A, we also see that Figure 12B at Rw/2R = 1.5 underestimates the effect of cracks because of the distribution of overvalued coordination numbers in the fractured areas, whereas Figure 12E at Rw/2R = 0.8 seems to overestimate the effect of cracks because of too many blue particles even in non-crack areas. The optimal measuring window is probably located around Rw/2R = 0.9, as shown in Figure 12D.
Case 2: Brazilian Split Test
The Brazilian splitting test is known as the diametrical compressive test or splitting tension test (Bieniawski and Hawkes, 1978), which could be used to calculate the effective elasticity of an object under different loading orientations, with an attempt to minimize the anisotropy caused by cubic specimens (Liu and Fu, 2020a). Figure 13 shows a real outcrop of Ordovician carbonates in the northwest of the Shuntuoguole low uplift of Tarim Basin. We choose a circle zone as the target to conduct the Brazilian splitting test with a compressive strain rate of 0.015/s. Figure 13A shows the extracted fractures from the real outcrop and the corresponding DEM-DFN model with the length statistics of fracture segments displayed in Figure 13B.
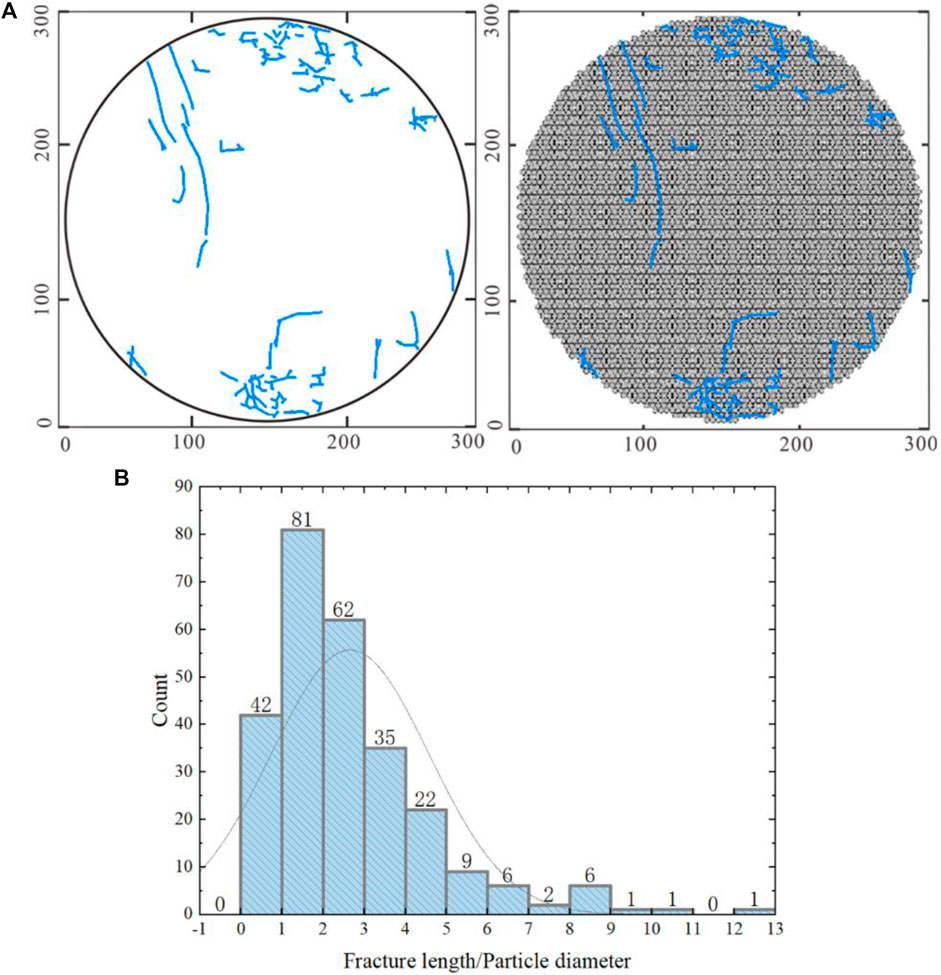
FIGURE 13. (A) Rock sample with cracks (unit: m). (B) Crack length histogram.
Figure 14 shows four groups of coordination-number distributions with different dimensionless parameters with the measurement window (Rw/2R and L/2R). We see that most of the red areas show normal-contact particles without cracks crossing, and the coordination number is approximately 6. In the fractured areas, the coordination number decreases to less than six due to the effect of joint (removed) contacts. Therefore, the inversion result becomes better for smaller dimensionless parameters of Rw/2R, like 0.7, or even 0.6.
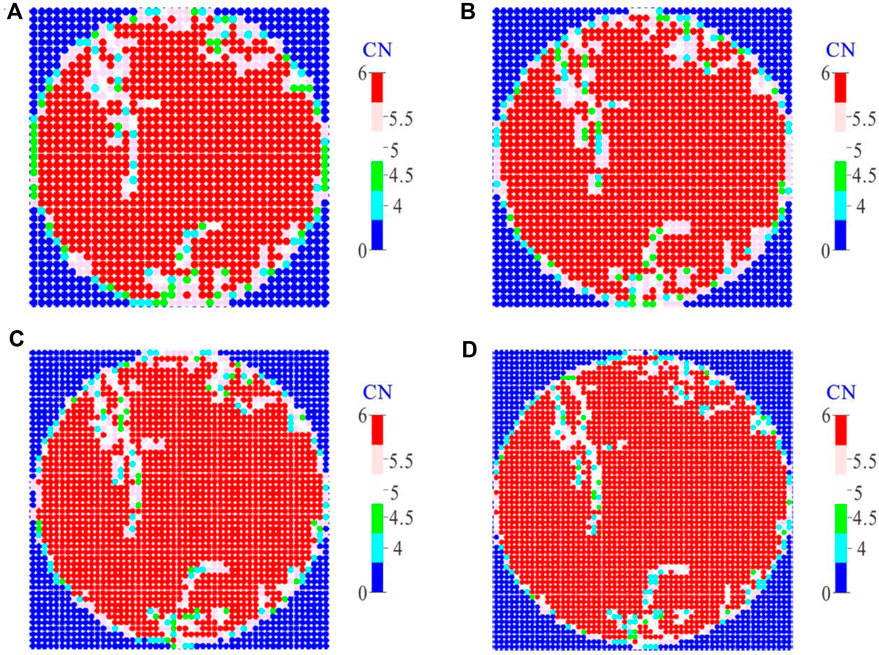
FIGURE 14. Estimated coordination number (CN) maps for four different-radius measuring windows. (A)
Conclusion
Coordination number is a crucial microstructural index of jointed rocks. We apply a coupled DEM-DFN model to simulate multi-scale fractured rocks with a high calculation efficiency. The objective is to optimize the size of measurement windows to determine the coordination number distribution that captures the structural characteristics of cracks. The main conclusions can be summarized as follows.
The measurement window is arranged in a regular orthogonal way with its compression direction along the vertical axis. Thus, the optimal window radius can be determined in terms of the projection length of a crack in the horizontal direction. Numerical experiments with various single-crack models show that the optimal radius is affected by the size, dip angle, and proportion of cracks. It can be estimated based on the crossplot of two dimensionless parameters (Rw/2R and L/2R) for different-length cracks. For cracks of the same length, the 0°crack has a relatively small radius for the optimization window. In general, we can choose a larger window radius with fewer windows for the rough estimation of coordination numbers that can capture approximately the position of cracks in the sample.
Unlike single-crack models, double-crack models (distant, collinear, and stacked arrangements) show complex error variations of the estimated and realistic crack lengths against the dimensionless parameter (Rw/2R) because of the interaction (no interaction, stress amplification, and stress shielding) between cracks. Numerical experiments with various double-crack models of different lengths and dip angles are performed to monitor the optimal coordination number for different-radius measuring windows. Although these models share similar error features, the crack interaction increases the deviation of error changes for different-radius measuring windows. Unlike distant double cracks and collinear double cracks, the stacked double cracks show larger errors possibly because of the stress shielding. The change in dip angles has no obvious effect on the measurement error. Shorter cracks have a larger measurement error whereas longer cracks have a smaller measurement error.
Uniaxial compression and Brazilian split tests for a rock sample from a real outcrop with natural cracks are used to validate the inversion of crack properties by the coupled DEM-DFN model through optimizing measurement windows for the estimation of coordination numbers. The estimated distribution of coordination numbers for different values of Rw/2R demonstrates that the optimal measuring window is probably located around Rw/2R = 0.6–0.9. The area without cracks crossing in the image can be modeled by normal contact particles with the maximum coordination number, whereas the area with cracks crossing is modeled by joint particles with less coordination numbers.
This work proposes a coordination-number-based crack inversion method for isotropic homogenous media in 2D. According to the quantitative evaluation and the characteristic comparison, it is reasonable to confirm that the methodology is efficient. Moreover, we may extend the conclusion to any case where the matrix DEs share the same coordination number, regardless of the types of materials, or packings in 2D or 3D. For more complex cases, the measurement window placement needs further optimization. Meanwhile, as we all know, even a few cracks can significantly impact the mechanical behavior of rock masses, so this kind of crack inversion method might have the potential for numerical upscaling from the microstructural responses to the macroscopic properties of fractured rocks. We would investigate the issues in the subsequent work.
Data Availability Statement
The raw data supporting the conclusion of this article will be made available by the authors, without undue reservation.
Author Contributions
LF, NL, and XX conceive this research. XX writes the manuscript and prepares the figures. LF and NL review and supervise the manuscript. The co-author TH are involved in the discussion of the manuscript. All authors finally approve the manuscript and thus agree to be accountable for this work.
Funding
The research is supported by the National Natural Science Foundation of China (Grant Nos. 41821002, 41720104006) and 111 Project “Deep-Superdeep Oil and Gas Geophysical Exploration” (B18055).
Conflict of Interest
The authors declare that the research was conducted in the absence of any commercial or financial relationships that could be construed as a potential conflict of interest.
The handling editor is currently organizing a Research Topic with one of the authors LF.
Supplementary Material
The Supplementary Material for this article can be found online at: https://www.frontiersin.org/articles/10.3389/feart.2021.665275/full#supplementary-material
References
Alghalandis, Y. F., Elmo, D., and Eberhardt, E. (2017). Similarity Analysis of Discrete Fracture Networks. Ithaca, NY: arXiv 1711.05257.
Andriamihaja, S., Padmanabhan, E., Ben-Awuah, J., and Sokkalingam, R. (2019). Static Dissolution-Induced 3D Pore Network Modification and its Impact on Critical Pore Attributes of Carbonate Rocks. Pet. Exploration Dev. 46, 374–383. doi:10.1016/s1876-3804(19)60017-0
Aparicio, N. D., and Cocks, A. C. F. (1995). On the Representation of Random Packings of Spheres for Sintering Simulations. Acta Metall Mater 43, 3873–3884. doi:10.1016/0956-7151(95)90170-1
ASTM D3967-08 (2008). Standard Test Method for Splitting Tensile Strength of Intact Rock Core Specimens. West Conshohocken, PA: ASTM International.
Baecher, G. B., Lanney, N. A., and Einstein, H. H. (1977). “Statistical Description of Rock Properties and Sampling,” in Proceedings of the 18th US Symposium on Rock Mechanics (New York: American Rock Mechanics Association).
Bathurst, R. J. (1987). “A Study of Stress and Anisotropy in Idealized Granular Assemblies,”. Dissertation thesis (Kingston, Canada:Queen’s University).
Bieniawski, Z. T., and Hawkes, I. (1978). Determining Rock Mass Deformability: Experience from Case Histories. Int. J. Rock Mech. Mining Sci. Geomechanics Abstr. 15, 237–247. doi:10.1016/0148-9062(78)90956-7
Bolton, M. D., Nakata, Y., and Cheng, Y. P. (2004). Crushing and Plastic Deformation of Soils Simulated Using DEM. Géotechnique 54, 131–141.
Brady, B. H., and Brown, E. T. (1993). Rock Mechanics for Underground Mining. Springer Science & Business Media.
Brown, E. T. (2008). “Estimating the Mechanical Properties of Rock Masses,” in proceedings of the Southern Hemisphere International Rock Mechanics Symposium (Perth: Australian Centre for Geomechanics), 3–22. doi:10.36487/acg_repo/808_16
Cowin, S. C. (2004). Anisotropic Poroelasticity: Fabric Tensor Formulation. Mech. Mater. 36, 665–677. doi:10.1016/j.mechmat.2003.05.001
Cundall, P. A. (1971). “A Computer Model for Simulating Progressive Largescale Movements in Blocky Rock Systems,” in Proceedings of the Symposium of the International Society of Rock Mechanics (France:Society for Rock Mechanics (ISRM)), 2–8.
Cundall, P. A. (1988). Formulation of a Three-Dimensional Distinct Element Model-Part I. A Scheme to Detect and Represent Contacts in a System Composed of many Polyhedral Blocks. Int. J. Rock Mech. Mining Sci. Geomechanics Abstr. 25, 107–116. doi:10.1016/0148-9062(88)92293-0
Curtin, W. A., and Scher, H. (1990). Mechanics Modeling Using a Spring Network. J. Mater. Res. 5, 554–562. doi:10.1557/jmr.1990.0554
Donzé, F. L., Bouchez, J., and Magnier, S. A. (1997). Modeling fractures in rock blasting. Int. J. Rock Mech. Min. Sci. 34 (8), 1153–1163. doi:10.1016/s1365-1609(97)80068-8
Gale, J. F. W., Reed, R. M., and Holder, J. (2007). Natural Fractures in the Barnett Shale and Their Importance for Hydraulic Fracture Treatments. Bulletin 91, 603–622. doi:10.1306/11010606061
Harthong, B., Scholtès, L., and Donzé, F.-V. (2012). Strength Characterization of Rock Masses, Using a Coupled DEM-DFN Model. Geophys. J. Int. 191, 467–480. doi:10.1111/j.1365-246x.2012.05642.x
Itasca Consulting Group, Inc (2014). PFC2D (Particle Flow Code in 2 Dimension), Version 5.0. Minneapolis: ICG.
Jiang, C., Zhao, G.-F., and Khalili, N. (2017). On Crack Propagation in Brittle Material Using the Distinct Lattice spring Model. Int. J. Sol. Structures 118-119, 41–57. doi:10.1016/j.ijsolstr.2017.04.024
Jing, L. (2003). A Review of Techniques, Advances and Outstanding Issues in Numerical Modelling for Rock Mechanics and Rock Engineering. Int. J. Rock Mech. Mining Sci. 40, 283–353. doi:10.1016/s1365-1609(03)00013-3
Jing, L., and Hudson, J. A. (2002). Numerical Methods in Rock Mechanics. Int. J. Rock Mech. Mining Sci. 39, 409–427. doi:10.1016/s1365-1609(02)00065-5
Lai, Z., and Chen, Q. (2017). Characterization and Discrete Element Simulation of Grading and Shape-dependent Behavior of JSC-1A Martian Regolith Simulant. Granular Matter 19, 1–14. doi:10.1007/s10035-017-0754-1
Lei, Q., Latham, J.-P., and Tsang, C.-F. (2017). The Use of Discrete Fracture Networks for Modelling Coupled Geomechanical and Hydrological Behaviour of Fractured Rocks. Comput. Geotechnics 85, 151–176. doi:10.1016/j.compgeo.2016.12.024
Lemrich, L., Carmeliet, J., Johnson, P. A., Guyer, R., and Jia, X. P. (2017). Dynamic Induced Softening in Frictional Granular Materials Investigated by Discrete-Element-Method Simulation. Phys. Rev. E 96, 1–8. doi:10.1103/physreve.96.062901
Liu, N., and Fu, L.-Y. (2020a). Stress-orientation Effects on the Effective Elastic Anisotropy of Complex Fractured media Using the Lattice spring Models Coupled with Discrete Fracture Networks Model. Interpretation 8, SP31–SP42. doi:10.1190/int-2019-0286.1
Liu, N., and Fu, L. -Y. (2020b). Elastic Characteristics of Digital Cores from Longmaxi Shale Using Lattice spring Models. Commun. Comput. Phys. 28, 518–538.
Liu, N., Li, M., and Chen, W. (2017). Mechanical Deterioration of Rock Salt at Different Confinement Levels: a Grain-Based Lattice Scheme Assessment. Comput. Geotechnics 84, 210–224. doi:10.1016/j.compgeo.2016.12.007
Liu, N., Li, Y.-Y., Fu, L.-Y., Kong, Y., and Li, W.-S. (2021). Integrated LSM-DFN Modeling of Naturally Fractured Reservoirs: Roughness Effect on Elastic Characteristics. Pure Appl. Geophys. 178, 1761–1779. doi:10.1007/s00024-021-02728-9
Mauldon, M., Dunne, W. M., and Rohrbaugh, M. B. (2001). Circular Scanlines and Circular Windows: New Tools for Characterizing the Geometry of Fracture Traces. J. Struct. Geology. 23, 247–258. doi:10.1016/s0191-8141(00)00094-8
McClure, M. W. (2012). “Modeling and Characterization of Hydraulic Stimulation and Induced Seismicity in Geothermal and Shale Gas Reservoirs,”. Dissertation thesis(Stanford University).
Mühlhaus, H. B., and Vardoulakis, I. (1987). The Thickness of Shear Bands in Granular Materials. Géotechnique 37, 271–283. doi:10.1680/geot.1987.37.3.271
Murphy, H. D., and Fehler, M. C. (1986). “Hydraulic Fracturing of Jointed Formations,” in Proceedings of the SPE international meeting on petroleum engineering (Beijing:Society of Petroleum Engineers Association). doi:10.2118/14088-ms
Nitka, M., and Tejchman, J. (2015). Modelling of Concrete Behaviour in Uniaxial Compression and Tension with DEM. Granular Matter 17, 145–164. doi:10.1007/s10035-015-0546-4
Oda, M. (1977). Co-ordination Number and its Relation to Shear Strength of Granular Material. Soils and Foundations 17, 29–42. doi:10.3208/sandf1972.17.2_29
Oda, M., and Iwashita, K. (2000). Study on Couple Stress and Shear Band Development in Granular media Based on Numerical Simulation Analyses. Int. J. Eng. Sci. 38, 1713–1740. doi:10.1016/s0020-7225(99)00132-9
Olson Reichhardt, C. J., Lopatina, L. M., Jia, X., and Johnson, P. A. (2015). Softening of Stressed Granular Packings with Resonant Sound Waves. Phys. Rev. E 92, 8. doi:10.1103/physreve.92.022203
Patel, S., and Martin, C. D. (2017). Evaluation of Tensile Young's Modulus and Poisson's Ratio of a Bi-modular Rock from the Displacement Measurements in a Brazilian Test. Rock Mech. Rock Eng. 51, 361–373. doi:10.1007/s00603-017-1345-5
Rothenburg, L., and Kruyt, N. P. (2004). Critical State and Evolution of Coordination Number in Simulated Granular Materials. Int. J. Sol. Structures 41, 5763–5774. doi:10.1016/j.ijsolstr.2004.06.001
Scholtès, L., and Donzé, F.-V. (2013). A DEM Model for Soft and Hard Rocks: Role of Grain Interlocking on Strength. J. Mech. Phys. Sol. 61, 352–369. doi:10.1016/j.jmps.2012.10.005
Shiu, W., Donze, F.-V., and Daudeville, L. (2008). Compaction Process in concrete during Missile Impact: a DEM Analysis. Comput. Concrete 5, 329–342. doi:10.12989/cac.2008.5.4.329
Thornton, C. (2000). Numerical Simulations of Deviatoric Shear Deformation of Granular Media. Géotechnique 50, 43–53. doi:10.1680/geot.2000.50.1.43
Van Baars, S. (1996). “Discrete Element Analysis of Granular Materials,”. Dissertation thesis.(Delft, Nederland: Delft University of Technology).
Williams, J. R., and Rege, N. (1997). The Development of Circulation Cell Structures in Granular Materials Undergoing Compression. Powder Tech. 90, 187–194. doi:10.1016/s0032-5910(96)03201-9
Zhang, Z. H. (2015). “The Numerical Simulation of the Three-axis Test of the Rough Soil of PFC3D Is Simulated,”. Master’s thesis (Yichang, China:China Three Gorges University).
Zhao, G. F. (2010). “Development of Micro-macro Continuum-Discontinuum Coupled Numerical Method,”. Dissertation thesis (Lausanne, Swiss Confederation:École Polytechnique Fédérale de Lausanne).
Keywords: numerical simulation, crack information inversion, coordination number, measurement window, DEM-DFN model
Citation: Xu X, Fu L-Y, Liu N and Han T (2021) On the Determination of Coordination Numbers of Coupled DEM-DFN Model for Modeling Fractured Rocks. Front. Earth Sci. 9:665275. doi: 10.3389/feart.2021.665275
Received: 11 February 2021; Accepted: 07 July 2021;
Published: 22 July 2021.
Edited by:
Erik H. Saenger, Bochum University of Applied Sciences, GermanyReviewed by:
Luis Gago-Duport, University of Vigo, SpainChuen-Fa Ni, National Central University, Taiwan
Copyright © 2021 Xu, Fu, Liu and Han. This is an open-access article distributed under the terms of the Creative Commons Attribution License (CC BY). The use, distribution or reproduction in other forums is permitted, provided the original author(s) and the copyright owner(s) are credited and that the original publication in this journal is cited, in accordance with accepted academic practice. No use, distribution or reproduction is permitted which does not comply with these terms.
*Correspondence: Li-Yun Fu, lfu@upc.edu.cn; Ning Liu, nicolaliu@buaa.edu.cn