Warning Decision-Making for Landslide Dam Breaching Flood Using Influence Diagrams
 Yan Zhu1,2,3
  Ming Peng
- 1Key Laboratory of Geotechnical and Underground Engineering of Ministry of Education, Tongji University, Shanghai, China
- 2Department of Geotechnical Engineering, College of Civil Engineering, Tongji University, Shanghai, China
- 3Shanghai Research Center of Ocean and Shipbuilding Engineering, China Shipbuilding NDRI Engineering Co., Ltd., Shanghai, China
- 4College of Civil Engineering, Qingdao University of Technology, Qingdao, China
- 5Department of Civil and Environmental Engineering, The Hong Kong University of Science and Technology, HKSAR, Hong Kong, China
Warning and evacuation are among the most effective ways for saving human lives and properties from landslide dam hazards. A new warning decision model for landslide dam break is developed using Influence Diagrams to minimize the total losses. An Influence Diagram is a simple visual representation of a decision problem. It analyzes the qualitative (causal) relationships between the variables via a logic diagram and determines the quantitative relationships via conditional probability and Bayes’ theorem. The model is applied for the warning decision-making of the 2008 Tangjiashan landslide dam. The new model unifies the dam failure probability, evacuation, life loss, and flood damage in an Influence Diagram. Besides, a warning criterion is proposed for efficient decision-making. The model is more advanced than the decision tree since the inter-relationships of influence factors are qualitatively analyzed with causality connections and quantitatively analyzed with conditional probabilities. It is more efficient than a dynamic decision-making model (DYDEM) as it can directly calculate the three types of flood loss (i.e., evacuation cost, flood damage, and monetized life loss) and the expected total loss. Moreover, the probabilities of the influence factors leading to known results can be obtained through inversion analysis based on Bayesian theory. The new warning decision model offers an efficient way to save lives from landslide dam breaking and avoid unnecessary expenses from premature warning and evacuation.
Introduction
A landslide dam is a naturally formed dam by rapid deposition of a landslide, avalanche, or debris flow, which blocks a river to form a natural lake. Unlike man-made earth and rockfill dam with well-designed drainage culverts and discharge spillway, a landslide dam often breaks soon after its formation, leading to a possibly abrupt and catastrophic breaching flood for downstream areas, just like the huge landslide dam triggered by the 1786 Ms 7.8 Luding-Kangding Earthquake. It breached soon after its formation and killed more than 100,000 people downstream (Zhang et al., 2016). In 1934, the Deixi Ms 7.5 earthquake triggered three landslide dams along the Minjiang River. The breaching flood of these three dams impacted the area as far as 800 km and drowned more than 3,000 people downstream (Liu et al., 2010; Peng and Zhang, 2012a).
Most landslide dams are short-lived. According to the statistical analysis of Shen et al. (2020) with 352 recorded cases, 30 and 48% of the landslide dams last only 1 day and 1 week, respectively. An extreme case is the Xiaolin Village landslide dam which was formed by the 2009 extreme Morakot Typhoon. It breached within 1 h after its formation and killed 384 people in the adjacent downstream Xiaolin Village (Li et al., 2011). To cope with these landslide dams, a timely warning is indispensable.
Nevertheless, the decision of dam break warning and evacuation should be very cautious and timely since it can be costly (Frieser, 2004; Peng and Zhang, 2013a, b; Shi et al., 2017). For instance, the breaking of the Tangjiashan landslide dam, triggered by the 2008 Ms 7.9 Wenchuan earthquake, forced as many as 300,000 people in Mianyang City (85 km downstream) to leave their homes for two weeks. The total evacuation expenses (including GDP interruption and evacuated expense) were estimated to be as much as RMB 1.2 billion. However, Mianyang City was not flooded, as the peak discharge of 7,800 m3/ s was lower than that of the designed flood of 12,000 m3/ s. Thus, a scientific decision on evacuation warning towards landslide dam break is crucial to achieving the minimal risk.
The existing studies on warning decision-making on dam breaking are divided into two categories: deterministic methods and probabilistic methods (Peng and Zhang, 2013a; Grant and Nover, 2019; Correa et al., 2020). Deterministic decision methods take water level and peak inflow rate and some other parameters as the indices for evacuation warning (Nielsen et al., 1994; Frieser, 2004; Zhai et al., 2018; Fan et al., 2019; Mandal et al., 2020). In some guidelines for dam safety, some subjective suggestions are offered for issuing dam break warning (Urbina and Wolshon, 2003; FEMA, 2004). Generally, the methods are quite intuitive and easy to apply. However, they fail to state the number of people to be evacuated and the best time to issue the warning. Furthermore, the uncertainties involved in dam break flood and human response are not evaluated.
In probabilistic decision methods, risk acceptance criteria based on fatality number and annual occurrence frequency were suggested for decision-making (BC Hydro, 1993; USBR, 1997; ANCOLD, 1998). Based on these criteria, the dam breaching risks higher than an acceptance level should be mitigated with structural or non-structural measures, including evacuation warnings. Su et al. (2011) have developed an early warning system of dam health with system engineering (e.g., integration control module, intelligent inference engine, and support base cluster) and artificial intelligent methods. Acosta-Coll et al. (2018) have reviewed the real-time early warning system design for pluvial flash floods and proposed a basic structure for an effective early warning system for pluvial flash floods. Fan et al. (2018) have studied the early warning of a dam break in a mountain river based on risk assessment via fuzzy analytic hierarchy process. Su et al. (2018) have developed an early warning model of deformation safety for roller compacted concrete arch dam by considering time-varying displacement data. Liu et al. (2018) have summarized the main early warning studies on flash flood with a systematic review on the early warning studies in China. Li et al. (2019) have conducted real-time warning and risk assessment of tailing dams based on dynamic hierarchy-grey relation analysis. Wang et al. (2020) have presented a method for early warning of crest cracking for high earth-rockfill dams via Bayesian parameter updating. The above existing studies on warning decision-making answered how likely the dam breaks or flash floods would occur but did not answer how much loss would be incurred. Thus, the optimal decision strategy to minimize the total loss cannot be quantitatively achieved, not to mention that the dynamic decision-making involved time-related losses.
Decision trees are often used for quantitative decision analysis because they are logical and intuitive (Frieser, 2004; Smith et al., 2006; Woo, 2008). Frieser (2004) has presented a decision tree on levee failure evacuation warning by considering three types of consequences: evacuation costs, flood damage, and loss of life. Time-dependent evacuation decisions can be analyzed using a multi-phase decision tree (Frieser, 2004). The alternatives in decision trees are assumed as independent, and the inter-relationships of influence factors are neglected. Peng and Zhang (2013a) and Peng and Zhang (2013b) have presented a decision-making model (DYDEM) based on dynamic risk assessment. The optimum time for evacuating the population at risk (PAR) is obtained by minimizing the expected total loss, which integrates the time-related probabilities and flood consequences. Based on DYDEM, Shi et al. (2017) have employed the pre-acquired terrain information to establish an efficient warning decision-making method. The method was applied to emergent evacuation warnings of the 2014 Hongshiyan landslide dam triggered by the Ms. 6.5 Ludian earthquake. DYDEM calculated the dam failure probability, human risk, economic loss, and evacuation cost with different methods. The expected total losses need to be calculated as the sum of the three types of expected losses (the product of the dam failure probability and the loss). This method is suitable for detailed case studies with sufficient investigated and simulated parameters. However, it may not be sufficient for efficient decision-making for short-lived landslide dam cases.
In this article, a new decision-making model is proposed based on Influence Diagrams. Influence Diagram integrates dam failure probability, the population at risk, fatality rate, and the three types of flood losses within one method. The new method would be much more precise than the decision tree and efficient than DYDEM. Firstly, the method of Influence Diagram is introduced and illustrated with an example. Secondly, a warning decision model is built by modifying the Bayesian network of a human risk assessment model (HURAM). Third, the model is applied to warning decision-making for the 2008 Tangjiashan landslide dam. Finally, the present model is compared with DYDEM and the decision tree method to illustrate the advantages. The new model provides an efficient and reliable method for warning decision-making for short-lived landslide dams. Both the time-related dam failure probability and three types of losses are involved within the new model.
Methodology
Influence Diagram
Background of the Influence Diagram
Influence Diagram, first presented by Howard and Matheson (2005), is a method to solve complex decision problems by considering the inter-relationships of influence factors and their uncertainties. An Influence Diagram is a simple visual representation of a decision problem. It offers an intuitive way to identify and display the essential elements, including decisions, uncertainties, objectives, and how they influence each other. It adopts the form of a logic diagram to analyze the qualitative (causal) relationship between the variables. It uses conditional probability and Bayes’ theorem to analyze the quantitative relationship between the variables.
The influence graph is an extension of the Bayesian network method by employing decision nodes and utility function nodes. The application procedure of the Influence Diagram is divided into three steps: establishing the Influence Diagram structure by causal analysis of variables; obtaining the prior probability values based on multi-source information such as statistic data, theoretic analysis, and numerical simulation; obtaining the posterior probabilities with evidence according to Bayes’ theorem.
Theoretical Introduction
Assume that an Influence Diagram has l decision nodes of D1, D2,…Dl, m chance nodes of C1, C2,…,Cm, and n utility function nodes U1, U2,…,Un. The value of each utility function node given any combination of decision nodes and chance nodes is calculated as follows
where Uk is the kth utility function node, π(Uk) is the parent node set of Uk, D is the decision node set (D1, D2,…Dl), Cq is the set of chance nodes with evidences, and Uk [π(Uk)] is the utility function of π(Uk).
where Cr is the set of chance nodes without evidences (stochastic valuables) and P [π(Uk), D, Cq, Cr] is the joint probability of all parameters (nodes) in an Influence Diagram.
Express all types of nodes as a set X (X1, X2, …, XN), in which N = l + m + n. The joint probability P (X1, X2, …, XN) can be expressed as the products of the conditional probability of each node given its parents (Jensen, 2001):
where
where k and j are the state numbers of the node Xi and its parents, respectively. According to the Bayesian theorem, the posterior probability of the parameter vector is given by the following (Zhang and Guo, 2006):
in which θ is the vector of θijk, P(θ) is the prior probability of θ, and mijk is the number of samples with Xi= k and π(Xi) = j.
An Illustrated Example of Influence Diagram
The Example
Figure 1 shows a simple example of using an Influence Diagram to make warning decisions. Four influence factors are considered, among which Wt is the decision node (with 4 states) and the water depth (Dw) (with 4 states), evacuation (with 2 states), and flood severity (with 4 states) are the chance nodes. The utility function notes are three types of losses: evacuation cost, flood damage, and monetized life loss. The optimal decision is achieved to minimize the total expected loss, which is the sum of the three types of losses. This target is realized with three steps: building the Influence Diagram, quantifying the Influence Diagram with prior probabilities, and calculating the total expected loss with different warning times by Bayesian updating.
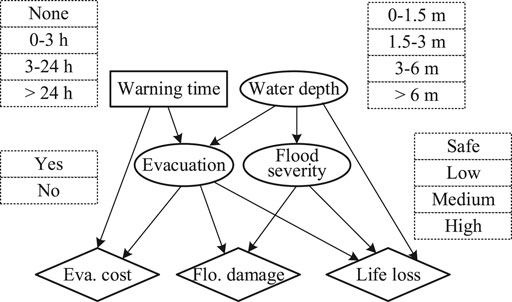
FIGURE 1. An example of Influence Diagram: eva. = evacuation and flo. = flood.
The Structure of Influence Diagram
The Influence Diagram structure is established by considering the causal relationships of the variables (Figure 1). In the Influence Diagram, Wt influences evacuation and evacuation cost. An earlier warning would evacuate more people and incur more evacuation costs. Sufficient evacuation reduces flood damage and life loss but increases the evacuation cost at the same time. A larger water depth incurs less efficiency of evacuation, larger flood severity, and more life loss. Flood severity, determined by the building inundation and damage (Peng and Zhang, 2013a; Peng and Zhang, 2013b), directly influences the flood damage and life loss.
The Prior Probability of the Influence Diagram
The prior (conditional) probabilities of the three chance nodes (Dw, evacuation, and flood severity) are obtained according to Peng and Zhang (2012b) and Peng and Zhang (2012c), as shown in Tables 1–2. The prior probabilities of Dw are obtained based on statistical data (Table 1). The prior condition probabilities of evacuation (Table 1) are regarded as the probabilities when the available time is larger than the demand time, which will be introduced later. The prior condition probabilities of the flood severity (Table 2) are obtained based on a matrix of building inundation and building damage, according to Peng and Zhang (2012b).
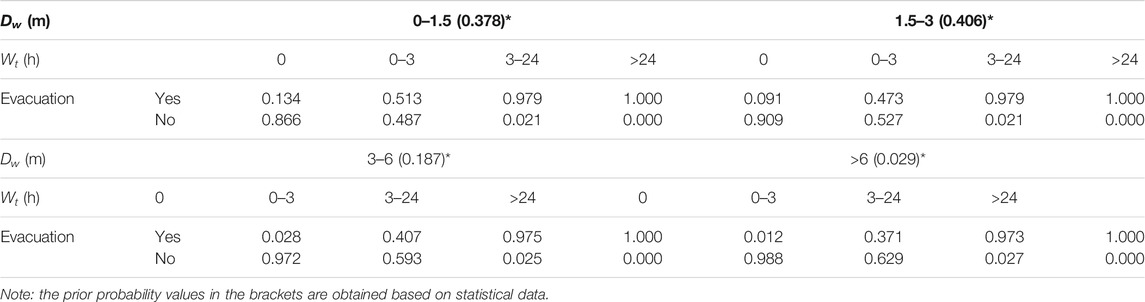
TABLE 1. The prior conditional probability table of evacuation using HURAM (Peng and Zhang, 2012b).
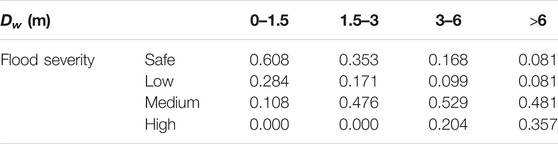
TABLE 2. The prior conditional probability table of flood severity using HURAM (Peng and Zhang, 2012b).
The evacuation cost consists of GDP interruption loss and people resettlement costs. The flood damage is counted by the damage of movable properties in this study since the unmovable properties cannot be saved by warning and evacuation. Human life is monetized for evacuation decision-making. The value of human life is counted as the GDP per person (GDPP) and the average longevity (Lav) (Frieser, 2004; Jonkman, 2007). For example, the GDPP and Lav in Mianyang City, China, are RMB 13,745 and 75 years in 2008 (Mianyang Bureau of Statistics, 2008). Thus, the value of one person is estimated as RMB 1.03 million. Suppose that the population at risk (Par) is 1,000 in this case. The prior utility functions of evacuation cost, flood damage, and life loss are calculated based on Peng and Zhang (2013a), as shown in Tables 3–4, respectively.
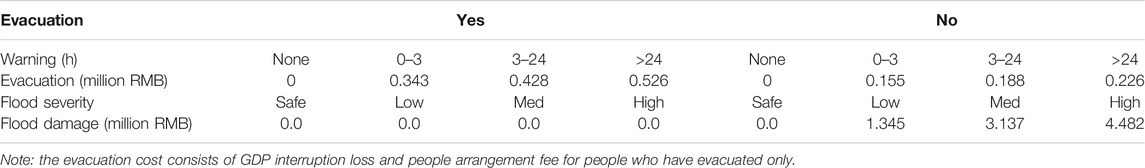
TABLE 3. Prior probability of evacuation cost and flood damage with Par of 1,000 based on Peng and Zhang (2013a).
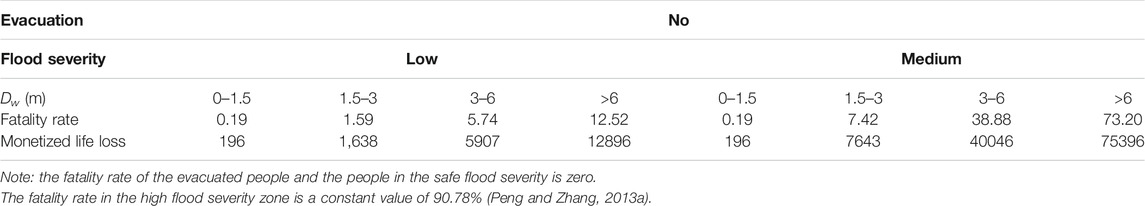
TABLE 4. Prior probability of life loss with Par of 1,000 based on Peng and Zhang (2013a).
The Total Expected Loss as a Function of Warning Time
Finally, the total expected loss (LT) is calculated as follows:
where C denotes the evacuation cost, DM is the movable flood damage, ML is the monetized life loss, and Pf is the probability of landslide dam failure. The three types of flood losses are posterior values calculated by updating the prior values based on Bayes’ theorem. In this case, we can obtain each of the flood losses, according to Eqs. 1–4. Take the flood damage DM as an example. According to Figure 1, DM is calculated as follows:
where Eva is the evacuation, Fs is the flood severity, and DM (Eva, Fs) is the flood damage as a function of Eva and Fs, which can be found in Table 3. The conditional probability P (Eva, Fs|Wt, Dw) is calculated as follows:
According to Equation (3), the joint probability P (Eva, Fs, Wt, Dw) is as follows:
where P(Wt) = 1 for decision node; P (Dw) can be found in Table 1, and P (Eva|Wt, Dw) and P(Fs|Dw) in Table 2.
Figure 2 shows the total expected loss (LT) with different values of Wt, Dw, and Pf. Generally, LT increases with Dw and Pf. The influence of Wt on Lt is more complicated. When Pf and Dw are large, LT decreases with Wt, as LT is dominated by ML and DM. When Pf and Dw are small, LT decreases with Wt. When Pf and Dw are relatively large, LT decreases and then increases with Wt. For instance, minimal LT is achieved as 0.53 million RMB when Wt > 24 h, in the case of Pf = 1 and Dw = 3–6 m; minimal LT can be ignored with no warning when Pf reduces to 0.01 and Dw is 0–1.5 m.
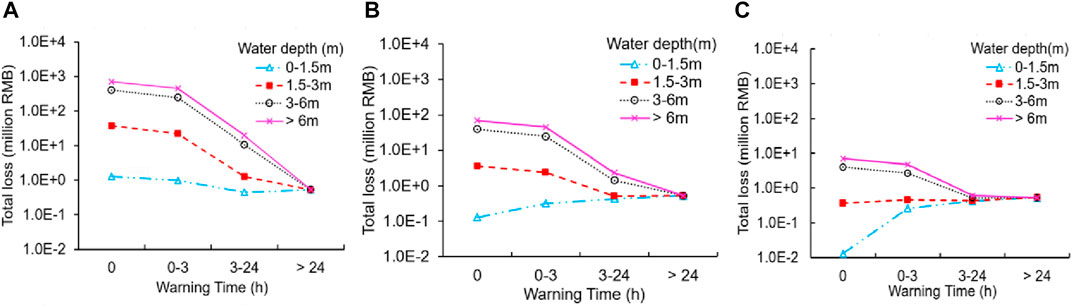
FIGURE 2. Variation of total loss with Wt and Dw: (A) Pf = 1; (B) Pf = 0.1; (C) Pf = 0.01.
The New Decision-Making Model
The target of the decision-making model is to find the optimal time for issuing a warning to minimize the risk (R) or the expected total loss (LT):
where t is the moment for issuing warning. tf is the moment of dam failure. Wt denotes the warning time. Pf(tf) denotes the failure probability of the landslide dam before tf as a time series. C(Wt), DM(Wt), and ML (Wt) are evacuation cost, movable flood damage, and monetized life loss as functions of Wt, respectively. Note that the unmovable damage is not involved since it cannot be mitigated by warning and evacuation. Normally, C(Wt) increases but DM(Wt) and ML (Wt) decrease with Wt.
Decision Criterion
The decision criterion is to find the optimal time for issue warning to minimize LT(t) or LT(tf+ Wt). When Pf(tf) is very small (e.g., at the dam formation moment with shallow water level), LT(t) is dominated by C(Wt) and the minimal LT(t) is achieved at Wt= 0, which means no warning is necessary. With the increase of Pf(tf), LT(t) increases. When LT(t) achieves the minimal value with Wt > 0 for the first time, which means early warning is necessary, we need to warn the people before this moment, tcr. A warning is not needed before tcr and needed after tcr:
Since Pf(t) monotonously increases with t before dam failure, we can first find the critical failure probability Pfcr in the Influence Diagram (to be introduced later) and then obtain tcr as the inverse function of Pf(t).
The Human Risk Analysis Model
In Eq. 10, C(Wt), DM(Wt), and ML (Wt) can be calculated using a new warning decision model via Influence Diagram, which is built by improving the Bayesian network of a human risk assessment model, HURAM (Peng and Zhang, 2012b; Peng and Zhang, 2012c). The logic structure of HURAM is shown in Figure 3. People in the flooded area are called population at risk (Par). A part of Par evacuates from the flooded areas to be safe if the available time is larger than the demand time. The other people, who stay in the flooded area, are defined as exposed people. The exposed people may take shelter inside buildings. If so, their safety depends on the building inundation and damage. There are four flood severity zones: safe, low, medium, and high. The fatality ratio of the four zones is quantified based on statistical data, as shown in Figure 3 (Peng and Zhang, 2012b). HURAM model is able to estimate the human risk (i.e., probability of life loss) by considering fourteen parameters and their interrelationship. The model is validated in several cases (Peng and Zhang, 2012b; Peng and Zhang, 2013b; Shi et al., 2017).
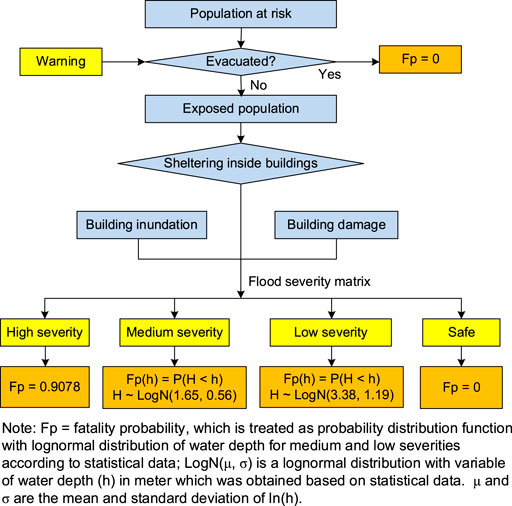
FIGURE 3. The framework of the human risk assessment model for a landslide dam (modified from Peng and Zhang, 2012b; Peng and Zhang, 2013a).
New Decision-Making Model With Improvements on HURAM
A new decision-making model (DEMID) (Figure 4) is developed based on Influence Diagram. It improves the Bayesian network of HURAM mainly in five aspects: changing the states of the “warning time” node; removing the “time of a day” node; changing the functions of the “evacuation” node; adding two chance nodes “dam failure probability” and “population at risk”; adding three utility function nodes “evacuation cost,” “flood damage,” and “monetized life loss.”
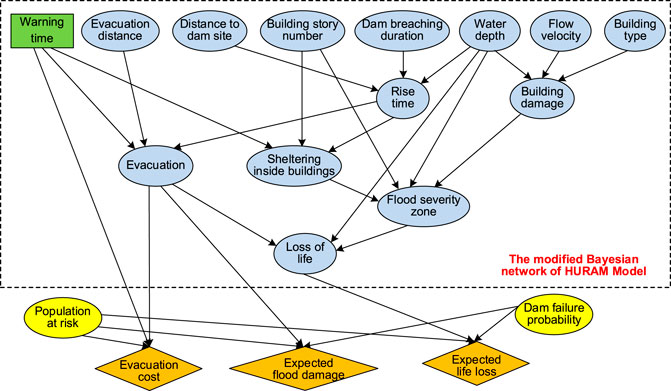
FIGURE 4. The decision-making model based on Influence Diagram.
Changing the States of the “Warning Time” Node
“Warning time,” an originally chance node, is changed to a decision node. Originally in HURAM, “warning time” has five states: 0–0.25 h, 0.25–1 h, 1–3 h, 3–6 h, and >6 h. It is an intermediate node with two parent nodes of “time of a day” and “distance to dam site,” which meant that the available Wt is influenced by “time of a day” and the “distance to dam site” (Peng and Zhang, 2012a). In DEMID, Wt is set as a decision node in the Influence Diagram with seven states: 0–0.25 h, 0.25–1 h, 1–3 h, 3–6 h, 6–12 h, 12–24 h, and >24 h. Two more states with longer warning times are added as more time needs to be offered for people to save their properties.
Removing the “Time of a Day” Node
“Time of a day,” an originally chance node, is removed. In HURAM, the node “time of a day” had three states: 8:00–17:00, 17:00–22:00, and 22:00–8:00. It was a parent node of three intermediate nodes: “warning time,” “evacuation,” and “sheltering inside buildings”. In DEMID, the lead time for decision-making was often on the order of days, making the simulation of warning and evacuation rather complex. Besides, we can choose daytime for issuing a warning. Thus, the chance node of “time of a day” in the Influence Diagram was removed (Peng and Zhang, 2013a).
Changing the Function of “Evacuation” Node
The warning transmitting time distribution and response time distribution are changed. In HURAM, a successful evacuation is defined as the available time (Wt+ Rt) larger than demand time (Tt+ St+ Et) (Peng and Zhang, 2013a):
where Wt is the warning time; Rt is the flood rise time (the time for the flood water level rising to a critical level causing threat to human life, 1.5 m is assumed); Tt is the warning transmitting time (the duration from issuing the warning to the receipt by the people at risk); St is the response time (the time for people to confirm the warning, prepare for evacuation and wait for family members); Et is the evacuation time (the time for the people to mover to safe places).
In HURAM, the warning transmitting distribution was W (3.5, 0.6), W (2.0, 0.5), and W (1.3, 0.7) for times of a day of 08:00–17:00, 17:00–22:00, and 22:00–08:00, respectively. Here W (a, b) denotes a Weibull distribution with coefficients a and b:
In DEMID, we use W (1.3, 0.7) only for safety and to avoid complex calculations (Peng and Zhang, 2013b). W (1.3, 0.7) is suggested for moderately rapid warning by Lindell et al. (2007).
In HURAM, the response time distribution is assumed as W (4, 1) for emergent dam break situation, with a mean value and standard deviation of 0.25 and 0.25 h, respectively. In emergent cases, people have no more time to rescue properties. However, in DEMID, the government should consider offering more time for people to save properties and prepare daily belongings. A distribution of W (0.085, 2.55) is chosen according to the practices of hurricane evacuation (Lindell et al., 2007). In this case, the mean value and a standard deviation of 2.33 and 0.98 h are considered, respectively.
Adding Two Chance Nodes of “Population at Risk” and “Dam Failure Probability”
Two chance nodes, namely, the “population at risk” and “dam failure probability,” are added to the Influence Diagram. In HURAM, the flooded areas are divided into subareas with different populations at risk (Par) and flood parameters. The human risk (RH) is calculated as the sum of the expected life loss (Li) in each subarea:
where Pl|f is the conditional probability of life loss when the dam fails. Three steps are needed: firstly, dividing the flooded area into subareas with different Pars; secondly, obtaining Pl|fvia the Bayesian network in HURAM; finally, calculating RH with Pf according to Eq. 16.
In DEMID, RH is directly calculated as shown in Figure 4 by adding two chance nodes: “population at risk” with five states (1, 1E2, 1E4, 1E6, and 1E8) and “dam failure probability” with seven states (0, 1E-5, 1E-4, 1E-3, 1E-2, 1E-1, and 1). The flood area need not to be divided into subareas as in HURAM. The distribution of Par and the flood parameters (Dw, flow velocity, and rise time) are taken as probabilities in the Influence Diagram. Despite discrete states in the two added nodes, all continuous values can be achieved by the weighted average of the two closest states by solving the following equation:
where Pi and Pj are two probability weights of the two closest states and Si and Sj are the two state values. For instance, Par with 30,000 could be expressed as 0.9798*1E4 + 0.0202*1E6. Besides, the human risk could be assessed via DEMID; also, the expected flood damage and evacuation cost could be evaluated at the same time by employing three utility function nodes as follows.
Adding Three Utility Function Nodes
Three utility function nodes, namely, “evacuation cost,” “expected flood damage,” and “expected life loss,” are added in the new model. The evacuation cost is the sum of the initial costs (Ci) and GDP interruption (CGDP) (Peng and Zhang 2013a):
Ci is the evacuation expenses, such as temporary resettlement fee (e.g., accommodation, food, and compensation) and public maintenance fee (e.g., security and medical care), and can be calculated as follows:
where c is the expense per person per day (e.g., RMB 60 or US$ 9.5 per person per day for the evacuation caused by the 2008 Tangjiashan landslide dam); Peva is the number of evacuated people, which is estimated using the HURAM; Wt is the warning time in days. The 3-day period is taken as the minimum period of time between the predicted moment of flooding and the return of the residents (Frieser, 2004). The GDP interruption (CGDP) is calculated as follows:
where GDPP is the GDP per capita and the interrupted time.
The moveable flood damage DM is assumed to be proportional to the number of the people who neither evacuated nor sheltered in safe zones (in the building story beyond the inundation height) (Peng and Zhang, 2013a):
where Psafe is the ratio of the people taking shelter in the safe zones; α is the proportion of properties that can be transferred (0.1 is assumed); Ip is the property of each person, which is calculated approximately as the cumulative net income (i.e., income minus spending) per person (Peng and Zhang, 2013a):
where I and S are the average income and spending per person; n is the average working period per person (e.g., 20 years). For instance, in 2008, Mianyang City, Sichuan Province, China, Ip = 4,482 * 20 = RMB 8,9640.
Despite ethical considerations, a person's life is measured for rational decision-making. The monetized life loss (ML) is calculated as the product of the probability of life loss and the value of human life (VL), while VL is calculated as the product of GDPp and the average longevity (L) (Jonkman, 2007). For instance, GDPp and L in Mianyang City in 2008 are RMB 13,745 and 75 years (Mianyang Bureau of Statistics, 2009). Thus, VL was RMB 1.03 million.
Warning Decision-Making for the 2008 Tangjiashan Landslide Dam
Background of the Tangjiashan Landslide Dam
The Tangjiashan landslide lies on the right bank of the Tongkou River in Sichuan Province, China, 4.5 km upstream of Beichuan County (104° 25′56.93″ E, 31°50′40.60″ N) (Xu et al., 2013). The Tongkou River is a tributary of the Fujiang River with a length of 173 km and a basin area of 4,520 km2. The strata of the Tangjiashan landslide area comprises the upper Qingping Formation of the lower Cambrian dipping outward (N60°E/NW∠60°), a residual-diluvial layer of Quaternary sediments, and an alluvial layer of Quaternary sediments with a depth of 5–20 m in thickness (Xu et al., 2013). The landslide was triggered by the 2008 Ms 7.9 Wenchuan earthquake. The top elevation of the Tangjiashan landslide was 1,580 m, with a slope height of about 900 m. The lower terrain was steep (40°–60°) with the bedrock exposed, whereas the upper terrain gently slopes at an angle of about 30°, with diluvial gravel soil (about 5–15 m in thickness) covering the surface. Details of the landslide refer to (Hu et al., 2009; Xu et al., 2013).
The Tangjiashan landslide slid into the Tongkou River and formed a landslide dam with a height of 82 m, width of 802 m, length of 611 m, dam volume of 20.4 million m3, and lake capacity of 316 million m3 (Hu et al., 2009; Cui et al., 2009), as shown in Table 5. The landslide dam was located at 4.5 km upstream of Beichuan Town with 30,000 residents and around 85 km upstream of Mianyang City with 1,127,000 residents (Figure 5A). The dam mainly consists of three layers (Figures 5B,C): the upper layer of gravely soils with a thickness of 5–15 m, the middle layer of strongly weathered cataclasite with a thickness of 10–15 m, and the bottom layer of weakly weathered cataclasite with a thickness of 50–80 m (Peng and Zhang, 2012c; Peng and Zhang, 2013b). The cross-sections of A-A and B-B in Figure 5 refer to Figure 6.
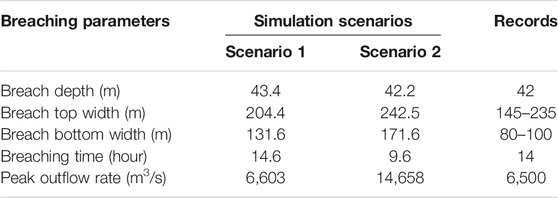
TABLE 5. Breaching parameters of the two simulation scenarios using DABA and the records.
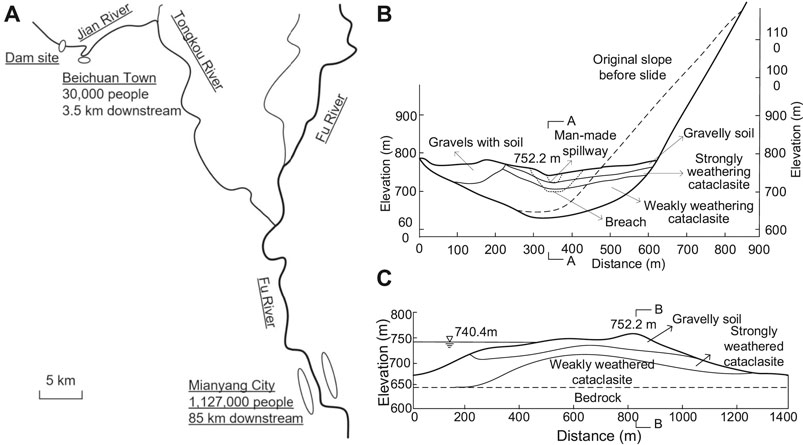
FIGURE 5. The location and cross-section of the Tangjiashan landslide dam: (A) the location of the dam and the Beichuan Town; (B) the cross-section across the river; and (C) the cross-section along the river (Modified from Peng and Zhang, 2012b and Shi et al., 2015). Note that the cross-sections of A-A and B-B refer to Figure 6.
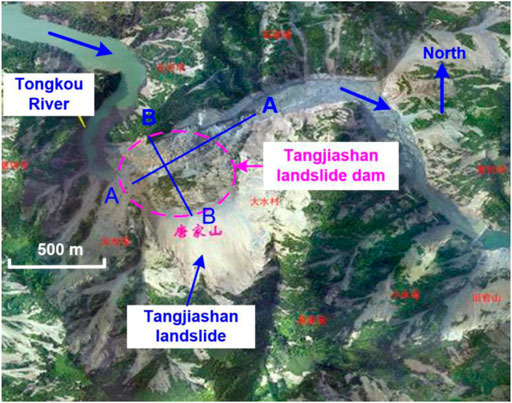
FIGURE 6. The aerial photograph of the Tangjiashan landslide dam (Modified from Shi et al., 2015).
The risk of dam breaching was high, so the local government decided to excavate a division channel. The division channel was completed by June 1, 2008, with a length of 475 m, a width of 25 m and a depth of 12 m (Peng and Zhang, 2012c; Peng and Zhang, 2013b). It lowered the crest elevation from 752.2 to 740.4 m and reduced the lake capacity from 316 million m3 to 247 million m3 (Peng and Zhang 2013b).
The dam breached on June, 10, 2008 and lasted for 14 h. Its peak outflow rate reached 6,500 m3/ s. The final breach size had a depth of 42 m, a top width of 145–235 m, and a bottom width of 80–100 m (Peng and Zhang, 2012b; Peng and Zhang, 2012c). All the people (30,000) in Beichuan County and 300,000 people in Mianyang City were evacuated by June, 1, 2008, 10 days before the dam breaching. The evacuation costs were estimated as much as RMB 1.2 billion.
Simulation of Dam Breaching and Flood Routing
In order to find out the effect of the channel, two scenarios are simulated, with the division channel (real case of Scenario 1) and without it (a virtual case of Scenario 2). The dam heights of the two scenarios are 70 and 82 m, and the corresponding lake volumes are 224 and 316 million m3.
A breaching model for landslide dams, DABA (Chang and Zhang, 2010; Peng et al., 2014; Shi et al., 2015), was applied to simulate the dam breaching process and achieve the breaching outflow rate. DABA simulates the soil erosion during dam breaching based on shallow water flow theory. The outflow rate is calculated using the broad-crested weir equations. DABA also takes into consideration the variation of soil properties along with landslide dam depth. The model was proved to be an effective tool for breaching simulation of landslide dams (Chang and Zhang, 2010; Peng et al., 2014; Shi et al., 2015).
HEC-RAS 4.1, a hydraulic simulation software (HEC, 2008), is used to simulate the flood routing after obtaining the breaching outflow rate via DABA. Two residential areas downstream are considered in this study: Beichuan County with 30 thousand residents located 4.5 km downstream and Mianyang City with more than 1.1 million residents located 85 km downstream. The main parameters include the dam breaching parameters (the final breach size, breaching time, and breaching progression curve obtained from DABA model), the geometric parameters of the channel, Manning’s n values, and contraction and expansion coefficients. Manning’s n values are 0.040 and 0.050 for the channel and the floodplain upstream of Mianyang City, respectively, and 0.035 and 0.045 for the channel and the floodplain in the Mianyang City, respectively, according to Chow (1959).
Figure 7 shows the simulated outflow rates of the two scenarios and the recorded values. With the division channel, the outflow rate curve of the simulated case with the division channel is close to the real case. The peak outflow rate is 6,603 m3/s and the breach depth is 43.4 m, which are quite close to the records of 6,500 m3/ s and 42 m, respectively (as shown in Table 5). Without the division channel, the dam would breach 9 days later due to the larger lake capacity for water filling. The peak outflow rate reaches 14,658 m3/ s, which is much larger than that in Scenario 1. Besides, the final breach size would be slightly shallower but much wider.
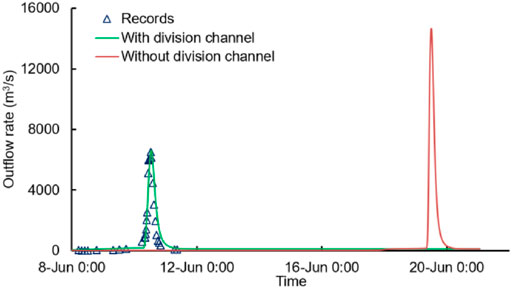
FIGURE 7. The breaching outflow rates of the real case and two simulated cases.
The hydraulic parameters in Beichuan County and Mianyang City were obtained via HEC-RAS software. In Scenario 1, the flood with the peak flow rate of 6,538 m3/ s inundated Beichuan County with a maximum water depth of 6.13 m (Figure 8A) and flow velocity of 1.11 m/ s. In Mianyang City, however, the peak flow rate (7,820 m3/ s) was lower than the design flood (12,000 m3/ s) of the levee system. In Scenario 2, the peak flow rates increased to 14,440 and 14,584 m3/ s in Beichuan County and Mianyang City, respectively. The maximum Dw in Beichuan was as large as 19.68 m (Figure 8A), and the flow velocity was 1.56 m/ s. In Mianyang City, the flood would inundate the city with a maximum depth of 0.51 m (Figure 8B) and flow velocity of 0.25 m/ s.
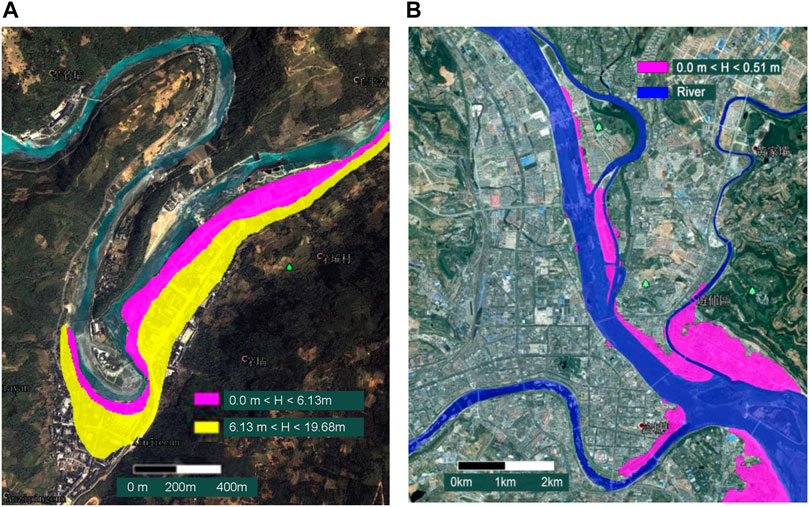
FIGURE 8. The inundation maps of Beichuan Town and Mianyang City: (A) Scenarios 1 (the maximal water level = 6.13 m) and 2 (the maximal water level = 19.68 m) in Beichuan; (B) Scenario 2 (the maximal water level = 0.51 m) in Mianyang (Mianyang is not flooded in Scenario 1).
Probability Analysis of Tangjiashan Landslide Dam Failure
As 92% of past landslide dam failures were due to overtopping (Peng and Zhang, 2012c), only overtopping failure is considered in this study. A dam is defined as an overtopping failure at time t when the reservoir volume (Vt) is larger than its capacity (Vcr). Pf as a time series is expressed as follows (Peng and Zhang, 2013a):
According to the conservation of mass, V(t) is given by
where Δt is the time interval; Q(t) is the inflow rate at time t; Qe(t) is the evaporation rate, which could be ignored for a short time during the emergency management; Qo(t) is the outflow rate at time t, which was less than 1 m3/ s and ignored in this study (Peng and Zhang, 2013b). Thus, Q(t) is the only key item to calculate Pf(t), according to Eqs. 19, 20.
Based on the 33 recorded data provided by Zhang (2009), a time series model of AR (2) is suitable to estimate Q(t):
where a(t) is the error with the mean value of 0. The variation of a(t) is calculated as follows:
With the estimated Q(t) according to Eqs. 21, 22, Pf of the Tangjiashan landslide dam in Scenarios 1 and 2 were obtained as shown in Figure 9. For For more details on the time series analysis method for calculating Pf , refer to Peng and Zhang, 2013a; Peng and Zhang, 2013b.
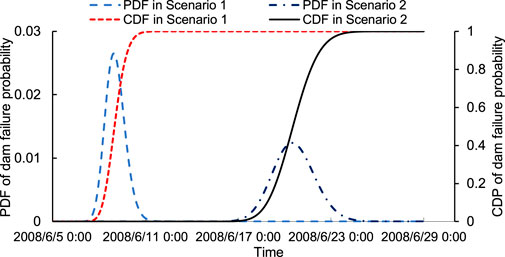
FIGURE 9. PDF and CDF of Pf in the two Scenarios.
In Scenario 1, Pf increased from 0 to 1E-5 at 21:00 on June 6, 2008, to 1E-3 at 9:00 on June 6, 2008, to 1E-1 at 6:00 on June 8, 2008, and to 0.964 at 6:00 on June 10, 2008. Note that the dam started to breach at 6:00 on June 10, 2008.
In Scenario 2, the corresponding times for Pf arriving 1E-5, 1E-3, 1E-1, and 0.964 were at 10:00 on June15, at 17:00 on June 16, at 15:00 on June 17, and at 2:00 on June 23, 2008.
Warning Decision-Making for Beichuan County
In Scenario 1, the dam breaching flood with the peak discharge of 6,538 m3/ s inundated 33.0% of the area of Beichuan County, with the population at risk being 9,905. The Dw and flow velocity were 6.13 and 1.11 m/ s, respectively. The expected total loss (LT) and the three types of flood losses can be obtained by updating the Influence Diagram with the inputs of the basic nodes (without the parent node). Figure 10 shows an example with the “warning time” of 3–6 h and “dam failure probability” of 1.0. According to the investigation, the six states are deterministic: “flow velocity” (1–2 m/ s), “distance to dam site” (0–4.8 km), “building story number” (3 stories), “dam breaching during” (>9 h), “building type” (masonry, concrete and brick), and “population at risk” (9,905). The states of “water depth” and “evacuation distance” are obtained based on the proportion of the flooded areas (Peng and Zhang, 2013b). In this case, the evacuation rate and the fatality rate are 95.25 and 0.07%, respectively. Since Par was 9,905, the evacuated population number was 9,435, the exposed population number was 470, and the expected fatality number was 6.9. The evacuation cost, expected flood damage, and expected monetized life loss were 4.82, 2.10, and 7.35 million RMB, respectively, making the expected total loss of 14.3 million RMB, as shown in Figure 10.
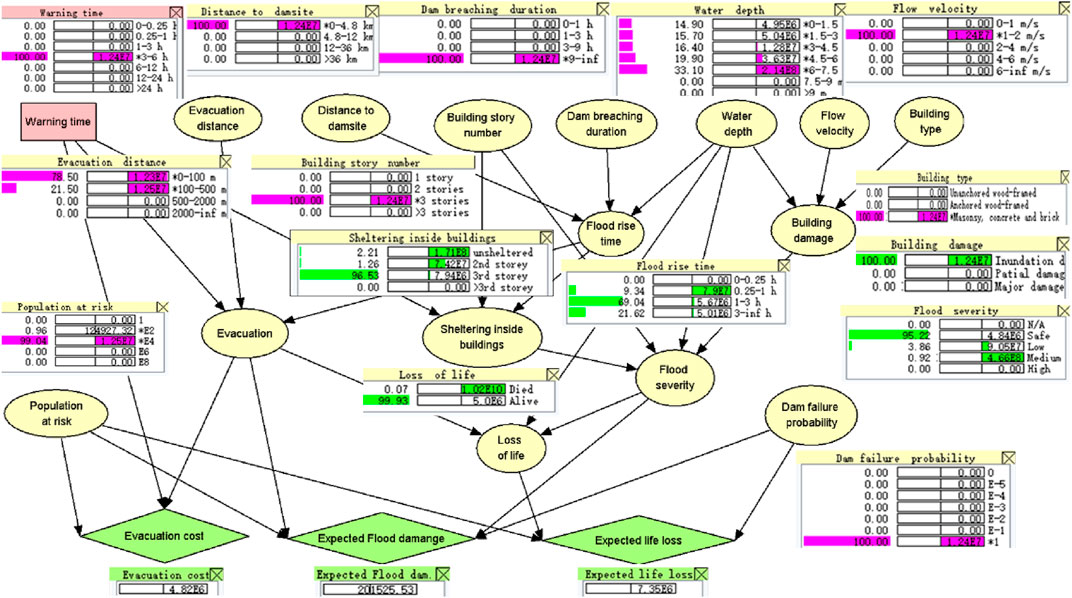
FIGURE 10. Decision-making based on Influence Diagram with Hugin lite 7.2 (Hugin Expert A/S, 2009).
Table 6 shows the flood losses with Pf = 1.0 in Scenario 1 in Beichuan County with different Wt. When Wt was 0–0.25 h, the evacuation rate was low (35.68%), leading to a relatively high fatality rate (3.71%). The expected monetized life loss of 379 million RMB dominated the total loss, followed by the expected flood damage. With the increase of Wt, both the monetized life loss and the flood damage decreased rapidly and the evacuation cost increased. The expected total loss decreased first and then increased. The minimal expected total loss of 719 million RMB was achieved when the Wt is 6–12 h. After that, the evacuation cost increased steadily and dominated the total loss. The increase in the evacuation cost was due to the larger Wt and more evacuated people.
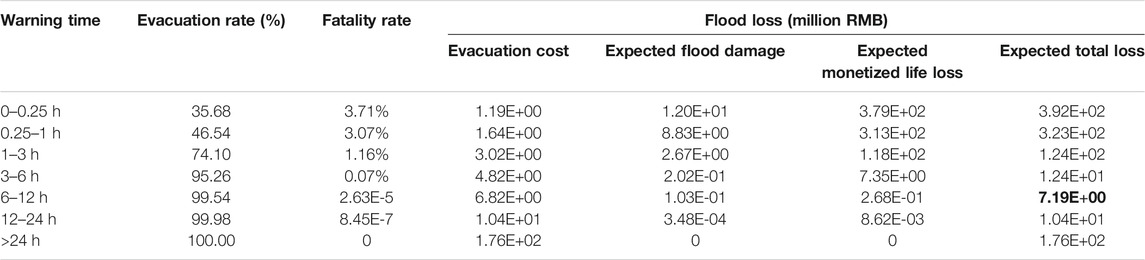
TABLE 6. Flood losses in Scenario 1 in Beichuan County with different Wt.
Figure 11 shows the three types of losses and the total loss in Scenario 1 in Beichuan County with different Wt and Pf. The evacuation cost did not change with Pf. The expected flood damage and monetized life loss linearly decreased with Pf. It is found that the optimal decision strategy with minimal LT changed with Pf. When Pf = 1, the optimal Wt was 6–12 h with LT of RMB 7.19 million. With the decrease of Wt, less Wt is needed for optimal decision with less LT. When Pf = 0.001, no warning is needed since LT monotonically increases with Wt.
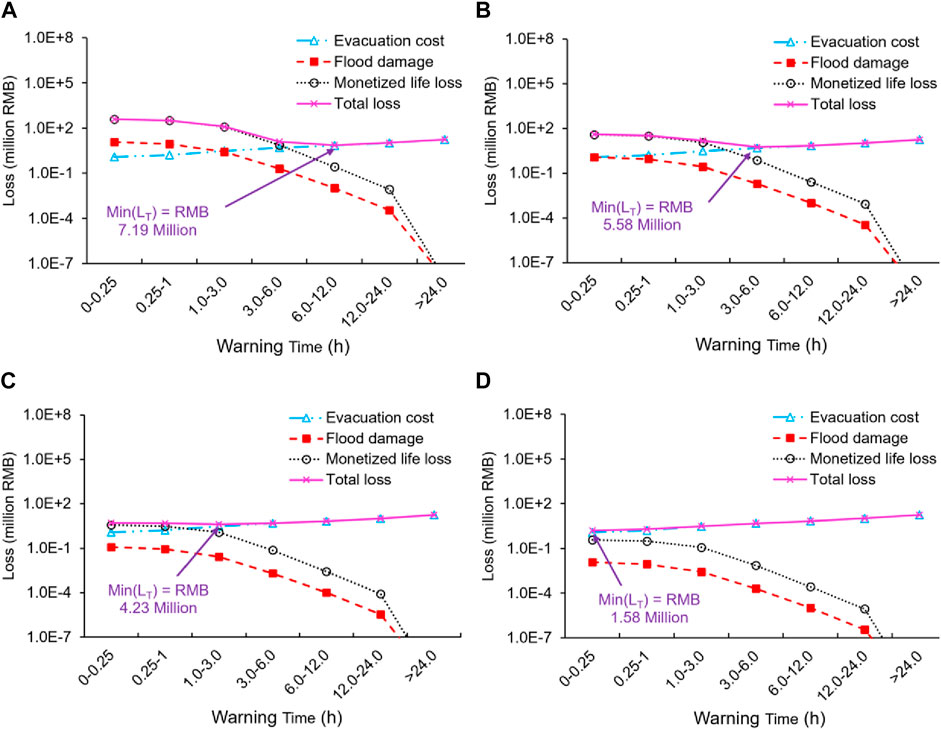
FIGURE 11. Three types of losses and the total loss in Scenario 1 in Beichuan County with different dam failure probabilities: (A) Pf = 1; (B) Pf = 0.1; (C) Pf = 0.01; (D) Pf = 0.001.
When considering Pf as a time series, as shown in Figure 9, the optimal decision is to issue the evacuation warning at 15:00, June 7, 2008, according to Eq. 11. It is close to the optimal time of 00:00, June 7, 2008. The minimal LT was 3.79 million RMB and Pfcr = 0.64%.
In Scenario 2, with the peak discharge of 14,440 m3/ s, the breaching flood inundated 55.6% of the area of Beichuan County with the population at risk being 16,682. Dw and the flow velocity were 19.68 and 1.56 m/ s, respectively. Figure 12 shows the three types of losses and the total loss in Scenario 2 in Beichuan County with different Wt and Pf. Similar to Scenario 1, the optimal decision strategy changed with Pf in the trend, which meant less Wt is needed for smaller Pf. However, more Wt and larger LT are needed in Scenario 2 due to larger floods. When Pf = 1, the optimal Wt was 12–24 h with LT of RMB 17.90 million. When Pf = 0.001, no warning is needed since LT monotonically increases with Wt.
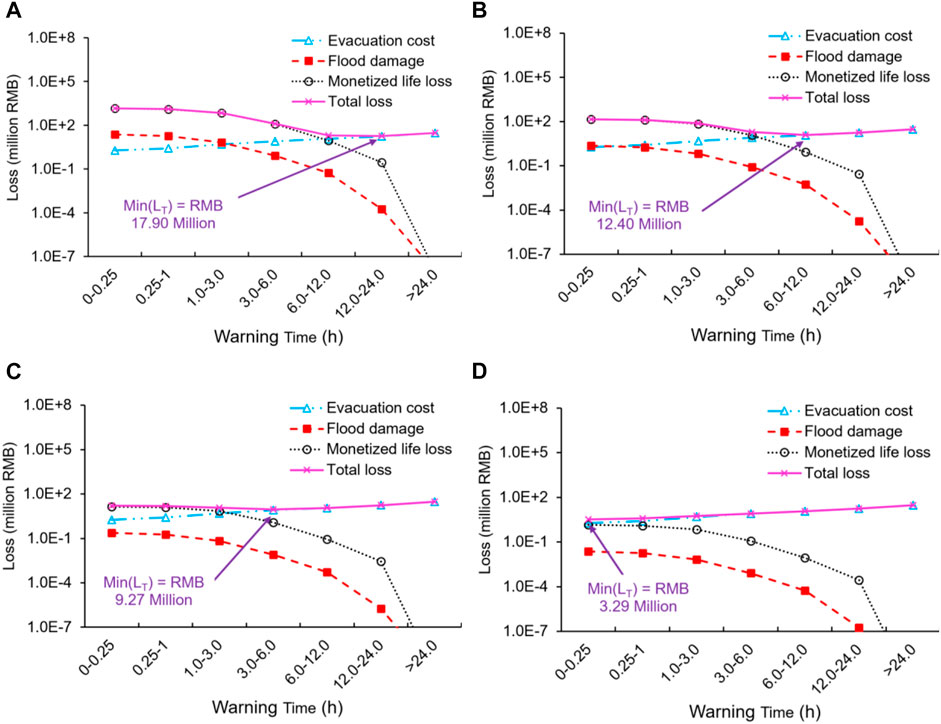
FIGURE 12. The three types of losses and the total loss in Scenario 2 in Beichuan County with different Wt: (A) Pf = 1; (B) Pf = 0.1; (C) Pf = 0.01; (D) Pf = 0.001.
When considering Pf as a time series, as shown in Figure 9, the optimal decision was to issue the evacuation warning at 6:00, June 17, 2008, according to Eq. 12. It is close to the optimal time of 08:00, June 16, 2008. The minimal LT was 8.95 million RMB and Pfcr = 0.49%.
Warning Decision-Making for Mianyang City
In Mianyang City, the breaching flood in Scenario 1 did not inundate the city since the peak discharge (7,820 m3/ s) was lower than the design value of the levee system (12,000 m3/ s). The breaching flood in Scenario 2, with the peak discharge of 14,584 m3/ s, inundated the city with the maximal Dw of 0.51 m and made 23,521 people at risk.
Figure 13 shows the flood loss with different Wt and Pf in Scenario two in Mianyang City. When Pf = 1, early warning was necessary despite relatively low flood severity. If Wt is the least, namely 0–0.25 h, LT would be RMB 13.8 million, which consisted of evacuation cost (C), expected flood damage (DM) and monetized life loss (ML) of RMB 5.69, 5.62, and 2.45 million, respectively. With the increase of Wt, DM and ML decraese dramatically, but C increases rapidly, making LT decreases first and then increases at Wt = 1–3 h. The minimal LT at that time is RMB 9.82 million. When Pf became smaller, no warning is needed. The minimal LT is achieved with Wt = 0–0.25 h as RMB 6.50, 5.77 and 5.70 million in the cases of Pf = 0.1, 0.01 and 0.001, respectively.
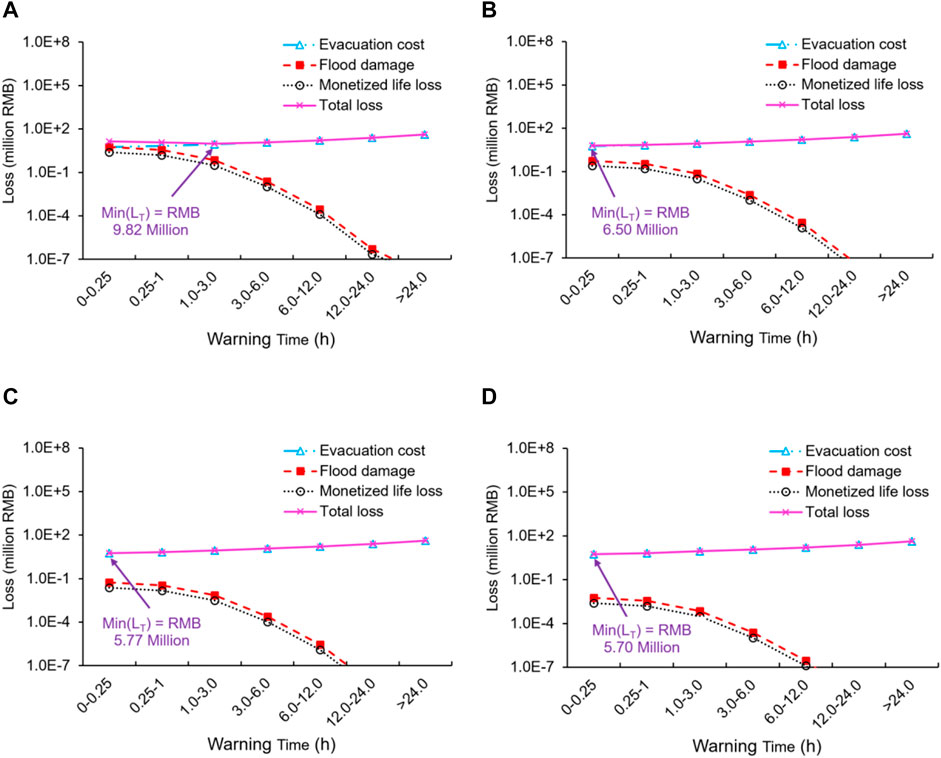
FIGURE 13. The three types of losses and the total loss in Scenario 2 in Mianyang City with different Wt: (A) Pf = 1; (B) Pf = 0.1; (C) Pf = 0.01; (D) Pf = 0.001.
When considering the Pf as a time series as shown in Figure 9, the optimal decision is to issue the evacuation warning at 22:00, June 19, 2008 according to Eq. 12. It is close to optimal time of 10:00, June 19, 2008. The minimal LT was 8.17 million RMB and Pfcr = 0.307.
Discussion
The Influences of Warning Time, Water Depth, and Dam Failure Probability
The Influence Diagram model (Figures 4, 10) shows that Wt, Dw, and Pf are three key parameters affecting all three types of flood consequences. Sensitivity analysis of Wt, Dw, and Pf on the expected total loss is made in Scenario 1 in Beichuan County.
When Pf = 1, as shown in Figure 14A, the expected total loss increased significantly with Dw when Wt was insufficient (e.g., 0–3 h). The reason is that high Dw incurs higher flood severity, building inundation, and damage, which then result in more life loss and flood damage. When Wt becomes longer (e.g., >12 h), the expected total loss, which was dominated by the evacuation costs, would not be obviously influenced by Dw, since most people manage to evacuate from the flooded area.
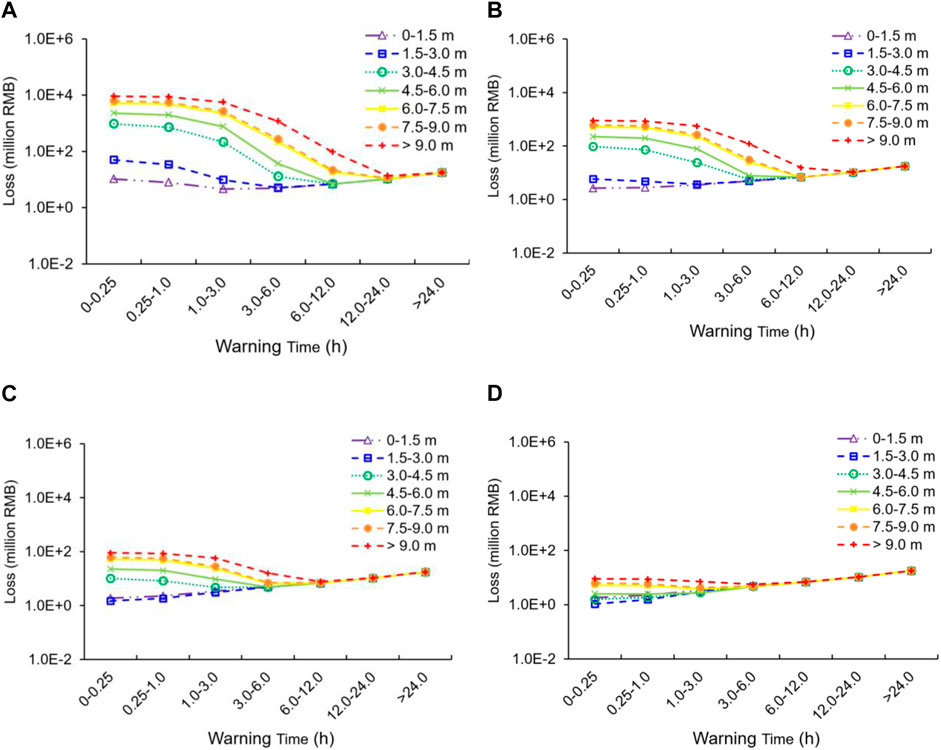
FIGURE 14. The expected total loss in Scenario 1 in Beichuan County with different Dw and Wt: (A) Pf = 1; (B) Pf = 0.1; (C) Pf = 0.01; (D) Pf = 0.001.
When Pf decreased, the expected total loss decreased significantly when Wt was insufficient, espectially with higher Dw. The optimal decision strategy changed with Pf. Less Wt was needed with smaller Pf. When Pf = 0.001, the expected total loss curve was close to the evacuation cost curve. The reason was that two types of flood losses (expected flood damage and life loss) were proportional to Pf , while evacuation cost did not change with Pf.
In summary, the influences of the three factors (Dw, Wt, and Pf) on the flood losses were different. The increase of Dw resulted in a high increase in the expected flood damage and life loss and a slight decrease in evacuation cost (due to a lower evacuation rate). The increase of Pf resulted in a proportional increase of expected flood damage and life loss but did not change evacuation costs. The increase of Wt resulted in a steady increase in evacuation cost but incurred an unsteady decrease of expected flood damage and life loss. The latter decreased rapidly when Wt was not sufficient. In contrast, they change a little when Wt was sufficient.
Comparison DEMID With Decision Tree
Frieser (2004) has published decision-making methods for dam/levee failure flood via multi-phase decision tree, as shown in Figure 15. At the initiation decision time ti, we might issue an evacuation warning or not. If we choose not, we might delay the decision to tτ. Since there are several phases that we can choose to make the warning decision, it is called a multi-phase decision tree, as shown in Figure 15. It involves Pf and three types of flood losses. A warning decision was made by comparing all the alternatives to achieve the minimum expected total loss.
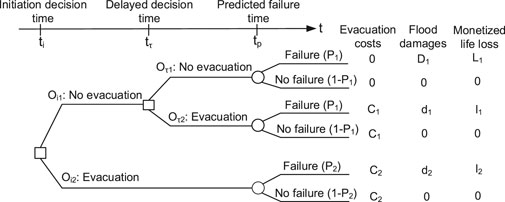
FIGURE 15. Multi-phase decision trees for warning decision-making of dam/levee failure. Note D1 > d1 > d2, L1> l1 > l2, C2 > C1 for different Wt and the uncertainty of P1 is smaller than that of P2 since more information can be gained.
Compared to the multi-phase decision tree method, DEMID has several features:
1) The inter-relationships of influence factors are qualitatively analyzed using Influence Diagram. The inter-relationships of influence factors are qualitatively analyzed by building an Influence Diagram with causality connections and quantitatively analyzed with conditional probabilities. Moreover, all alternatives in decision trees are assumed as independent and the inter-relationships of influence factors are neglected.
2) Multi-source information is absorbed to improve DEMID. Prior (conditional) probabilities are gained by employing multi-source information, such as physical test data, empirical equations, theoretical analysis, and statistical data. The information of the studied case can be applied to calculate the posterior probabilities. Moreover, the model can be further updated through Bayesian network parameter learning in the future.
3) The probabilities of the influence factors, including the basic nodes and intermediate nodes, can be obtained through inversion analysis based on Bayesian theory. Suppose that a failed landslide causes a large number of fatalities and some parameters (e.g., Wt and the building information) are gained, we can find the distribution of Dw and evacuation based on Bayesian updating by simply inputting the fatality rate and other known parameters.
4) From the perspective of the building process, DEMID is built according to the logical relationship between the influence factors (nodes), which cannot be reflected in the decision tree. The latter simply divides the alternatives as binary variables, namely, warning or non-warning. In the application prospect, the decision tree needs to assume a fixed failure time, while it is not necessary for DEMID.
Comparing DEMID With a Dynamic Decision-Making Model, DYDEM
Peng and Zhang (2013a) and Peng and Zhang (2013b) have provided a dynamic decision-making model (DYDEM) for dam failure warnings. The warning decision strategy was to find the time of evacuation warning to minimize expected total loss:
where tw is the time issuing warning and LT (tw) is the expected total loss as a function of tw, which can be expressed as follows:
where tf is the continuous time of failure since a dam could fail at any time with a certain probability; f(tf) is a continuous stochastic process of Pf; f(tf)dtf is Pf in a short period dt. In Eq. 24, Wt is expressed as follows:
In DEDYM, the expected LT is calculated with Pf as a time series and the three types of flood losses as a function of Wt. This model is suitable for detailed case studies with sufficient investigated and simulated parameters. It is time-consuming since Pf and three types of flood losses are calculated via different methods. Moreover, the Bayesian network in HURAM with several discrete states cannot be directly applied for calculating the three types of flood losses. A program is coded in VBA in Microsoft Excel for this purpose.
Compared to DYDEM, DEMID has several distinct features:
1) It unifies all the component methods in DYDEM via Influence Diagram. In DYDEM, Pf is calculated via a time series method, the evacuation rate and fatality rate are calculated via HURAM; the evacuation cost, flood damage, and monetized life loss are calculated via different methods. DYDEM is suitable for detailed case studies with sufficient investigated and simulated parameters. However, it may not be sufficient for some short-lived landslide dam cases. In DEMID, all the components are unified using only one method, Influence Diagram. The three types of flood loss and the expected total loss can be directly gained.
2) DEMID is more efficient. Besides the unified form discussed above, the integration calculation as shown in Eq. 24 in DYDEM is not needed in DEMID and the decision criteria are much simpler. We only need to check the critical failure probability Pfcr, as shown in Eq. 12, to find the optimal time for issuing a warning. An important premise for the correctness of the criterion is that Pf should monotonically increase with time. This is not difficult to achieve in landslide dam cases since no discharge control measures are available for a naturally formed dam.
3) DEMID can conduct inversion analysis based on Bayesian theory, as discussed in the last section. Since Influence Diagram is an updated Bayesian network, DEMID retains the original advantages of the Bayesian network in HURAM. We can find out the causes (e.g., water depth and breaching time) of one or some results (e.g., high fatality rate and evacuation rate). This cannot be realized in DYDEM.
4) From the perspective of the building process, the structures of DEMID and all the nodes are fixed. The model can be applied to any landslide dam case by simply updating the values of the basic nodes (the nodes without parents). In DYDEM, we need to calculate all the risk components (dam failure probability and the three types of losses) in all sub-areas by different methods. Then sum all the losses in all sub-areas to gain the expected total loss.
Conclusions
A new warning decision-making model (DEMID) is presented based on Influence Diagram in this article. It is used for the emergent warning decision-making in the case of the 2008 Tangjiashan landslide dam. The following conclusions can be drawn:
1) The present decision model is of great efficiency as it unifies the dam failure probability, evacuation, and three types of flood losses in one Influence Diagram. The expected total loss can be directly gained. Besides, a warning criterion is suggested for efficient decision-making by considering the monotonical increase of landslide dam failure probability: issuing the warning at the time with critical probability when no warning is no more the best choice (with minimal expected total loss).
2) In DEMID, the inter-relationships of influence factors are qualitatively analyzed with causality connections and quantitatively analyzed with conditional probabilities. Continuous values of the population at risk and failure probability can be considered by weighted averages of the closest discrete states. The probabilities of the influence factors, including the basic nodes and intermediate nodes, can be obtained through inversion analysis based on Bayesian theory.
3) The increase of water depth results in a high increase in the expected flood damage and life loss and a slight decrease in evacuation cost (due to a lower evacuation rate). The increase of Pf results in a proportional increase in expected flood damage and life loss but no changes to evacuation cost. The increase of Wt results in a steady increase in evacuation cost and an unsteady decrease in expected flood damage and life loss. The latter decreases rapidly when Wt is not sufficient but changes slightly when Wt is sufficient.
4) For the high-risk areas with relatively fewer people (e.g., the Beichuan County), the expected total loss is dominated by monetized life loss. It is better to issue an evacuation warning a little earlier since it would not incur large evacuation expenses but save many human lives. For the low-risk areas with relatively more people (e.g., the Mianyang City), the evacuation cost should be cautiously issued since the longer the warning lasts, the larger the expenses are.
Data Availability Statement
The original contributions presented in the study are included in the article/supplementary material; further inquiries can be directed to the corresponding authors.
Author Contributions
YZ wrote the original draft and performed the calculation and analysis. MP contributed to the conceptualization, supervision, methodology, and funding acquisition. PZ was responsible for the writing of the original draft and funding acquisition. LZ contributed to the conceptualization and obtaining the resources and reviewed and edited the manuscript.
Funding
The authors acknowledge the support from the Shanghai Rising-Star Program (20QB1406000), the National Natural Science Foundation of China (41877234, 41731283, 42071010, 4201101075), the Natural Science Foundation of Shandong province (Grant No. ZR2019QEE008), and the Fundamental Research Funds for the Central Universities.
Conflict of Interest
Author YZ was employed by the company China Shipbuilding NDRI Engineering Co., Ltd.
The remaining authors declare that the research was conducted in the absence of any commercial or financial relationships that could be construed as a potential conflict of interest.
Publisher’s Note
All claims expressed in this article are solely those of the authors and do not necessarily represent those of their affiliated organizations, or those of the publisher, the editors and the reviewers. Any product that may be evaluated in this article, or claim that may be made by its manufacturer, is not guaranteed or endorsed by the publisher.
References
Acosta-Coll, M., Ballester-Merelo, F., Martinez-Peiró, M., and De la Hoz-Franco, E. (2018). Real-time Early Warning System Design for Pluvial Flash Floods-A Review. Sensors 18 (7), 2255. doi:10.3390/s18072255
ANCOLD (1998). Guidelines on Risk Assessment. Working Group on Risk Assessment. Sydney, New South Wales, Australia: Australian National Committee on Large Dams.
Chang, D. S., and Zhang, L. M. (2010). Simulation of the Erosion Process of Landslide Dams Due to Overtopping Considering Variations in Soil Erodibility along Depth. Nat. Hazards Earth Syst. Sci. 10 (4), 933–946. doi:10.5194/nhess-10-933-2010
Correa, O., García, F., Bernal, G., Cardona, O. D., and Rodriguez, C. (2020). Early Warning System for Rainfall-Triggered Landslides Based on Real-Time Probabilistic hazard Assessment. Nat. Hazards 100 (1), 345–361. doi:10.1007/s11069-019-03815-w
Cui, P., Zhu, Y.-y., Han, Y.-s., Chen, X.-q., and Zhuang, J.-q. (2009). The 12 May Wenchuan Earthquake-Induced Landslide Lakes: Distribution and Preliminary Risk Evaluation. Landslides 6 (3), 209–223. doi:10.1007/s10346-009-0160-9
Fan, Q., Tian, Z., and Wang, W. (2018). Study on Risk Assessment and Early Warning of Flood-Affected Areas when a Dam Break Occurs in a Mountain River. Water 10 (10), 1369. doi:10.3390/w10101369
Fan, X., Xu, Q., Alonso-Rodriguez, A., Subramanian, S. S., Li, W., Zheng, G., et al. (2019). Successive Landsliding and Damming of the Jinsha River in Eastern Tibet, China: Prime Investigation, Early Warning, and Emergency Response. Landslides 16, 1003–1020. doi:10.1007/s10346-019-01159-x
FEMA (2004). Federal Guidelines for Dam Safety – Hazard Potential Classification System for Dams. Washington, USA: Federal Emergency Management Agency. Federal Emergency Management Agency.
Frieser, B. (2004). Probabilistic Evacuation Decision Model for River Floods in the Netherlands. Delft, Netherlands: Delft University of Technology, 138p. Final report.
Grant, S., and Nover, J. (2019). Diagnosis of Historical Inundation Events in the Marshall Islands to Assist Early Warning Systems. Nat. Hazards 99 (1), 189–216. doi:10.1007/s11069-019-03735-9
HEC (2008). HEC-RAS, River Analysis System, Hydraulic Reference Manual, Version 4.0, Developed by Hydrologic Engineering. Washington DC, USA: Center of US Army Corps of Engineers. Hydrologic Engineering Center.
Howard, R. A., and Matheson, J. E. (2005). Influence Diagrams. Decis. Anal., 2(3): 127–143. doi:10.1287/deca.1050.0020
Hu, X. W., Huang, R. Q., Shi, Y. B., Lu, X. P., Zhu, H. Y., and Wang, X. R. (2009). Analysis of Blocking River Mechanism of the Tangjiashan Landslide and Dam-Breaking Mode of its Barrier Dam. Chin. J. Rock Mech. Eng. 28 (1), 181–189. in Chinese. doi:10.1002/9780470611807.ch2
Hugin Expert A/S. (2009). Hugin Lite. Available at: http://www.hugin.com/Products_Services/Products/Demo/Lite/ (Accessed Jan 20, 2009).
Hydro, B. C. (1993). Guidelines For Consequence-Based Dam Safety Evaluations And Improvements. Canada: Hydroelectric Engineering Division Report No. H2528, BC Hydro, Burnaby, BC.
Jensen, F. V. (2001). Bayesian Networks and Decision Graphs. New York: Springer. doi:10.1007/978-1-4757-3502-4
Jonkman, S. N. (2007). Loss of Life Estimation in Flood Risk Assessment: Theory and Applications. Delft, Netherlands: Ph. D. Thesis, Delft University of Technology. doi:10.1142/9789812709554_0118
Li, M.-H., Sung, R.-T., Dong, J.-J., Lee, C.-T., and Chen, C.-C. (2011). The Formation and Breaching of a Short-Lived Landslide Dam at Hsiaolin Village, Taiwan - Part II: Simulation of Debris Flow with Landslide Dam Breach. Eng. Geology. 123 (1–2), 60–71. doi:10.1016/j.enggeo.2011.05.002
Li, W., Ye, Y. C., Hu, N. Y., Wang, X. H., and Wang, Q. H. (2019). Real-Time Warning and Risk Assessment of Tailings Dam Disaster Status Based on Dynamic Hierarchy-Grey Relation Analysis. Complexity 2019, 1–14. 5873420. doi:10.1155/2019/5873420
Lindell, M. K., Prater, C. S., and Peacock, W. G. (2007). Organizational Communication and Decision Making for hurricane Emergencies. Nat. Hazards Rev. 8 (3), 50–60. doi:10.1061/(asce)1527-6988(2007)8:3(50)
Liu, C. J., Guo, L., Ye, L., Zhang, S. F., Zhao, Y. Z., and Song, T. Y. (2018). A Review of Advances in China’s Flash Flood Early-Warning System. Nat. Hazards 92 (2), 619–634. doi:10.1007/s11069-018-3173-7
Liu, N., Chen, Z., Zhang, J., Lin, W., Chen, W., and Xu, W. (2010). Draining the Tangjiashan Barrier lake. J. Hydraul. Eng. 136 (11), 914–923. doi:10.1061/(asce)hy.1943-7900.0000241
Mandal, A. K., Ramakrishnan, R., Pandey, S., Rao, A. D., and Kumar, P. (2020). An Early Warning System for Inundation Forecast Due to a Tropical Cyclone along the East Coast of India. Nat. Hazards 103, 2277–2293. doi:10.1007/s11069-020-04082-w
Mianyang Bureau of Statistics (2008). Report on the National Economy and Society Development on Miangyang City in 2008. Mianyang Bureau of Statistics, Sichuan Province, China. Available at: http://my.gov.cn/bmwz/942947769050464256/ 20090325/391646.html (Accessed December 20, 2008). (in Chinese).
Nielsen, N. M., Hartford, D. N. D., and MacDonald, J. J. (1994). Selection of Tolerable Risk Criteria for Dam Safety Decision Making. Proc. 1994 Can. Dam Saf. Conf. 26 (5), 355–369.
Peng, M., and Zhang, L. M. (2012c). Analysis of Human Risks Due to Dam Break Floods - Part 1: A New Model Based on Bayesian Networks. Nat. Hazards 64 (1), 903–933. doi:10.1007/s11069-012-0275-5
Peng, M., and Zhang, L. M. (2012b). Analysis of Human Risks Due to Dam Break Floods-Part 2: Application to Tangjiashan Landslide Dam Failure. Nat. Hazards 64 (2), 1899–1923. doi:10.1007/s11069-012-0336-9
Peng, M., and Zhang, L. M. (2012a). Breaching Parameters of Landslide Dams. Landslides 9 (1), 13–31. doi:10.1007/s10346-011-0271-y
Peng, M., Zhang, L. M., Chang, D. S., and Shi, Z. M. (2014). Engineering Risk Mitigation Measures for the Landslide Dams Induced by the 2008 Wenchuan Earthquake. Eng. Geology. 180, 68–84. doi:10.1016/j.enggeo.2014.03.016
Peng, M., and Zhang, L. M. (2013a). Dynamic Decision Making for Dam-Break Emergency Management - Part 1: Theoretical Framework. Nat. Hazards Earth Syst. Sci. 13 (2), 425–437. doi:10.5194/nhess-13-425-2013
Peng, M., and Zhang, L. M. (2013b). Dynamic Decision Making for Dam-Break Emergency Management - Part 2: Application to Tangjiashan Landslide Dam Failure. Nat. Hazards Earth Syst. Sci. 13 (2), 439–454. doi:10.5194/nhess-13-439-2013
Shen, D. Y., Shi, Z. M., Peng, M., Zhang, L. M., and Jiang, M. Z. (2020). Longevity Analysis of Landslide Dams. Landslides 17 (8), 797–1821. doi:10.1007/s10346-020-01386-7
Shi, Z. M., Guan, S. G., Peng, M., Zhang, L. M., Zhu, Y., and Cai, Q. P. (2015). Cascading Breaching of the Tangjiashan Landslide Dam and Two Smaller Downstream Landslide Dams. Eng. Geology. 193, 445–458. doi:10.1016/j.enggeo.2015.05.021
Shi, Z. M., Xiong, X., Peng, M., Zhang, L. M., Xiong, Y. F., Chen, H. X., et al. (2017). Risk Assessment and Mitigation for the Hongshiyan Landslide Dam Triggered by the 2014 Ludian Earthquake in Yunnan, China. Landslides 14 (1), 1–17. doi:10.1007/s10346-016-0699-1
Smith, P. J., Kojiri, T., and Sekii, K. (2006). Risk-based Flood Evacuation Decision Using a Distributed Rainfall-Runoff Model. Kyoto, Japan: Annuals of Disas. No. 49 B.
Su, H., Wen, Z., and Wu, Z. (2011). Study on an Intelligent Inference Engine in Early-Warning System of Dam Health. Water Resour. Manage. 25, 1545–1563. doi:10.1007/s11269-010-9760-3
Su, H., Wen, Z., Yan, X., Liu, H., and Yang, M. (2018). Early-warning Model of Deformation Safety for Roller Compacted concrete Arch Dam Considering Time-Varying Characteristics. Compos. Structures 203, 373–381. doi:10.1016/j.compstruct.2018.07.023
Urbina, E., and Wolshon, B. (2003). National Review of hurricane Evacuation Plans and Policies: a Comparison and Contrast of State Practices. Transportation Res. A: Pol. Pract. 37 (3), 257–275. doi:10.1016/s0965-8564(02)00015-0
USBR (1997). Guidelines for Achieving Public Protection in Dam Safety Decision Making. Denver, CO, USA: Dam Safety Office, US Bureau of Reclamation. US Bureau of Reclamation.
Wang, Y., Li, J., Wu, Z., Chen, J., Yin, C., and Bian, K. (2020). Dynamic Risk Evaluation and Early Warning of Crest Cracking for High Earth-Rockfill Dams through Bayesian Parameter Updating. Appl. Sci. 10, 7627. doi:10.3390/app10217627
Woo, G. (2008). Probabilistic Criteria for Volcano Evacuation Decisions. Nat. Hazards 45 (1), 87–97. doi:10.1007/s11069-007-9171-9
Xu, W.-J., Xu, Q., and Wang, Y.-J. (2013). The Mechanism of High-Speed Motion and Damming of the Tangjiashan Landslide. Eng. Geology. 157, 8–20. doi:10.1016/j.enggeo.2013.01.020
Zhai, X., Guo, L., Liu, R., and Zhang, Y. (2018). Rainfall Threshold Determination for Flash Flood Warning in Mountainous Catchments with Consideration of Antecedent Soil Moisture and Rainfall Pattern. Nat. Hazards 94, 605–625. doi:10.1007/s11069-018-3404-y
Zhang, J. X. (2009). Hydrologic Analysis and Emergency Application of Barrier lake Breaking. Beijing, China: Ph.D. thesis Tsinghua University. in Chinese. doi:10.1190/1.3603612
Keywords: decision-making, Influence Diagrams, landslide dam, risk assessment, evacuation warning
Citation: Zhu Y, Peng M, Zhang P and Zhang L (2021) Warning Decision-Making for Landslide Dam Breaching Flood Using Influence Diagrams. Front. Earth Sci. 9:679862. doi: 10.3389/feart.2021.679862
Received: 12 March 2021; Accepted: 07 July 2021;
Published: 06 August 2021.
Edited by:
Jie Dou, China University of Geosciences, ChinaReviewed by:
Faming Huang, Nanchang University, ChinaChong Xu, National Institute of Natural Hazards, China
Copyright © 2021 Zhu, Peng, Zhang and Zhang. This is an open-access article distributed under the terms of the Creative Commons Attribution License (CC BY). The use, distribution or reproduction in other forums is permitted, provided the original author(s) and the copyright owner(s) are credited and that the original publication in this journal is cited, in accordance with accepted academic practice. No use, distribution or reproduction is permitted which does not comply with these terms.
*Correspondence: Ming Peng, pengming@tongji.edu.cn; Peng Zhang, zhangpchn@qut.edu.cn