Articles

Article Tools
 View Full Text View Full Text |
 Abstract Abstract |
 Article as PDF Article as PDF |
 Print this Article Print this Article |
 Pubmed Pubmed |
 PMC PMC |
 PubReader PubReader |
 Export to Citation Export to Citation |
 Email Alerts Email Alerts |
 Open Access Open Access |
Share this article on :


Stats or Metrics
Article
Short Communication
Exp Neurobiol 2021; 30(3): 213-221
Published online June 16, 2021
https://doi.org/10.5607/en21015
© The Korean Society for Brain and Neural Sciences
Differential Proximity of Perisynaptic Astrocytic Best1 at the Excitatory and Inhibitory Tripartite Synapses in APP/PS1 and MAOB-KO Mice Revealed by Lattice Structured Illumination Microscopy
Heeyoung An1,2, Wuhyun Koh2, SeungHee Kang2, Min-Ho Nam3,4* and C. Justin Lee1,2*
1KU-KIST Graduate School of Converging Science and Technology, Korea University, Seoul 02841,
2Center for Cognition and Sociality, Institute for Basic Science (IBS), Daejeon 34126,
3Brain Science Institute, Korea Institute of Science and Technology (KIST), Seoul 02792,
4Department of KHU-KIST Convergence Science and Technology, Kyung Hee University, Seoul 02453, Korea
Correspondence to: *To whom correspondence should be addressed.
C. Justin Lee, TEL: 82-42-878-9150, FAX: 82-42-878-9151
e-mail: cjl@ibs.re.kr
Min-Ho Nam, TEL: 82-2-958-6421, FAX: 82-2-958-7034
e-mail: dr.namminho@kist.re.kr
This is an Open Access article distributed under the terms of the Creative Commons Attribution Non-Commercial License (http://creativecommons.org/licenses/by-nc/4.0) which permits unrestricted non-commercial use, distribution, and reproduction in any medium, provided the original work is properly cited.
Abstract
Bestrophin-1 (Best1) is a GABA- and glutamate-permeable, Ca2+-activated Cl- channel, which is mainly expressed in astrocytes and localized at the microdomain or perisynaptic junction of the tripartite synapse. Distribution of Best1 is dramatically changed in pathological conditions such as Alzheimer’s disease. However, it is still unknown whether Best1 is located at the glutamatergic or GABAergic tripartite synapses. Here, we utilized the Lattice structured illumination microscopy (Lattice SIM) to visualize Best1 expression at the perisynaptic junctions of the tripartite synapses in CA1 of mouse hippocampus. We performed co-labeling with antibodies against 1) Best1 and vesicular glutamate transporter-2 (vGLUT2) or 2) Best1 and vesicular GABA transporter (vGAT) to measure the proximity of Best1-containing perisynapse to glutamatergic or GABAergic presynapse, respectively. In addition, we examined two transgenic mouse lines of 1) APP/PS1 mouse showing high astrocytic MAOB activity and cytosolic GABA and 2) MAOB-KO mouse showing low astrocytic GABA. Lattice SIM images were further processed by Imaris, which allowed 3D-rendering and spot identification. We found that astrocytic Best1 was distributed closer to the glutamatergic synapses than GABAergic synapses in the wild-type mice. In APP/PS1 mice, Best1 distribution was significantly changed by moving away from the glutamatergic synapses while moving closer to the GABAergic synapses. On the contrary, in MAOB-KO mice, the Best1 distribution was dramatically changed by moving closer to the glutamatergic synapses and moving far away from the GABAergic synapses. Our findings propose that the proximity of Best1-containing perisynapses to presynapses dynamically changes according to the level of astrocytic cytosolic GABA.
Graphical Abstract
Keywords: Best1, MAOB, Channel distribution, Proximity, vGAT, vGLUT2
INTRODUCTION
Bestrophin-1 (Best1) is a Ca2+ activated Cl- channel abundantly expressed in the astrocytes of various brain regions including the hippocampus [1-3]. Astrocytes contact multiple synapses through an ultrastructure called microdomain or perisynapse to form tripartite synapses with presynaptic axon terminals and postsynaptic dendritic spines throughout the whole brain [4, 5]. The astrocytes actively regulate the homeostasis of the synaptic transmission by either releasing various gliotransmitters such as glutamate, GABA, D-serine, and ATP or removing excessive extracellular transmitters [6]. A series of our previous reports have demonstrated that these gliotransmitters including GABA, glutamate, and D-serine are released through Best1, which is localized at the perisynaptic junctions of the tripartite synapses in the hippocampus [2, 3, 7-11]. However, it is still unknown whether Best1 is located mostly at the glutamatergic or GABAergic tripartite synapses.
Under physiological condition, astrocytes in the hippocampus are known to release glutamate and D-serine which contribute to the glutamatergic synaptic transmission and plasticity at the Schaffer collateral-CA1 synapse [9, 11-14]. Unlike the normal astrocytes under the physiological condition, the reactive astrocytes under the pathological conditions with chemical or physical insults aberrantly synthesize and release GABA, leading to a tonic inhibition of the synaptic transmission in the hippocampus [8, 15]. Particularly in APP/PS1 transgenic mice which is a mouse model of Alzheimer's disease (AD), there is a plethora of reactive astrocytes in the hippocampus and they aberrantly and excessively synthesize GABA though the enzymatic action of monoamine oxidase B (MAOB) and release the GABA to tonically inhibit the neighboring neurons, leading to memory deficits [8, 15]. Under physiological conditions, Best1 is known to be mainly localized at the astrocytic microdomain which forms a tripartite synapse with a presynaptic axon terminal and a postsynaptic dendritic spine [8]. In contrast, we previously demonstrated that the distribution of Best1 can be rearranged upon certain pathological conditions such as AD [8]. Particularly, in the hippocampus of APP/PS1 transgenic mice, Best1 is redistributed to the soma and processes of the reactive astrocytes, raising a strong possibility that the redistribution of Best1 is associated with the role of astrocytic GABA released through Best1 [8]. In this regard, we hypothesized that the redistribution of Best1 could be attributed to the level of astrocytic GABA content.
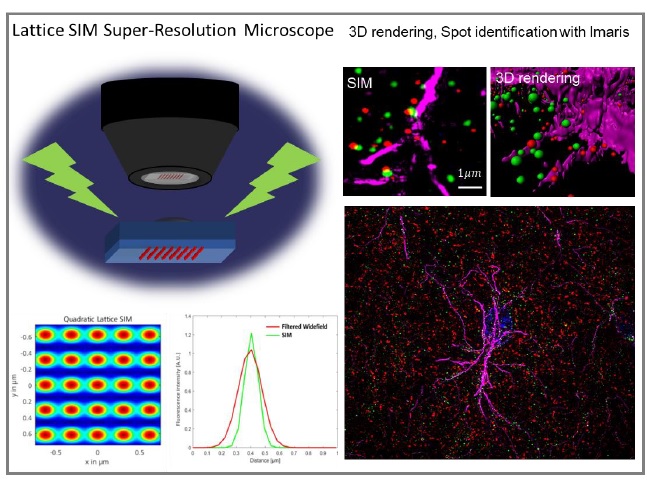
To test this hypothesis, we utilized two different transgenic mouse lines: APP/PS1 and MAOB knockout (MAOB-KO). The hippocampal astrocytes in APP/PS1 transgenic mice contain abundant amount of cytosolic GABA due to the high expression level and enzymatic activity of MAOB which is the main astrocytic GABA-synthetic enzyme [8, 15-17]. On the other hand, the hippocampal astrocytes of the MAOB-KO mice can barely synthesize GABA due to the deficiency of MAOB [17, 18]. To investigate the Best1 distribution at the ultrastructural resolution in these mice, we adopted a cutting-edge microscopic technique, Lattice Structured Illumination Microscopy (SIM) which yields a super optical resolution of ~120 nm [19]. Lattice SIM is superior to the classical SIM in regard of reducing phototoxicity with faster speed than classic SIM, because classical SIM needs to process SIM image at least 15 frames which have illuminated linear structure rotating in 3 directions [20]. Lattice SIM has spot pattern shifted laterally, which allows higher frame rates and less signal to noise background ratio [20, 21]. More importantly, Lattice SIM allows equally high z-axis resolution of near 150 nm, which was not possible with the classical SIM [22-24]. This unique feature allows super-resolution imaging of conventional histological samples at 30~40 μm thickness. By utilizing the Lattice SIM, we assessed the distance between astrocytic Best1 and excitatory or inhibitory synapses which are marked by presynaptic vesicular glutamate transporter-2 (vGLUT2) or vesicular GABA transporter (vGAT), respectively. Current study explores the differential proximity of astrocytic Best1 at the inhibitory or excitatory tripartite synapses in the hippocampal CA1 region in the APP/PS1 and MAOB-KO mice. Our findings further suggest that the different distributions of astrocytic Best1 could be dependent on the astrocytic GABA level and the different Best1 distribution could differentially contribute to differential regulation of the synaptic transmission and plasticity under physiological and pathological conditions.
MATERIALS AND METHODS
Animals
All mice were kept in a temperature- and humidity-controlled environment with a 12-h light-dark cycle (lights on at 7 a.m.) and had free access to food and water. All animal care and handling were performed according to the directives of the Animal Care and Use Committee of the Institutional Animal Care and Use Committee of IBS (South Korea; Approval No. IBS-2020-053). 10-month-old male APPswe/PSEN1dE9 (APP/PS1) mice of B6C3 hybrid background (Jackson Laboratory #34829), 2-month-old male B6;129S-Maobtm1Shih/J (MAOB knockout, MAOB-KO) of 129S background (Jackson Laboratory #014133), and 2-month-old Best1tm1Lmar (Best1 Knockout, Best1-KO) of BALB/c background (MGI #3795281) [25] and their WT littermate mice were used. To determine genotypes, following primers were utilized.
APP/PS1: 42431, 5’-GTG TGA TCC ATT CCA TCA GC-3’; 42432, 5’-GGA TCT CTG AGG GGT CCA GT-3’; 42433, 5’-ATG GTA GAG TAA GCG AGA ACA CG-3’.
MAO-B KO: 11550, 5’-GGG GAA GAC AAG CAG GTG TA-3’; 11551, 5’-CCA CCA TTT CAT GAT TGC AG-3’; oIMR8394, 5’-AGG GGA TCG GCA ATA AAA AG-3’.
Best1-KO: mb0601r, 5’-TGA ATG GTG ACC TCC AAG GCT ATC C-3’; mb9374f, 5’-AAC AAA GGG TAA GCA GGA GTG CCC-3’; and neo2351f, 5’-GGA AGA CAA TAG CAG GCA TGC TGG G-3’.
Immunohistochemistry
For the slice preparation, mice were deeply anesthetized with 2% avertin (20 µg g-1, intraperitoneal injection) and perfused with saline followed by ice-cold 4% paraformaldehyde (PFA; Cat.158127, Sigma, Germany). Post-fixation overnight with 4% PFA was followed by the incubation with 30% sucrose solution for cryoprotection. The fixed brains were embedded with optimal cutting temperature (OCT) compound (FSC 22 Frozen Section Media, Leica, IL, USA) and sectioned into 20-μm-thickness coronal slices with cryostat microtome (CM1950, Leica, IL, USA). For the immunostaining, brain sections were incubated for 1 h in a blocking solution (0.3% Triton X-100, 4% normal donkey serum in 0.1 M PBS) and then immunostained with a mixture of primary antibodies (Chicken anti-GFAP, Millipore, AB5541, 1:500; Mouse anti-vGAT, Cell Signaling, 1:200; Guineapig anti-vGLUT2, Cell Signaling, 1:200; Rabbit anti-Best1, AbFrontier, 1:500) in a blocking solution at 4℃ for overnight. Then, slices were washed with PBS three times, and were incubated with corresponding fluorescent secondary antibodies (Jackson ImmunoResearch Laboratory, PA, USA) for 2 h at RT. DAPI (1:3,000, Pierce) staining was performed in the second of three PBS washing. Finally, sections were mounted with a fluorescent mounting medium (S3023, Dako, Denmark). A series of fluorescent images were obtained with Zeiss Lattice SIM Elyra 7 (Fig. 1A), and Z stack images were processed for further analysis using IMARIS 9.0 program (Bitplane, AG, USA) (Fig. 1B). The antibody against Best1 was validated by the absence of the immunoreactivity in Best1-KO mouse hippocampal sections (Fig. 1C), as previously reported in numerous reports [3, 7, 8, 10, 26].
3D rendering and distance measurement
The distance from astrocytic Best1 at the perisynaptic junction to presynapse was expected to be around several hundred nm [7]. To evaluate the proximity of the molecules more precisely, lattice SIM, the super-resolution microscope, was used for imaging our brain tissues (Fig. 1A). SIM images were rendered to 3D volume images and analyzed with Imaris 9.0 software (Bitplane, AG, USA). Spot identification function was utilized to transfer dot-signals to size-matched spheres, as the signals were shown as sphere-shape dots in the SIM-processed images (Fig.1B). The criteria of spot identification were set by measuring the diameters of each vGLUT2 and vGAT dot signal. To measure the distance of nearest spot from vGAT or vGLUT2 to Best1, XTension distance transform module in Imaris 9.0 was used (Fig. 1A). The nearest distance from the center of each spot in vGAT or vGLUT2 channels to the center of each spot in Best1 channel was measured by creation of new channel which showed the intensity exhibiting the distance information. Each value was exported and analyzed by comparison of all values of each group.
Statistical analyses
Statistical analyses were performed using Prism 9.0.2 (GraphPad, CA, U.S.A.). All measured distance values were exhibited by violin plot to show the tendency of distribution of Best1 at the whole distance. The median value and the quartiles were displayed on each violin plot. Differences between two different groups were analyzed with the two-tailed Student’s unpaired t test. Values under 500 nm were plotted with cumulative distribution frequency of counted number of Best1 over distance. p<0.05 was considered to indicate statistical significance throughout the study (*p<0.05, ***p<0.001, ****p<0.0001; ns, not significant).
RESULTS AND DISCUSSION
Lattice SIM images reveal the ultrastructural distribution of Best1, vGLUT2, and vGAT in the hippocampus of APP/PS1 mice and MAOB-KO mice
To investigate the Best1 distribution and its proximity to vGLUT2-positive glutamatergic presynaptic terminals or vGAT-positive GABAergic presynaptic terminals in the CA1
We also investigated the Best1 distribution and its proximity to glutamatergic or GABAergic presynaptic terminals in the CA1
Differential proximity of perisynaptic astrocytic Best1 at the excitatory and inhibitory tripartite synapses in APP/PS1 and MAOB-KO mice
We further performed a quantitative analysis of the distribution of Best1 in CA1
More in-depth analysis revealed that the distance between Best1 and vGLUT2 in APP/PS1 transgenic mice was slightly but significantly farther away than that in WT mice (Fig. 4A). To distinguish the distribution of Best1 within or outside of the astrocytic microdomain which forms the tripartite synapse, we set 500 nm as the cut-off distance as it is roughly the half of the distance between two neighboring synapses, according to a previous report [27]. The Best1 localized within 500 nm from the nearest vGLUT2 in the APP/PS1 was significantly more than that in WT mice (Fig. 4B). On the other hand, the Best1 outside of the astrocytic microdomain, which was defined as Best1 located more than 500 nm away from the nearest vGLUT2, was significantly farther from the vGLUT2 in APP/PS1 mice, compared to WT mice (Fig. 4C). These findings indicate that Best1 distribution was significantly changed by moving farther away from the glutamatergic tripartite synapses, especially outside of the astrocytic microdomain, in the APP/PS1 transgenic mice (Fig. 5A). In contrast, the distance between Best1 and vGAT in APP/PS1 transgenic mice was significantly closer than that in WT mice (Fig. 4D). While the Best1 localized within 500 nm from the nearest vGAT in the APP/PS1 was slightly but significantly fewer than that in WT mice (Fig. 4E), the Best1 outside of the astrocytic microdomain was significantly closer from the nearest vGAT in APP/PS1 mice, compared to WT mice (Fig. 4F). These findings indicate that Best1 distribution moves away from glutamatergic synapses but moves closer to the GABAergic tripartite synapses, while the total number of Best1 at the astrocytic microdomain of GABAergic tripartite synapses were slightly but significantly reduced in the APP/PS1 transgenic mice compared to WT mice (Fig. 5A).
In MAOB-KO mice, we found that the distance between Best1 and vGLUT2 in MAOB-KO mice was slightly but significantly closer than that in WT mice (Fig. 4G). Also, the Best1 localized within 500 nm from the nearest vGLUT2 in the MAOB-KO was significantly more than that in WT mice (Fig. 4H). Unlike in APP/PS1 mice, the Best1 outside of the astrocytic microdomain was significantly closer from the nearest vGLUT2 in the MAOB-KO mice, compared to WT mice (Fig. 4I). These findings indicate that Best1 distribution was significantly changed by moving closer to the glutamatergic tripartite synapses in the MAOB-KO mice (Fig. 5B). Meanwhile, the distance between Best1 and vGAT in MAOB-KO mice was significantly farther away than that in WT mice (Fig. 4J). Moreover, the Best1 localized within 500 nm from the nearest vGAT in the MAOB-KO was significantly fewer than that in WT mice (Fig. 4K), while the Best1 outside of the astrocytic microdomain was significantly farther from the nearest vGAT in the MAOB-KO mice (Fig. 4L). These findings indicate that Best1 distribution was significantly changed by getting closer to the glutamatergic synapses and moving away from the GABAergic tripartite synapses in the MAOB-KO mice (Fig. 4E). Meanwhile, the total number of Best1 at the glutamatergic synapses were significantly higher and the total number of Best1 at the GABAergic synapses were significantly lower in MAOB-KO mice compared to WT (Fig. 4E).
Taken together, our findings indicate that astrocytic Best1 is distributed slightly closer to the glutamatergic synapses than GABAergic synapses in the WT mice. In APP/PS1 mice, Best1 distribution was significantly changed by moving away from the glutamatergic synapses while moving closer to the GABAergic synapses. On the contrary, in MAOB-KO mice, the Best1 distribution was dramatically changed by moving closer to the glutamatergic synapses and moving far away from the GABAergic synapses. The different proximity of astrocytic Best1 to the glutamatergic or GABAergic tripartite synapse between APP/PS1 mice and MAOB-KO mice could be attributed to the different level of astrocytic MAOB and cytosolic GABA. Future investigation is needed to determine the causal link between the cytosolic GABA content and Best1 redistribution. Furthermore, the distinctly distributed astrocytic Best1at the tripartite synapses in APP/PS1 and MAOB-KO mice could contribute to a differential regulation of synaptic transmission and plasticity through the Best1-mediated astrocytic GABA release. Finally, lattice SIM provides much improved microscopic resolution to visualize the tripartite synapse and will be very useful for discovering new features and functions for each component of peri-, pre-, and post-synapse in tripartite synapses.
ACKNOWLEDGEMENTS
This work was supported by Institute for Basic Science (IBS), Center for Cognition and Sociality (IBS-R001-D2) to C.J.L.; Brain Research Program through the National Research Foundation of Korea (NRF) funded by the Ministry of Science and ICT (2018M3C7A1056897, 2020M3E5D9079744) to M.H.N.
Figures


References
- Park H, Oh SJ, Han KS, Woo DH, Park H, Mannaioni G, Traynelis SF, Lee CJ (2009) Bestrophin-1 encodes for the Ca2+-activated anion channel in hippocampal astrocytes. J Neurosci 29:13063-13073


- Oh SJ, Lee CJ (2017) Distribution and function of the bestrophin-1 (Best1) channel in the brain. Exp Neurobiol 26:113-121
- Lee S, Yoon BE, Berglund K, Oh SJ, Park H, Shin HS, Augustine GJ, Lee CJ (2010) Channel-mediated tonic GABA release from glia. Science 330:790-796
- Perea G, Navarrete M, Araque A (2009) Tripartite synapses: astrocytes process and control synaptic information. Trends Neurosci 32:421-431
- Eroglu C, Barres BA (2010) Regulation of synaptic connectivity by glia. Nature 468:223-231
- Korte N, Nortley R, Attwell D (2020) Cerebral blood flow decrease as an early pathological mechanism in Alzheimer's disease. Acta Neuropathol 140:793-810
- Woo DH, Han KS, Shim JW, Yoon BE, Kim E, Bae JY, Oh SJ, Hwang EM, Marmorstein AD, Bae YC, Park JY, Lee CJ (2012) TREK-1 and Best1 channels mediate fast and slow glutamate release in astrocytes upon GPCR activation. Cell 151:25-40
- Jo S, Yarishkin O, Hwang YJ, Chun YE, Park M, Woo DH, Bae JY, Kim T, Lee J, Chun H, Park HJ, Lee DY, Hong J, Kim HY, Oh SJ, Park SJ, Lee H, Yoon BE, Kim Y, Jeong Y, Shim I, Bae YC, Cho J, Kowall NW, Ryu H, Hwang E, Kim D, Lee CJ (2014) GABA from reactive astrocytes impairs memory in mouse models of Alzheimer's disease. Nat Med 20:886-896
- Park H, Han KS, Oh SJ, Jo S, Woo J, Yoon BE, Lee CJ (2013) High glutamate permeability and distal localization of Best1 channel in CA1 hippocampal astrocyte. Mol Brain 6:54
- Pandit S, Neupane C, Woo J, Sharma R, Nam MH, Lee GS, Yi MH, Shin N, Kim DW, Cho H, Jeon BH, Kim HW, Lee CJ, Park JB (2020) Bestrophin1-mediated tonic GABA release from reactive astrocytes prevents the development of seizure-prone network in kainate-injected hippocampi. Glia 68:1065-1080
- Koh W, Park M, Chun YE, Lee J, Shim HS, Park MG, Kim S, Kang H, Oh SJ, Woo J, Chun H, Lee S, Hong J, Feng J, Li Y, Ryu H, Cho J, Lee CJ (2021) Astrocytes render memory flexible. bioRxiv. doi: 10.1101/2021.03.25.436945v1
- Nam MH, Han KS, Lee J, Won W, Koh W, Bae JY, Woo J, Kim J, Kwong E, Choi TY, Chun H, Lee SE, Kim SB, Park KD, Choi SY, Bae YC, Lee CJ (2019) Activation of astrocytic μ-opioid receptor causes conditioned place preference. Cell Rep 28:1154-1166.e5
- Woo DH, Bae JY, Nam MH, An H, Ju YH, Won J, Choi JH, Hwang EM, Han KS, Bae YC, Lee CJ (2018) Activation of astrocytic μ-opioid receptor elicits fast glutamate release through TREK-1-containing K2P channel in hippocampal astrocytes. Front Cell Neurosci 12:319
- Park H, Han KS, Seo J, Lee J, Dravid SM, Woo J, Chun H, Cho S, Bae JY, An H, Koh W, Yoon BE, Berlinguer-Palmini R, Mannaioni G, Traynelis SF, Bae YC, Choi SY, Lee CJ (2015) Channel-mediated astrocytic glutamate modulates hippocampal synaptic plasticity by activating postsynaptic NMDA receptors. Mol Brain 8:7
- Park JH, Ju YH, Choi JW, Song HJ, Jang BK, Woo J, Chun H, Kim HJ, Shin SJ, Yarishkin O, Jo S, Park M, Yeon SK, Kim S, Kim J, Nam MH, Londhe AM, Kim J, Cho SJ, Cho S, Lee C, Hwang SY, Kim SW, Oh SJ, Cho J, Pae AN, Lee CJ, Park KD (2019) Newly developed reversible MAO-B inhibitor circumvents the shortcomings of irreversible inhibitors in Alzheimer's disease. Sci Adv 5:eaav0316
- Chun H, Lee CJ (2018) Reactive astrocytes in Alzheimer's disease: a double-edged sword. Neurosci Res 126:44-52
- Yoon BE, Woo J, Chun YE, Chun H, Jo S, Bae JY, An H, Min JO, Oh SJ, Han KS, Kim HY, Kim T, Kim YS, Bae YC, Lee CJ (2014) Glial GABA, synthesized by monoamine oxidase B, mediates tonic inhibition. J Physiol 592:4951-4968
- An H, Heo JY, Lee CJ, Nam MH (2021) The pathological role of astrocytic MAOB in Parkinsonism revealed by genetic ablation and over-expression of MAOB. Exp Neurobiol 30:113-119
- Gustafsson MG (2000) Surpassing the lateral resolution limit by a factor of two using structured illumination microscopy. J Microsc 198(Pt 2):82-87
- Betzig E (2005) Excitation strategies for optical lattice microscopy. Opt Express 13:3021-3036
- Heintzmann R (2003) Saturated patterned excitation microscopy with two-dimensional excitation patterns. Micron 34:283-291
- Gustafsson MG (2005) Nonlinear structured-illumination microscopy: wide-field fluorescence imaging with theoretically unlimited resolution. Proc Natl Acad Sci U S A 102:13081-13086
- Rego EH, Shao L, Macklin JJ, Winoto L, Johansson GA, Kamps-Hughes N, Davidson MW, Gustafsson MG (2012) Nonlinear structured-illumination microscopy with a photoswitchable protein reveals cellular structures at 50-nm resolution. Proc Natl Acad Sci U S A 109:E135-E143
- Chen BC, Legant WR, Wang K, Shao L, Milkie DE, Davidson MW, Janetopoulos C, Wu XS, Hammer JA 3rd, Liu Z, English BP, Mimori-Kiyosue Y, Romero DP, Ritter AT, Lippincott-Schwartz J, Fritz-Laylin L, Mullins RD, Mitchell DM, Bembenek JN, Reymann AC, Böhme R, Grill SW, Wang JT, Seydoux G, Tulu US, Kiehart DP, Betzig E (2014) Lattice light-sheet microscopy: imaging molecules to embryos at high spatiotemporal resolution. Science 346:1257998
- Marmorstein AD, Kinnick TR (2007) Focus on molecules: bestrophin (Best-1). Exp Eye Res 85:423-424
- Kwak H, Koh W, Kim S, Song K, Shin JI, Lee JM, Lee EH, Bae JY, Ha GE, Oh JE, Park YM, Kim S, Feng J, Lee SE, Choi JW, Kim KH, Kim YS, Woo J, Lee D, Son T, Kwon SW, Park KD, Yoon BE, Lee J, Li Y, Lee H, Bae YC, Lee CJ, Cheong E (2020) Astrocytes control sensory acuity via tonic inhibition in the thalamus. Neuron 108:691-706.e10
- Heller JP, Odii T, Zheng K, Rusakov DA (2020) Imaging tripartite synapses using super-resolution microscopy. Methods 174:81-90