


Introduction
Due to the increasing worldwide cultivation of insect-resistant genetically modified (GM) plants, an improved availability of information on their possible impact on non-target organisms is highly required. Studies on the effect of GM plants on non-target arthropods (NTA) have mainly converged on beneficial insects such as predators and parasitoids that play a fundamental role in pest regulation (Lövei and Arpaia, Reference Lövei and Arpaia2005; Romeis et al., Reference Romeis, Meissle and Bigler2006, Reference Romeis, Hellmich, Candolfi, Carstens, De Schrijver, Gatehouse, Herman, Huesing, McLean, Raybould, Shelton and Waggoner2011; Wolfenbarger et al., Reference Wolfenbarger, Naranjo, Lundgren, Bitzer and Watrud2008; Han et al., Reference Han, Velasco-Hernández, Ramirez-Romero and Desneux2016). However, less attention has been paid to potential effects on non-target pests. In this context, insect-resistant GM plants present several features which require further information on existing protocols for non-target species environmental risk assessment (Andow and Hilbeck, Reference Andow and Hilbeck2004, EFSA, 2010; Arpaia et al., Reference Arpaia, Birch, Kiss, van Loon, Messéan, Nuti, Perry, Sweet and Tebbe2017). Risk assessment on NTA cannot only rely on Bt Cry toxicity tests (Romeis et al., Reference Romeis, Hellmich, Candolfi, Carstens, De Schrijver, Gatehouse, Herman, Huesing, McLean, Raybould, Shelton and Waggoner2011), but it should also include tests that use the whole plant to cope with the effects of potentially complex physiological interaction as a consequence of the transformation process (Andow and Hilbeck, Reference Andow and Hilbeck2004; EFSA, 2010; Arpaia et al., Reference Arpaia, Birch, Kiss, van Loon, Messéan, Nuti, Perry, Sweet and Tebbe2017). The designation of appropriate measurement endpoints, and the definition of their adequacy to clearly explain what changes correspond to an adverse effect, should improve the scientific basis upon which potential adverse impacts of insect-resistant GM plants on NTA can be evaluated (EFSA, 2010; Romeis et al., Reference Romeis, Hellmich, Candolfi, Carstens, De Schrijver, Gatehouse, Herman, Huesing, McLean, Raybould, Shelton and Waggoner2011; Arpaia et al., Reference Arpaia, Messéan, Birch, Hokannen, Härtel, van Loon, Lovei, Park, Spreafico, Squire, Steffan-Dewenter, Tebbe and Van der Voet2014; Arpaia et al., Reference Arpaia, Birch, Kiss, van Loon, Messéan, Nuti, Perry, Sweet and Tebbe2017).
The corn leaf aphid Rhopalosiphum maidis (Fitch) (Hemiptera: Aphididae) is a common pest species on maize crops worldwide (Head et al., Reference Head, Brown, Groth and Duan2001; Carena and Glogoza, Reference Carena and Glogoza2004; Stephens et al., Reference Stephens, Losey, Allee, DiTommaso, Bodner and Breyre2012). Significant R. maidis populations are related with grain yield losses. All parts of maize plant are subject to be damaged, although aphid infestation produces the greatest harm in the tassel, causing varying degrees of barrenness (Foott and Timmins, Reference Foott and Timmins1973; Bing et al., Reference Bing, Guthrie and Dicke1992; Carena and Glogoza, Reference Carena and Glogoza2004). Additionally, R. maidis can be associated with possible virus transmission (Saksena et al., Reference Saksena, Singh and Sill1964; Thongmeearkom et al., Reference Thongmeearkom, Ford and Jedlinski1976; Jarošová et al., Reference Jarošová, Chrpová, Šíp and Kundu2013). Some studies reported that this aphid performs better on Bt maize lines than on their non-transgenic counterparts (Faria et al., Reference Faria, Wäckers, Pritchard, Barrett and Turlings2007; Stephens et al., Reference Stephens, Losey, Allee, DiTommaso, Bodner and Breyre2012). Although it is considered a secondary pest on corn in Southern Europe, R. maidis can be harmful in other parts of the world, thus representing a good choice for studying the effects of Bt maize on NTA. Indeed, R. maidis is an important prey for many predators. Moreover, the increased susceptibility of Bt maize to this aphid can be an advantage for parasitoids that feed on the abundant honeydew, resulting in an increased parasitoid longevity and parasitism rate (Faria et al., Reference Faria, Wäckers, Pritchard, Barrett and Turlings2007). However, the causes of the observed increased aphid performance have still to be fully understood.
Since the Bt toxin targets are chewing insects, mainly Lepidoptera and Coleoptera, and the toxin is not translocated into phloem sap in maize plants (Raps et al., Reference Raps, Kehr, Gugerli, Moar, Bigler and Hilbeck2001), the mortality of sap-sucking insects is unlikely to be affected by the Bt toxin expressed by insect-resistant GM plants. Hence, other unintended changes in plant characteristics tied to Bt gene insertion could account for differences in aphid biological traits and population dynamics, resulting in cascade effects on trophic webs involving plant-aphids-aphidophagous insects. Secondary metabolites found in plants have a role in defense against herbivores, pests, and pathogens (Cheeke, Reference Cheeke1989). In particular, flavonoids and benzoxazinoid metabolites regulate constitutive defense against pest and diseases in maize (Ahmad et al., Reference Ahmad, Veyrat, Gordon-Weeks, Zhang, Martin, Smart, Glauser, Erb, Flors, Frey and Ton2011; Meihls et al., Reference Meihls, Kaur, Jander, Grodzicker, Martienssen, Stewart and Stillman2012). Moreover, it was observed that cereal plants with high constitutive concentrations of soluble and cell wall-bound phenolic compounds are less attractive to Rhopalosiphum spp. aphids (Bennett and Wallsgrove, Reference Bennett and Wallsgrove1994).
The aim of the current study is to evaluate the effects of Bt maize on the performance of R. maidis in comparison with its corresponding near-isogenic line, both in the short and long term, identifying and defining appropriate measurement endpoints. In doing so, both standardized laboratory bioassays and a demographic approach by means of an age-structured matrix population model (Caswell, Reference Caswell2001) were performed. The age classified model used in the population-based approach does not make explicit the presence of individuals that do not reproduce at all. Moreover, population measures can obscure individual variability. In some cases, population statistics could suggest no response to exposure to a toxicant, whereas individuals react strongly, but in opposite directions (Caswell, Reference Caswell2001). Since reproductive success could be considerable in the analysis of potential GM plants impact, an individual-based approach is also proposed to investigate the distribution of individual fitness (McGraw and Caswell, Reference McGraw and Caswell1996). Furthermore, in order to gain insight into the impact of Bt maize on R. maidis, free and bound phenolics content in transgenic and near-isogenic plants on which aphids had been fed were also measured.
Materials and methods
Plants
A hybrid transgenic maize (Bt-maize), event MON 810 (DKC442YG), expressing a gene encoding a truncated form of the Cry1Ab toxin from the Bacillus thuringiensis var. kurstaki, active against the European Corn Borer, Ostrinia nubilalis (Hübner) (Lepidoptera: Crambidae), and its correspondent non-transformed near isoline (DK440) (near-isogenic) were used in the experiments. Plants were grown from seed in 18-litre plastic pots (two plants per pot) with the same soil mixture (60% universal potting soil 40% sand) in a greenhouse (min. T 19°C, max. T 29°C; min. r.h. 55%, max. r.h. 85% and 16L:8D). Plants were watered using a timer-driven automatic drip watering system. Seedlings bearing eight true leaves were used to start aphid first generation of the experiment.
Corn leaf aphid rearing
A mass culture of R. maidis was established, starting from field-collected individuals. The corn leaf aphid was reared on wheat seedlings in a climatic chamber at 25 ± 1°C, 70 ± 10% r.h., and 16L:8D photoperiod. Before the trials, the aphids were maintained for several generations on maize plants (hybrid PR33A46, Pioneer Hi-Bred) under the same climatic conditions described above.
Aphid performance
In this bioassay, two consecutive aphid generations were studied. Transgenic and near-isogenic maize plants (five plants per treatment) were transferred to a climatic chamber (25 ± 1°C, 70 ± 10% r.h., and 16L:8D) and ordered randomly. The plants were then infested with the aphid as described below. Five other plants per treatment were subsequently transferred to the climatic chamber to hold the second aphid generation. Before transfer, all plants were visually checked for unintended aphid infestation. The experiment was composed of three independent replicates, each with a different set of plants and a total of 30 plants per treatment.
Single wingless adult aphids were transferred to clipcages (1.5 cm in diameter, h = 5 mm) (one aphid per clipcage) attached to the sixth leaf of Bt-maize and near-isogenic plants (three clipcages per plant). Clipcages were equipped with a hole sealed with fine-mesh netting to ensure air circulation.
After 24 h, all aphids were removed except for one first instar nymph per each clipcage. In each treatment, 10–15 first instar nymphs, depending on if adults produced or not offspring during the 24 h period, were kept to start a first generation's cohort. Aphids were then daily monitored through their life cycle for development and mortality. The presence of an exuvia in the clipcages indicated that a moult had occurred, and it was then removed upon discovery. When aphids molted to adult stage, all newborn aphids were daily counted and removed from the clipcage until adult aphid death.
For each treatment, about 5–7 days after reproduction onset, 10–15 second instar (L2) nymphs, coming from the first generation, were individually transferred to new clipcages on new maize plants (three clipcages per plant) of the same planting date as of the first generation, to build up a second generation's cohort. The second generation was started using L2 nymphs since transferring L1 nymphs resulted in a low settling of the younger nymphs, as previously assessed. Thus, the L1 nymphs of the second generation developed on the same plant as of the first generation. In each generation, there were three cohorts as replication on each treatment. The three replicates were carried out in succession. With the sole exception of survival analysis, all aphids lost during the experiments were not considered.
The confined aphids were used to determine the following biological traits: (1) development time, time from birth to adult appearance, (2) adult longevity, (3) total longevity, (4) total fecundity per female, (5) fecundity rate, fecundity per female per day, (6) pre-reproductive time, time from birth to reproduction onset, (7) proportion of nymphs that became winged adults.
Secondary metabolite analyses
Free and bound phenolics were extracted according to a slightly modified Hartmann et al. (Reference Hartmann, Patz, Andlauer, Dietrich and Ludwig2008) protocol. In brief, 5 g of leaves (from the central part of a leaf just above or below to the leaf bearing the aphids) were minced (Ultra Turrax T 25) with 40 ml of methanol/distilled water/acetone (60 + 30 + 10; v/v/v) and shaken for 10 min. After centrifugation at 10,000 rpm for 10 min, the supernatant containing the free soluble compounds was recovered and an extraction was repeated once. Supernatants were pooled, evaporated to dryness, and reconstituted in 10 ml of 80% methanol. The residue from the free phenolic extraction was subjected to alkaline and acid hydrolysis to recover the bound phenolic compounds, as reported by Mattila et al. (Reference Mattila, Pihlava and Hellström2005) with some modifications. After 1 h shaking with 10 ml of 2 M NaOH at room temperature, extracts were acidified adding concentrated HCl. Samples were successively centrifuged (10,000 rpm for 10 min) and supernatants collected and extracted three times with 15 ml of ethyl acetate. The ethyl acetate layers were pooled, evaporated to dryness, and reconstituted in 10 ml of methanol. Free and bound phenolic extracts were filtered through a Whatman filter paper and stored at −20°C until use for the subsequent analyses of polyphenol content. Free and bound polyphenol content of each sample was determined using the Folin–Ciocalteu procedure described by Singleton et al. (Reference Singleton, Orthofer and Lamuela-Raventos1999). Gallic acid was used as standard and polyphenol content expressed as milligrams of gallic acid equivalent per 100 g of dry weight. The experiment was composed of three independent replicates each with the same sets of plants bearing the individuals used for the aphid performance experiments.
Data analyses
Demographic analyses
Data on nymphal development and survival, along with daily adult mortality and fecundity, were used to calculate age-specific survival rate, lx, and age-specific fecundity, mx. In each treatment, Bt-maize, near-isogenic, first and second generation, age-specific survivorship, and fecundity schedules were then used to construct a z × z age-classified population projection matrix A (standard Leslie matrix) with a projection interval of one day (Caswell, Reference Caswell2001):

The only non-zero entries of the matrix, i.e., survival probability, Pi, appearing on the sub diagonal and fecundities, Fi, appearing in the first row, were calculated by means of the birth-flow formulas (Caswell, Reference Caswell2001) as follows:


where l(i) is the survivorship from birth to age i and mi is the mean number of female offspring per female in age class i.
The asymptotic population growth rate, λ, was calculated as the dominant eigenvalue of the matrix. Jackknife resampling technique was used to calculate the mean, standard error, and 95% confidence intervals associated with population growth rate (Efron, Reference Efron1982).
The life expectancy, ex, i.e., the mean age at death, and the expected lifetime reproduction, i.e., the expected number of reproductive events during a female's lifetime, have been calculated treating the transition matrix as an absorbing Markov chain with death as absorbing state (Caswell, Reference Caswell2001).
We determined how much the observed differences in population growth rates, λ, between near-isogenic and Bt-maize and between first and second aphid generations were determined by the differences in each vital rate by means of a factorial life table response experiment (LTRE) analysis (Walls et al., Reference Walls, Caswell and Ketola1991; Caswell, Reference Caswell2001). Factorial LTREs permit the examination of the interactions between factors. With this technique, α(i), the main effect of maize genotype level i (i = Bt-maize, near-isogenic), β(j) the main effect of generation level j (j = first generation, second generation), and (αβ)(ij) the effect of the interaction on λ, measured with respect to the overall mean, were estimated and decomposed into contributions from each age-specific fecundity and survival probability terms. Following Caswell (Reference Caswell2001), the linear model used for this experiment was:

where λ(ij) and λ(⋅⋅) are the dominant eigenvalues of the matrix A(ij), resulting from treatment combination, and of the overall mean matrix A(⋅⋅), used as reference matrix, respectively.
The treatment effects were estimated using the following formulas:


and decomposed into contributions from each matrix entries as follows


Each equation approximates an observed change in λ with respect to λ(⋅⋅), and each term in the summation represents the contribution of the difference in the matrix element akl (age-specific fecundity or survival probability) to the effect of treatment, on the population growth rate. That contribution is the product of the difference between overall mean and treatment-specific vital rate and the sensitivity of that vital rate calculated from a matrix halfway between the matrices being compared (Logofet and Lesnaya, Reference Logofet and Lesnaya1997). The interaction term in equation 10 represents the deviation between the observed contribution of akl to λ(ij) of the treatment combination and that predicted on the basis of an additive model (Caswell, Reference Caswell2001).
Finally, an application of matrix models, the delay in population growth index (Wennergren and Stark, Reference Wennergren and Stark2000; Stark et al., Reference Stark, Banks and Vargas2004; Stark et al., Reference Stark, Vargas and Banks2007a, Reference Stark, Sugayama and Kovaleskib), that measure population growth delay after a stressful event, was calculated to compare the time required to the four populations studied to reach a predetermined number of individuals. In this study, population delay was determined by choosing a population size of 100,000 individuals (Stark et al., Reference Stark, Banks and Vargas2004). In each treatment, population growth was simulated by multiplying the matrix A by an initial population vector n(t) = [n 1 n 2 n 3 ⋅⋅⋅ nz]T, containing information on the age distribution of the population. The population projection process was started with a vector consisting of 100 individuals distributed according to the stable age distribution and ended when at least 100,000 individuals had been reached. In each treatment, the stable age distribution, w, was calculated as the corresponding right eigenvector of the dominant eigenvalue of the matrix A (Caswell, Reference Caswell2001). All demographic calculations were performed with the software PopTools version 2.7.5 (Hood, Reference Hood2006).
Individual-based approach
An individual-based approach, based on matrix algebra, was proposed following McGraw and Caswell (Reference McGraw and Caswell1996). We represented each individual using, as a framework, the Leslie matrix with individual fecundity entries, Fi, in the first row and ones in the sub diagonal (Pi = 1, for i = 1, 2, …, ω–1). Thus, the matrix dimensions, ω × ω, are determined by the life duration, ω, of each individual. Hence, the individual transition matrix A(s) for each individual results as follows:

The dominant eigenvalue, λ(s), of this matrix represents an estimate of the success to survive and reproduce of the individual s, and ultimately, of its fitness. Individual fitness, as measured by λ(s), depends on the timing and amount of reproduction along with survival. It integrates these components into a parameter that represents the rate at which individual s, admitting that its vital rates were kept constant, could propagate its own clones (aphids reproduce by parthenogenesis) into next generations. Individual projection matrices were constructed for each aphid and the dominant eigenvalue derived for each obtained matrix.
Statistical analysis
Data on aphid biological traits were preliminarily tested with a general linear model with nested design ANOVA, its factors being ‘maize genotype’, ‘generation’, ‘replicate’, and ‘plant’. The factor ‘plant’ was nested within ‘replicate’ since there were three clip cages per plant. As the nested ‘plant’ factor had no effect (P > 0.05) on aphids’ biological traits, it was removed. A new analysis was then performed, by a factorial ANOVA, using ‘maize genotype’, ‘generation’, and ‘replicate’ as main factors. Data which violated the ANOVA assumptions (homoscedasticity and normality) were log or rank transformed. Permutation test was used to find out significant differences (α<0.05) in the population growth rate (λ), and individual fitness (λ(S)) between: (1) maize genotypes within each generation; (2) generations within each maize genotype; and (3) in the interaction of maize genotype and generation (Manly, Reference Manly1997; Caswell, Reference Caswell2001). Kaplan–Meier survival analysis was used to estimate survival over time among treatments. The log-linear rank test followed by the Holm–Sidak pairwise multiple comparison procedures was performed to detect significant differences (P < 0.05) among survival curves. Individuals which were lost during the experiments were accounted as censored. Data on secondary metabolites were tested with factorial ANOVA using ‘maize genotype’ and ‘replicate’ as main factors. Statistical analyses were performed using STATISTICA software version 10 (StatSoft Inc.) and SigmaStat 3.0 (Systat Software Inc.). Detailed data used in the analyses can be found in File 1 of the Supplementary Electronic Material.
Results
Aphid performance
The survival analysis of the two generations of R. maidis reared on near-isogenic and Bt-maize indicated significant differences among treatments (log-rank test, χ2 = 28.64, df = 3, P < 0.001) (fig. 1). First generation's aphids survived significantly longer compared with second generation's both on near-isogenic (Holm–Sidak test, P < 0.001) and Bt-maize (Holm–Sidak test, P < 0.001). In contrast, no significant difference in survival was found between maize genotypes in both generations (Holm–Sidak test, P = 0.517 and P = 0.873, for first and second generation, respectively).

Figure 1. Survival curves of two generations of Rhopalosiphum maidis on near-isogenic and Bt-maize plants.
None of the aphid biological traits differed significantly between maize genotypes and replicates (table 1). No significant differences in the development time were observed between generations, even if a significant interaction among maize genotypes and generations occurred (table 1). Moreover, a significant reduction of development time was observed in the second generation in replicates 2 and 3, but not in replicate 1 (fig. S1a). In addition, a significant maize genotype × generation × replicate interaction was observed (table 1). In particular, a marked reduction of development time for aphids reared on Bt-maize on second generation as opposed to first generation can be found in replicate 2 (fig. S2). Differently, the total longevity, the adult longevity, the fecundity rate, and the pre-reproductive time varied significantly between generations. The first two parameters decreased and the fecundity rate increased in the second generation either on transgenic or near-isogenic lines. On the contrary, the pre-reproductive time became significantly longer in the second generation on isogenic line, and shorter on Bt-maize (table 1).
Table 1. Biological traits and proportion of alate offspring (mean ± SE) of two generations of Rhopalosiphum maidis on near-isogenic and Bt-maize plants.

N/A, not analyzed.
Furthermore, with the sole exception of longevity, a significant generation × replicate interaction was found for these parameters. In particular, the adult longevity was higher in the first generation on replicates 1 and 3 (fig. S1b), whereas fecundity rate increased and pre-reproductive time shortened in the second generation in replicates 2 and 3, but not in replicate 1 (fig. S1c and S1d, respectively). For the pre-reproductive time, a maize genotype × generation × replicate interaction was also found (table 1). As for the development time, a considerable reduction in the pre-reproductive time can be observed in replicate 2 on Bt-maize in the second generation (fig. S2).
There were no significant differences in the fecundity among generations, but a significant interaction between generation and replicate was found (fig. S1e). In this case, replicate 2 showed a different trend between the first and second generations with respect to the other two. The percentage of alate production on near-isogenic and Bt-maize was not significantly different, but it decreased significantly between generations (table 1).
Demographic analyses
The population growth rate, λ, showed no significant differences between maize genotypes (P = 0.320 on F1 and P = 0.555 on F2). Among generations, λ resulted marginally higher in the F2 on Bt-maize (P = 0.083) but was unaffected on near-isogenic line (P = 0.920) (fig. 2 and table S1).

Figure 2. Population growth rate (λ) of the two generations of Rhopalosiphum maidis reared on near-isogenic and Bt-maize plants. Lines represent mean, boxes represent ±SE, whiskers ±95% confidence interval, and triangles row data.
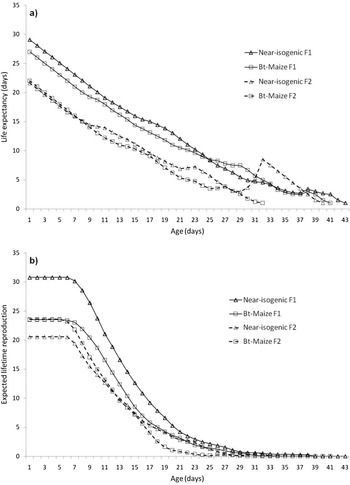
The life expectancy, ex, represents the mean lifespan that an individual aged x is expected to live if the conditions under which it is exposed were maintained (fig. 3a). The estimated value of this parameter at birth for near-isogenic F1, near-isogenic F2, Bt-maize F1, and Bt-maize F2 was 29.1, 21.6, 27.0 and 22.0 days, respectively. Overall, the life expectancy for aphids of the second generation was lower than the one of the first generation, independently from maize genotypes, with the sole exception of the aphids of the second generation older than 30 days. In this case, the aphids grown on non-transgenic plants showed a peak indicating a higher value of ex. At this age, however, the expected lifetime reproduction tends to zero. This parameter, the expected number of nymphs produced during an aphid lifetime, is reported in fig. 3b. A newborn F1 aphid can expect to produce 30.8 and 23.5 offspring on near-isogenic and Bt-maize, respectively, while a newborn F2 aphid produces 20.5 and 23.6 offspring. During its lifetime, an aphid of the first generation could expect to reproduce more than that of the second generation, if reared on near-isogenic maize. This difference cannot be observed if aphids are reared on Bt-maize (fig. 3b).

Figure 3. Life expectancy (a) and mean number of lifetime reproductive episodes (b) of two generations of Rhopalosiphum maidis on near-isogenic and Bt-maize plants.
The value of delay in population growth index showed that Bt-maize delayed population growth of the first generation of 2 days with respect to near-isogenic line (fig. 4). On the second generation, the effect reversed, with the population growth on near-isogenic line delayed by just 1 day with respect to Bt-maize. Furthermore, the delay in population growth among generations exhibits a different behavior for the aphids reared on near-isogenic and Bt-maize (fig. 4). The population reared on near-isogenic line exhibited the same population growth with no differences between generations. On the contrary, on Bt-maize, the second generation exhibited an anticipation of 3 days with respect to the first generation to reach 100,000 individuals.

Figure 4. Matrix model projections and comparison of the delay in population growth to reach 100,000 individuals for two generations of Rhopalosiphum maidis on near-isogenic and Bt-maize plants. Simulation started with 100 individuals at a stable age distribution.
Using LTRE decomposition, the effects of treatment on λ have been decomposed into contributions arising from the effect on each age-specific vital rate. Overall, the treatment effects on λ are shown in fig. 5. This figure reports the observed and calculated values of λ, the latter predicted by the model either including the interaction terms or not. The observed and calculated values are very close. The additive model shows a clear positive effect of the second generation on λ. The discrepancy of the additive model predictions from the observed values shows the magnitude of the interaction. By including the interaction terms, the difference of λ between generations on near-isogenic treatment appears to be balanced, whereas on Bt-maize, the difference is enhanced with respect to the additive model (fig. 5).

Figure 5. Population growth rate (λ) of Rhopalosiphum maidis as a function of maize genotypes and generation. Open symbols represent the observed values, filled symbols the values calculated with the additive model without the interaction terms, and the asterisks the values calculated using the model considering the interaction terms.
The effects of maize genotypes on survival are greatest at later ages (21–42 days) but these effects make negligible contribution to λ (fig. 6). Fecundity is reduced by Bt-maize and increased by near-isogenic exposure (fig. 6). Fecundity differences after ages 11–13, however, have essentially no impact on λ. Most of the fecundity-mediated impact of maize genotypes on λ occurs between ages 6 and 11. At age 5, there is a different behavior, with a reduction for the near-isogenic and an increase for the Bt-maize probably due to a shorter pre-reproductive time in the latter (fig. 6).

Figure 6. Effects of maize genotypes on age-specific survival and fecundity of Rhopalosiphum maidis measured relative to the mean (A(⋅⋅)) and contributions of those effects to population growth rate (λ).
As for maize genotypes, the effect of generation on survival is greatest at later ages (20–43 days) with negligible contribution of these effects to λ (fig. 7). First generation fecundity is reduced from 5 to 8 days of age and is increased at later ages (9–38 days); the opposite happens for the second generation (fig. 7). Moreover, later ages (9–38 days) make negligible or no contribution to population growth rate on both generations. The contributions of generation to λ are limited to the age classes from 5 to 8 and are probably to be ascribed to significant differences in the pre-reproductive time.

Figure 7. Effects of generation on age-specific survival and fecundity of Rhopalosiphum maidis measured relative to the mean (A(⋅⋅)) and contributions of those effects to population growth rate (λ).
As with the main effects, contribution of survival to the interaction terms (αβ)(ij) is negligible (fig. 8). On near-isogenic treatment, the contributions of fecundity effects to the interaction terms for the first generation are negative from 5 to 7 days of age, and positive at later ages (8–20 days); the pattern of these effects reverses for the second generation (fig. 8). As a result, λ is kept very similar among the two generations (fig. 5). For Bt-maize, the contributions of fecundity effects to the interaction terms for the first generation are most negative, indicating that Bt-maize does worse than would be expected from an additive model. On the second generation, instead, the effects are most positive indicating that the interaction of treatments i and j decreases λ with respect to the value predicted by the additive model (fig. 8). Consequently, in this case λ diverges among the two generations (fig. 5). Thus, near-isogenic treatment tends to balance the fecundity effects, whereas Bt-maize exacerbates these effects among the two generations.

Figure 8. Contributions of age-specific survival and fecundity to the interaction effect of maize genotypes and generation to Rhopalosiphum maidis population growth rate (λ).
Individual-based approach
The age classified model used in the demographic approach does not provide knowledge about the growth rate of each individual, as could be done for instance, by measuring the percentage of sterile individuals. To overcome this drawback, the individual-based approach, as described in ‘Data analyses’ section, has been used. The approach consists in: (a) deriving, for each specimen, its own individual transition matrix A(s), (b) estimating its own individual fitness by extracting the dominant eigenvalue, λ(s), from the transition matrix. Neither maize genotype (P = 0.182 on F1 and P = 0.233 on F2) nor generation (P = 0.143 on F1 and P = 0.340 on F2) significantly affected the aphid fitness λ(s), even if a marginally significant interaction occurred (P = 0.083; table S1).
Table 2 shows the first four moments and the confidence interval computed on the individual population growth distribution. The analysis of the moments allows us to assess that the individual fitness distribution is neither Normal nor Poisson. In fig. 9, the dominant eigenvalue distributions for near-Isogenic and Bt-maize individuals are plotted.

Figure 9. Histograms of dominant eigenvalue (λ(s)) distributions for near-isogenic and Bt-maize individuals.
Table 2. Statistical moments of dominant eigenvalue (λ(s)) distribution of Rhopalosiphum maidis individual transition matrix

The last row (null eigenvalue percentage) measures the percentage of sterile individuals.
The null eigenvalue (λ(S) = 0) percentages did not significantly differ among both genotypes (near-isogenic F1 vs. Bt-maize F1 χ2 = 1.33, df = 1, P = 0.249; near-isogenic F2 vs. Bt-maize F2 χ2 = 0.81, df = 1, P = 0.367) or generation (near-isogenic F1 vs. F2 χ2 = 1.44, df = 1, P = 0.231; Bt-maize F1 vs. F2 χ2 = 0.72, df = 1, P = 0.397) (table 2).
Secondary metabolite analyses
Phenolic content appeared to differ between near-isogenic and Bt-maize plants as well as among replicates (fig. 10, fig. S3). Free polyphenols were significantly lower in Bt-maize (fig. 10a), whereas the difference was not significant for the bound phenolic compounds (fig. 10b). Moreover, for free phenolic compounds, the interaction between maize genotype and replicate was significant, with a lower content of free polyphenols in the Bt-maize in replicates 2 and 3 (fig. S3c).

Figure 10. Comparison of free (a) and bound (b) phenolic content between maize genotypes. Values expressed as milligrams of gallic acid equivalent per 100 g of dry weight.
Discussion
The corn leaf aphid performed better on Bt-maize with respect to the corresponding near-isogenic line, and the related biological traits were affected by the generations. In particular, we found that the developmental and pre-reproductive times became significantly shorter in the second aphid generation on Bt-maize compared to the isogenic line. Similar beneficial effects on these parameters, due to Bt-maize, were reported on the offspring of alate of Rhopalosiphum padi (L.) (Lumbierres et al., Reference Lumbierres, Albajes and Pons2004). However, the opposite occurred for the offspring of apterous R. padi. Moreover, the study showed on the one hand a reduction of aphid survival as well as of adult total longevity, and on the other an increase of fecundity rate between generations, independently from maize genotypes. A previous study on Aphis gossypii Glover (Hemiptera: Aphididae) on Bt and non-Bt cotton plants showed differences in some biological traits, survival rate, and fecundity, among three consecutive generations (Liu et al., Reference Liu, Zhai, Zhang and Zong2005).
Concerning the demographic analysis, the population growth rate, λ, did not differ between near-isogenic and Bt-maize as well as between generations. A reduction of life expectancy was found among generations without regard for maize genotypes. On the contrary, the aphids of the second generation reared on near-isogenic line suffered a reduction of expected lifetime reproduction with respect to that of the first one; it is remarkable that this tendency was not demonstrated for aphids reared on Bt-maize. A similar pattern was found regarding the delay of population growth index. The aphids reared on near-isogenic line exhibited the same population growth with no differences between generations. In contrast, on Bt-maize, the second generation exhibited an anticipation of 3 days with respect to the first generation to reach 100,000 individuals. Faria et al. (Reference Faria, Wäckers, Pritchard, Barrett and Turlings2007), even if using a different kind of approach, also found enhanced aphid performance on transgenic maize at population level. Both in Faria et al. (Reference Faria, Wäckers, Pritchard, Barrett and Turlings2007) and in our studies, the higher susceptibility level to R. maidis of the Bt-maize suggests differences in chemical constituents that could reduce plant defenses (Dreyer and Campbell, Reference Dreyer and Campbell1987; Awmack and Leather, Reference Awmack and Leather2002; Leather and Awmack, Reference Leather and Awmack2002). Together, our and Faria et al. (Reference Faria, Wäckers, Pritchard, Barrett and Turlings2007) studies found higher susceptibility to aphids at population level on three different Bt maize hybrids, all containing MON 810 event, with respect to their respective non-Bt counterparts. This convergence of results is acknowledged to be crucial to draw general conclusions since Bt plants can vary from their nearest isolines due to breeding procedures not experienced by the latter, by as much as 4% of the genome (Andow and Hilbeck, Reference Andow and Hilbeck2004).
The results of LTRE decomposition show that, even if treatments did not significantly influence λ, Bt-maize acted chiefly by anticipating the beginning of reproduction through shortening the pre-reproductive time. Younger aphids of the first generation showed reduced fecundity, and aphids of the second generation had increased fecundity. The interaction between maize-genotype and generations was found out to be mediated mainly by effects on age at first reproduction of young aphids. Bt-maize emphasized reproduction onset effects among the two generations, whereas the near-isogenic line balanced it.
The results obtained in our study identify the possible demographic mechanisms underlying the enhanced aphid performances on Bt maize. The LTRE reveals that this enhancement is driven mainly by reduced age at first reproduction and only marginally by changes in reproduction outputs. In increasing populations, earlier reproduction – a consequence of speeding development – has a great impact on population growth (Caswell and Hastings, Reference Caswell and Hastings1980).
Concerning the individual-based analysis, the first four moments of the dominant eigenvalues (see table 2) showed an opposite trend on Bt-maize compared to the near-isogenic line, passing from the first generation to the next one. More precisely, if for a given moment, the value increases on near-isogenic line, then the same moment value decreases on Bt-maize or vice versa.
Since Cry1Ab toxin was not detected in the phloem sap of Bt-maize plant (Raps et al., Reference Raps, Kehr, Gugerli, Moar, Bigler and Hilbeck2001) and R. maidis (Head et al., Reference Head, Brown, Groth and Duan2001) and Cry proteins were measured in very small or undetectable concentrations in adults of R. padi (Dutton et al., Reference Dutton, Klein, Romeis and Bigler2002, Reference Dutton, Obrist, D'Alessandro, Diener, Muller, Romeis and Bigler2004; Svobodová et al., Reference Svobodová, Shu, Skoková Habuštová, Romeis and Meissle2017), our findings may suggest that, not the Cry toxin, but some pleiotropic effects could explain the observed differences in aphid demography and the opposite trend of fitness distributions. Several factors can affect the capacity of aphids to exploit host plants such as changes in nutritional quality (Awmack and Leather, Reference Awmack and Leather2002; Eleftherianos et al., Reference Eleftherianos, Vamvatsikos, Ward and Gravanis2006; Faria et al., Reference Faria, Wäckers, Pritchard, Barrett and Turlings2007; Lawo et al., Reference Lawo, Wäckers and Romeis2009) and secondary plant metabolites (Niemeyer, Reference Niemeyer1988, Reference Niemeyer2009; Givovich et al., Reference Givovich, Sandström, Niemeyer and Pettersson1994; Awmack and Leather, Reference Awmack and Leather2002; Ahmad et al., Reference Ahmad, Veyrat, Gordon-Weeks, Zhang, Martin, Smart, Glauser, Erb, Flors, Frey and Ton2011; Meihls et al., Reference Meihls, Kaur, Jander, Grodzicker, Martienssen, Stewart and Stillman2012). Phenolic compounds are the most representative class of secondary metabolites in maize leaves and they are present either as free molecules or as bound to the cell wall. They act as feeding deterrents for herbivores and inhibitors of enzymes (Cheeke, Reference Cheeke1989). These compounds play a fundamental role in defense against pests and pathogens. Among other, secondary metabolites of gramineous plants like the hydroxamic acid DIMBOA (Niemeyer, Reference Niemeyer1988, Reference Niemeyer2009; Ahmad et al., Reference Ahmad, Veyrat, Gordon-Weeks, Zhang, Martin, Smart, Glauser, Erb, Flors, Frey and Ton2011), flavonoids (Meihls et al., Reference Meihls, Kaur, Jander, Grodzicker, Martienssen, Stewart and Stillman2012), and the free and cell wall-bound phenolic compounds have implications for the resistance of these plants species against phytophagous pests (Bennett and Wallsgrove, Reference Bennett and Wallsgrove1994). In this study, the comparison of Bt-maize and its corresponding near-isogenic line suggested that the transformation could have induced adverse effects on the biosynthesis and accumulation of free phenolic compounds. In particular, this reduction was evident on two out of three replicates and it is remarkable that the aphid biological traits related to the same plant material, chiefly developmental and pre-reproductive times, showed an alteration. Indeed, for these parameters, a significant maize genotype × generation × replicate interaction was found. All these findings could be an explanation for the response of R. maidis to the Bt-maize in this study. Moreover, possible differences in the level of other defensive compounds such as flavonoids and benzoxazinoids, arising as a consequence of the transformation, that could concur to our finding, cannot be ruled out.
An analogous reduction in phenolic acids was reported for four transgenic Bt-maize hybrids compared to their non-transgenic counterparts (Nie et al., Reference Nie, Luo, Lin, Zeng, Huang and Wang2005). Transgenic triticale plants, transformed for enhanced phenolic production, reduced R. padi and Sitobion avenae (F.) (Hemiptera: Aphididae) performance in comparison to non-transgenic plants (Wójcicka, Reference Wójcicka2010). The author reported a prolonged pre-reproductive period for both aphids on transgenic triticale plants that had a much higher content of total phenolic. Electrical penetration graphs trials suggest that phenolic compounds are likely to reduce the quantity of food ingested, along with inducing the aphids to spend a lot of energy on detoxication mechanisms, thus accounting for longer pre-reproductive period and lower fecundity (Leszczynski et al., Reference Leszczynski, Tjallingii, Dixon and Swiderski1995).
A susceptibility to R. maidis of six Bt-maize hybrids belonging to three different transformation events was also found by Faria et al. (Reference Faria, Wäckers, Pritchard, Barrett and Turlings2007), even if a relation with secondary metabolites in their study can be only speculative. However, these authors found that, in general, transgenic lines had higher phloem concentrations of amino acids compared to isogenic lines, especially for essential amino acids. Indeed phenols and amino acids concentration and composition in the phloem have been previously found to be involved in the defense of cereals against aphids (reviewed in Awmack and Leather, Reference Awmack and Leather2002).
Even though there is some evidence that aphids performed better on Bt-maize than on non-Bt plants, no aphid economic damage has been reported in commercial Bt corn fields in comparison to non-Bt corn fields. Nevertheless, Bt-maize plants can be easily exploited by R. maidis, possibly due to lower level of secondary metabolites present in their leaves such as DIMBOA (Nie et al., Reference Nie, Luo, Lin, Zeng, Huang and Wang2005) and free polyphenols (this study), affecting population growth. The recognition of this mechanism increases our knowledge concerning how insect-resistant GM plants impact on NTA communities, including tritrophic web interactions, and can help to support sustainable use of GM crops.
Demographic analyses can provide the most complete representation of the population-level consequence of individual response to potentially complex physiological interaction due to unintended effects of transgene insertion. For example, results from LTRE decomposition analyses indicate that Bt-maize effects on fecundity of older individuals (>15 days) and aphids survival have no impact on population dynamics. Thus, such individuals, and aphid survival in general, would represent a poor choice for use in bioassays to assess environmental risk of insect-resistant GM plants. Our results also suggest that Bt-maize-driven shortening of pre-reproductive time is of key importance to understand the unintended effects of transgene insertion, on non-target pests such as aphids. Moreover our findings, along with the results of other authors (Liu et al., Reference Liu, Zhai, Zhang and Zong2005; Lazebnik et al., Reference Lazebnik, Arpaia, Baldacchino, Banzato, Moliterni, Vossen, van de Zande and van Loon2017), highlight the importance of incorporating more than one generation when studying aphids performance as a part of a risk assessment protocol. Indeed, previous studies reporting no impact on demographic parameters and on biological traits of non-target aphids on Bt-maize (Lozzia et al., Reference Lozzia, Furlanis, Manachini and Rigamonti1998; Dutton et al., Reference Dutton, Klein, Romeis and Bigler2002; Ramirez-Romero et al., Reference Ramirez-Romero, Desneux, Chaufaux and Kaiser2008) were performed by studying just one aphid generation. Only Lumbierres et al. (Reference Lumbierres, Albajes and Pons2004) found no effects of Bt-maize on R. padi analyzing more than a single generation. However, no attempts to compare successive generations were made.
Demography-based individual fitness, synthesizing individual survival, growth, and fertility data into a single statistic (λ(s)), can be profitably used as an endpoint to understand the effects of experimental treatments on individual performance. Indeed, inferences from life-history traits singularly analyzed at individual level (e.g., survival, reproduction, development, etc.) can sometimes result ambiguous since different traits can respond to an experimental treatment in different ways.
In conclusion, our methodology, including several population- and individual-level demography-based endpoints, can be recommended for a whole-plant risk assessment protocol with insect-resistant GM plants.
Supplementary material
The supplementary material for this article can be found at https://doi.org/10.1017/S0007485321000481.
Acknowledgements
We gratefully acknowledge the assistance of Elisa Bruni, Daniele Pancaldi, and Nihal Kiliç (Department of Plant Protection, Faculty of Agriculture, University of Trakya, Turkey). The authors would like to thank Frances Mary Donegan (University of Napoli Parthenope) for the proofreading of the manuscript. This is publication No. 16 produced within the framework of the project Assessing and Monitoring the Impacts of Genetically Modified Plants on Agro-ecosystems (AMIGA), funded by the European Commission in the Framework programme 7, theme KBBE.2011.3.5-01 (Grant agreement No 289706). AL received a PhD grant from the University of Bologna.


 Open access