Visibility of Polychromatic Grating-Based X-Ray Imaging Systems Based on Wave-Optical Theories and Frequency Domain Analysis
 Xiaohua Zhu
 Chengpeng Wu
 Hewei Gao
 Xi Zhang3
 - 1Key Laboratory of Particle & Radiation Imaging (Tsinghua University), Ministry of Education, Beijing, China
- 2Department of Engineering Physics, Tsinghua University, Beijing, China
- 3Department of Radiology, Fudan University Shanghai Cancer Center, Shanghai, China
Grating-based X-ray phase-contrast imaging and tomography, applicable with traditional polychromatic X-ray tubes, have shown great potential for future applications of imaging with multimodal information indicating materials and microstructures simultaneously. The parameters and performance of the grating system could be simulated by a wave-optical simulation framework and proved feasible for the design and optimization of both coherent and incoherent gratings systems. However, the simulation involves real-space point-wise calculation of the Fourier transformation, and the direct expression of the relationship of the parameters was absent. In this work, we analyzed the Fourier domain characteristics of the simulated system and the presented visibility of the system of different energies in an analytical form. The derived direct expression which omitted the simulation process was validated with results of both simulation and real experiments and may help future designs, optimizations and studies of the energy-resolved characteristics of the system.
1 Introduction
For years, differential phase-contrast and dark-field contrast images of grating-based X-ray systems have proven the capability to produce much better contrast-to-noise ratios (CNRs) and to reveal more microstructure details [1–4], compared with the attenuation contrast which conventional X-ray imaging solely relied on. From the first advances of grating systems based on high brilliance synchrotron sources [5, 6] to later developments which make grating systems applicable with conventional polychromatic laboratory X-ray tubes [7], grating-based X-ray phase-contrast imaging is emerging as a promising candidate for future X-ray imaging applications.
The fundamental idea of grating interferometry is the imaging of the X-ray refraction angle by measuring the subtle fading, distortion, and blurring of periodic stripes produced by sets of finely adjusted gratings [8, 9], based on X-ray coherent or incoherent projection effects. However, the performance and characteristics of the system, especially with wide X-ray spectrum, are complicated and unpredictable, since parameters of the system as the grating design and the processing aspects, the system geometry, the detector response, and so forth all affect the nature of the X-ray stripes of different wavelength. A proven practicable approach of the system design and optimization is through an experimentally verified wave-optical simulation framework [4, 10–13], which involves a point-wise Fourier transformation of the wave and intensity distributions of the whole propagation plane, often considered as a black box in the studies of the relationship between the outcome and the system parameters. Specifically, Weitkamp compared measured and simulated efficiency of a grating interferometer at a given energy and one particular grating system setup [14]. Engelhardt used simulations to explain the fractional Talbot effect with polychromatic laboratory X-ray sources [10]. Zhang proposed a numerical model and analytical formula based on the simulation of incoherent systems and optimized the angular sensitivity [13]. Luo optimized the grating duty cycle of the non-interferometric systems through simulation works [15]. Most works of the study of system performance relied on the simulated data of the black box and the experimental research. Analytical formulae were derived for the optimization of Talbot-Lau grating interferometry with monochromatic X-ray sources [16]. But a comprehensive theoretical expression of the relationship of system parameters and the system performance for both coherent and incoherent systems with X-ray spectrum and detector response was absent.
Our purpose in this work was to analytically describe and validate the effects of X-ray spectrum, one of the essential system design parameters, to the visibility of the stepping curve, one of the vital performance parameters of the grating imaging system. Under the viewing angle of wave optics, an analytical model of the prediction of simulated grating-based system’s performance was introduced and the expression of the intrinsic relationship was derived for both the coherent Talbot-Lau systems and the incoherent grating projection systems, about how the visibility was affected by the energy spectrum. Verified with simulation and experiment results, the analysis conveys a more accurate and direct description of the theory between system performances and X-ray energy, and predicts the effect of X-ray spectrum and energy response, circumventing the simulation calculations (together with implementation details). Instead of approximation models based on the simulation data [13], the analytic expression brought in a direct approach. The analytical model may help support further study, design, and optimization of grating-based X-ray imaging systems.
2 Materials and Methods
2.1 X-Ray Phase-Contrast System and Wave-Optical Simulation
Figure 1 shows a schematic of a grating-based X-ray imaging system. Periodic stripes are generated by the phase/absorption grating (G1), through the coherent Talbot effect or incoherent grating projection, at the plane of the analyzer grating (G2), and are then sampled and transformed into intensity variations on the detector pixels using the phase stepping technique. One of the gratings stepped over a grating period in the transverse beam direction created the intensity oscillation curve or stepping curve
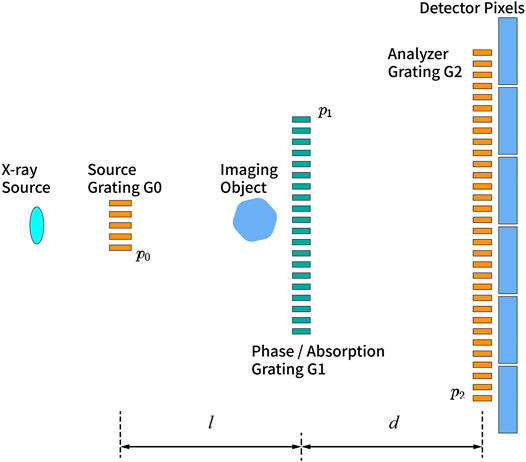
FIGURE 1. Schematic of grating-based X-ray imaging system.
Three images—attenuation, differential phase contrast, and dark-field images—could be obtained from the sinusoidal curve with and without the imaging sample. The visibility of the stepping curve (defined as
Wave-optical simulations of the Talbot-Lau interferometer have been developed by several groups [4, 10–12], and the application has been expanded to non-interferometric systems [13]. The basic theory and approximations for all implementations are similar, based on the propagation of the wave front in free space using the Fresnel diffraction theory. Grating is modeled as square waves of complex transmission function. The impact of the spatial coherence is determined through the convolution of the ideal intensity distribution transmitted to the plane of the G2 grating from an ideal plane or spherical wave with the projected source intensity distribution. The temporal coherence is introduced by calculating the intensity distribution of monochromatic sources and then summing up with weights involving the x-ray spectrum (simulated or measured) and detector response. The simulation framework was validated in earlier works.
2.2 Visibility of Monochromatic Grating-Based X-Ray Imaging System
The wave-optical model of simulation originated from an ideal plane wave transforming through the G1 grating with their square wave–like complex transmission function,
where
with λ as X-ray’s wavelength,
The Fourier transform of wave distribution is as follows:
Here,
The wave distribution
The intensity distribution
Here,
to simplify the expression.
The Talbot-Lau and the projection systems use different kinds of G1 grating, and how the stripes are created at the plane of G2 is different. The difference between the expression of
The impact of the spatial distribution of X-ray source through grating G0 (with Duty Cycle
The stepping procedures of grating G2 were simulated laterally moving within a period length and were treated as a transmission mask modulating the intensity, whose impact can be expressed as follows:
Here, G denotes the transmission distribution of G2.
So, the impact of G2 is mostly the same as G0, which is as follows:
2.3 The Expression of Visibility of Typical Grating-Based X-Ray Imaging System
As a result of the section above, here we proposed the direct expression of the visibility of typical grating-based X-ray imaging systems, which is as follows:
Here,
2.4 Visibility of Grating-Based X-Ray Imaging System With Polychromatic Spectrum and Realistic Detector Responses
The monochromatic stepping curve,
Here, P denotes projection at n-th step and X-ray energy E,
Under the assumption that the phase signal of the system (with no object)
2.5 Visibility of Quasi-Monochromatic Grating-Based X-Ray Imaging Systems With Photon-Counting Detectors
With the application of photon-counting detectors (PCDs), which captured only the incoming photons over the threshold set, the energy threshold scan enabled the quasi-monochromatic imaging. The difference of the image of neighboring energy threshold could be considered as the image of a narrow energy window between the two thresholds, and different images of different energy windows would be an insight into the energy-resolved characteristics of the system or the material information of the imaging object [18]. One prerequisite for this operation of subtracting one image from the image of the neighboring energy threshold is that the parameters of both the images remain the same. For the case of grating-based phase-contrast imaging, because of the continuing drift of the system, there was an unignorable discrepancy of the true sampling position of the stepping curve or the “jitter” between images of the neighboring energy threshold. The images of neighboring threshold, which should have been captured at the same position of the stepping curve, will not match because of the jitter-induced system shift
We could first retrieve the information
3 Results and Discussion
In this section, the analysis was verified with the simulation of different grating-based X-ray systems and real experiments with photon-counting detectors.
3.1 Comparison of the Analytical Expression and the Results of the Simulation Framework
Figure 2 shows the comparison between the visibility of stepping curve of the simulation framework and the prediction based on the analysis proposed. The system parameters are listed in Table 1. Figure 2A is based on System 1 and Figures 2B,C are based on System 2. Both of the two systems were designed at an energy around
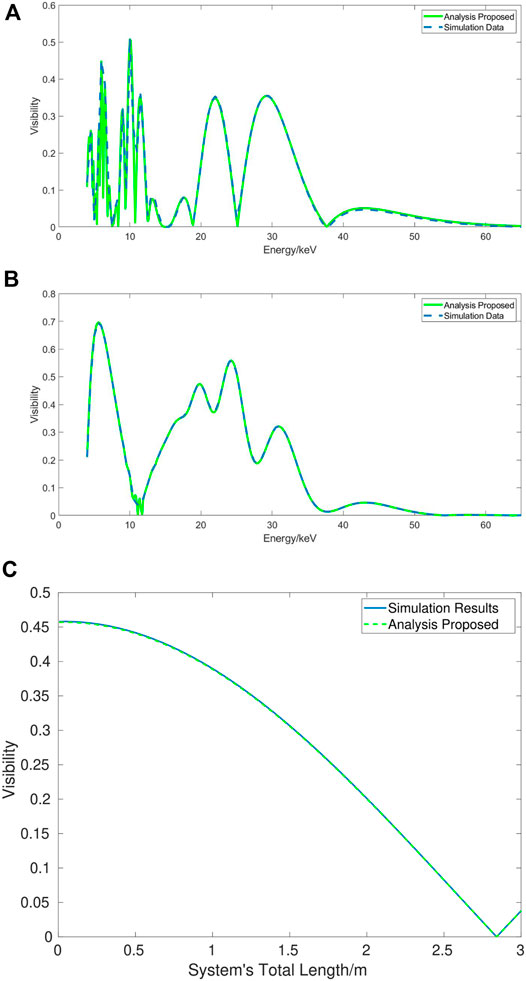
FIGURE 2. Comparison of the simulation results and the analysis proposed. (A), Visibility of System 1 (Talbot-Lau) at different monochromatic source energy. (B), Visibility of System 2 (Projection) at different monochromatic source energy. (C), Visibility of System 2 with 35-kV tungsten X-ray tube and different system total length.
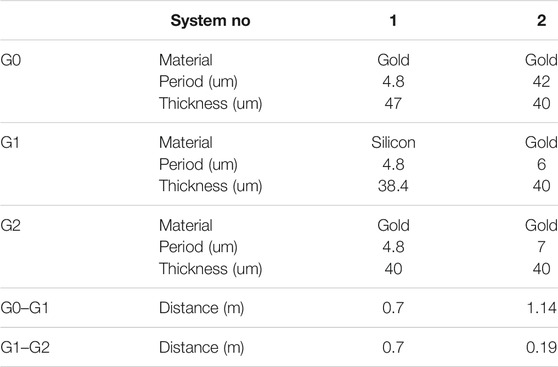
TABLE 1. System parameters of the simulation and real experiments.
3.2 Comparison of the Analytical Model and Real Experiments With PCD
Figure 3 shows the comparison between the results of real experiments and the prediction based on the analysis model.
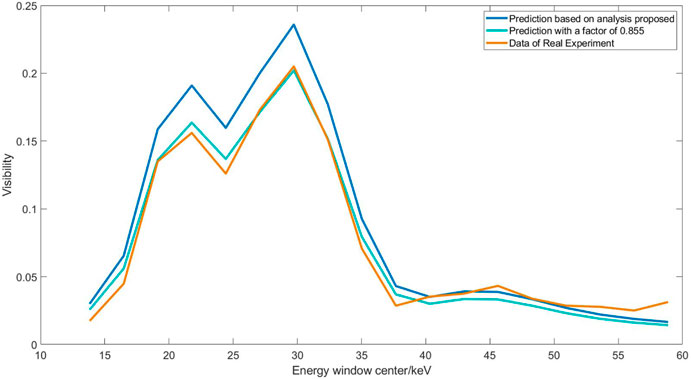
FIGURE 3. Comparison of the analysis and real experiments.
The physics experiment was done at the grating interferometry, parameters as System 1 in Table 1. The setup contains a Comet MXR160HP/11 X-ray tube of tungsten anode with a
The energy narrow window scan of 18 energy windows of 19 thresholds was done through changing the coarse parameter of FX50’s higher threshold (add 1 at a time from 3 to 21,
Phase stepping procedures were operated, and images were collected in succession at each threshold. Visibility of 18 narrow windows was retrieved through the method we proposed. The center of energy window approximately started from
The energy response of the XCounter detector was modeled and calibrated based on previous works [19], taking into account the effects including the Gaussian-like energy broadening of cadmium telluride (CdTe), the K-edge signal of Cd and Te, the anti-charge-sharing effects, and other effects of the detector. Since noise of the projection signal of one single pixel was unignorable and the calibrated parameters varied among pixels spatially discontinuously, projection signal of the pixels grouped by similar pixel-wise energy response calibration parameters and similar shape of absorption data curve of thresholds, which ensured similar detector characteristics and system’s projection nature of the detectors, were accumulated together to compensate for the noise amplification effects of the retrieval method. The X-ray spectrum is based on a simulated 55-kV tungsten X-ray source (similar to the structure of Comet MXR160HP/11) with SpekCalc software.
When the real data of the experiment and the results of our analysis model are compared, there is a 16–17% difference. This is mostly because of the imperfectness of the manufacturing of the gratings. Different ways in the literature were carried out to solve such difference between real data and simulation results. One approach was to introduce a correction factor when comparing the visibility data [20]. Another one was to make calibration of the thickness of the gratings [9], affecting the visibility differently at a different energy. To directly simulate the imperfectness of the gratings [13] was actually a combination of both approaches mentioned above, since the randomly changed thickness worked similarly as the calibration of the thickness, and the effect of the random bias of grating stripe’s period and duty cycle worked similarly as the correction factor. As for the experiment data of our work, we used a correction factor as 0.855, as far as the shape of the visibility was close to the result of the analysis based on the real thickness. The concordance of the curves in Figure 3 proved the actual correctness of the analysis model.
4 Conclusion
We have introduced a model based on the Fourier domain analysis upon the wave-optical simulation framework of grating-based polychromatic X-ray imaging systems. The derived expression was proved equivalent to the simulation and sufficient of prediction of the performance and the characteristics of the grating system of a different spectrum. The model and the expression proposed conveyed a clear and direct relationship between the system parameters and the system performances as visibility, instead of the approximation model based on the simulation results. Though limited to the theory of wave optics, real experiments showed consistency with the results of analysis and confirmed the application potential in further study, design, and optimization of grating-based X-ray imaging systems.
Data Availability Statement
The data supporting the conclusions of this article will be made available from the corresponding author upon reasonable request.
Author Contributions
The research about grating-based X-ray imaging with wide-energy spectrum and photon-counting detectors was proposed by LZ. The research funds were provided by LZ and XiZ. The simulation and analytical derivation were carried out by XiaZ. The experiments were designed by LZ and XiaZ and were carried out by XiaZ and CW. The manuscript was written by XiaZ and revised by LZ and HG.
Funding
National Natural Science Foundation of China (No. 81771829, No. 61527807, No. 62031020).
Conflict of Interest
The authors declare that the research was conducted in the absence of any commercial or financial relationships that could be construed as a potential conflict of interest.
Publisher’s Note
All claims expressed in this article are solely those of the authors and do not necessarily represent those of their affiliated organizations, or those of the publisher, the editors and the reviewers. Any product that may be evaluated in this article, or claim that may be made by its manufacturer, is not guaranteed or endorsed by the publisher.
References
1. Bech M, Tapfer A, Velroyen A, Yaroshenko A, Pauwels B, Hostens J, et al. In-vivo Dark-Field and Phase-Contrast X-ray Imaging. Sci Rep (2013) 3:3209. doi:10.1038/srep03209
2. Herzen J, Willner MS, Fingerle AA, Noël PB, Köhler T, Drecoll E, et al. Imaging Liver Lesions Using Grating-Based Phase-Contrast Computed Tomography with Bi-lateral Filter post-processing. PLOS ONE (2014) 9:e83369–9. doi:10.1371/journal.pone.0083369
3. Tapfer A, Braren R, Bech M, Willner M, Zanette I, Weitkamp T, et al. X-ray Phase-Contrast Ct of a Pancreatic Ductal Adenocarcinoma Mouse Model. PLOS ONE (2013) 8:e58439–9. doi:10.1371/journal.pone.0058439
4. Michel T, Rieger J, Anton G, Bayer F, Beckmann MW, Durst J, et al. On a Dark-Field Signal Generated by Micrometer-Sized Calcifications in Phase-Contrast Mammography. Phys Med Biol (2013) 58:2713–32. doi:10.1088/0031-9155/58/8/2713
5. David C, Nöhammer B, Solak HH, Ziegler E Differential X-ray Phase Contrast Imaging Using a Shearing Interferometer. Appl Phys Lett (2002) 81:3287–9. doi:10.1063/1.1516611
6. Momose A, Kawamoto S, Koyama I, Hamaishi Y, Takai K, Suzuki Y Demonstration of X-ray Talbot Interferometry. Jpn J Appl Phys (2003) 42:L866–L868. doi:10.1143/jjap.42.l866
7. Pfeiffer F, Weitkamp T, Bunk O, David C Phase Retrieval and Differential Phase-Contrast Imaging with Low-Brilliance X-ray Sources. Nat Phys (2006) 2:258–61. doi:10.1038/nphys265
8. Yashiro W, Terui Y, Kawabata K, Momose A On the Origin of Visibility Contrast in X-ray Talbot Interferometry. Opt Express (2010) 18:16890–901. doi:10.1364/OE.18.016890
9. Modregger P, Pinzer BR, Thüring T, Rutishauser S, David C, Stampanoni M Sensitivity of X-ray Grating Interferometry. Opt Express (2011) 19:18324–38. doi:10.1364/OE.19.018324
10. Engelhardt M, Kottler C, Bunk O, David C, Schroer C, Baumann J, et al. The Fractional Talbot Effect in Differential X-ray Phase-Contrast Imaging for Extended and Polychromatic X-ray Sources. J Microsc (2008) 232:145–57. doi:10.1111/j.1365-2818.2008.02072.x
11. Bartl P, Durst J, Haas W, Michel T, Ritter A, Weber T, Anton G Simulation of X-ray Phase-Contrast Imaging Using Grating-Interferometry. In: 2009 IEEE Nuclear Science Symposium Conference Record (NSS/MIC), Orlando, FL, USA, 24 Oct–1 Nov 2009 (2009). p. 3577–80. doi:10.1109/NSSMIC.2009.5401821 Available at: https://ieeexplore.ieee.org/document/5401821
12. Malecki A, Potdevin G, Pfeiffer F Quantitative Wave-Optical Numerical Analysis of the Dark-Field Signal in Grating-Based X-ray Interferometry. EPL (2012) 99:48001. doi:10.1209/0295-5075/99/48001
13. Zhang R, Zhang L, Chen Z, Peng W, Li R Sensitivity of a Non-interferometric Grating-Based X-ray Imaging System. Phys Med Biol (2014) 59:1573–88. doi:10.1088/0031-9155/59/7/1573
14. Weitkamp T, Diaz A, David C, Pfeiffer F, Stampanoni M, Cloetens P, et al. X-ray Phase Imaging with a Grating Interferometer. Opt Express (2005) 13:6296–304. doi:10.1364/OPEX.13.006296
15. Luo R, Wu Z, Xiong Y, Wei C, Zhang X, Hu R, et al. Optimization of Grating Duty Cycle in Non-interferometric Grating-Based X-ray Phase Contrast Imaging. Rev Scientific Instr (2017) 88:085102. doi:10.1063/1.4996507
16. Thuering T, Stampanoni M Performance and Optimization of X-ray Grating Interferometry. Phil Trans R Soc A (2014) 372:20130027. doi:10.1098/rsta.2013.0027
17. Sánchez del Río M, Dejus RJ XOP v2.4: Recent Developments of the X-ray Optics Software Toolkit. In: MS del Rio, and O Chubar, editors. Advances in Computational Methods for X-Ray Optics II, 8141. Bellingham, Washington, USA: International Society for Optics and Photonics (SPIE) (2011) p. 368–72. doi:10.1117/12.893911
18. Feng C, Kang K, Xing Y Fully Connected Neural Network for Virtual Monochromatic Imaging in Spectral Computed Tomography. J Med Imag (2018) 6:1–9. doi:10.1117/1.JMI.6.1.011006
19. Xu X, Zhang L, Wu D, Wang S Response Function Estimation for the Xcounter Flite X1 Photon Counting Detector Using Monte Carlo Method. In: 2016 IEEE Nuclear Science Symposium, Medical Imaging Conference and Room-Temperature Semiconductor Detector Workshop (NSS/MIC/RTSD), Strasbourg, France, 29 Oct–6 Nov 2016 (2016) p. 1–4. doi:10.1109/NSSMIC.2016.8069403 Available at: https://ieeexplore.ieee.org/document/8069403
Keywords: grating-based X-ray imaging, wave-optical simulation, Fourier domain analysis, visibility, energy spectrum
Citation: Zhu X, Wu C, Gao H, Zhang X and Zhang L (2021) Visibility of Polychromatic Grating-Based X-Ray Imaging Systems Based on Wave-Optical Theories and Frequency Domain Analysis. Front. Phys. 9:630337. doi: 10.3389/fphy.2021.630337
Received: 17 November 2020; Accepted: 05 July 2021;
Published: 23 August 2021.
Edited by:
Kris Thielemans, University College London, United KingdomReviewed by:
Tunhe Zhou, Stockholm University, SwedenStefan Sawall, German Cancer Research Center (DKFZ), Germany
Copyright © 2021 Zhu, Wu, Gao, Zhang and Zhang. This is an open-access article distributed under the terms of the Creative Commons Attribution License (CC BY). The use, distribution or reproduction in other forums is permitted, provided the original author(s) and the copyright owner(s) are credited and that the original publication in this journal is cited, in accordance with accepted academic practice. No use, distribution or reproduction is permitted which does not comply with these terms.
*Correspondence: Li Zhang, zli@mail.tsinghua.edu.cn