Estimating Benefits of Nature-based Solutions: Diverging Values From Choice Experiments With Time or Money Payments
 Liselotte C. Hagedoorn
 Mark J. Koetse
 - Institute for Environmental Studies (IVM), Vrije Universiteit, Amsterdam, Netherlands
Nature-based solutions (NBS) provide a promising means to a climate resilient future. To guide investments in NBS, stated preference studies have become a common tool to evaluate the benefits of NBS in developing countries. Due to subsistence lifestyles and generally lower incomes, SP studies in developing countries increasingly use time payments as an alternative to the traditionally implemented money payments. It remains unclear, however, how time values should be converted into money values, how the payment affects willingness to pay (WTP) estimates, and how this influence varies across settings with different levels of market integration. We compare the results of choice experiments that use either time or money payments and that are implemented in urban and rural Ghana. The choice experiments target to value different NBS aimed at erosion prevention and other ecosystem service benefits along the highly erosion prone Ghanaian coastline. Time payments are converted into monetary units using two generic wage-based conversion rates and one novel individual-specific non-wage-based conversion rate. We find higher WTP estimates for the time payments. Moreover, we find that the underlying implicit assumptions related to the currently commonly applied generic wage-based conversion rates do not hold. Finally, we find higher levels of market integration and smaller WTP disparities in the urban site, providing evidence that market integration allows for convergence of WTP estimates. These results provide guidance on the accurate estimation of NBS benefits through the implementation of stated preference studies with time payments.
Introduction
Over the years, nature-based solutions (NBS) have increasingly gained interest from both scholars and decision-makers due to the role that these measures can play in the transition to a sustainable and climate resilient future. NBS are defined as measures that aim to protect, sustainably manage and restore ecosystems, thereby addressing societal challenges while providing both human well-being and biodiversity benefits (e.g. Cohen-Shacham et al., 2016; WWF International, 2020). However, current investment in NBS is limited (WWPAP/UN-Water, 2018; Deutz et al., 2020), even though both the physical and cost-effectiveness of NBS have been proven (Ferrario et al., 2014; Narayan et al., 2016; Reguero et al., 2018). Because developing countries are generally more vulnerable to the impacts of climate change and natural hazards (IPCC, 2014; Jongman et al., 2015; Hossen et al., 2019), developing countries may benefit more from NBS. Still, compared to developed countries, progress on transitioning to a sustainable and climate resilient future in developing countries is lagging behind (Hinkel et al., 2012; IPCC, 2014).
To guide investments in NBS, stated preference (SP) studies have become a common tool to evaluate the benefits of NBS (Brouwer, 2008; Bockarjova and Botzen, 2017). SP studies are especially suitable for this purpose since they allow for the valuation of non-marketed goods, such as erosion prevention. The damage cost avoided approach is another method that is commonly applied to estimate benefits related to ecosystem services as erosion prevention. However, non-marketed goods are commonly neglected in applying this approach and one needs ample existing data to be able to apply the approach. The latter is especially challenging in developing countries, where data availability is generally lower. To exemplify, an IMDC (2017) study that adopted the damage cost avoided approach in Ghana identified 11 benefits and describes that reliable data is available for only two of those benefits. Therefore, applying the damage cost avoided method instead of a SP method would increase the risk of underestimating the benefits of NBS.
In SP studies, respondents are asked to make trade-offs between positive (negative) changes in ecosystem services and a payment (compensation). This payment is commonly monetary. Due to subsistence lifestyles and generally lower incomes, a monetary payment complicates trade-offs in developing countries and may therefore lead to issues with the estimation of the willingness to pay (WTP) for NBS. More specifically, using money payments could lead to an underestimation of WTP (Alam, 2006; O’Garra, 2009; Hagedoorn et al., 2020; Meginnis et al., 2020), a failure in accurately representing the preferences of certain groups in society (Alam, 2006), and various methodological problems (Gibson et al., 2016).
Time payments serve as the most popular alternative to money payments (e.g. Gibson et al., 2016; Tilahun et al., 2017; Pondorfer and Rehdanz, 2018; Owour et al., 2019; Rai et al., 2019; Alfredo and O’Garra, 2020; Endalew et al., 2020; Hagedoorn et al., 2020; Meginnis et al., 2020; Navrud and Vondolia, 2020; Van Oijstaeijen et al., 2020). The reasoning is that overall WTP is not only a function of a person’s monetary ability to contribute (e.g. money) but also of their non-monetary ability to contribute (e.g. time). Especially in developing countries non-monetary goods can also serve as a means of payment. After all, similar to money, time is subject to a budget constraint and can have high opportunity costs. Moreover, time payments are found to be highly accepted by respondents (e.g. O’Garra, 2009; Abramson et al., 2011; Casiwan-Launio et al., 2011; Rai and Scarborough, 2013; Alfredo and O’Garra, 2020; Girma et al., 2020; Hagedoorn et al., 2020; Meginnis et al., 2020).
Despite these advantages of using time payments, challenges remain especially on the conversion of time into monetary values, thereby facilitating incorporation of time payments in economic analyses. So far, studies mostly apply a generic wage-based conversion approach to convert time values to monetary ones, for instance studies use an average wage value to convert time or apply a fraction to this wage value to estimate a leisure rate as based on Cesario (1976) (e.g. O’Garra, 2009; Casiwan-Launio et al., 2011; Vondolia et al., 2014; Gibson et al., 2016). These studies thereby implicitly assume that the value of time is the same across all respondents, that all respondents would sacrifice the same activity (i.e. wage or leisure time), and that the value of leisure time is equal to a generic fraction of the wage rate1. However, all these assumptions can be questioned. Furthermore, ambiguous results from previous studies on WTP disparities resulting from time and money payments raise questions on the drivers and impacts of these disparities (e.g. Casiwan-Launio et al., 2011; Vondolia et al., 2014; Gibson et al., 2016). Expanding the knowledge on the drivers of the WTP disparities from time and money payments can be useful in guiding future payment vehicle use in developing countries.
Research Questions
In order to address the challenges related to time payments in SP studies, and thereby guide future decisions on payment vehicle use in valuation studies, we compare WTP estimates of time and money payments in a developing country context (Ghana). Additionally, we also compare these results across a rural and an urban setting with the aim to examine the effects of market integration on WTP disparities. We implement an identical choice experiment in both a rural and an urban study site, aimed at valuing erosion prevention and related co-benefits. We measure market integration by examining a range of aspects based on different strands of literature. Moreover, we add to the literature and discussion on converting time to money by comparing two traditional generic wage-based conversion rates to an individual-specific non-wage-based conversion rate. The four research questions that we address in this study are as follows:
1) Research question 1: How do WTP estimates from an experiment with a time payment vehicle differ from WTP estimates from an experiment with a monetary payment vehicle?
2) Research question 2: Do the underlying implicit assumptions related to a generic wage-based conversion rate hold when comparing these values to those resulting from a non-wage based conversion rate?
3) Research question 3: How do market integration levels differ across urban and rural settings?
4) Research question 4: How do differences in WTP estimates from time and money payment vehicle experiments correspond to differences in market integration levels?
The results of this study contribute to the existing literature on stated preference studies and valuation of NBS, with a specific focus on a developing country context. Our approach and findings provide useful guidance on how to convert time to money and we provide a discussion on when to use a time or a money payment vehicle. By improving the applied methodology and thus generating more accurate and reliable values for NBS benefits, the results of our study can be used by future SP studies to improve the quality of economic information provided to the decision-making domain to guide investments in NBS in developing countries.
The remainder of this paper is structured as follows. First, we continue this section by introducing the case study sites. Literature Review provides a review of the literature on the conversion of time to monetary values and discusses market integration as potential driver of WTP disparities from time and money payment vehicles. Methods describes the data collection and presents the methods. In Data and Analysis we describe the data characteristics followed by our approach to analyze the data. Results presents the results. Finally, Discussion and Conclusion provides a discussion of the results and presents the main conclusions.
Case Study Sites
To compare WTP estimates from time and money payments in a developing country context we selected two coastal study sites in Ghana (see Figure 1). The first is the coastal stretch between the communities of Fuveme and Anloga in the Volta delta, a rural site that includes eight smaller communities. The second is the community of Sakumono situated in Tema City, an urban site that includes one larger community. Ghana is a developing country whose coastal areas are changing rapidly. A major issue along the Ghanaian coast is the high erosion rates, to which local geology, human activities and climate change all contribute (Laïbi et al., 2014; Gomez et al., 2020). The ongoing erosion negatively affects coastal ecosystems and puts pressure on local livelihoods that depend on these ecosystems and the services they provide. In order to mitigate these negative effects, several NBS focused on erosion prevention were selected prior to this research, based on meetings with the community leaders, site visits and insights from local researchers and NGO staff. The potential restoration activities include beach nourishment, restoration of coastal lagoons, and recovering mangrove forest in the Volta delta. These restoration activities are expected to prevent erosion and provide other ecosystem service benefits.
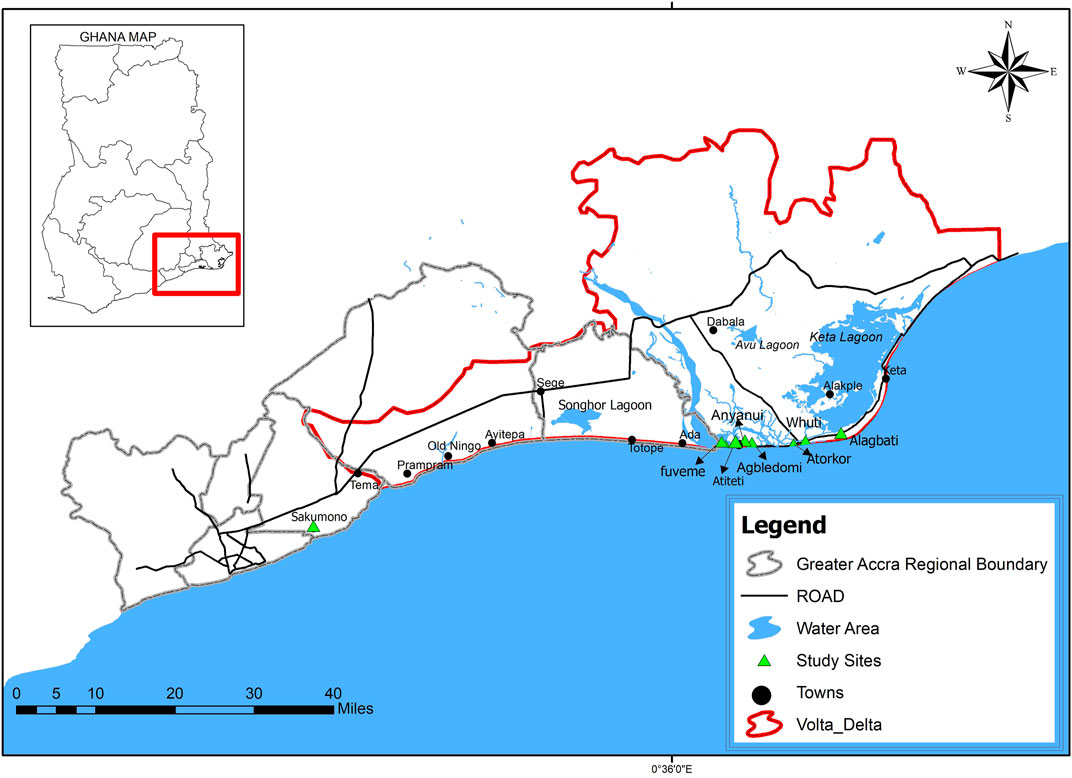
FIGURE 1. Map with the locations of the study sites.
In the Volta delta, the selected study site is situated between the Keta lagoon, Volta river and Gulf of Guinee and is thus surrounded by water and mangroves. The people depend on the different ecosystems for fisheries, fuelwood and protection from erosion and floods (The Development Institute, 2016). Due to overharvesting of fish stocks and mangrove wood in addition to ongoing erosion the ecosystems are degrading. Erosion in the Volta delta is occurring at rates between two and 10 m per year (Ly, 1980; Boateng, 2012; Deltares Aqua Monitor, 2019) forcing communities to move away from the coastline (Roest, 2018). Restoring the ecosystems can lead to improvements in the delivery of ecosystem services such as erosion control, coastal protection, fisheries, fuelwood, spiritual values, recreation and tourism opportunities.
In Tema City, a port was built in 1962 to provide cargo services to the surrounding region. Since then the city has grown substantially and local ecosystems have become degraded along the way. Main environmental issues are the coastal erosion rates of one to 5 m per year (Ly, 1980; Boateng, 2012; Deltares Aqua Monitor, 2019) and declining fish stocks (Atta-Mills et al., 2004; ISD, 2018). Adjacent to Sakumono community, the city’s largest lagoon is furthermore increasingly polluted and overgrown with grasses that affect the water flow and fish habitat. This directly affects the livelihoods of the community who still largely depend on fisheries. Restoring the ecosystems can lead to improvements in the delivery of ecosystem services such as erosion control, fisheries, spiritual values, recreation, tourism possibilities and water and air quality regulation.
Literature Review
Time-To-Money Conversion
Converting time values into monetary values is required to compare WTP estimates from time and money payments as well as to use the outcomes of a SP study with time payments in cost-benefit analyses. So far, studies mostly apply a generic market wage as conversion rate (Alam, 2006; O’Garra, 2009; Vondolia et al., 2014; Gibson et al., 2016; Meginnis et al., 2020) or estimate a leisure rate based on the study by Cesario (1976) (O’Garra, 2009; Casiwan-Launio et al., 2011). Both approaches can be criticized since they assume that the value of time is the same for all respondents while in reality we often find heterogeneity in wage and leisure rates. Tilahun et al. (2015) therefore apply individual-specific wage information, while Hagedoorn et al. (2020) compose a conversion rate that is based on individual-specific wage information as well as on information about how a respondent spends his or her time on an average day.
Despite these improvements there are still several other problematic issues with wage-based conversion rates. First, in developing contexts it is common that not all respondents earn a wage. These respondents appear in the dataset as a missing value or as if their value of time is equal to zero, an assumption that poorly reflects reality (Lloyd-Smith et al., 2019). Second, for the conversion rate proposed by Hagedoorn et al. (2020) you need a lot of information from respondents, including income information that respondents might not want to provide. Third, composing the wage and leisure-based conversion rates requires making assumptions with potentially large effects on the value of leisure time (Lloyd-Smith et al., 2019; Hagedoorn et al., 2020). Finally, there is a lack of insights in the type of activity that respondents are willing to sacrifice in order to contribute time, and thus whether we should use wage or leisure time as a proxy of opportunity costs.
Alternatively, there are studies that value time using information that is not based on wage data, for instance through modeling approaches (e.g. Jara-Diaz et al., 2008), revealed preferences (e.g. Fezzi et al., 2014), combined revealed and stated preferences (Feather and Shaw, 1999) and stated preferences (Alvarez-Farizo et al., 2001; Larson et al., 2004; Eom and Larson, 2006; Palmquist et al., 2010; Rai and Scarborough, 2013; Czajkowski et al., 2019; Lloyd-Smith et al., 2019; Meginnis et al., 2020). This paper focusses on the stated preference part of this literature. Lloyd-Smith et al. (2019) asked each respondent for their willingness to accept (WTA) a payment for time spent on specific activities via a questionnaire, while others used the results of choice formats that include both time and money attributes to calculate the opportunity cost of time (Alvarez-Farizo et al., 2001; Larson et al., 2004; Eom and Larson, 2006; Rai and Scarborough, 2013; Czajkowski et al., 2019; Meginnis et al., 2020). The observed individual-specific values of time only weakly correlate with wage values and show high degrees of heterogeneity (Czajkowski et al., 2019; Lloyd-Smith et al., 2019).
A review of the literature indicates that most studies that use time payments in developing countries implement separate stated preference questions for both time and money payment vehicles (e.g. Gibson et al., 2016; Khanal et al., 2019; Endalew et al., 2020; Girma et al., 2020; Hagedoorn et al., 2020; Navrud and Vondolia, 2020; Alemu et al., 2021). This research design feature is likely due to the fact that combining both time and money attributes in one choice format rarely suits applications other than transportation and recreation demand studies. Therefore, including a separate stated preference question on the value of time in the accompanying questionnaire provides a way forward in standardizing the conversion of time to money in valuation studies, and reduces the risk of making false assumptions in the investigated research context. These potentially false assumptions include that the value of time is the same across all respondents, that all respondents would sacrifice the same activity, that respondents either earn a wage or that their value of time is 0, and that the value of leisure time can be measured by taking a generic fraction of the wage rate. Until now, such a valuation of time approach is unexplored in the context of payment vehicle use in developing countries.
WTP Disparities From Time and Money Payment Vehicles
Previous studies that convert time values into monetary ones and consequently compare these results to WTP estimates based on money payments provide ambiguous results regarding the difference in WTP estimates. Five studies find higher WTP estimates for the time payment vehicle (Alam, 2006; O’Garra, 2009; Casiwan-Launio et al., 2011; Hagedoorn et al., 2020; Meginnis et al., 2020), four studies find similar time- and money-based WTP estimates (O’Garra, 2009; Vondolia et al., 2014; Tilahun et al., 2015; Gibson et al., 2016) and two studies find lower WTP estimates for the time payment vehicle (Vondolia et al., 2014; Navrud and Vondolia, 2020). When observing this variation in findings two things stand out. First, in the case of O’Garra (2009) and Vondolia et al. (2014) the findings are highly sensitive to the applied conversion rate. Second, since this explanation cannot explain all variation in findings it seems that the specifics of the study sites also affect the WTP disparities. In short, the literature on differences in WTP across time and money payments is sparse and fails to explain what drives the disparities.
Market integration levels are an example of site-specific factors that may affect WTP disparities. Gibson et al. (2016) observe from the literature that the disparities between WTP from time and money payments are greatest in rural sites and argue that relatively lower levels of market integration in these sites may be driving the larger disparities. The reasoning is that the absence of well-functioning labor markets and high transaction costs in some areas may mean that people are not able to sell their labor and therefore allocate more time to leisure or self-employment (Casiwan-Launio et al., 2011; Tilahun et al., 2015; Gibson et al., 2016). This in turn may decrease opportunity costs of time and lead to higher relative preferences for money. Limited access to credit markets may further increase the preference for money over time. Consequently, the willingness to contribute time compared to money will be higher and lead to the divergence of WTP estimates obtained from time and money experiments.
The empirical evidence on the effects of market integration on the divergence of WTP from time and money experiments is limited to three studies (O’Garra, 2009; Gibson et al., 2016; Hagedoorn et al., 2020). Gibson et al. (2016) investigate the differences between WTP from time and money payment experiments in a rural site in Cambodia. In their study they do not find differences in WTP from the two experiments. They argue that the close connection between their rural study site and a nearby urban area precluded any divergence and that future studies should investigate areas more remote from urban centers. In a study in Fiji, O’Garra (2009) finds that people that are employed in an urban setting are willing to pay more in money terms and less in time. Likewise, in a study in Vietnam, Hagedoorn et al. (2020) find that households with more income from wage labor are less willing to contribute time. The results from the latter two studies confirm the reasoning in the literature but more extensive analyses are necessary to confirm the effect of market integration on WTP disparities. Both Gibson et al. (2016) and O’Garra (2009) furthermore transform time values to monetary values using a generic market wage conversion rate and neither of the studies provides a measurement of local market integration levels.
Methods
We used a discrete choice experiment (DCE) embedded in a household survey which was implemented in the selected study sites as described in the previous section. To develop the DCE and questionnaire we started with an exploratory pre-test survey, followed by a qualitative and quantitative pilot survey, both serving as input and testing of the design of the main study. In the following sections we will discuss the data collection, the design of the DCE, and the household survey.
Data Collection
Data collection took place between October 2018 and April 2019. The pre-test survey was implemented during October 2018 and the pilot survey during February 2019, both among 50 respondents in each study site. The main study was implemented during March and April 2019, for which we interviewed 480 respondents in the Volta delta and 490 in Sakumono community. Based on population data obtained from community leaders we interviewed every 10th household in the rural site and every second in the urban site, thereby ensuring random sampling. Those that participated in the pilot survey were excluded from the main survey. Respondents were randomly assigned to the money or time experiment and evenly divided across both experiments.
Respondents were interviewed at their home and were asked to answer the questions on behalf of themselves as individuals, except for the questions that targeted household food consumption, income and income sources, and resource extraction. We targeted to interview the household head or the partner of the household head. The interviews were executed face-to-face by two teams of each 12 local enumerators. The enumerators were trained for one day before the pre-test survey, two days before the pilot survey and another day before the main study. Before implementation, the DCE and questionnaires were translated into the local language: Ewe in the Volta delta and Twi in Sakumono community. Insyt Esoko software2 was used to record the interview answers on mobile phones. To maintain a high quality data collection, survey responses were checked upon submission and a continuous feedback loop was established between the enumerators and the principal investigator.
Discrete Choice Experiment
DCE is a stated preference valuation method in environmental sciences that is often applied to value ecosystem services. The main theoretical underpinnings come from the theory of value (Lancaster, 1966) and random utility theory (McFadden, 1974; Hanley et al., 1998). It includes asking respondents to make repeated choices between descriptions of a good or service that are defined by a number of attributes. Johnston et al. (2017) provide guidance for stated preference studies on environmental goods and services. According to their recommendations we started with qualitative and quantitative testing of our survey and DCE among people from the target population. By doing so, we developed a clear baseline and description of the ecosystem restoration activities, avoided behavioral anomalies, and ensured a payment vehicle description that is perceived by respondents as realistic, credible, familiar and coercive. The test procedures served to reach the goal of presenting respondents with an incentive-compatible valuation exercise that involves a plausible consequential decision. Vossler et al. (2012) note that truthful preference revelation is possible when respondents believe they have at least a weak chance of influencing the decision. To ensure consequentiality of the valuation scenario, the introductory text to the survey and framing used in the DCE laid out the project partners and funding agencies and it was explicitly explained that the answers to the survey and DCE can serve as input for the design of future environmental management plans (see Supplemental Appendix A for the included statements). In the design of the questionnaire we follow the recommendations of Johnston et al. (2017) by including auxiliary and debriefing questions as well as numerous questions concerning demographics.
Pre-Test Survey
The pre-test survey served four specific goals. The first goal of the pre-test survey was to investigate the suitability of different payment vehicles. The list of payment vehicles included in the pre-test survey consisted of payment types that are familiar to the communities. The two most credible and realistic payment vehicles proved to be a monthly contribution to a community fund and time spent tending and cleaning the ecosystems. This was measured through respondent scores on trust, acceptability, practicality and coverage for each type of payment (Morrison et al., 2000). The second goal of the pre-test survey was to identify the most important ecosystem services affected by the restoration activities. In both of the selected study sites, the three ecosystem services that are most important are erosion control, fish abundance and visitors (i.e. tourists as well as local visitors). Third, the results of the pre-test also served as input for the levels and framing of the payment vehicles and attributes. Lastly, an initial value of time was estimated by comparing the results of pre-test survey questions that asked for the respondents’ maximum WTP via the community fund and the maximum WTP via time contributions (similar to Hagedoorn et al., 2020). This value of time was used to link the levels of both payment vehicles in the DCE design.
Pilot Survey
The main goals of the pilot survey were to test the clarity of the choice questions, credibility and realism of the presented situations, plausibility of the attribute levels, and clarity of the pictograms and the attribute descriptions. We first conducted five informal interviews in each study site. During these interviews we introduced the research, asked basic survey questions and presented a draft version of the experiment. Through these interviews we gained a more qualitative understanding of how the respondents perceive the different aspects of the experiment. Based on this understanding we improved the experiment before the survey was piloted among 50 respondents in each study site, after which further adjustments were made. For instance, during this phase we adjusted the business as usual (BAU) level of the fish abundance attribute from 0% change to a reduction of 10% since this better reflected the respondent’s perceptions of the BAU scenario.
Design
The design of the DCEs is presented in Table 1. An identical fractional factorial orthogonal design was used for both experiments: one with money payments and one with time payments. The initial generated fractional factorial design included 60 choice cards, after which dominant choices were identified and adjusted. The quality of our pilot survey results was not sufficient to base priors on for the creation of an efficient design, but we did learn that respondents generally perceive all changes in ecosystem services as positive and payments as negative. Based on this, a choice was identified as dominant if one option in a choice card had higher levels for all ecosystem services attributes and a lower level for the payment attribute as compared to the other option on that choice card. There were five of such choices, for which we switched the payment levels across the two options and thereby eliminated the dominant choice. The 60 choice cards were divided over six versions, so that each respondent was asked to answer ten choice questions. Besides a BAU option, each choice card included two management options A and B. These management options describe situations in which the ecosystem restoration activities are implemented and managed by the households in the community. The attributes are described by four levels and the payment vehicle by five. The levels that are included in the BAU option did not appear in any of the management options. The levels of the attributes were selected based on current erosion and fisheries trends and changes in visitor rates that were perceived as plausible by the respondents, judging by the pre-test and pilot survey results. The levels of the payment vehicles were based on the results of the pre-test and pilot survey and are related by the value of time obtained from the pre-test survey results. The payment vehicles are presented to the respondents as coercive and are similar in terms of framing. This implies that the tasks that would have to be performed would otherwise be paid for with the money collected through the community fund. These tasks include cleaning, guarding, building fences or look-outs, enforcing regulations and planting trees. Example choice cards for both experiments are shown in Figure 2 and Figure 3.
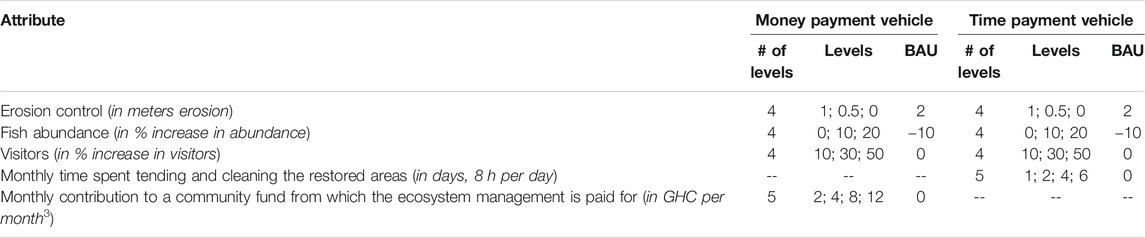
TABLE 1. Attributes and attribute levels for the discrete choice experiments (one for each payment vehicle)
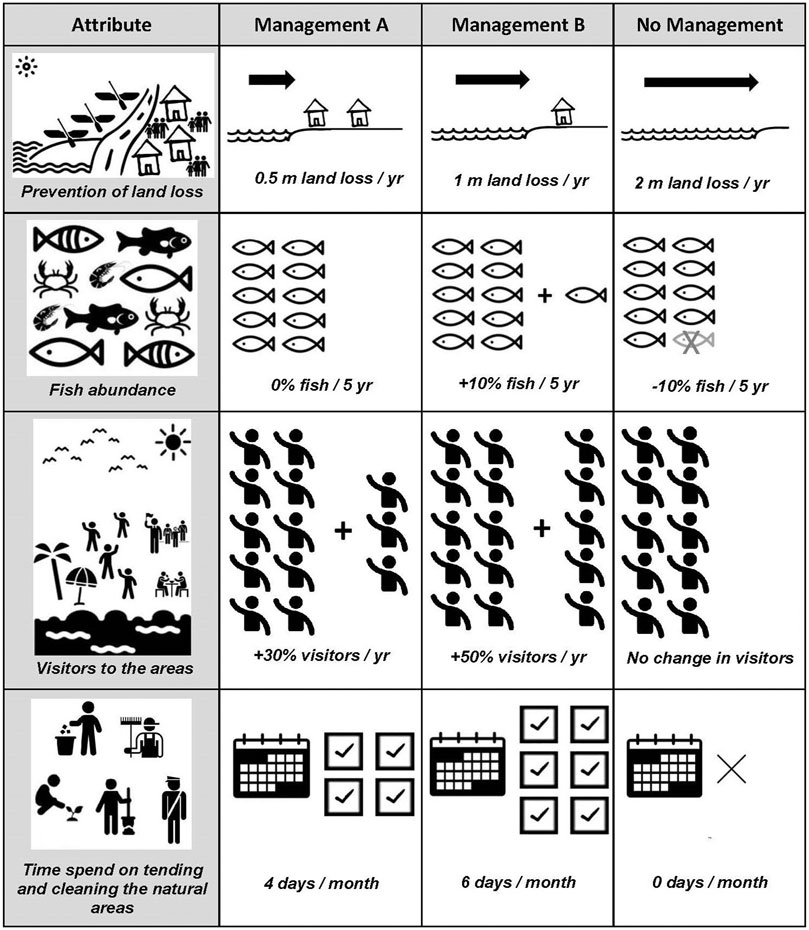
FIGURE 2. Example choice card for the time payment vehicle, used in both the rural and urban study site.
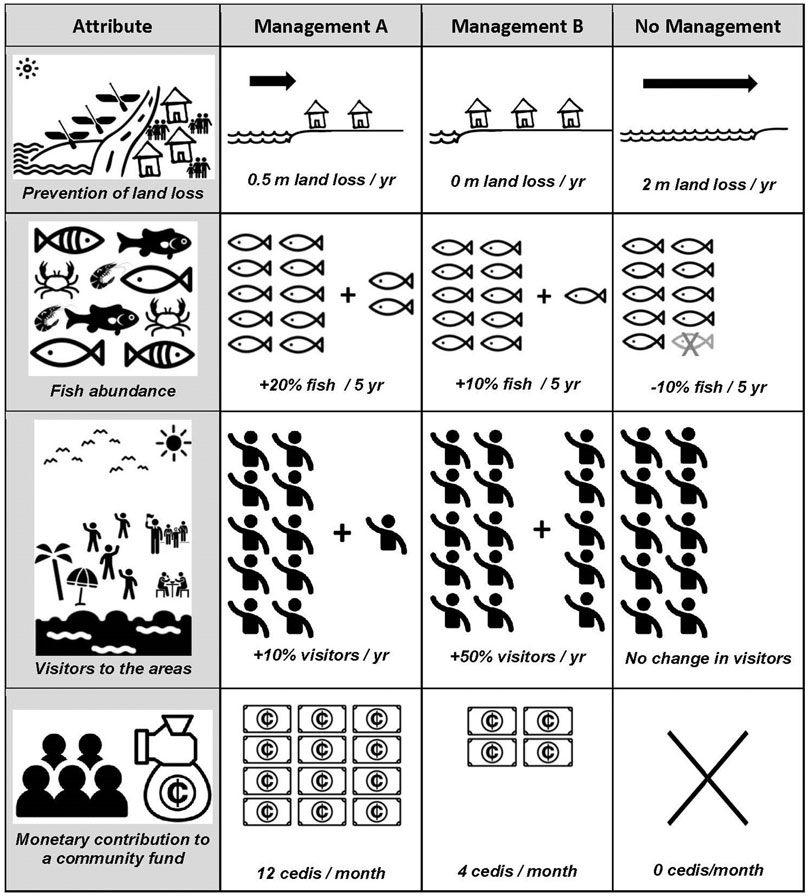
FIGURE 3. Example choice card for the money payment vehicle, used in both the rural and urban study site.
Household Survey
The questionnaire that was used in the household survey consisted of six main sections covering 1) ecosystem use and environmental perceptions, 2) DCE and 3) DCE debriefing, 4) participation in environmental projects, 5) risk perceptions and 6) demographics. The survey was developed in close cooperation between local and international NGOs and universities. Improvements were made based on the results of the pre-test and pilot surveys. The questionnaire is identical for both study sites, except for the questions on mangrove ecosystem use due to the lack of mangroves in the urban site.
Time-To-Money Conversion Rates
In this study we compare three different time-to-money conversion rates. The first two conversion rates are generic wage-based conversion rates. These conversion rates serve as a default that we compare to the third conversion rate. We base the default rates on common practices in the current literature and the study of Vondolia et al. (2014) in particular due to the proximity of our study sites. The third conversion rate is inspired by the approach of Lloyd-Smith et al. (2019) and includes individual-specific values of time that are not based on wage information.
Conversion Rate 1: Minimum Wage (TimeMW)
The minimum wage rate in Ghana during 2019 equaled 10.65 GHC for an 8-h work day. For this conversion rate this value is applied to convert the time values, similar to several previous studies (Alam, 2006; O’Garra, 2009; Vondolia et al., 2014; Gibson et al., 2016).
Conversion Rate 2: Sample Earnings (TimeSE)
For this approach we use data collected through the household survey on wages and hours worked per week to calculate each respondent’s wage for an 8-h day spent on wage labor. We also use data collected on trade profits and hours spent on trading per week to calculate each respondent’s profit for 8-h of trading. However, more than half of the respondents either does not earn a wage or does not make any money through trading. Therefore, we combine the variables on wages and trade profits to estimate an individual’s opportunity cost of time and refer to this new combined variable as earnings. If a respondent only earns income from wages and not from trade profits we include the value of an 8-h day spent on wage labor in the earnings variable. If a respondent only earns income from trade profits and not from wage labor, we include the value of an 8-h day spent on trading in the earnings variable. For those that earn income from both wage labor and trade profits we include the highest value in the earnings variable. In the rural site 65% of respondents reported earnings from either wages or trade profits and is thus included in the earnings variable, this number equals 70% in the urban site. Since this still means we are missing large portions of our samples we apply a generic value instead of individual-specific values. To estimate the generic value of time, we eliminate those respondents that did not report any earnings (i.e. those that do not earn income from wages or trade profits) and take the median of the remaining sample as the time-to-money conversion rate, similar as Vondolia et al. (2014) did for wages only.
Conversion Rate 3: Non-wage-based Individual Value of time (TimeIVoT)
To compose the individual-specific non-wage-based value of time we used the approach of Lloyd-Smith et al. (2019) as inspiration and ask respondents for the compensation they would require for an 8-h day of working on the restoration projects. The study by Lloyd-Smith et al. (2019) was conducted in a different context (i.e. fishing trips in the United States) and therefore we had to adjust the approach to fit the Ghanaian context. The main adjustment relates to the use of a stochastic payment card. During the testing phase we learned that working with such a payment card causes difficulties due to low familiarity with the use of probabilities within the Ghanaian communities (see also Navrud and Vondolia, 2020). Therefore, we decided not to use a stochastic payment card but to include an open-ended question format instead. Due to practical reasons (i.e. limited internet and otherwise increased complexity on the enumerators’ side) we were not able to include other types of format, such as the double-bounded dichotomous choice format. Adopting an open-ended format over a stochastic payment card means that we simplified the valuation approach and increased the potential for methodological issues. Nonetheless, we believe that this is a small yet valuable step forward with regard to conversion rates in developing countries. Our approach is similar to Lloyd-Smith et al. (2019) in that we describe the formulated activities as if they would comprise a part-time job. We also included a “yes/no filter” question to allow respondents to opt-out, an option that was also embedded in the stochastic payment approach of Lloyd-Smith et al. (2019). This “yes/no filter” question furthermore prevented people from stating unrealistically high values as a result of protest beliefs, an issue that we identified during the test phases when we did not include a “yes/no filter” question which guided people that simply did not want to contribute time to state extremely high values out of protest. As a result, the following question formulation was included in the main study.
Imagine a situation in which an environmental management project is implemented in your community. This could be the replanting of mangroves, deepening and cleaning of the lagoon, defending the beaches so that they do not decrease in size, and keeping all areas, including the sea, waste free. You and other community members could be asked to work between 1 and 6 days per month on this project, after implementation, to ensure that the natural areas will remain in good condition after these measures are taken. This work includes tasks such as picking up trash, guarding the natural area, building fences or look-outs, enforce regulations and planting trees.
Would you be willing to conduct this work?
(Answer: yes or no)
If yes: There might be some compensation available for this work, as if it would be a part-time job. In that case, how much would you want to be paid for one day of such work (8 h)?
(Answer: in GHC per day)
In this question formulation, the descriptions match the framing in the DCE. The question was presented to the respondents in a later stage of the questionnaire, after the DCE and DCE debriefing questions. The results of the second question were used to convert time to money values for each respondent. For those that answered “no” to the first question we did not obtain a value of time. This valuation approach proved to be efficient since it only requires two additional survey questions, compared to a long list of questions such as in Hagedoorn et al. (2020). The approach is also effective in that each respondent is able to express a value of time, also those that do not earn a wage or trade profits (over 30% in our samples) and would therefore otherwise be recorded as a missing value and thus excluded from the analysis. Moreover, the observed value of time is specifically related to the activities that the respondents are asked to conduct in the DCE. We included additional questions related to the certainty of the stated value of time and in regards to which current activity would be given up.
Market Integration Measures
Currently there is no consensus in the literature on whether a single measure can be applied to accurately represent market integration levels, and if yes what that measure should be. Studies conducted in different contexts and with different purposes have used different market integration measures. For example, the literature on Amazon tribes’ market integration focuses more on selling resources and labor division whereas studies that are applied in a wider spectrum of locations focus more on participation in, and income from, wage labor and trade profits (e.g. Godoy et al., 2010; Ensminger and Henrich, 2014). Therefore, we included multiple survey questions that measure variables that are related to market integration, based on different strands of literature. First, the studies conducted in the Amazon rainforest aim to investigate indigenous people’s market integration by applying measures including the likelihood of requesting a loan, fraction of income from wage labor, and the sale of natural resources (Godoy et al., 1997; Godoy, 2001; Godoy et al., 2005; Godoy et al., 2010; Vasco and Siren, 2016; Vasco et al., 2017). The latter measure is also found in the behavioral economics literature (e.g. Siziba and Bulte, 2012), and in the experimental economics literature (e.g. Ensminger and Henrich, 2014). Ensminger and Henrich (2014) conducted a large-scale study across all continents except for Europe and focused also on market integration measures such as the frequency of engagement in wage labor and trade, the amount of income from wage labor and trade profits, and the percentage of food bought within the household. Finally, the accumulation of durable goods is regarded to be a result of increased market integration (Boughton et al., 2007; Godoy et al., 2010). Based on this literature review, we developed a range of market integration measures as presented in Table 2.
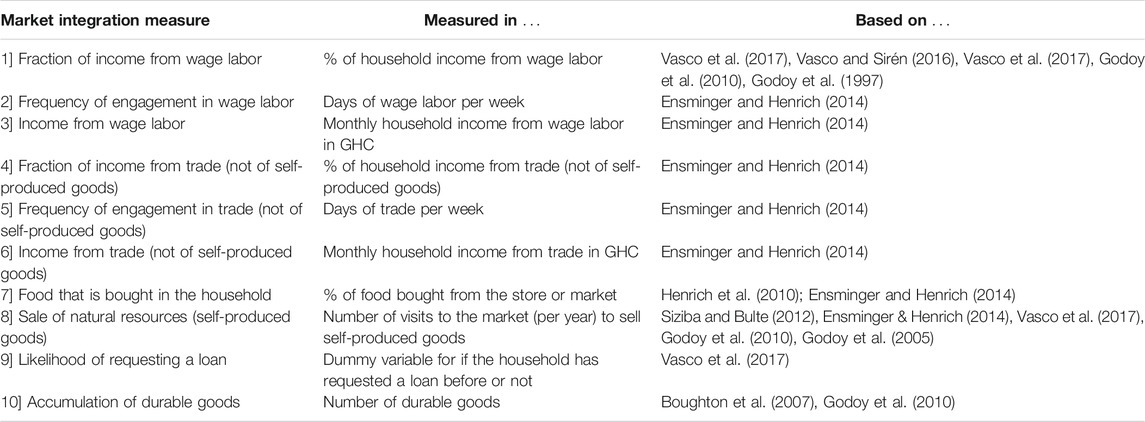
TABLE 2. Market integration measures
Data and Analysis
In the following sections, we first present the data characteristics. This chapter then describes the specifications of the models that we apply to the collected data and concludes with the statistical analysis for the differences in urban and rural WTP disparities.
Data Characteristics
Prior to the analysis we excluded protesters from the dataset. They were identified by their choice to select the opt-out in all of the presented choices combined with their answer to a debriefing question that focused on the reason for this choice. If the reason was either a lack of responsibility, lack of trust, or unwillingness to weigh the different attributes against each other we excluded the respondent (e.g. Meyerhoff and Liebe, 2010; Meyerhoff et al., 2014). Nine protesters were identified in the rural sample, of which three in the time sample and six in the money sample. In the urban sample, five protesters were identified in the time sample and zero in the money sample. For the calculation of TimeIVoT we excluded another ∼20% of the respondents from both the rural and urban time samples since they stated that they do not want to work on the restoration projects, answering “no” to the filter question. The datasets without these respondents are referred to as “converted time payment samples”.
The key characteristics of the data are presented in Table 3. Applying Kruskal-Wallis and Chi-square tests we found no significant differences in any of the variables included in Table 3 between the samples that either answered to money or time payments in both sites. In the remainder of this paper we compare the money payment samples with the converted time payment samples. In comparing these samples, we only find a higher age in the rural converted time payment sample compared to the rural money payment sample. Furthermore, we measure the perceived credibility of the valuation scenario through a follow-up question. More specifically we asked respondents for their level of agreement with the statement “I believe that the changes shown in the experiment can take place in reality”. The results of this follow-up question indicate that on average the respondents perceive the valuation scenario as credible, which furthermore suggest that they perceive their choices as consequential.
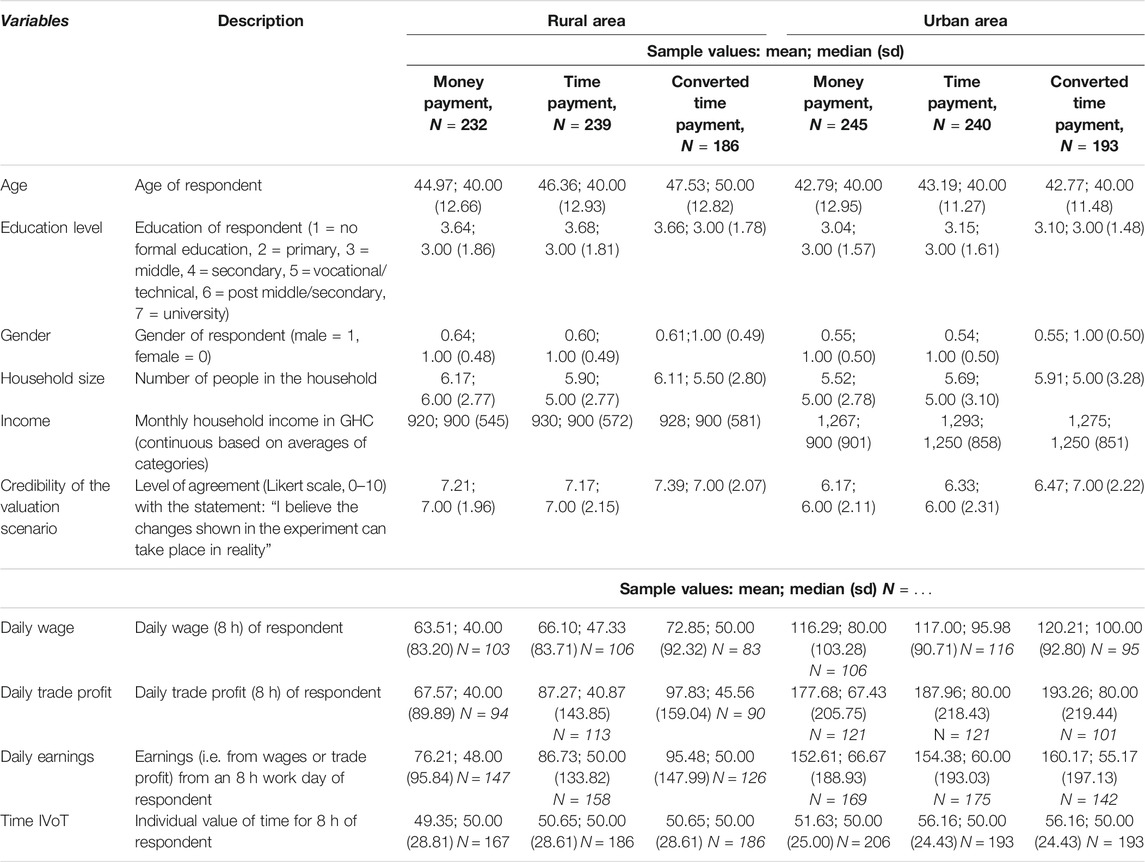
TABLE 3. Data characteristics for the three samples (money payments, time payments, converted time payments sample) in each area
Model Specification
We estimated five models for each study site. One for the money payments, one for the time payments, and one for each of the three different conversion rates. The conversion of time values to money values was performed before model estimation by applying the three time-to-money conversion rates to the time values in the converted time payment sample dataset. The converted time attribute was then included in the model instead of the original time attribute. The converted time payments sample dataset is used for all conversion rates to ensure comparability across these model results and to exclude uncertainties related to the answers provided by respondents who stated that they do not want to contribute time but did answer to choice cards that included time contributions. We convert the time values before model estimation to be able to also run the Krinsky and Robb (1986) procedure, and obtain the information necessary for the statistical comparison of differences in WTP across the urban and rural study site as described in the next section.
To allow for preference heterogeneity and obtain coefficient estimates at the individual level, we analyzed each choice dataset using a random parameters logit (RPL) model (Train, 2003). In this model the probability P that individual i chooses alternative j out of k = 1 … K alternatives is equal to:
in which X is a vector with choice attributes and β is a vector with attribute parameters to be estimated by the model. These parameters vary per respondent (hence βi) with probability density Δ(βi | b). This density can be a function of any set of parameters, but in our case it represents the mean and variance of β in our sample. Because the model in Eq. (1) has no analytical solution, simulations are needed with which draws are taken from a pre-specified distribution for each βi. In our models all attributes are included as continuous variables and for each attribute 3,200 Halton draws are taken from the triangular distribution; number of draws are based on Czajkowski and Budziński. (2019). We use triangular distributions instead of normal distributions to allow for clearer visualization of the WTP distributions and to ensure finite coefficient bounds for all attributes and the payments, which is of relevance for the analysis described in Statistical Approach to Compare WTP Disparities Across the Study Sites as well as for obtaining finite moments for the WTP estimates (Rai et al., 2015). However, the main patterns and conclusions are very similar for both distributions.4 For erosion control the preferences are restricted to negative values since the attribute is coded as increases in erosion for which negative preferences can be expected. For increases in fish abundance positive preferences can be expected and thus here the draws are restricted to positive values. For visitors there is no restriction on preferences since positive as well as negative preferences can be expected related to increases in tourist numbers. The payment vehicle values are redefined to be the negative of the variable and thereafter included in the model with a lognormal distribution and the standard deviation restricted to 0, following the newest model to estimate WTP from Carson and Czajkowski (2019). Carson and Czajkowski (2019) suggest this approach to overcome the problem that exists with the ratio of coefficients approach to calculate WTP, being that it results in an undefined standard error for WTP.
The Krinsky and Robb (1986) procedure was applied to obtain 95% confidence intervals of mean WTP estimates. By doing this for each of the five models we obtained values for WTPmoney and WTPtime(days) as well as for the converted time payment samples resulting in WTPtime(MW), WTPtime(SE) and WTPtime(IVoT). Furthermore, respondent-specific parameter estimates were used to estimate WTP for each respondent for each attribute for all estimated models. The WTP values on respondent level are used to visualize and statistically compare the WTP distributions by applying Mann-Whitney U tests.
Statistical Approach to Compare WTP Disparities Across the Study Sites
We statistically compare the differences in WTP from time and money payments between the rural and urban sites to identify in which study site WTP disparities are larger. It was not possible to ask respondents to do both time and money choice experiments, since this would increase the cognitive complexity of the survey too much (based on observations and assessments made during the pre-test and pilot stages). We are therefore not able to compare differences in WTPmoney and time-based WTP on a respondent level. However, through a combination of statistical methods we can still statistically compare WTP disparities across the rural and urban study sites in a meaningful way. We describe the steps taken briefly below, and provide a more extensive description in Supplemental Appendix B.
1) Take 10,000 random draws from the triangular distributions of attribute coefficients obtained from the RPL models. By taking into account the full distribution of the attribute coefficients, as an alternative to only the mean estimates, we include as much information as possible in our analysis.
2) Calculate a WTP value for each draw for all attributes.
3) Use the WTP values to calculate percent differences (PDs) between WTP estimates derived from the money experiments and from the experiments with different time-to-money conversion rates.
4) Apply Mann-Whitney U tests to statistically compare the PDs between the rural and urban site, per attribute. We apply a non-parametric test here since we do not know the distribution and standard error of the PDs.
Results
Time-To-Money Conversion
As described earlier, we calculated three different conversion rates. The first conversion rate, TimeMW, is based on publicly available information on the Ghanaian minimum wage equaling 10.65 GHC per day. For the second conversion rate, TimeSE, data from the household survey resulted in a median sample earnings of 50 GHC per day in the rural study site and 60 GHC per day in the urban study site. The distributions of TimeSE are statistically different across the study sites (Mann-Whitney U test, p = 0.001). The estimated values of time for the third conversion rate, TimeIVoT resulted in a median of 50 GHC in both study sites. The distributions of TimeIVoT are not statistically different across the study sites (Mann-Whitney U test, p = 0.123). The results of a follow-up question reveal that respondents feel certain about their stated individual value of time (i.e. average of 4.48 out of 5 in the rural site and 4.34 out of 5 in the urban site). To be able to contribute time to the environmental projects, most respondents would give up leisure time (urban: 50%, rural: 68%), followed by subsequently housework (urban: 22%, rural: 9%), and income generating activities such as wage labor (urban: 3%, rural: 9%), trading (urban: 12%, rural: 8%) and fishing or farming (urban: 6%, rural: 6%). In the urban study site, compared to other activities the distribution of the values of time are significantly different for wage labor (mean: 65 GHC) and for leisure (mean: 50 GHC) (Mann-Whitney U test, p = 0.098, p = 0.008). In the rural study site, compared to other activities the distribution of the values of time are significantly different for fishing and farming (mean: 33 GHC) (Mann-Whitney U test, p = 0.008).
Figure 4 and Figure 5 visualize the relation between TimeIVoT and the individual-specific values underlying TimeSE, including individual-specific wages, trade profits and overall earnings. We find positive correlations between TimeIVoT and the individual-specific wage, trade profit and earnings variables in the rural site (Spearman’s Rho = 0.188 with p = 0.019, Spearman’s Rho = 0.156 with p = 0.060, Spearman’s Rho = 0.181 with p = 0.006, respectively). In the urban site we find a positive correlation between TimeIVoT and individual-specific trade profits (Spearman’s Rho = 0.172 with p = 0.014). The percentage of people whose TimeIVoT is below or equal to their individual-specific earnings is 67% in the rural site and 57% in the urban site. In comparing the results of TimeIVoT to people’s individual-specific earnings we find that at the median people’s TimeIVoT equals 74% of their earnings in the rural site and at 83% of their earnings in the urban site. The percentage of respondents whose TimeIVoT is below or equal to the minimum wage, used for TimeMW, is 12% in the rural site and 4% in the urban site.
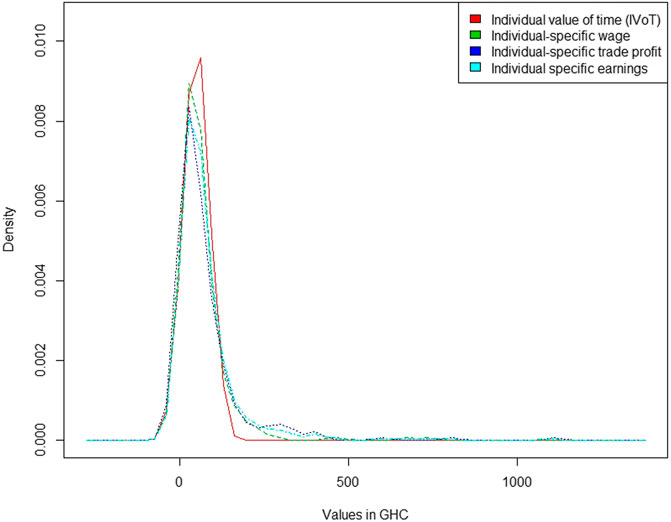
FIGURE 4. Kernel density plot of TimeIVoT and individual-specific wage, trade profit and earning values in the rural study site.
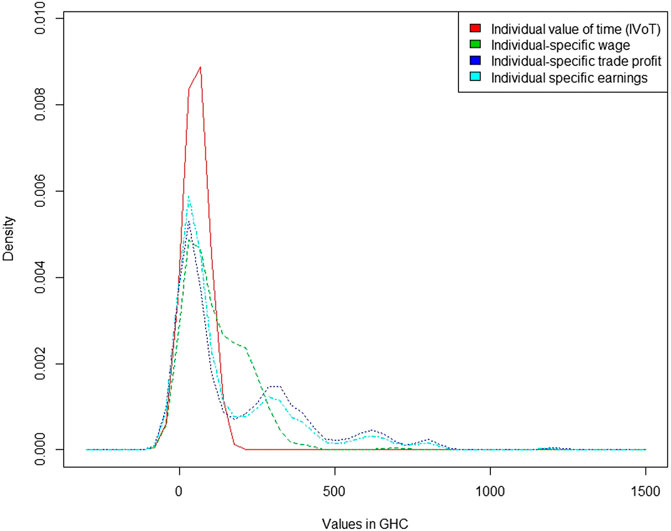
FIGURE 5. Kernel density plot of TimeIVoT and individual-specific wage, trade profit and earning values in the urban study site.
Model Estimation and WTP Results
The results of the RPL models are presented in Table 4 and Table 5. Positive preferences are identified for all ecosystem services in both study sites. Results of the Krinsky and Robb (1986) simulations are included in Table 6. Higher WTP values are found for the time payments for each conversion rate, in both study sites, and for all ecosystem services. We furthermore identify large differences when comparing WTPmoney to WTPtime(MW) and especially WTPtime(SE) and WTPtime(IVoT). The WTP values for the rural visitors attribute are about 46 times larger for WTPtime(SE) than for WTPmoney. The WTP values for the urban erosion attribute are about 20 times larger for WTPtime(IVoT) than for WTPmoney. The identified differences in the distributions across WTPmoney and the time-based WTP results are significant (Mann-Whitney U, p = 0.000, for all attributes in both sites).
TABLE 4. Results of the RPL models for the time and money experiments in both study sites
TABLE 5. Results of the RPL models for both the rural and urban converted time experiments
TABLE 6. Results of the Krinsky and Robb simulations for all rural and urban experiments
In Figure 6 and Figure 7 we plotted the WTP distributions of WTPtime(MW), WTPtime(SE) and WTPtime(IVoT) for each of the ecosystem services and per study site. Including all distributions in one figure was not possible since the distributions of WTPtime(MW), WTPtime(SE) and WTPtime(IVoT) are much more dispersed and therefore would not be visible when combined with WTPtime(days) and WTPmoney. The distributions of WTPtime(days) and WTPmoney are included in separate figures in Supplemental Appendix C. The results of Mann-Whitney U tests show that all distributions are significantly different from each other, except for the urban as well as rural distributions of WTPtime(SE) and WTPtime(IVoT) for the visitors attribute.
FIGURE 6. Rural willingness to pay (WTP) distributions for time (converted) payments for the three attributes “erosion control” (left), “fish abundance” (middle) and “visitors” (right).
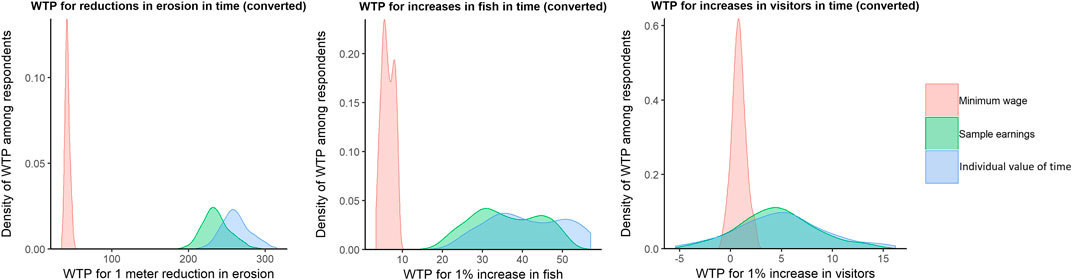
FIGURE 7. Urban willingness to pay (WTP) distributions for time (converted) payments for the three attributes “erosion control” (left), “fish abundance” (middle) and “visitors” (right).
Differences in Market Integration Levels and WTP Disparities Across Study Sites
The results of the analysis on the differences in market integration measures across our study sites is presented in Table 7. These results show that the two sites differ significantly in terms of market integration levels. We find that people in the urban site participate more frequently in wage labor and trade and also earn more income from these sources, both proportionally and in terms of actual income. Moreover, a higher percentage of the urban respondents has requested a loan before and urban respondents source more of their food from stores and markets rather than from subsistence activities. However, one market integration measure resulted in a significantly higher value for the rural study site: sale of natural resources (measure 8).
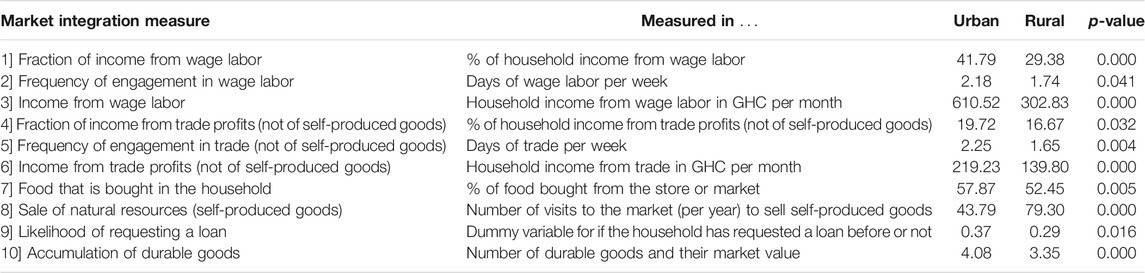
TABLE 7. Results of the comparison of market integration measures across the urban and rural study site, analysed through Kruskal-Wallis and Chisquare tests
In Table 8 the results of the analysis procedure to statistically compare WTP disparities across the rural and urban study sites, is presented. This procedure is described in detail in Supplemental Appendix B. We find that the results of the Mann-Whitney U tests all indicate that there are significant differences in WTP disparities across the study sites. In Table 8 we also included the median of the PDs, which represent the size of the randomly generated WTP disparities for each conversion rate in both the urban and rural study site. Here, we present the median to avoid outlier effects. The results show that for all attributes the PDs between WTPmoney and time-based WTP values are smaller in the urban study site than in the rural study site. For instance, we find that for the erosion control attribute, at the median, WTPtime(MW) is about 7.2 times larger than WTPmoney in the rural study site and about 3.5 times larger than WTPmoney in the urban study site. Supplemental Appendix D includes two additional sensitivity analyses on this matter, discussing differences across samples in terms of market integration measures and whether the full time or converted time samples are used.
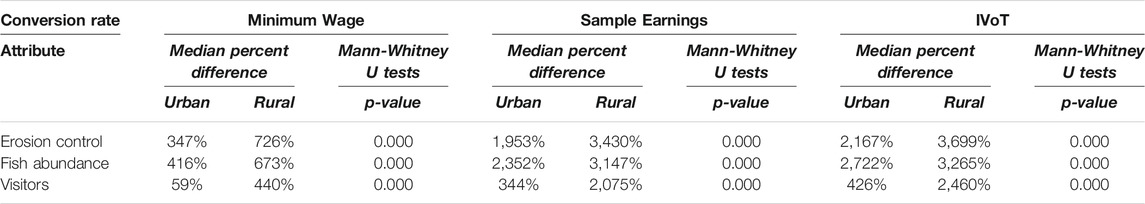
TABLE 8. Results of the analysis procedure to compare urban and rural WTP disparities as described in Supplemental Appendix B. Including the results of the Mann-Whitney U tests on whether the size of the WTP disparities differs significantly across the urban and rural study sites, and the median of the percent differences (PDs) that represent the WTP disparities between WTPmoney and WTPtime based on the different conversion rates in each site.
Discussion and Conclusion
The aim of this study was to investigate differences in WTP estimates from choice experiments with time and money payments, with the overall goal to estimate more accurate WTP estimates related to NBS benefits. More accurate WTP estimates means higher quality of information on the value of ecosystems and benefits of investing in NBS. Current investment in NBS is low, even though NBS have the potential to contribute to a sustainable and climate resilient future. This is especially the case in developing countries, where the impact of climate change and natural hazards is generally higher. Therefore, we use the results of separate DCEs using time and money payments to value ecosystem services related to NBS in rural and urban Ghana. The NBS include beach nourishment, restoration of coastal lagoons, and recovery of mangrove forest. These NBS are expected to affect the delivery of ecosystem services, including erosion prevention, fish abundance and visitors to the ecosystems. The investigated communities currently face high erosion rates and decreases in fish abundance, both of which are expected to exacerbate with climate change, and thereby increase the need for alternative livelihoods. We first discuss our findings, structured by the four central research questions, and then continue to summarize our conclusions.
Discussion
Generally, our results comply with studies that have found higher WTP values for the time payment vehicle (Alam, 2006; O’Garra, 2009; Casiwan-Launio et al., 2011; Hagedoorn et al., 2020; Meginnis et al., 2020) but contrast others (Vondolia et al., 2014; Tilahun et al., 2015; Gibson et al., 2016; Navrud and Vondolia, 2020). What is particularly interesting is that our rural study site (Volta delta) is nearby the ones used in Vondolia et al. (2014) and Navrud and Vondoli. (2020). Vondolia et al. (2014) found lower WTP estimates when time was converted using the minimum wage and comparable WTP estimates when time was converted using the sample wage. Navrud and Vondoli. (2019) found lower WTP estimates when time was converted with a wage rate as estimated via a pre-test questionnaire. The main difference between our study and the one from Vondolia et al. (2014) is that their respondents were already used to contributing time as well as money to the management of the irrigation channels. This provides a possible explanation for the difference in results5. Details on the type of work that would be conducted by the respondents are lacking in Navrud and Vondoli. (2019), but the study considers different payments for flood insurance that will pay insured farmers after a flood with bags of rice. The difference in results between our study and the one from Navrud and Vondoli. (2019) can potentially also be explained through experience with payments, where it is likely that respondents have more experience with money payments for insurance compared to time payments. More research would be needed to identify how experience with payments for different types of goods affects WTP disparities.
With regard to the size of the WTP disparities, large differences in WTP from time and money experiments have been identified in the literature before (Casiwan-Launio et al., 2011; Hagedoorn et al., 2020). Furthermore, previous studies find that the application of individual-specific conversion rates results in higher WTP estimates compared to generic conversion rates (Tilahun et al., 2015; Hagedoorn et al., 2020). However, the results of both WTPtime(SE) and WTPtime(IVoT) can be perceived as somewhat extreme, so we put these values into perspective by comparing the WTP estimates for the fisheries attribute to the household income. In the rural study site, mean household income equals 924 GHC and about 25% of this income is related to fishing. In the urban study site mean household income equals 1,280 GHC and about 32% of income is related to fishing. Therefore, mean WTPtime(SE) and WTPtime(IVoT) values for 1% increase in fisheries of ∼10 GHC in the rural site and ∼40 GHC in the urban site are not unrealistic, especially since much of the fish catch is used for subsistence and is therefore not included in the households’ monetary income. Survey data shows that around 20% of the households’ food consumption comes directly from their own fisheries and that between 19 and 25% of the harvested resources never reaches the market due to subsistence use. Nonetheless, on average respondents only work or trade around 3-h per day, which could have led to reduced belief in payment consequentiality in regards to having to work 8-h days. This would also mean that accounting for 8-h of a person’s time in TimeSE and TimeIVoT resulted in an overestimation.
Currently, it is common practice in the stated preference literature in developing countries to apply a generic wage-based conversion rate, either the market wage rate or a leisure rate (e.g. Alam, 2006; O’Garra, 2009; Casiwan-Launio et al., 2011; Vondolia et al., 2014; Gibson et al., 2016; Meginnis et al., 2020). Our findings strongly suggest that the underlying implicit assumptions made in using such a generic wage-based conversion rate do not hold. First, we identify high heterogeneity in both wage, trade profit and earnings data and TimeIVoT, indicating that values of time differ across respondents. Second, we find that there is diversity in the type of activity people would be sacrificing to enable the contribution of time. Therefore, assuming that all respondents would sacrifice the same activity is wrong. Moreover, our study shows that other activities besides wage or leisure may be sacrificed and that different activities hold different values. Third, we find variance in how people’s TimeIVoT relates to their earnings, suggesting that applying one fraction of the wage rate to obtain a leisure rate (i.e. 1/3 of the wage rate based on Cesario, 1976) to all respondents, does not reflect reality. Additionally, we find that to compose an individual-specific wage-based conversion rate we would have to eliminate more than 30% of our sample or assume that their value of time is equal to 0, which does not comply with our TimeIVoT results nor with previous studies’ results (Czajkowski et al., 2019; Lloyd-Smith et al., 2019). Therefore, further research on individual-specific non-wage-based conversion rates is recommended.
To elaborate more on this, the results of the non-wage-based conversion rate TimeIVoT replicate those of previous studies in the sense of high levels of heterogeneity (Czajkowski et al., 2019; Lloyd-Smith et al., 2019). Furthermore, we also observed weak correlations between TimeIVoT and wage and profit data that are within the range of the results of Lloyd-Smith et al. (2019). Compared to Lloyd-Smith et al. (2019), who identified a value of time that averages about 90% of the wage rate, we identify values of time equal to slightly lower fractions of the wage rate, i.e. 74 and 83%. However, for the urban study site we do not detect significant correlations between data on individual-specific wages and TimeIVoT. Furthermore, we find that the values for the individual-specific wage and trade profit variables are more dispersed compared to the values of TimeIVoT. These results potentially indicate anomalies in our collected wage data or that part of the respondents answered strategically to the TimeIVoT question, potentially stimulated by our consequentiality statement and the involvement of local representatives, enumerators and a local NGO, which could have led respondents to believe that actual paid job opportunities would arise. We were not able to identify nor rule out this behavior based on our data. Therefore, we recommend future studies to include specific consequentiality statements and to work with a more advanced question format for the measurement of TimeIVoT as opposed to the open-ended format that we applied. By using an open-ended question, we likely face a lack of incentive compatibility and the measured values of time may present an under- or overestimation (Carson and Groves, 2007). An overestimation seems more likely in our case since income per capita is low in the study sites and therefore respondents may have stated larger values for TimeIVoT than that they would be minimally willing to accept as compensation for participating in the restoration work. Applying this method to value time in developing countries could therefore be improved by a different question format, i.e. double-bounded dichotomous choice, if the practical circumstances allow for reliable estimation of time values through such a format. When researchers face a similar situation to ours, i.e. a situation in which it may be complicated to apply different question formats, a simple yet potentially effective qualitative adjustment could come from the inclusion of a provision point mechanism such as described in Bush et al. (2013).
Turning to the market integration measures, the urban study site scores higher on 9 out of 10 of the measures and it therefore seems clear that the urban site is more integrated into the market. However, there is one market integration measure where the rural study site scores higher: the sale of natural resources. Since selling self-produced resources serves as one of the few income opportunities in this area it makes sense that the rural study site scores relatively higher on this measure. As discussed, there is not a uniform way of measuring market integration in the literature. However, most of the relevant literature on WTP disparities from time and money payments focuses on labor and credit market integration as the type of market integration that could reduce these disparities (Casiwan-Launio et al., 2011; Tilahun et al., 2015; Gibson et al., 2016). Therefore, we argue that measures 1 to 6 and 9 and 10 in Table 8 are more suitable for measuring market integration for this specific purpose. Measure 7 and 8, which are arguably more related to the level of subsistence of the household, might be better suited for measuring market integration in more remote areas such as studies conducted regarding Amazon tribes’ market integration.
The combination of the results on differences in market integration across both study sites, and those on differences in the size of the WTP disparities across both sites, provides qualitative evidence on the negative effect of market integration on WTP disparities from time and money payments. This result resonates with previous findings presented in O’Garra (2009) and Hagedoorn et al. (2020) and confirms the theoretical argumentation as laid out in Gibson et al. (2016). We provide a qualitative conclusion on this matter since different respondents answered to different payment types, so we were not able to analyze these effects on an individual level. Moreover, we argue that a household’s level of market integration is determined by a combination of the ten market integration measures, which are difficult to combine in one composite variable that could thereafter be added to the RPL models. Therefore, we suggest future studies to further investigate the range of WTP disparities from experiments with time and money payments across settings with varying levels of market integration.
An aspect that has received less attention in our study is the identified heterogeneity in WTP based on time and money payments. We detect heterogeneity in our RPL models, which may arise due to a number of underlying cognitive processes and may have affected our comparison of WTP disparities across study sites. For instance, urban or rural respondents may benefit more from the different ecosystem services and may therefore have stated different WTP, thereby affecting the WTP disparities. Differences in benefits can be related to a respondents’ distance from the ecosystems but also to a respondents’ occupation, for instance. In both sites, households live close to the coastline (median = 200–400 m in the urban study site and median = 400–600 m in the rural study site) and visit the beaches frequently (median = once a week in both study sites), meaning that the benefits of erosion prevention are likely to be perceived similar across the study sites, although there may still be differences within the study sites. For the fishing attribute, we find that a similar fraction of the respondents is fisher (47% in the urban study site and 56% in the rural study site) as well as fish monger (25% in the urban study site and 29% in the rural study site). For the visitors attribute, where most benefits are likely to end up with the traders, we also identify similar fractions across the study sites (47% in the urban study site and 45% in the rural study site). This means that the effect of heterogeneity on our across study sites comparison is likely to be limited, but within the study sites some respondents may have higher preferences for the fishing attribute whereas others may prefer the visitors attribute. Additionally, heterogeneity in the expected productivity and effectiveness of the contributions may also affect WTP, as do general attitudes towards contributing and more specifically via time or money, and trust in the managers of the contributions. The latter was partly covered by selecting a payment context that receives most trust of the study population as based on the pre-test survey. However, we recommend future studies to investigate the underlying causes of heterogeneity and the effects of this heterogeneity on differences in WTP from time and money payments.
Conclusion
In this study we find substantially larger WTP estimates when a time payment vehicle is used compared to when a money payment vehicle is used, thereby answering Research question 1. Furthermore, we answer Research question 2 by showing that the underlying implicit assumptions related to wage-based conversion rates do not hold in the investigated context through a comparison of these conversion rates to a non-wage-based conversion rate. Overall, the identified large WTP disparities from time and money payments likely reflect the problem that financially constrained households cannot freely express their values when monetary payments are required. Simultaneously, it shows that NBS provide highly valued benefits to substantial parts of the population.
Our answer to Research question 3 is that market integration levels are higher in an urban setting than in a rural setting since the urban study site scores higher on all but one market integration measure. This result adds to the identification of larger WTP disparities in the rural study site compared to the urban study site, which allows us to conclude that larger (smaller) WTP disparities correspond to lower (higher) market integration levels, thereby answering Research question 4. However, even though WTP disparities are smaller in the urban study site, we still find significantly higher WTP estimates for the time payment vehicle in this site.
Based on our results we provide two recommendations to those that work on valuing NBS in developing countries. First, we recommend to consider implementing SP studies with time payment vehicles. The two alternative approaches for valuing NBS in developing countries (i.e. SP studies with money payments and the avoided damage cost approach), pose a higher risk of underestimating the values of NBS and may therefore hamper investments in NBS. While considering implementing an SP study with time payments, we recommend to investigate market integration levels during the testing phase of such a valuation study to guide this decision. When low market integration levels are observed, a time payment vehicle is arguably more suitable, and when high levels of market integration are observed, one may want to question the use of a time payment vehicle. Yet, since we still find large WTP disparities in the urban area where market integration levels are higher, we cannot provide an indication of a standard range regarding the level of market integration for which a time payment vehicle would not be suitable anymore. Second, we suggest to convert the estimated time values to money values through a combination of wage-based and non-wage-based conversion approaches and use both results in cost-benefit analyses as a means of sensitivity and uncertainty analysis. On the one hand, we find evidence that the assumptions made in generic wage-based conversion rates do not hold in reality. On the other hand, we also acknowledge that improvements would have to be made to our non-wage-based conversion approach to solve potential issues related to incentive compatibility and strategic bias. These adjustments in the approach to value the benefits of NBS can lead to more accurate welfare estimates of NBS projects, trigger investments and thereby reduce the finance gap that exists for NBS, and contribute to a more sustainable and climate-resilient future.
We also provide recommendations for future lines of research based on the results of this study. First, we recommend to further explore individual-specific non-wage-based conversion rates. We encourage more comparisons of similar and different types of conversion rates as used in this study. This could include similar individual-specific non-wage-based conversion rates or approaches that are based on more advanced question formats, but also individual-specific wage-based conversion rates if the sample characteristics in terms of monetary income sources allows for this. Second, we also encourage studies to further investigate the relation between market integration and WTP disparities. For this purpose, it would be useful to replicate this study in areas with high levels of market integration and measure both WTP disparities and market integration as a kind of benchmark. Subsequently, further replications of our approach in areas with different levels of market integration can contribute to studying the relationship between the level of market integration and the disparities in WTP from time and money experiments. Alternatively, studies may want to pose separate SP questions with time and money payments to one respondent and use this information to analyze the relation between market integration levels and WTP disparities from time and money payments on the individual level. Third, we see potential for further research lines in terms of drivers of WTP disparities in the direction of experience with different payments for different goods, protest behavior related factors such as trust, differences in hypothetical bias across both types of payment, and heterogeneity in benefits received from NBS benefits. Ultimately these endeavors can contribute to discovering the values of natural resources to people in different contexts and different market integration settings.
Data Availability Statement
The raw data supporting the conclusions of this article is available upon reasonable request from the corresponding author.
Ethics Statement
Ethical review and approval was not required for the study on human participants in accordance with the local legislation and institutional requirements. The patients/participants provided their written informed consent to participate in this study.
Author Contributions
LH, MK and PvB contributed to the conception and design of the study. LH, MK and PvB were responsible for the methodology. LH was responsible for the data collection and analysis. MK and PvB supervised these processes. LH wrote the first draft of the manuscript. LH, MK and PvB contributed to manuscript revision, read, and approved the submitted version.
Funding
We are grateful for funding from IUCN-NL and NWO-WOTRO through the Urbanising Deltas of the World programme, project number W07.69.206. We are also grateful for the funds received for the open access publication fee from the Institute for Environmental Studies (IVM) at the Vrije Universiteit Amsterdam.
Conflict of Interest
The authors declare that the research was conducted in the absence of any commercial or financial relationships that could be construed as a potential conflict of interest.
Acknowledgments
We also thank our project partners, The Development Institute (Ken Kinney, Senyo Adzah and Tracy Commodore) and University of Ghana (Prof. Kwasi Appeaning Addo, Prof. Barnabas Amisigo and Edem Mahu), for the fruitful collaboration and support in the field. A special thanks to Researchlime (Barnabas Apom) and the 24 enumerators for the hard work and participation in the data collection activities.
Supplementary Material
The Supplementary Material for this article can be found online at: https://www.frontiersin.org/articles/10.3389/fenvs.2021.686077/full#supplementary-material
Footnotes
1We refer to Time-To-Money Conversion for more detail on the underlying implicit assumptions related to current practices on the time-to-money conversion.
2https://insyt.esoko.com/en/home.
31 USD = 0.77 GBP = 5.42 Ghana Cedis (GHC) during the time of the study.
4Results of the analyses with a norma distribution are availabe on request from the authors.
5List (2003) finds comparable results in that increased market experience substantially reduces disparities between WTP and WTA value estimates.
References
Abramson, A., Becker, N., Garb, Y., and Lazarovitch, N. (2011). Willingness to Pay, Borrow, and Work for Rural Water Service Improvements in Developing Countries. Water Resour. Res. 47 (11), W11512. doi:10.1029/2010wr010147
Alam, K. (2006). Valuing the Environment in Developing Countries: Problems and Potentials. Asia Pac. J. Environ. Develop. 13 (1), 27–44. doi:10.22004/ag.econ.137741
Alemu, G. T., Tsunekawa, A., Haregeweyn, N., Nigussie, Z., Tsubo, M., Elias, A., et al. (2021). Smallholder Farmers’ Willingness to Pay for Sustainable Land Management Practices in the Upper Blue Nile basin, Ethiopia. Environ. Develop. Sustainability 23 (4), 5640–5665. doi:10.1007/s10668-020-00835-6
Alfredo, K. A., and O’Garra, T. (2020). Preferences for Water Treatment Provision in Rural India: Comparing Communal, Pay-Per-Use, and Labour-For-Water Schemes. Water Int. 45 (2), 91–111. doi:10.1080/02508060.2020.1720137
Álvarez-Farizo, B., Hanley, N., and Barberán, R. (2001). The Value of Leisure Time: a Contingent Rating Approach. J. Environ. Plann. Manage. 44 (5), 681–699. doi:10.1080/09640560120079975
Atta-Mills, J., Alder, J., and Rashid, S. U. (2004). The Decline of a Regional Fishing Nation: the Case of Ghana and West Africa. Nat. Resour. Forum 38 (1), 13–21. doi:10.1111/j.0165-0203.2004.00068.x
Boateng, I. (2012). An Application of GIS and Coastal Geomorphology for Large Scale Assessment of Coastal Erosion and Management: a Case Study of Ghana. J. Coast Conserv 16 (3), 383–397. doi:10.1007/s11852-012-0209-0
Bockarjova, M., and Botzen, W. J. W. (2017). Review of Economic Valuation of Nature-Based Solutions in Urban Areas. Technical Report, Naturvation Project.
Boughton, D., Mather, D., Barrett, C. B., Benfica, R. S., Abdula, D., Tschirley, D., et al. (2007). Market Participation by Rural Households in a Low-Income Country: An Asset Based Approach Applied to Mozambique. Faith Econ. 50, 64–101.
Brouwer, R. (2008). The Potential Role of Stated Preference Methods in the Water Framework Directive to Assess Disproportionate Costs. J. Environ. Plann. Manage. 51 (5), 597–614. doi:10.1080/09640560802207860
Bush, G., Hanley, N., Moro, M., and Rondeau, D. (2013). Measuring the Local Costs of Conservation: a Provision point Mechanism for Eliciting Willingness to Accept Compensation. Land Econ. 89 (3), 490–513. doi:10.3368/le.89.3.490
Carson, R. T., and Czajkowski, M. (2019). A New Baseline Model for Estimating Willingness to Pay from Discrete Choice Models. J. Environ. Econ. Manage. 95, 57–61. doi:10.1016/j.jeem.2019.03.003
Carson, R. T., and Groves, T. (2007). Incentive and Informational Properties of Preference Questions. Environ. Resource Econ. 37 (1), 181–210. doi:10.1007/s10640-007-9124-5
Casiwan-Launio, C., Shinbo, T., and Morooka, Y. (2011). Island Villagers' Willingness to Work or Pay for Sustainability of a Marine Fishery Reserve: Case of San Miguel Island, Philippines. Coastal Manage. 39 (5), 459–477. doi:10.1080/08920753.2011.582573
Cesario, F. J. (1976). Value of Time in Recreation Benefit Studies. Land Econ. 52 (1), 32–41. doi:10.2307/3144984
Czajkowski, M., and Budziński, W. (2019). Simulation Error in Maximum Likelihood Estimation of Discrete Choice Models. J. Choice Model. 31, 73–85. doi:10.1016/j.jocm.2019.04.003
Czajkowski, M., Giergiczny, M., Kronenberg, J., and Englin, J. (2019). The Individual Travel Cost Method with Consumer-Specific Values of Travel Time Savings. Environ. Res. Econ. 74 (3), 961–984. doi:10.1007/s10640-019-00355-6
Deltares Aqua Monitor (2019). Deltares Aqua Monitor. Available at: http://aquamonitor.deltares.nl (Accessed March 01, 2020).
Deutz, A., Heal, G. M., Niu, R., Swanson, E., Townshend, T., Zhu, L., et al. (2020). Financing Nature: Closing the Global Biodiversity Financing gap Chicago: The Paulson Institute, The Nature Conservancy, and the Cornell Atkinson Center for Sustainability.
E. Cohen-Shacham, G. Walters, C. Janzen, and S. Maginnis (Editors) (2016). Nature-based Solutions to Address Global Societal Challenges (Gland, Switzerland: IUCN).
Endalew, B., Wondimagegnhu, B. A., and Tassie, K. (2020). Willingness to Pay for Church forest Conservation: a Case Study in Northwestern Ethiopia. J. For. Sci. 66 (3), 105–116. doi:10.17221/154/2019-jfs
Eom, Y.-S., and Larson, D. M. (2006). Valuing Housework Time from Willingness to Spend Time and Money for Environmental Quality Improvements. Rev. Econ. Household 4 (3), 205–227. doi:10.1007/s11150-006-0008-1
Feather, P., and Shaw, W. D. (1999). Estimating the Cost of Leisure Time for Recreation Demand Models. J. Environ. Econ. Manage. 38 (1), 49–65. doi:10.1006/jeem.1999.1076
Ferrario, F., Beck, M. W., Storlazzi, C. D., Micheli, F., Shepard, C. C., and Airoldi, L. (2014). The Effectiveness of Coral Reefs for Coastal hazard Risk Reduction and Adaptation. Nat. Commun. 5 (1), 3794–3799. doi:10.1038/ncomms4794
Fezzi, C., Bateman, I. J., and Ferrini, S. (2014). Using Revealed Preferences to Estimate the Value of Travel Time to Recreation Sites. J. Environ. Econ. Manage. 67 (1), 58–70. doi:10.1016/j.jeem.2013.10.003
Gibson, J. M., Rigby, D., Polya, D. A., and Russell, N. (2016). Discrete Choice Experiments in Developing Countries: Willingness to Pay versus Willingness to Work. Environ. Res. Econ. 65 (4), 697–721. doi:10.1007/s10640-015-9919-8
Girma, H., Hugé, J., Gebrehiwot, M., and Van Passel, S. (2020). Farmers’ Willingness to Contribute to the Restoration of an Ethiopian Rift Valley lake: a Contingent Valuation Study. Environ. Develop. Sustai. 23, 10646–10665. doi:10.1007/s10668-020-01076-3
Godoy, R. (2001). Indians, Markets, and Rainforests: Theory, Methods, and Analysis. New York: Columbia University Press.
Godoy, R., O'neill, K., Groff, S., Kostishack, P., Cubas, A., Demmer, J., et al. (1997). Household Determinants of Deforestation by Amerindians in Honduras. World Develop. 25 (6), 977–987. doi:10.1016/s0305-750x(97)00007-7
Godoy, R., Reyes-García, V., Huanca, T., Leonard, W. R., Vadez, V., Valdés-Galicia, C., et al. (2005). Why Do Subsistence-Level People Join the Market Economy? Testing Hypotheses of Push and Pull Determinants in Bolivian Amazonia. J. Anthropol. Res. 61 (2), 157–178. doi:10.3998/jar.0521004.0061.202
Godoy, R., Undurraga, E. A., Wilkie, D., Reyes-García, V., Huanca, T., Leonard, W. R., et al. (2010). The Effect of Wealth and Real Income on Wildlife Consumption Among Native Amazonians in Bolivia: Estimates of Annual Trends with Longitudinal Household Data (2002-2006). Anim. Conservation 13 (3), 265–274. doi:10.1111/j.1469-1795.2009.00330.x
Gomez, M. L. A., Adelegan, O. J., Ntajal, J., and Trawally, D. (2020). Vulnerability to Coastal Erosion in the Gambia: Empirical Experience from Gunjur. Int. J. Disaster Risk Reduction 45, 101439. doi:10.1016/j.ijdrr.2019.101439
Hagedoorn, L. C., Koetse, M. J., van Beukering, P. J. H., and Brander, L. M. (2020). Time Equals Money? Valuing Ecosystem-Based Adaptation in a Developing Country Context. Envir. Dev. Econ. 25 (5), 482–508. doi:10.1017/s1355770x20000108
Hanley, N., Wright, R. E., and Adamowicz, V. (1998). Using Choice Experiments to Value the Environment. Environ. Res. Econ. 11 (3), 413–428. doi:10.1023/a:1008287310583
Henrich, J., Ensminger, J., McElreath, R., Barr, A., Barrett, C., Bolyanatz, A., et al. (2010). Markets, Religion, Community Size, and the Evolution of Fairness and Punishment. Science 327 (5972), 1480–1484. doi:10.1126/science.1182238
Hinkel, J., Brown, S., Exner, L., Nicholls, R. J., Vafeidis, A. T., and Kebede, A. S. (2012). Sea-level Rise Impacts on Africa and the Effects of Mitigation and Adaptation: an Application of DIVA. Reg. Environ. Change 12 (1), 207–224. doi:10.1007/s10113-011-0249-2
Hossen, M. A., Chowdhury, M., Hans, A., Tagoe, C. A., Allan, A., Nelson, W., et al. (2019). Governance Challenges in Addressing Climatic Concerns in Coastal Asia and Africa. Sustainability 11 (7), 2148. doi:10.3390/su11072148
IMDC (2017). D7a: Cost Benefit Analysis of the Selected DRM and ACC Options for the Pilot Site in Ghana (No. I/RA/12148/17.115/ABO/), Cost of Coastal Environmental Degradation, Multi Hazard Risk Assessment and Cost Benefit Analysis Antwerp: World Bank.
ISD (2018). Fish Stocks in Ghana’s marine Waters Face Imminent Threat of Depletion. Available at http://www.ghana.gov.gh/index.php/media-center/news/4812-fish-stocks-inghana-s-marine-waters-face-imminent-threat-of-depletion-usaid-ghana-sfmp (Accessed March 01, 2020).
J. Ensminger, and J. Henrich (Editors) (2014). Experimenting with Social Norms: Fairness and Punishment in Cross-Cultural Perspective (New York: Russel Sage Foundation).
Jara-Díaz, S. R., Munizaga, M. A., Greeven, P., Guerra, R., and Axhausen, K. (2008). Estimating the Value of Leisure from a Time Allocation Model. Transport. Res. B: Methodol. 42 (10), 946–957. doi:10.1016/j.trb.2008.03.001
Johnston, R. J., Boyle, K. J., Adamowicz, W., Bennett, J., Brouwer, R., Cameron, T. A., et al. (2017). Contemporary Guidance for Stated Preference Studies. J. Assoc. Environ. Res. Eco. 4 (2), 319–405. doi:10.1086/691697
Jongman, B., Winsemius, H. C., Aerts, J. C., de Perez, E. C., van Aalst, M. K., Kron, W., et al. (2015). Declining Vulnerability to River Floods and the Global Benefits of Adaptation. Proc. Natl. Acad. Sci. 112 (18), E2271–E2280. doi:10.1073/pnas.1414439112
Khanal, U., Wilson, C., Lee, B. L., Hoang, V. N., and Managi, S. (2019). Influence of Payment Modes on Farmers’ Contribution to Climate Change Adaptation: Understanding Differences Using a Choice experiment in Nepal. Sustain. Sci. 14 (4), 1027–1040. doi:10.1007/s11625-018-0601-2
Krinsky, I., and Robb, A. L. (1986). On Approximating the Statistical Properties of Elasticities. Rev. Econ. Stat., 715–719. doi:10.2307/1924536
Laïbi, R., Anthony, E. J., Almar, R., Castelle, B., Senechal, N., and Kestenare, E. (2014). Longshore Drift Cell Development on the Human-Impacted Bight of Benin Sand Barrier Coast, West Africa. J. Coastal Res. Spec. Issue. 70, 78–83. doi:10.2112/si70-014.1
Lancaster, K. J. (1966). A New Approach to Consumer Theory. J. Polit. Economy 74 (2), 132–157. doi:10.1086/259131
Larson, D. M., Shaikh, S. L., and Layton, D. (2004). Revealing Preferences for Leisure Time from Stated Preference Data. Am. J. Agric. Econ. 86 (2), 307–320. doi:10.1111/j.0092-5853.2004.00580.x
List, J. A. (2003). Does Market Experience Eliminate Market Anomalies? Q. J. Econ. 118 (1), 41–71. doi:10.1162/00335530360535144
Lloyd-Smith, P., Abbott, J. K., Adamowicz, W., and Willard, D. (2019). Decoupling the Value of Leisure Time from Labor Market Returns in Travel Cost Models. J. Assoc. Environ. Res. Eco. 6 (2), 215–242. doi:10.1086/701760
Ly, C. K. (1980). The Role of the Akosombo Dam on the Volta River in Causing Coastal Erosion in central and Eastern Ghana (West Africa). Mar. Geol. 37 (3-4), 323–332. doi:10.1016/0025-3227(80)90108-5
McFadden, D. (1974). “Conditional Logit Analysis of Qualitative Choice Behavior,” in Frontiers of Econometrics. Editor P. Zarembka (New York: Academic Press).
Meginnis, K., Hanley, N., Mujumbusi, L., and Lamberton, P. H. (2020). Non-monetary Numeraires: Varying the Payment Vehicle in a Choice experiment for Health Interventions in Uganda. Ecol. Econ. 170, 106569. doi:10.1016/j.ecolecon.2019.106569
Meyerhoff, J., and Liebe, U. (2010). Determinants of Protest Responses in Environmental Valuation: A Meta-Study. Ecol. Econ. 70 (2), 366–374. doi:10.1016/j.ecolecon.2010.09.008
Meyerhoff, J., Mørkbak, M. R., and Olsen, S. B. (2014). A Meta-Study Investigating the Sources of Protest Behaviour in Stated Preference Surveys. Environ. Res. Econ. 58 (1), 35–57. doi:10.1007/s10640-013-9688-1
Morrison, M. D., Blamey, R. K., and Bennett, J. W. (2000). Minimising Payment Vehicle Bias in Contingent Valuation Studies. Environ. Res. Econ. 16 (4), 407–422. doi:10.1023/a:1008368611972
Narayan, S., Beck, M. W., Reguero, B. G., Losada, I. J., Van Wesenbeeck, B., Pontee, N., et al. (2016). The Effectiveness, Costs and Coastal protection Benefits of Natural and Nature-Based Defences. PloS One 11 (5), e0154735. doi:10.1371/journal.pone.0154735
Navrud, S., and Vondolia, G. K. (2020). Farmers´ Preferences for Reductions in Flood Risk under Monetary and Non-monetary Payment Modes. Water Resour. Econ. 30, 100151. doi:10.1016/j.wre.2019.100151
O’Garra, T. (2009). Bequest Values for marine Resources: How Important for Indigenous Communities in Less-Developed Economies? Environ. Res. Econ. 44 (2), 179. doi:10.1007/s10640-009-9279-3
Owuor, M. A., Mulwa, R., Otieno, P., Icely, J., and Newton, A. (2019). Valuing Mangrove Biodiversity and Ecosystem Services: A Deliberative Choice experiment in Mida Creek, Kenya. Ecosystem Serv. 40, 101040. doi:10.1016/j.ecoser.2019.101040
Palmquist, R. B., Phaneuf, D. J., and Smith, V. K. (2010). Short Run Constraints and the Increasing Marginal Value of Time in Recreation. Environ. Res. Econ. 46 (1), 19–41. doi:10.1007/s10640-009-9331-3
Pondorfer, A., and Rehdanz, K. (2018). Eliciting Preferences for Public Goods in Nonmonetized Communities: Accounting for Preference Uncertainty. Land Econ. 94 (1), 73–86. doi:10.3368/le.94.1.73
Rai, R. K., Bhatta, L. D., Dahal, B., Rai, B. S., and Wahid, S. M. (2019). Determining Community Preferences to Manage Conflicts in Small Hydropower Projects in Nepal. Sustain. Water Resour. Manage. 5 (3), 1103–1114. doi:10.1007/s40899-018-0285-x
Rai, R. K., and Scarborough, H. (2013). Economic Value of Mitigation of Plant Invaders in a Subsistence Economy: Incorporating Labour as a Mode of Payment. Environ. Develop. Econ. 18 (2), 225–244. doi:10.1017/s1355770x1200037x
Rai, R. K., Shyamsundar, P., Nepal, M., and Bhatta, L. D. (2015). Differences in Demand for Watershed Services: Understanding Preferences through a Choice experiment in the Koshi Basin of Nepal. Ecol. Econ. 119, 274–283. doi:10.1016/j.ecolecon.2015.09.013
Reguero, B. G., Beck, M. W., Bresch, D. N., Calil, J., and Meliane, I. (2018). Comparing the Cost Effectiveness of Nature-Based and Coastal Adaptation: A Case Study from the Gulf Coast of the United States. PLoS One 13 (4), e0192132. doi:10.1371/journal.pone.0192132
IPCC (2014). “Climate Change 2014: Synthesis Report,”in Contribution of Working Groups I, II and III to the Fifth Assessment Report of the Intergovernmental Panel on Climate Change. Editors R. K. Pachauri, and L. A. Meyer (Geneva, Switzerland: IPCC), 151.
Roest, L. W. M. (2018). The Coastal System of the Volta delta, Ghana: Strategies and Opportunities for Development. TU Delft Delta Infrastructures and Mobility Initiative (DIMI)Available at: https://repository.tudelft.nl/islandora/object/uuid%3A6d859f80-e434-407e-b0bc-41f574ff8b6f?collection=research (Accessed 1 7, 2020).
Siziba, S., and Bulte, E. (2012). Does Market Participation Promote Generalized Trust? Experimental Evidence from Southern Africa. Econ. Lett. 117 (1), 156–160. doi:10.1016/j.econlet.2012.05.003
The Development Institute (2016). Assessment of the Ecosystem Services and Change Drivers in the Keta Lagoon Complex Ramsar Site of GhanaConducted as Part of the Project ‘A Global Alliance for Green and Gender (GAGGA) Programma’. Obtained through Personal Communication with Dabala: The Development Institute. on March 1st 2018.
Tilahun, M., Birner, R., and Ilukor, J. (2017). Household-level Preferences for Mitigation of Prosopis Juliflora Invasion in the Afar Region of Ethiopia: a Contingent Valuation. J. Environ. Plann. Manag. 60 (2), 282–308. doi:10.1080/09640568.2016.1152955
Tilahun, M., Vranken, L., Muys, B., Deckers, J., Gebregziabher, K., Gebrehiwot, K., et al. (2015). Rural Households' Demand for Frankincense forest Conservation in Tigray, Ethiopia: a Contingent Valuation Analysis. Land Degrad. Develop. 26 (7), 642–653. doi:10.1002/ldr.2207
Van Oijstaeijen, W., Van Passel, S., Cools, J., de Bisthoven, L. J., Hugé, J., and Berihun, D.(2020). Farmers’ Preferences towards Water Hyacinth Control: A Contingent Valuation Study. J. Great Lakes Res. 46 (5), 1459–1468. doi:10.1016/j.jglr.2020.06.009
Vasco, C., and Sirén, A. (2016). Correlates of Wildlife Hunting in Indigenous Communities in the Pastaza Province, Ecuadorian Amazonia. Anim. Conservation 19 (5), 422–429. doi:10.1111/acv.12259
Vasco, C., Tamayo, G., and Griess, V. (2017). The Drivers of Market Integration Among Indigenous Peoples: Evidence from the Ecuadorian Amazon. Soc. Nat. Resour. 30 (10), 1212–1228. doi:10.1080/08941920.2017.1331487
Vondolia, G. K., Eggert, H., Navrud, S., and Stage, J. (2014). What Do Respondents Bring into Contingent Valuation? A Comparison of Monetary and Labour Payment Vehicles. J. Environ. Econ. Pol. 3 (3), 253–267. doi:10.1080/21606544.2014.892034
Vossler, C. A., Doyon, M., and Rondeau, D. (2012). Truth in Consequentiality: Theory and Field Evidence on Discrete Choice Experiments. Am. Econ. J. Microeconomics 4 (4), 145–171. doi:10.1257/mic.4.4.145
WWF International (2020). Nature-based Solutions for Climate Change. Available from: https://wwfint.awsassets.panda.org/downloads/wwf_nature_based_solutions_for_climate_change___july_2020_final.pdf (Accessed March 01, 2020).
Keywords: discrete choice experiment, economic valuation, nature-based solutions (nbs), time payment vehicle, market integration, ecosystem services, non-market valuation, stated preferences
Citation: Hagedoorn LC, Koetse MJ and van Beukering PJH (2021) Estimating Benefits of Nature-based Solutions: Diverging Values From Choice Experiments With Time or Money Payments. Front. Environ. Sci. 9:686077. doi: 10.3389/fenvs.2021.686077
Received: 29 March 2021; Accepted: 05 July 2021;
Published: 22 July 2021.
Edited by:
Boris van Zanten, World Bank Group, United StatesReviewed by:
Jens Rommel, Swedish University of Agricultural Sciences, SwedenDaniel Balsalobre-Lorente, University of Castilla-La Mancha, Spain
Copyright © 2021 Hagedoorn, Koetse and van Beukering. This is an open-access article distributed under the terms of the Creative Commons Attribution License (CC BY). The use, distribution or reproduction in other forums is permitted, provided the original author(s) and the copyright owner(s) are credited and that the original publication in this journal is cited, in accordance with accepted academic practice. No use, distribution or reproduction is permitted which does not comply with these terms.
*Correspondence: Liselotte C. Hagedoorn, liselotte.hagedoorn@vu.nl