An Evaluation of Strong-Motion Parameters at the S-net Ocean-Bottom Seismograph Sites Near the Kanto Basin for Earthquake Early Warning
 Yadab P. Dhakal*
  Takashi Kunugi
- National Research Institute for Earth Science and Disaster Resilience, Tsukuba, Japan
We analyzed strong-motion records at the ground and borehole in and around the Kanto Basin and the seafloor in the Japan Trench area from three nearby offshore earthquakes of similar magnitudes (Mw 5.8–5.9). The seafloor strong-motion records were obtained from S-net, which was established to enhance tsunami and earthquake early warnings after the 2011 great Tohoku-oki earthquake disaster. The borehole records were obtained from MeSO-net, a dense network of seismometers installed at a depth of 20 m in the Tokyo metropolitan area. The ground records were obtained from the K-NET and KiK-net networks, established after the 1995 great Hanshin-Awaji earthquake disaster. The MeSO-net and S-net stations record the shakings continuously, while the K-NET and KiK-net records are based on triggering thresholds. It is crucial to evaluate the properties of strong motions recorded by the S-net for earthquake early warning (EEW). This paper compared the peak ground accelerations (PGAs) and peak ground velocities (PGVs) between the S-net and K-NET/KiK-net stations. Because the MeSO-net records were from the borehole, we compared the PGAs and significant durations of the low-frequency motions (0.1–0.5 Hz) between the S-net and MeSO-net stations from identical record lengths. We found that the horizontal PGAs and PGVs at the S-net sites were similar to or larger than the K-NET/KiK-net sites for the S wave. In contrast, the vertical PGAs and PGVs at the S-net sites were similar to or smaller than those at the K-NET/KiK-net sites for the S wave. Particularly, the PGAs and PGVs for the P-wave parts on the vertical-component records of S-net were, on average, much smaller than those of K-NET/KiK-net records. The difference was more evident in the PGAs. The average ratios of S-wave horizontal to vertical PGAs were about 2.5 and 5 for the land and S-net sites, respectively. The low-frequency PGAs at the S-net sites were similar to or larger than those of the MeSO-net borehole records. The significant durations between the two-networks low-frequency records were generally comparable. Quantification of the results from a larger dataset may contribute to ground-motion prediction for EEW and the design of the offshore facilities.
Introduction
A large-scale seafloor observation network for earthquake and tsunami, known as S-net, consisting of 150 observatories, has been established in the Japan Trench area after the 2011 Tohoku-oki earthquake disaster and has been operated by National Research Institute for Earth Science and Disaster Resilience (NIED) since 2016 (NIED 2019a; Aoi et al., 2020). This is an in-line-type cabled network, with seismometers housed in cylindrical pressure vessels, most of which, including the cables, were buried to a depth of about 1 m in the shallow water regions (water depth <1,500 m). In the deeper water regions, the cylindrical vessels were freely sited on the seafloors. The interstation distance is about 30 and 50 km in perpendicular and parallel to the trench axis, respectively. The network records and transmits waveform data to the data center of NIED continuously. It is expected that the S-net data contribute to earthquake and tsunami early warning. A detailed description of the S-net can be found in Aoi et al. (2020). To improve earthquake early warning (EEW) for offshore earthquakes, it is important to understand the characteristics of strong motions in the offshore area. It is also crucial to examine the properties of the recorded motions at the ocean-bottom sites for various seismological and engineering applications by comparing with the data recorded by seismometers installed firmly on the ground or borehole because the waveforms at the ocean-bottom sites are likely to be contaminated by various factors such as tilting of the sensors due to strong motions and poor coupling between the sensor houses and the seabed sediments (e.g., Nakamura and Hayashimoto 2019; Takagi et al., 2019).
There is a paucity of literature regarding the strong-motion observation in the offshore areas. The study by Boore and Smith (1999) showed that the offshore motions are low in vertical accelerations at short periods, and shear-wave velocities beneath a site are more important than the water layer in determining the property of ground motions at lower frequencies. Hu et al. (2020) also reported that the spectral accelerations of vertical component records were slightly smaller than those of the records on land at short periods, while the long-period ground motions were noticeably larger at the offshore sites. Previous studies (e.g., Nakamura et al., 2015; Noguchi et al., 2016; Todoriki et al., 2017; Kubo et al., 2019) had commonly shown that the amplitudes of long-period (> 2 s) ground motions were substantially larger at the ocean bottom sites than the land sites. One of the reasons for the large long-period ground motions was attributed to the thick unconsolidated sediments in the offshore region. Dhakal et al. (2021) compared horizontal peak ground accelerations (PGAs), peak ground velocities (PGVs), and acceleration response spectra at selected periods between the land and S-net sites for nine selected earthquakes. They reported that the ground motions at periods longer than about 0.5 s were more prominent at the S-net sites. Dhakal et al. (2021) also showed the example accelerograms recorded at the land and S-net sites and noted that the vertical component PGAs at the S-net sites were almost half the values at the land sites at similar distances. However, they focused on the horizontal components of motions and discussed little the vertical component of motions.
In this study, the peak amplitude and duration features of S-net records are evaluated with reference to the records from the other three networks, namely, K-NET, KiK-net, and MeSO-net for both horizontal and vertical components of motions. The K-NET and KiK-net are countrywide networks with an average spacing of about 20 km established after the 1995 great Hanshin-Awaji earthquake disaster (e.g., Okada et al., 2004; NIED 2019b; Aoi et al., 2020). The MeSO-net, abbreviated for the Metropolitan Seismic Observation network, is a dense network of about 300 seismometers installed at the borehole depth of 20 m in the Tokyo Metropolitan area (e.g., Sakai and Hirata 2009; NIED 2019c). The average interstation distance of MeSO-net is about 3 km. One of the primary objectives of the MeSO-net was to contribute to a better understanding of seismic hazards in the Tokyo metropolitan area, such as by detailed imaging of the possible large-scale faults beneath the urban areas. The MeSO-net stations record the waveform data continuously. This means that the long-duration records can be obtained from the S-net and MeSO-net. However, it isn’t easy to compare the high-frequency ground motions recorded at the MeSO-net sites with those at the S-net sites because the MeSO-net seismometers are installed at the borehole, as mentioned above. On the other hand, the K-NET seismometers are installed at the ground surface, while the KiK-net consists of a pair of seismometers installed at the ground surface and the borehole. The K-NET and KiK-net stations get triggered after some threshold ground accelerations, and the records get terminated when the threshold motions are not exceeded for a certain duration. As a result, the record lengths are not uniform from the K-NET and KiK-net. Therefore, the S-net records may be compared with the K-NET and KiK-net surface records for the high-frequency motions while taking advantage of the MeSO-net records for the long-period ground motions, which persist for longer durations in the sedimentary basin areas.
In the paper, a general comparison of the peak ground accelerations (PGAs) and peak ground velocities (PGVs) for the P-wave and S-wave parts is made between the S-net ocean-bottom and K-NET/KiK-net sites from three earthquakes of Mw 5.8–5.9, which occurred nearby the Kanto Basin. Similarly, the PGAs and significant durations of relatively low-frequency motions (0.1–0.5 Hz) at the S-net sites are compared with those from the MeSO-net sites from long-duration records. One of the primary objectives of this paper is to understand the peak amplitude and duration features of the S-net strong-motion recordings for the development of ground-motion prediction models for EEW. In the current system of EEW by the Japan Meteorological Agency (JMA), vertical component displacement amplitude has been employed to reduce the effect of site amplification and rotational motions on the recorded motions at the S-net sites, while three-component records have been used for the station on land (e.g., Hayashimoto et al., 2019; JMA 2019). The present study may be considered a foundational work for future more detailed analyses for quantifying the variation of P- and S-wave amplitudes at different frequencies in the offshore stations for possible application to EEW. Furthermore, the study of low-frequency peak motions and ground-motion durations may help to understand the effect of deeper suboceanic and water layers on the recorded motions. Many ocean-bottom seismograph networks of different scales are in operation for EEW and many other geophysical studies in the world (e.g., Romanowicz et al., 2009; Hsiao et al., 2014; Barnes et al., 2015). Thus, the results presented in this paper also contribute to the engineering and seismological community literature for a comparative study about offshore strong motions around the globe. First, we explain the earthquake data and their processing in the next section. Then, we present and discuss the results.
Data and Processing
In this article, the expressions such as the ocean-bottom (OB) stations or ocean-bottom seismographs (OBS) refer to the S-net stations unless explicitly mentioned. We selected records on the land and OB stations from three earthquakes of Mw values equal to 5.8 (one event) and 5.9 (two events). The source parameters of the earthquakes are given in Table 1. The epicenters of the earthquakes are shown in Figure 1. The order of earthquakes in Table 1 follows the occurrence date of the earthquakes. The first earthquake occurred on July 7, 2018, which had Mw value of 5.9. The second earthquake occurred on January 3, 2020, which had Mw value of 5.8. The third earthquake occurred on June 25, 2020, which had Mw value of 5.9. The Mw values were taken from the F-net moment-tensor catalog by NIED. Hereafter, the above-mentioned earthquakes are called the 2018, 2020a, and 2020b events, respectively, in the paper. The JMA magnitudes of the earthquakes were 6.0, 5.8, and 6.1, respectively. Similarly, the JMA focal depths of the events were 56, 34, and 36 km, respectively. The 2018, 2020a, and 2020b events are classified as intraslab, interplate, and crustal earthquake types based on focal depths estimated by JMA and focal mechanisms and depths estimated by F-net (NIED) moment-tensor solution.
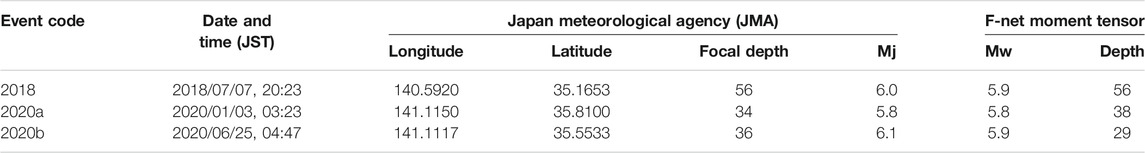
TABLE 1. Source parameters of earthquakes used in the study.
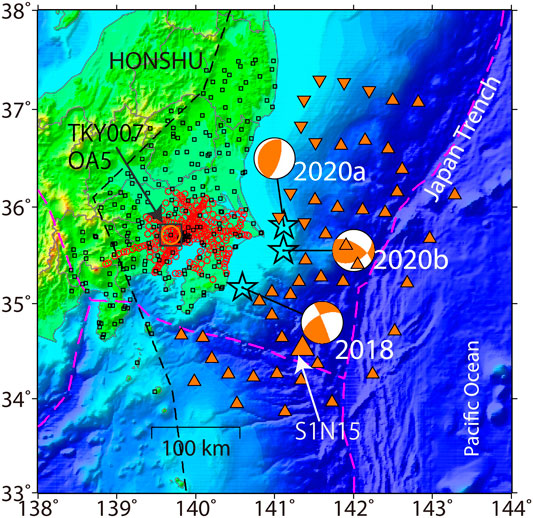
FIGURE 1. Index map showing location of strong-motion stations and epicenters of earthquakes used in this study. The triangles denote the S-net ocean-bottom stations (inverted triangles denote the buried stations). The squares and circles denote the K-NET/KiK-net and MeSO-net stations, respectively. The stars denote epicenters of the earthquakes. The focal mechanism plots of the earthquakes are connected to the corresponding epicenters by straight lines and are annotated by event codes (see Table 1 for the event information). The large square, circle, and triangle, pointed by arrows, denote the locations of the sites, namely TKY007 (K-NET), OA5 (MeSO-net), and S1N15 (S-net), respectively; example waveforms are shown in the later figures recorded at the sites. The dashed black line denotes the volcanic front, and the purple lines tectonic boundaries.
We retrieved 10 min of continuous acceleration waveform data at S-net and MeSO-net stations, beginning from one minute before the earthquake origin time. We could not control the record length of the K-NET/KiK-net because the recording system was based on a “trigger algorithm” as mentioned previously. The MeSO-net and K-NET/KiK-net sensors were aligned in horizontal and vertical directions, but the azimuths of the horizontal sensors were not aligned in the north-south and east-west directions for the MeSO-net. We used the azimuths of the MeSO-net sensors from Kano et al. (2015) to compare the MeSO-net records with other networks. On the other hand, the three-component sensors at the S-net stations were not necessarily aligned in the horizontal and vertical directions. Therefore, the original S-net records were rotated to obtain the horizontal and vertical component motions by applying the matrix operations given in Takagi et al. (2019). The azimuths of the cable axes, also determined by Takagi et al. (2019), were employed to rotate the seismograms in the preferred directions for comparison with other network recordings.
Example records and their Fourier spectra at the MeSO-net OA5 and K-NET TKY007 sites for the 2018 event are shown in Figure 2 (see Figure 1 for the location of the sites and epicenter of the event). These sites are in the Shinjuku area of Tokyo, in the neighborhood of which many high-rise buildings are built. The inter-station distance between the two sites was about 350 m, and the epicentral distance to OA5 was about 102 km. The Fourier spectra plots in Figure 2 show that the Fourier amplitudes computed from equal time windows are noticeably larger at the K-NET TKY007 site than the MeSO-net OA5 site at frequencies over 2 Hz. In contrast, the Fourier amplitudes are similar at lower frequencies. In Figure 2, it can also be seen that the 0.1–0.5 Hz bandpass-filtered records are very similar between the two sites. However, the K-NET TKY007 site records were terminated before the long-period ground motions die out, as depicted on the records of the OA5 site of MeSO-net. Similarly, an example plots of accelerograms recorded at the S-net S1N15 site located at an epicentral distance of about 99 km, is shown in Figure 3 for the 2018 event. The epicentral distances to the OA5 and S1N15 sites were comparable (102 km vs. 99 km). Accelerograms are shown without filtering and with bandpass filtering (0.1–0.5 Hz) to see the high- and low-frequency waveforms. Generally, the long-period waves continue for longer durations, similar to those shown in Figure 2 for the MeSO-net site. Thus, these plots illustrated that the long-duration records are preferable to compare the long-period ground motions in the seafloor and sedimentary areas in and around the Kanto Basin. In the right panels of Figure 3, the Fourier spectral amplitudes at the S-net S1N15 site are compared with those from the MeSO-net OA5 site. The Fourier spectral amplitudes shown in Figure 2 were computed from time windows of about 130 s. On the other hand, the Fourier spectral amplitudes shown in Figure 3 were computed from time windows of 450 s after the earthquake origin time. The spectral amplitudes at the MeSO-net site are smaller than those at the S-net site at frequencies higher than about 3 Hz for the horizontal components and about 5 Hz for the vertical component. These results are nearly similar to those discussed previously between the MeSO-net and K-NET sites. At lower frequencies, the spectral amplitudes at the S-net site are approximately similar to or larger than those at the MeSO-net site.
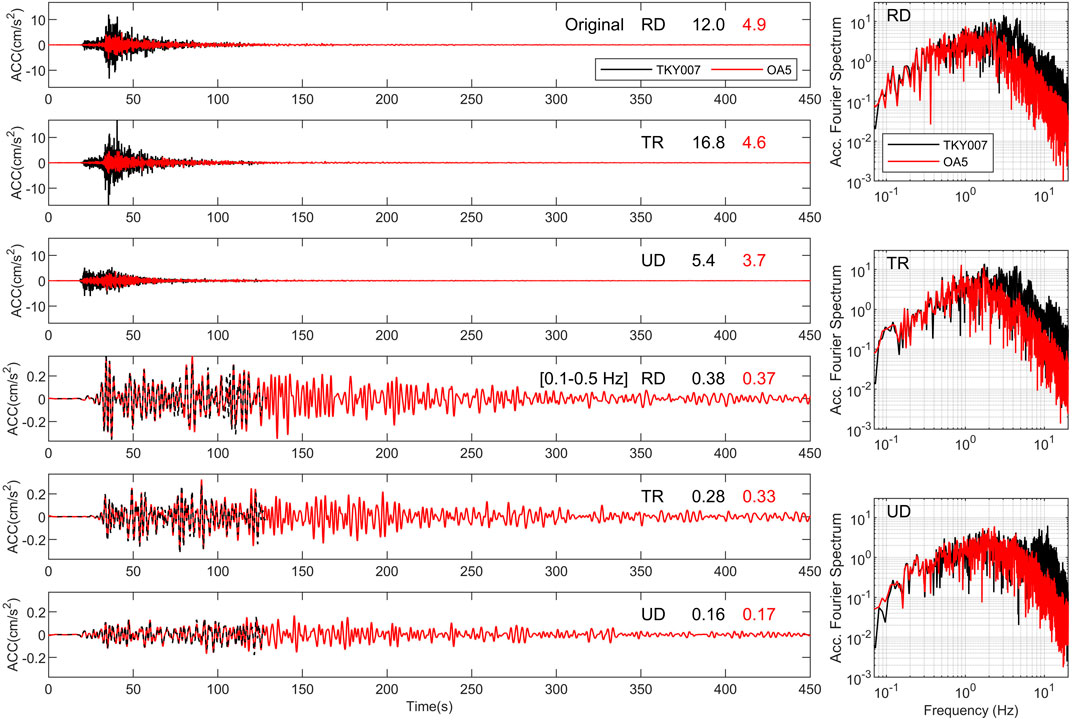
FIGURE 2. Example acceleration waveforms for the radial (RD), transverse (TR), and vertical (UD) components recorded at the K-NET TKY007 site (black) and MeSO-net OA5 site (red) during the 2018 event (see Figure 1 for the location of the sites and the event. See Table 1 for the event information). The upper-three left panels show the as-recorded accelerograms rotated to radial, transverse, and vertical components, while the lower-three left panels show the 0.1–0.5 Hz bandpass-filtered waveforms. Note that the record length for the K-NET TKY007 site is shorter than that for the MeSO-net OA5 site and is about 130 s. The peak values of the waveforms are indicated above the traces with the same color of the corresponding waveforms. The right panels show the Fourier spectra for the RD, TR, and UD components, respectively, computed for the identical record length of about 130 s.
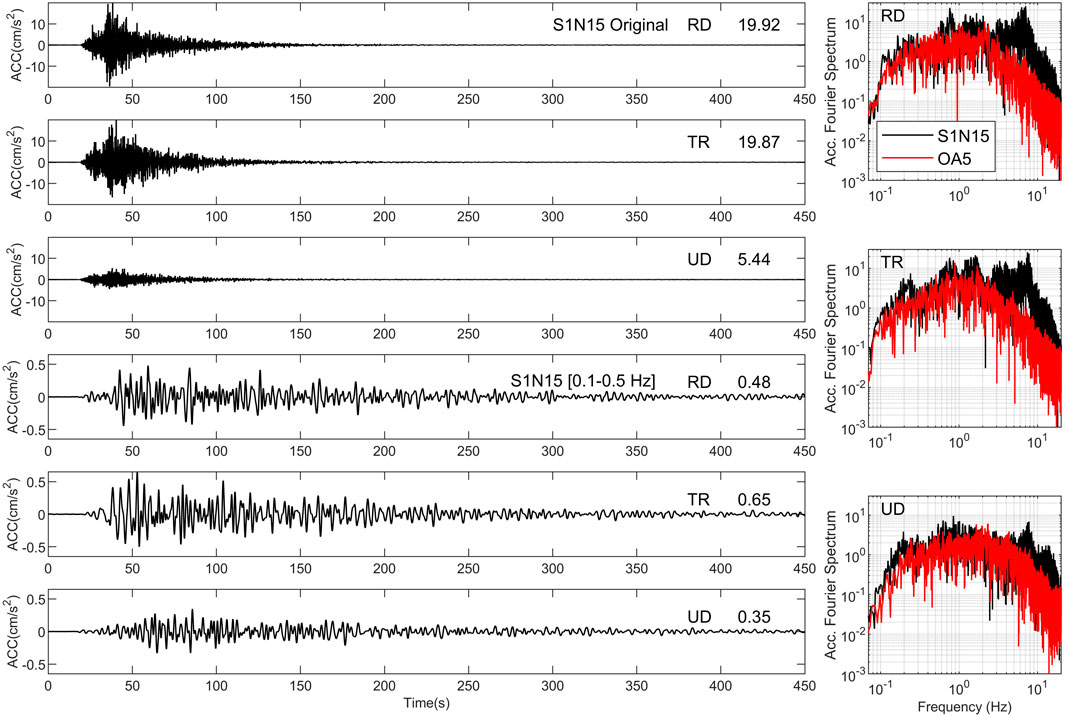
FIGURE 3. Example acceleration waveforms for the radial (RD), transverse (TR), and vertical (UD) components recorded at the S-net S1N15 site during the 2018 event (see Figure 1 for the location of the site and the event and Table 1 for the event information). The upper three left panels show the waveforms without filtering, while the lower three left panels show the 0.1–0.5 Hz bandpass-filtered waveforms. The peak accelerations of the waveforms are indicated above the corresponding traces. The right panels show a comparison of the acceleration Fourier spectra for the RD, TR, and UD components, respectively, between the S-net S1N15 and MeSO-net OA5 sites computed from the record lengths of 450 s. See Figure 2 for the records at the OA5 site.
The PGAs, PGVs, and significant durations were computed for each record after processing uniformly. In the present study, the mean of a 1 min pre-event noise window was subtracted at each time step for the S-net and MeSO-net records. For the K-NET/KiK-net records, the mean of 10 s pre-event noise window was subtracted if the noise window was available; otherwise, the mean of the whole record was subtracted. Then, fourth-order high-pass Butterworth filtering was applied to suppress low-frequency noises at 0.1 Hz to compare the peak parameters between the S-net and K-NET/KiK-net sites. The peak parameters of the long-duration records of MeSO-net and S-net were obtained for 0.1–0.5 Hz bandpass-filtered records. The PGVs were obtained from velocity seismograms obtained by integration of the filtered acceleration records. The accelerograms were not used if the records within the selected time windows were noticeably contaminated by later events; this is especially the case for the analysis of significant duration. All the acceleration records were visually examined to exclude the records with spikes, offsets, and trends before and after the filtering. The velocity seismograms were also visually examined to confirm that the integration operation did not produce any trend in the seismograms. The onsets of P- and S-waves were identified manually required for the comparison of PGAs and PGVs for the P-wave and S-wave portions of the records.
Comparison of the Peak Ground Accelerations and Peak Ground Velocities Between the S-Net and K-NET/KiK-Net Sites
Here we present the comparison of the PGAs and PGVs between the S-net and K-NET/KiK-net sites for the three events listed in Table 1. In this comparison, we used the data recorded within the 200 km of hypocentral distance. As the S-waves do not propagate through the liquid medium, the S-wave part of the seafloor records for the horizontal components may be considered to be equivalent to those recorded on the ground surface. In this paper, the S-wave part or S-wave window means the 20 s time window starting from the S-onset. Perhaps, the source duration was not so long for these Mw 5.9 earthquakes, but a wider window ensures that the uncertainty in the source duration and effects of multiple reflections by the sedimentary layers are well-considered. In this paper, the horizontal PGA means the larger one of the PGA values of the two horizontal components. The horizontal PGAs of the S-wave parts, the vertical PGAs of the S-wave parts, and the vertical PGAs of the P-wave parts are plotted as a function of hypocentral distance in Figure 4A,B,C respectively, for the 2018 event. Similarly, the PGVs for the corresponding time windows are plotted in Figure 4D,E,F respectively, for the 2018 event. The peak values for the P-wave parts, plotted in Figure 4C,F were computed from the shorter time window of 5 s as the S-P time is short near the epicenters. The values for the S-net sites are denoted by triangles, while the values for the K-NET/KiK-net sites are indicated by circles. We also show the median prediction curves for the horizontal PGAs and PGVs using the ground motion prediction equations (GMPEs) in Si and Midorikawa (1999, 2000) in Figure 4A,D. The GMPEs for the PGVs in Si and Midorikawa (1999) have been used in Japan to estimate ground motion intensities for EEW and seismic hazard analysis (e.g., Hoshiba et al., 2008; HERP (Headquarters for Earthquake Research Promotion), 2018). The values at the K-NET/KiK-Net sites are somewhat overestimated by the GMPEs, while the S-net data are explained generally well.
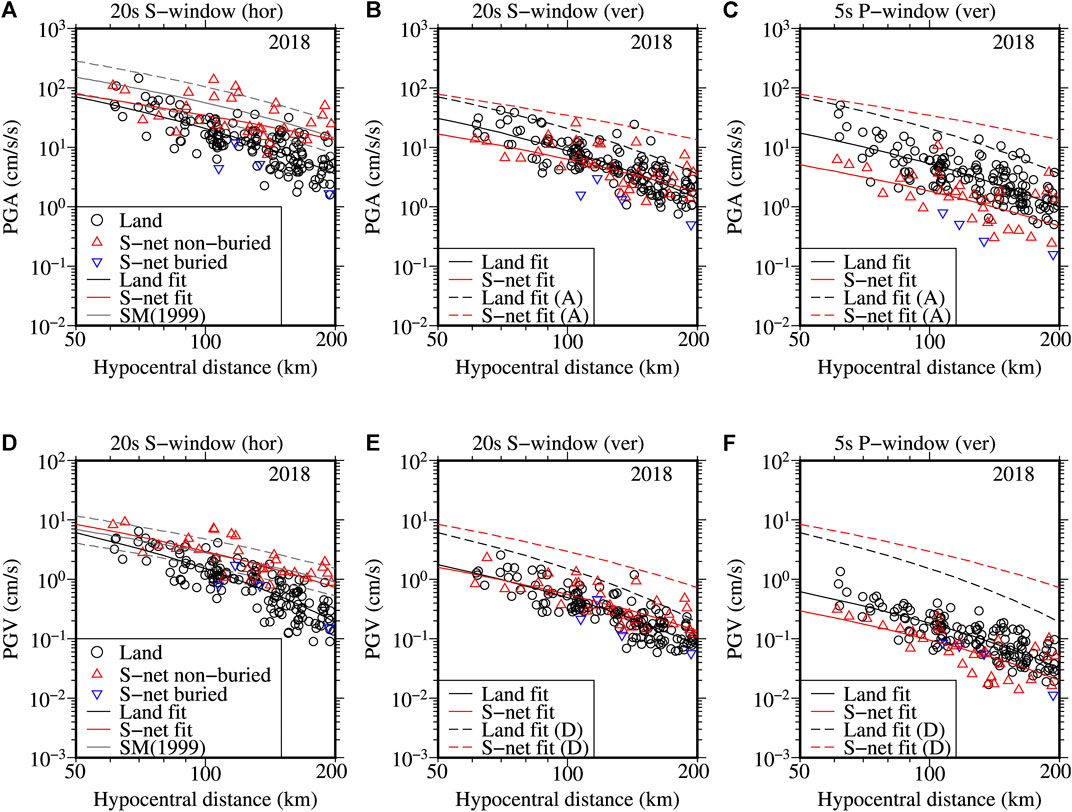
FIGURE 4. Plots of PGAs (A, B, C) and PGVs (D, E, F) as a function of hypocentral distance for the 2018 event (see Table 1 for the event information). The left and middle panels show the peak values of the 20 s time windows starting from the S-onset for the horizontal (hor) and vertical (ver) components, respectively. The right panels show the peak values of the 5 s time windows starting from the P-onset for the vertical components. The plotted values for the horizontal components are the larger ones of the peak values of the two horizontal components. The circles denote the K-NET/KiK-net stations, simply written as Land in the legends, and the triangles S-net stations of which the inverse triangles (blue colored) denote the buried S-net stations. The black and red solid lines represent the fitted lines between the observed values and hypocentral distances for the K-NET/KiK-net and S-net stations in each panel. The solid and dashed grey lines denote the median prediction curves and range of one standard deviation for soil site condition in (A) and Vs30 = 300 m/s in (D) using the GMPEs in Si and Midorikawa (1999), written as SM (1999) in the legend, for an intraslab-type earthquake. The dashed black and red lines in (B, C) and (E, F) denote the fitted black and red solid lines in (A) and (C), respectively, for comparison.
Figure 4 also includes the fitted lines between the peak values and hypocentral distances for the present dataset. If we assume that the average source effect was similar to the land and S-net sites because the land and S-net sites are almost similarly distributed in the western and eastern sides of the epicenter, the difference between the land and S-net data may be attributed to the difference in the average site and path conditions. The difference between the two fitted lines increases with the distance for the S-wave parts of the horizontal components, as shown in Figure 4A,D. The vertical component PGAs and PGVs for the S-wave parts show a relatively smaller difference between the K-NET/KiK-net and S-net sites (Figure 4B,E). In contrast, the PGAs for the P-wave parts of the vertical components are, on average, larger, at the K-NET/KiK-net sites than the S-net sites by a factor of about 2.5 (averaged over the distance) (Figure 4C). The PGVs for the P-wave parts also show similar results between the land and ocean-bottom sites, but the difference is smaller (Figure 4F). The fitted lines for the horizontal PGAs and PGVs of S-wave parts are also shown in the plots of the vertical PGAs and PGVs of S-wave parts in Figure 4B,E. The fitted lines indicate that the horizontal PGAs and PGVs on land are about 2.5 times the corresponding values for the S-wave parts on the vertical components, while the corresponding ratios are about 5 for the S-net sites. The ratios of the average peak values (fitted lines) between the 5 s P-window (vertical component) and the 20 s S-window (horizontal component) are much larger for the S-net sites, as shown in Figure 4C,F.
In the plots for the PGAs (Figure 4A–C), the values at the buried sites are generally smaller than those for the non-buried sites at equal distances. However, the difference between the buried and non-buried sites is smaller for the PGVs as shown in Figure 4D–F. This difference was not so conspicuous for the 2020a and 2020b events, but the tendency that the buried sites had smaller PGAs and PGVs was present for the S-wave parts (Figure 5A,B,D,E, and Figure 6A,B,D,E). These results are generally similar to those reported in Dhakal et al. (2021), where the residual values at short periods were biased between the buried and non-buried sites for the horizontal components. The larger PGAs at the S-net sites compared to the values at the land sites at longer distances generally commensurate with the high Q values in the oceanic plates (e.g., Umino and Hasegawa 1984). However, an objective evaluation of the difference between the S-net and land sites and within the S-net sites is not easy as the shallow site profiles such as the Vs30 values (average S-wave velocity in the top 30 m soil column) are not measured or estimated at the S-net sites.
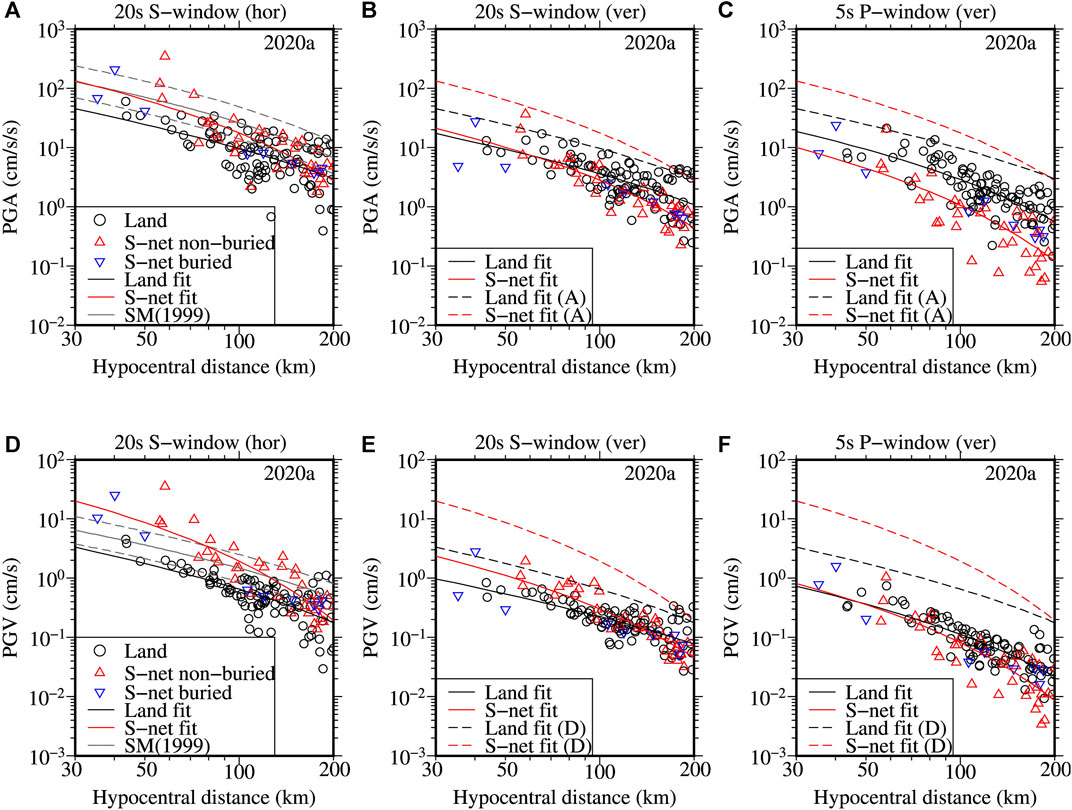
FIGURE 5. Same as Figure 4, but for the 2020a interplate event (see Table 1 of the original article for the event information). The GMPEs for an interplate-type earthquake are used in the panels (A) and (D).
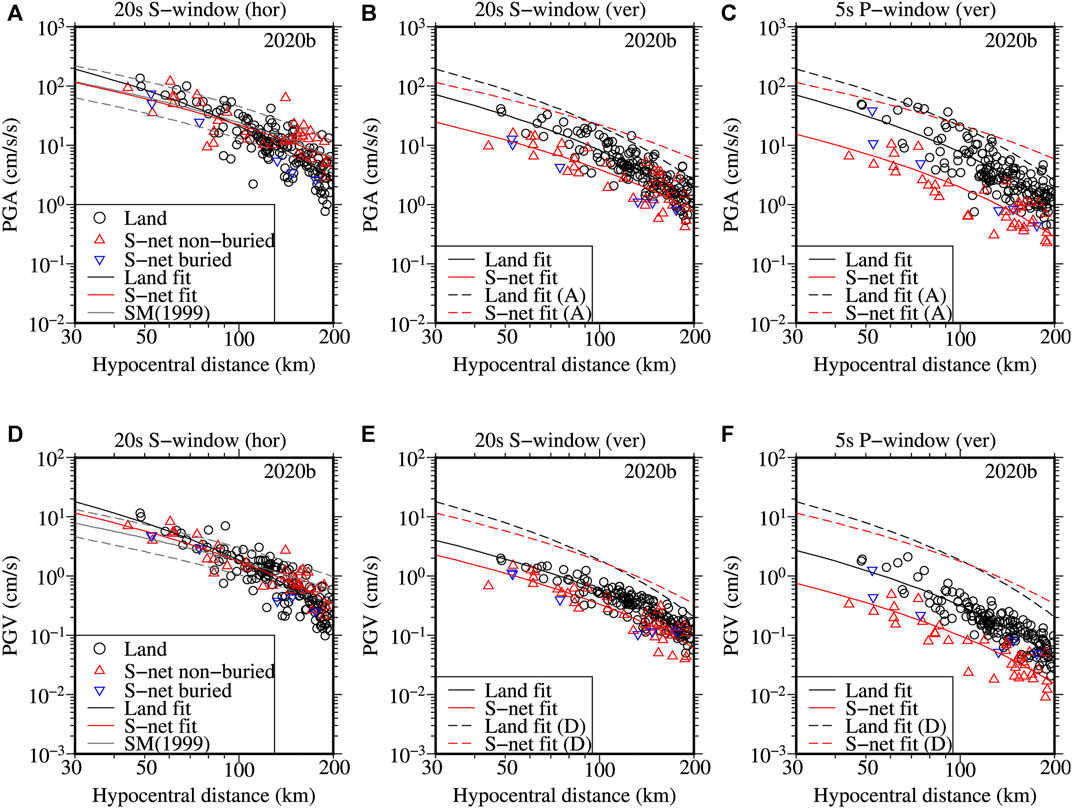
FIGURE 6. Same as Figure 4, but for the 2020b crustal event (see Table 1 of the original article for the event information). The GMPEs for a crustal-type earthquake are used in the panels (A) and (D).
The plots of the PGAs and PGVs as a function of hypocentral distance for the 2020a event are shown in Figure 5. The PGAs for the three different segments of the records (S-wave part of horizontal, S-wave part of vertical, and P-wave part of vertical records) are depicted in Figure 5A–C, respectively. Similarly, the PGVs for the corresponding segments are plotted in Figure 5D–F, respectively. Similar to the results shown in Figure 4A,D for the 2018 event, the horizontal PGAs and PGVs for the S-wave parts are generally larger at the S-net sites than the K-NET/KiK-net sites, but the fitted lines indicate that the difference decreases with the distance in contrast to that for the 2018 event. The difference between the two events may be attributed to the different ray paths; a significant fraction of the ray paths lies within the high Q slab for the 2018 intraslab event, while the ray paths are shorter in the high Q zone for the 2020 interplate event. The PGA data are generally explained well by the GMPEs in Si and Midorikawa (1999) at the S-net sites at smaller distances while the difference grows at larger distances. The GMPEs overestimate the PGAs on land. The fitted lines suggest that the average difference of the PGVs between the land and S-net sites (Figure 5D) is larger than the average difference of the PGAs between the two groups of data (Figure 5A). The difference between the two groups of data for the vertical PGAs and PGVs for the S-wave parts is smaller than those for the horizontal components. The mean ratio of the horizontal PGAs to the vertical PGAs of the S-wave parts obtained from the fitted lines is about 2.5 for the sites on land, while the ratio is about 6 for the sites at the seafloor; the corresponding ratios for the PGVs were similar to those of the PGAs. In contrast, the PGAs for the P-wave parts of the vertical components are, on average, larger, at the K-NET/KiK-net sites than the S-net sites by a factor of about 3 (Figure 5C). While the vertical PGVs for the P-wave parts are nearly similar at small distances between the land and S-net sites, the mean ratio is about 1.5 at longer distances (Figure 5F).
The plots of the PGAs and PGVs as a function of hypocentral distance for the 2020b event are shown in Figure 6. The PGAs for three different segments of the records are depicted in Figure 6A–C, respectively. Similarly, the PGVs for the corresponding segments are depicted in Figure 6D–F, respectively. For this event, the horizontal PGAs and PGVs for the S-wave parts are nearly similar. The PGAs and PGVs of the S-wave parts of the vertical components at the land sites are, on average, about 2 and 1.5 times the values at the S-net sites for the 2020b event. The ratios of the values between the horizontal and vertical component PGAs and PGVs for the S-wave parts are about 2.5 and 3 for the land sites, while the corresponding ratios are about 6 and 5 for the S-net sites. The PGAs and PGVs for the P-wave parts of the vertical components on land are about 4 and 3 times the corresponding values at the seafloor sites.
The smaller values of the PGAs and PGVs, discussed above for the P-wave and S-wave parts on the vertical component records at the S-net sites, were most probably due to the presence of the water layer above the seabed as reported in several previous studies (e.g., Crouse and Quilter 1991; Boore and Smith 1999; Hongqi et al., 2014). For example, Crouse and Quilter (1991) formulated transfer function ratios with and without water layer for vertical P-wave and showed that the vertical peak accelerations as much as 50% were reduced due to the presence of water layer at short periods. Boore and Smith, (1999) showed by theoretical calculations that the water layer had little effect on the horizontal components of motion but that it produced a strong spectral null on the vertical component at the resonant frequency of P waves in the water layer.
Our main objective in this paper is to examine the properties of the S-net ocean-bottom records in relation to the records from the Kanto Basin area from the selected earthquakes. However, it is of interest to compare the peak values for the land-only or offshore-only sites between the used events as the magnitudes of the events were similar. A comparison of the horizontal and vertical component PGAs and PGVs between the three events for the same group of stations are provided in a supplementary file. It was found that the PGAs and PGVs from the S-wave parts between the 2018 and 2020b events were, on average, similar at equal distances for the land sites; both events had Mw value of 5.9. The 2020a event had smaller PGAs and PGVs compared to those for the 2018 and 2020b events. The 2020a event had a smaller magnitude by 0.1 unit than the other events. The 2020a event was an interplate event, which may have lower source spectral values than the other events (e.g., Allmann and Shearer 2009). The difference in source amplitude spectra may have also resulted in the smaller PGAs and PGVs for the 2020a event. The comparison for the S-net sites showed that the peak values for the 2018 event (having greater focal depth) were, on average, larger, than those for the other two events. However, the PGAs and PGVs for the P-wave parts were not the largest in amplitude for the 2018 event at the both land and S-net sites. Further analysis is necessary to understand the reason for these differences.
Comparison of the Low-Frequency Motions Between the S-Net and MeSO-Net Sites
By comparing the bandpass-filtered waveforms at the nearby K-NET/KiK-net and MeSO-net sites discussed in the data section, we found that the MeSO-net records and K-NET/KiK-net records were similar at frequencies lower than about 0.5 Hz. This means that the top 20 m soil column has little effect on the ground motions lower than 0.5 Hz. This enables us to compare the peak values and other properties of the S-net longer duration records with the MeSO-net borehole records of identical time lengths at lower frequencies. In this section, we compare the PGAs and significant durations between the S-net ocean-bottom records and MeSO-net borehole records, which were bandpass-filtered between 0.1 and 0.5 Hz. The significant duration for each component was determined as the time interval between the 5 and 95% of the Husid plot (Husid 1969) for Arias intensity (Arias 1970). The Arias intensity is defined in Equation 1.
where a(t) is the acceleration time history, tr is the total duration of the time history, and g is an acceleration due to gravity. Interested readers can find a comprehensive review and discussion of the duration of strong motions in Bommer and Martínez-Pereira (1999) and the references therein. One of the objectives of comparing the significant durations between the two sets of data (land vs. seafloor) is to qualitatively grasp the influence of site conditions at the S-net sites because the local geological profiles at the offshore sites are either poorly resolved or unknown. In the present paper, the Husid plot is constructed for the time window of 450 s after the onset of P wave. An example Husid plots for the 0.1–0.5 Hz bandpass-filtered accelerograms recorded at the MeSO-net OA5 site for the 2018 event is shown in Figure 7. The significant durations for the radial, transverse, and vertical component records at the OA5 site are approximately 242, 261, and 279 s, respectively. The records at the TKY007 site (the nearest K-NET site from the MeSO-net OA5 site, see Figure 1 for the site locations and Figure 2 for the waveform comparisons between the TKY007 and OA5 sites) account for only about 60% of the significant duration of the records at the MeSO-net OA5 site due to the limited record length at the K-NET station.
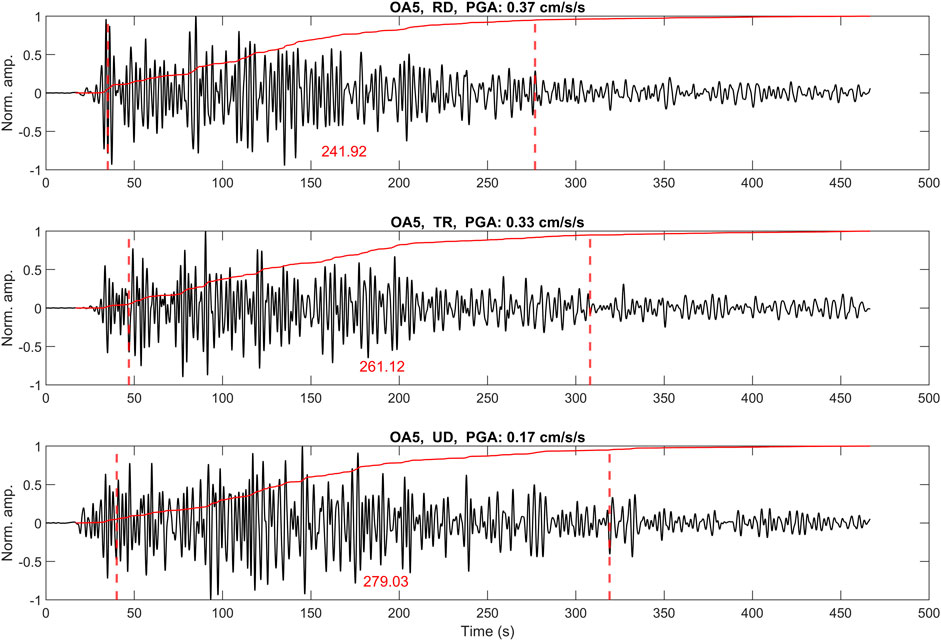
FIGURE 7. Example Husid plots (red curves) for significant durations. The dashed vertical lines indicate 5 and 95% of the Husid plots in each panel, and the time lengths between the vertical lines give the values of significant durations as defined in the paper. The traces denote the 0.1–0.5 Hz bandpass-filtered waveforms recorded at the MeSO-net OA5 station during the 2018, Mw 5.9 event (see Figure 1 for the location of event-site pair and Figure 2 for the unfiltered waveforms). Note that the vertical scale gives the normalized amplitudes of the waveforms and Husid plots by the corresponding maximum values in each panel.
The PGAs and significant durations between the S-net and MeSO-net sites are shown in Figures 8–10 for the 2018, 2020a, and 2020b, respectively. As the deep sediments significantly influence the low-frequency motions, the values plotted in the figures are colored by the corresponding depths to the layer having Vs value of 1.4 km/s (hereafter abbreviated as D14). The D14 values were taken from the subsurface velocity model available at Japan Seismic Hazard Information Station (J-SHIS) (Fujiwara et al., 2012). The D14 was the suitable parameter to reduce the errors of the GMPEs for long periods (1–10 s) in Morikawa and Fujiwara (2013) and Dhakal et al. (2015). The D14 values are distributed over a relatively narrow depth range for the S-net sites compared to those for the MeSO-net sites. Figures 8–10 demonstrate that the PGAs and significant durations were noticeably smaller at sites having D14 values smaller than about 100 m at the MeSO-net sites. The PGAs obtained from the bandpass-filtered accelerograms were generally larger at the S-net sites than the MeSO-net sites at equal distances. The PGAs for both S-net and MeSO-net sites showed a general decreasing trend with distance for all the events, but it was less conspicuous for the radial and vertical components at the MeSO-net sites for the 2018 event. It may be due to the different basin effects for the 2018 event. It was also due to an apparent effect because the MeSO-net sites for the 2018 event cover a smaller distance range compared to the other events. The maximum hypocentral distance among the MeSO-net sites for the 2018 event was about 170 km, while it was about 210 km for the 2020 events. Also, the difference between the maximum and minimum hypocentral distances was smaller for the 2018 event due to the deeper focal depth compared to the 2020 events. Except for the MeSO-net sites having D14 values smaller than about 100 m, the significant durations generally rise with distance for the MeSO-net and S-net records. The difference of the significant durations between the S-net and MeSO-net sites was not so obvious at deep sedimentary sites. At smaller distances, the durations tended to be shorter at the S-net sites than the MeSO-net sites, while the durations tended to be longer at the larger distances at the S-net sites. At intermediate distances around 100 km, the durations at the MeSO-net sites appear to be longer. This latter result can be seen well for the 2020a event in Figure 9D–F.
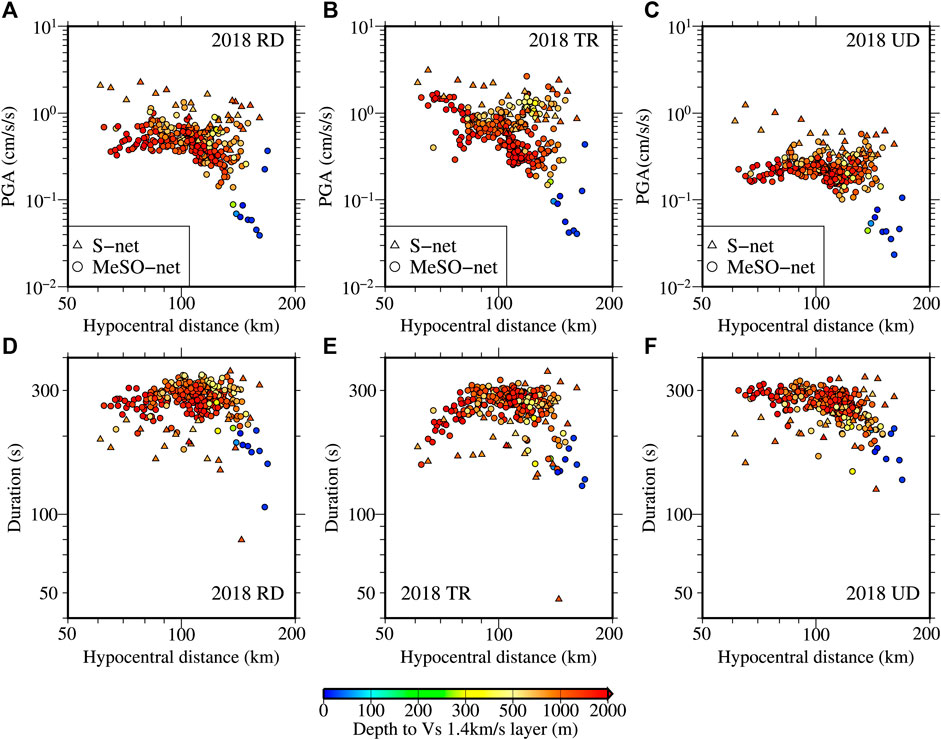
FIGURE 8. Upper three panels: comparison of the PGAs computed from the 0.1–0.5 Hz bandpass-filtered records at the S-net (triangles) and MeSO-net (circles) sites for the radial (RD) (A), transverse (TR) (B), and vertical (UD) (C) components, respectively, as a function of hypocentral distance for the 2018 event (see Table 1 for the event information). Lower three panels: comparison of the significant durations computed from the 0.1–0.5 Hz bandpass-filtered records at the S-net (triangles) and MeSO-net (circles) sites for the radial (RD) (D), transverse (TR) (E), and vertical (UD) (F) components for the same dataset used in (A), (B), and (C), respectively. The values are colored by the depth to Vs 1.4 km/s layer in all panels.
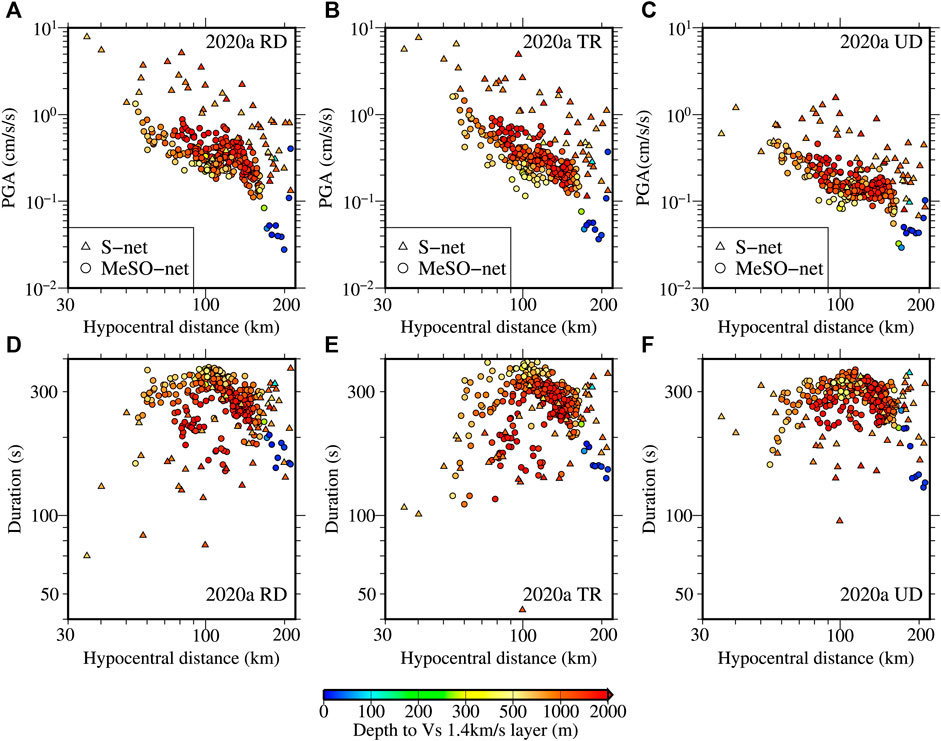
FIGURE 9. Same as Figure 8, but for the 2020a interplate event (see Table 1 for the event information).
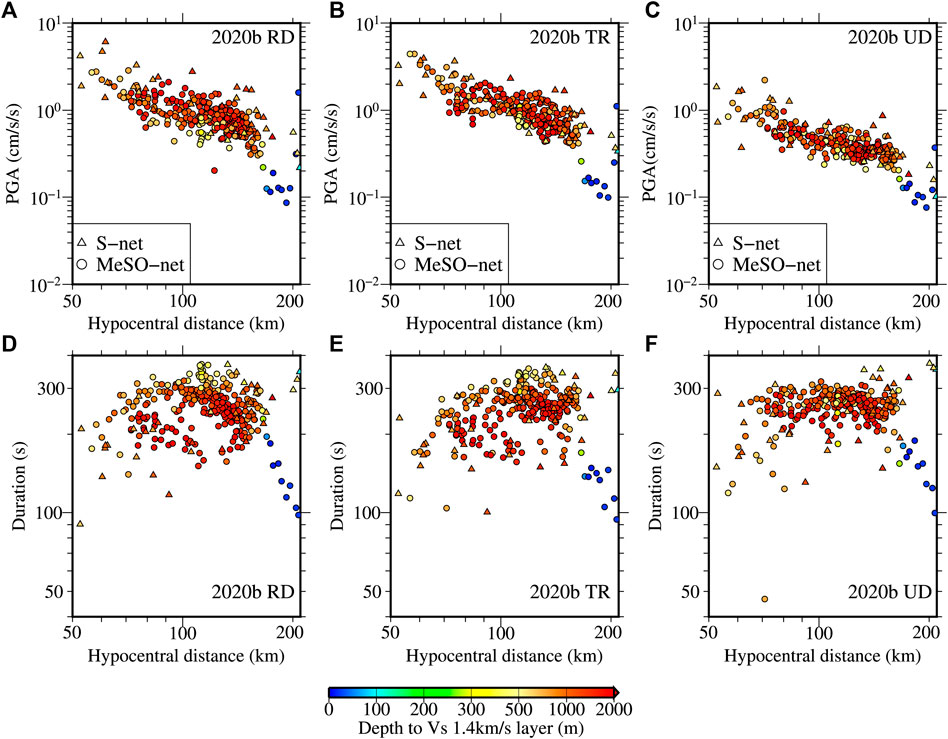
FIGURE 10. Same as Figure 8, but for the 2020b crustal event (see Table 1 for the event information).
We show a comparison of the PGAs and significant durations between the three events at the MeSO-net and S-net sites in a supplementary file. It was found that the low-frequency PGAs for the shallow event were generally larger at the MeSO-net sites in the Kanto Basin compared to the values from the deeper event (identical magnitude), while the values at the seafloor sites were generally similar between the events. These results may suggest that the focal depth is an important factor to predict ground motions in the Kanto Basin.
Finally, we compare the significant durations between the radial and transverse and radial and vertical components for the MeSO-net and S-net sites in Figure 11. We also compare the PGAs between the radial and transverse components at the MeSO-net and S-net sites in Figure 12. All these comparisons are from the 0.1–0.5 Hz bandpass-filtered accelerograms as introduced at the beginning of this section. Figure 11 shows that the significant durations between the radial and transverse components are more similar than those between the radial and vertical components at both land and ocean-bottom sites. Although it is not discernible at the MeSO-net sites, the significant durations for the vertical components are, on average, larger at the S-net sites for all the events. This latter result may suggest that the vertical component long-period (low-frequency) records are influenced by the water layer and are generally in agreement with the previous simulation studies (e.g., Todoriki et al., 2017). Todoriki et al. (2017) showed by numerical simulations that the long-period radial and vertical component records persisted for longer durations at the seafloors because of the water layer compared to the transverse components. In Figure 12, it can be seen that the PGAs of the radial and transverse components are generally similar except for the 2018 event. For the 2018 event, many sites recorded larger PGAs on the transverse components. The larger PGAs are more evident in the plots for the MeSO-net sites. The similarities of the significant durations and PGAs between the radial and transverse components at the S-net sites may suggest the presence of considerably thick sediments in the wider oceanic area because the transverse components mostly comprise the S-waves and love waves, which do not propagate through the liquid medium. The D14 values in the J-SHIS model also suggest considerably thick sedimentary layers distributed in the wider offshore area. The S-net records provide an excellent opportunity to reconstruct the velocity models of the offshore area to understand the source process of the earthquakes better (e.g., Okamoto et al., 2018; Hua et al., 2020), and we expect many results in the future.
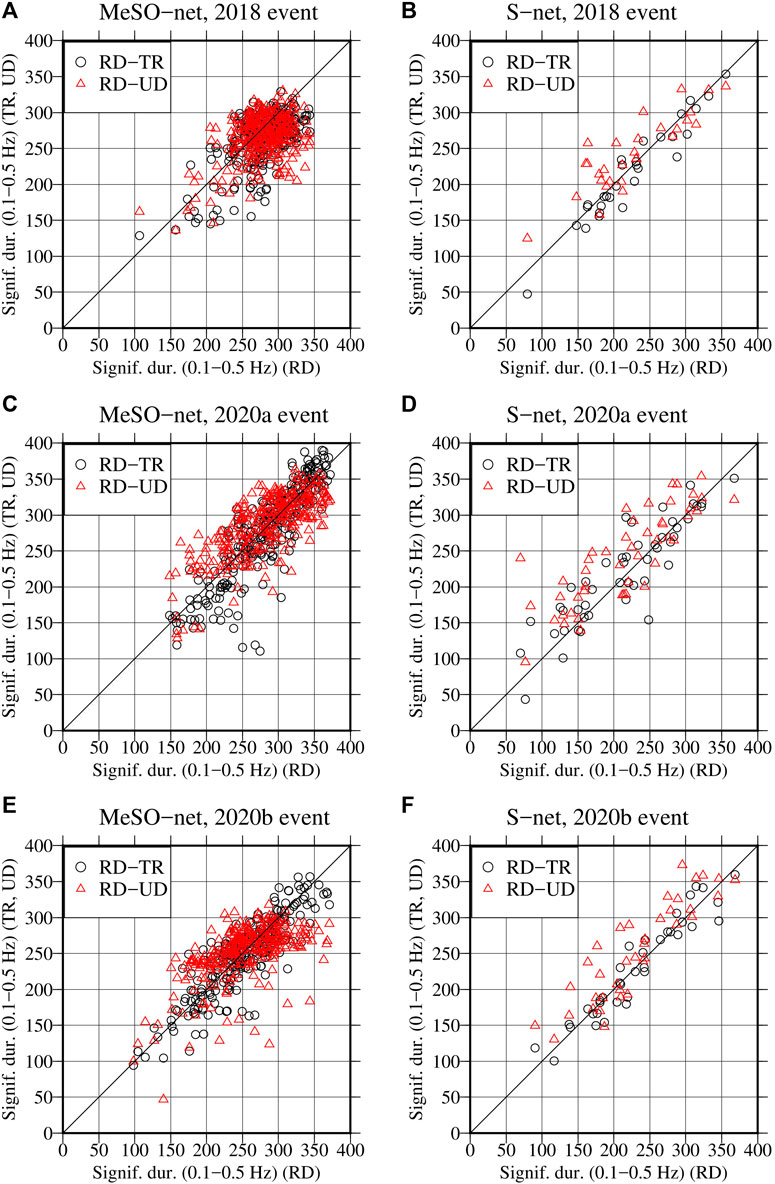
FIGURE 11. Comparison of the significant durations computed from the 0.1–0.5 Hz bandpass-filtered records for the 2018 event between the radial and transverse (RD-TR) components and radial and vertical (RD-UD) components at the MeSO-net sites (A) and S-net sites (B), respectively. The plots (C) and (D) are similar to the plots (A) and (B), respectively, but for the 2020a event. Similarly, the plots (E) and (F) are for the 2020b event. See Table 1 for the events information.
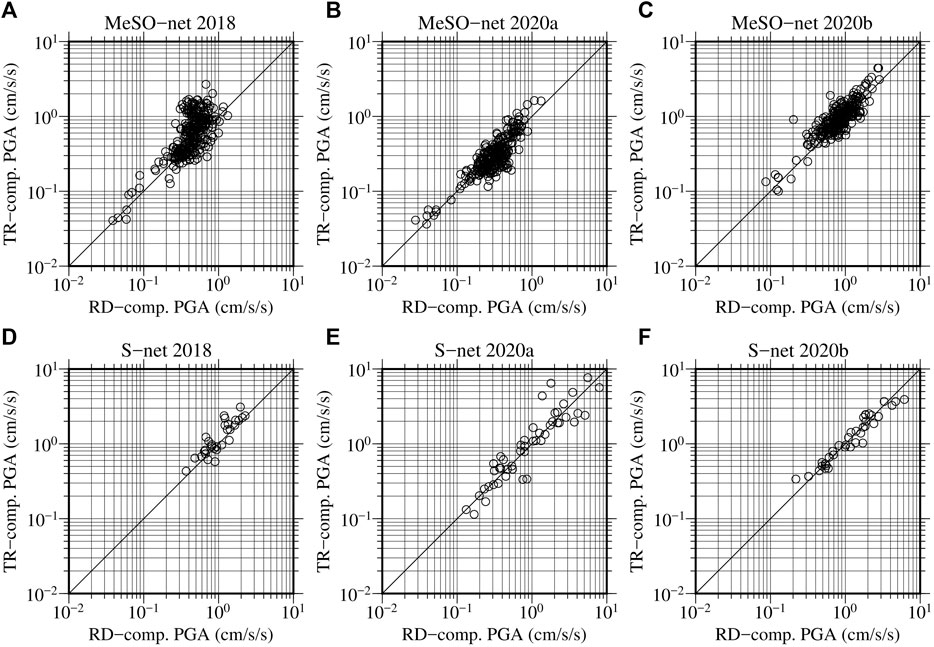
FIGURE 12. Comparison of the PGAs between the radial (RD) and transverse (TR) components of motions between 0.1 and 0.5 Hz. Panels (A), (B) and (C) show the plots for the 2018, 2020a, and 2020b events, respectively, for the MeSO-net sites. (D), (E), and (F) are similar to the panels (A), (B), and (C), but for the S-net sites. See Table 1 for the events information.
Conclusion
Strong-motion records were analyzed at the S-net ocean-bottom seismograph sites located close to the Kanto Basin and at the K-NET/KiK-net surface sites and MeSO-net borehole sites located in and around the Kanto Basin for three nearby earthquakes of comparable magnitudes (Mw 5.8–5.9) but differing in tectonic types and focal depths. The horizontal component PGAs and PGVs for the two events (intraslab and interplate events) were, on average, larger at the S-net ocean bottom sites than those at the K-NET/KiK-net land sites. The results are generally expected considering the lower Vs values for the subsea sediments and higher Q value in the Pacific Plate. In contrast, the vertical component PGAs and PGVs from P-wave portions were generally smaller at the S-net sites than those at the K-NET/KiK-net sites for all the events, even though the difference was less conspicuous for the PGVs. These results are also expected as the water layer makes the ocean bottom sites equivalent to the borehole sites on the land for the P-waves, causing a reduction of high-frequency amplitudes due to transmission and reflection of P-waves at the sediment-water interface. For S-wave parts on the vertical components, the PGAs and PGVs from the crustal event were smaller at the S-net sites than those at the K-NET/KiK-net sites, while they were either comparable or did not show the consistent difference for the other events. The PGAs computed from the 0.1–0.5 Hz bandpass-filtered records at the S-net sites were either comparable or larger than those at the MeSO-net sites. On the other hand, the significant durations computed from the 0.1–0.5 Hz bandpass-filtered records at the S-net and MeSO-net sites were generally comparable, given that the sediment thicknesses were also similar. The significant durations between the radial and transverse components were more similar than those between the radial and vertical components both at the land and ocean-bottom sites. At the S-net sites, the significant durations of the vertical component records were, on average, larger than those of the radial components, while it was not so evident for the MeSO-net sites. This latter result at the S-net sites may suggest that the water layer also contributed to the duration elongation for the vertical component records. The results presented in this paper hinted that it is important to consider the effects of the water layer on the recorded motions at the S-net sites for seismological and engineering applications such as EEW and the design of offshore facilities. We have planned to analyze a more extensive data set at the S-net sites for the source, path, and site characterization for EEW and report the detailed results in a future paper.
Data Availability Statement
The K-NET and KiK-net strong-motion records were obtained from the website http://www.kyoshin.bosai.go.jp/. The MeSO-net and S-net records were obtained from the website https://hinetwww11.bosai.go.jp/auth/download/cont/?LANG=en. The hypocenter information of the events were taken from https://www.data.jma.go.jp/svd/eqev/data/bulletin/hypo_e.html. The moment magnitude for the events were taken from http://www.fnet.bosai.go.jp/event/joho.php?LANG=en. The J-SHIS deep subsurface model was obtained from http://www.j-shis.bosai.go.jp/map/JSHIS2/download.html?lang=en. The original contributions presented in the study are included in the article/Supplementary Material, further inquiries can be directed to the corresponding author.
Author Contributions
YD designed the study, analyzed the data, and drafted the manuscript. TK provided guidance in the data processing and interpretation. Both authors approved the manuscript for publication.
Funding
This study was supported by “Advanced Earthquake and Tsunami Forecasting Technologies Project” of NIED and JSPS KAKENHI Grant Number JP20K05055.
Conflict of Interest
The authors declare that the research was conducted in the absence of any commercial or financial relationships that could be construed as a potential conflict of interest.
Acknowledgments
We would like to thank the Japan Meteorological Agency for providing us with hypocenter information for the earthquakes used in this study. We would also like to thank Wessel and Smith (1998) for providing us with Generic Mapping Tools, which were used to make some figures in the manuscript. I would like to thank the Editor Francisco Javier Nuñez-Cornu for arranging review of this manuscript and two reviewers for their constructive and helpful comments.
Supplementary Material
The Supplementary Material for this article can be found online at: https://www.frontiersin.org/articles/10.3389/feart.2021.699439/full#supplementary-material
References
Allmann, B. P., and Shearer, P. M. (2009). Global Variations of Stress Drop for Moderate to Large Earthquakes. J. Geophys. Res. 114, B01310. doi:10.1029/2008JB005821
Aoi, S., Asano, Y., Kunugi, T., Kimura, T., Uehira, K., Takahashi, N., et al. (2020). MOWLAS: NIED Observation Network for Earthquake, Tsunami and Volcano. Earth Planets Space 72, 126. doi:10.1186/s40623-020-01250-x
Arias, A. (1970). “A Measure of Earthquake Intensity,” in Seinnic Design for Nuclear Power Plants. Editor R. Hansen (Cambridge, Massachusetts: MIT Press), 438–483.
Barnes, C. R., Best, M. M. R., Johnson, F. R., and Pirenne, B. (2015). “NEPTUNE Canada: Installation and Initial Operation of the World's First Regional Cabled Ocean Observatory,” in SEAFLOOR OBSERVATORIES (Berlin, Heidelberg: Springer Praxis BooksSpringer), 415–438. doi:10.1007/978-3-642-11374-1_16
Bommer, J. J., and Martínez-pereira, A. (1999). The Effective Duration of Earthquake strong Motion. J. Earthquake Eng. 3 (2), 127–172. doi:10.1080/13632469909350343
Boore, D. M., and Smith, C. E. (1999). Analysis of Earthquake Recordings Obtained from the Seafloor Earthquake Measurement System (SEMS) Instruments Deployed off the Coast of Southern California. Bull. Seism. Soc. Am. 89 (1), 260–274. doi:10.1785/bssa0890010260
Crouse, C. B., and Quilter, J. (1991). “Seismic hazard Analysis and Development of Design Spectra for Maul A Platform,” in Proc. Pacific Conf. on Earthquake Engineering, New Zealand, 20-23 Nov, 3. 137–148.
Dhakal, Y. P., Kunugi, T., Suzuki, W., Kimura, T., Morikawa, N., and Aoi, S. (2021). Strong Motions on Land and Ocean Bottom: Comparison of Horizontal PGA, PGV, and 5% Damped Acceleration Response Spectra in Northeast Japan and the Japan Trench Area. Bull. Seism. Soc. Am. doi:10.1785/0120200368
Dhakal, Y. P., Suzuki, W., Kunugi, T., and Aoi, S. (2015). Ground Motion Prediction Equations for Absolute Velocity Response Spectra (1-10 S) in Japan for Earthquake Early Warning. J. JAEE 15, 91–96. doi:10.5610/jaee.15.6_91
Hayashimoto, N., Nakamura, T., and Hoshiba, M. (2019). A Technique for Estimating the UD-Component Displacement Magnitude for Earthquake Early Warnings that Can Be Applied to Various Seismic Networks Including Ocean Bottom Seismographs. Q. J. Seismol. 83, 1–10. (in Japanese with English abstract).
HERP (Headquarters for Earthquake Research Promotion) (2018). Report: National Seismic hazard Maps for Japan. (in Japanese). Retrieved from https://www.jishin.go.jp/main/index-e.html.(Accessed September 5, 2020)
Hongqi, D., Hu, J., and Lili, X. (2014). Effect of Seawater on Incident Plane P and SV Waves at Ocean Bottom and Engineering Characteristics of Offshore Ground Motion Records off the Coast of Southern California, USA. Earthq. Eng. Eng. Vib. 13, 181–194. doi:10.1007/s11803-014-0222-4
Hoshiba, M., Kamigaichi, O., Saito, M., Tsukada, S. y., and Hamada, N. (2008). Earthquake Early Warning Starts Nationwide in Japan. Eos Trans. AGU 89, 73–74. doi:10.1029/2008eo080001
Hsiao, N.-C., Lin, T.-W., Hsu, S.-K., Kuo, K.-W., Shin, T.-C., and Leu, P.-L. (2014). Improvement of Earthquake Locations with the Marine Cable Hosted Observatory (MACHO) Offshore NE Taiwan. Mar. Geophys. Res. 35, 327–336. doi:10.1007/s11001-013-9207-3
Hu, J., Tan, J., and Zhao, J. X. (2020). New GMPEs for the Sagami Bay Region in Japan for Moderate Magnitude Events with Emphasis on Differences on Site Amplifications at the Seafloor and Land Seismic Stations of K-NET. Bull. Seism. Soc. Am. 110, 2577–2597. doi:10.1785/0120190305
Hua, Y., Zhao, D., Toyokuni, G., and Xu, Y. (2020). Tomography of the Source Zone of the Great 2011 Tohoku Earthquake. Nat. Commun. 11, 1163. doi:10.1038/s41467-020-14745-8
Husid, L. R. (1969). 8. Santiago de Chile: Revista del IDIEM, 21–42.Caracteristicas de terremotos. Analisis general
JMA (Japan Meteorological Agency) (2019). Utilization of Seafloor Earthquake Observation Data for Earthquake Early Warning. (in Japanese). Retrieved from https://www.jma.go.jp/jma/press/1906/21a/eewkatsuyou20190621.html (Accessed 6 16, 2021).
Kano, M., Nagao, H., Sakai, S. i., Nakagawa, S., Mizusako, S., Hori, M., et al. (2015). Azimuth Verification of the MeSO-Net Seismographs. Jssj 68 (2), 31–44. (in Japanese with English abstract). doi:10.4294/zisin.68.31
Kubo, H., Nakamura, T., Suzuki, W., Dhakal, Y. P., Kimura, T., Kunugi, T., et al. (2019). Ground‐Motion Characteristics and Nonlinear Soil Response Observed by DONET1 Seafloor Observation Network during the 2016 Southeast Off‐Mie, Japan, Earthquake. Bull. Seism. Soc. Am. 109, 976–986. doi:10.1785/0120170296
Morikawa, N., Fujiwara, H., and Fujiwara, H. (2013). A New Ground Motion Prediction Equation for Japan Applicable up to M9 Mega-Earthquake. J. Disaster Res. 8, 878–888. doi:10.20965/jdr.2013.p0878
Nakamura, T., and Hayashimoto, N. (2019). Rotation Motions of Cabled Ocean-Bottom Seismic Stations during the 2011 Tohoku Earthquake and Their Effects on Magnitude Estimation for Early Warnings. Geophys. J. Int. 216, 1413–1427. doi:10.1093/gji/ggy502
Nakamura, T., Takenaka, H., Okamoto, T., Ohori, M., and Tsuboi, S. (2015). Long-period Ocean-Bottom Motions in the Source Areas of Large Subduction Earthquakes. Sci. Rep. 5, 16648. doi:10.1038/srep16648
NIED (2019a). NIED S-Net. Tsukuba, Japan: National Research Institute for Earth Science and Disaster Resilience. doi:10.17598/NIED.0007
NIED (2019b). NIED K-NET, KiK-Net. Tsukuba, Japan: National Research Institute for Earth Science and Disaster Resilience. doi:10.17598/NIED.0004
NIED (2019c). NIED MeSO-Net. Tsukuba, Japan: National Research Institute for Earth Science and Disaster Resilience. doi:10.17598/NIED.0023
Noguchi, S., Maeda, T., and Furumura, T. (2016). Ocean-influenced Rayleigh Waves from Outer-Rise Earthquakes and Their Effects on Durations of Long-Period Ground Motion. Geophys. J. Int. 205, 1099–1107. doi:10.1093/gji/ggw074
Okada, Y., Kasahara, K., Hori, S., Obara, K., Sekiguchi, S., Fujiwara, H., et al. (2004). Recent Progress of Seismic Observation Networks in Japan -Hi-Net, F-Net, K-NET and KiK-Net-. Earth Planet. Sp 56, xv–xxviii. doi:10.1186/bf03353076
Okamoto, T., Takenaka, H., and Nakamura, T. (2018). Evaluation of Accuracy of Synthetic Waveforms for Subduction-Zone Earthquakes by Using a Land-Ocean Unified 3D Structure Model. Earth Planets Space 70, 98. doi:10.1186/s40623-018-0871-z
Romanowicz, B., McGill, P., Neuhauser, D., and Dolenc, D. (2009). Acquiring Real Time Data from the Broadband Ocean Bottom Seismic Observatory at Monterey Bay (MOBB). Seismological Res. Lett. 80 (2), 197–202. doi:10.1785/gssrl.80.2.197
Sakai, S., and Hirata, N. (2009). Distribution of the Metropolitan Seismic Observation Network. Bull. Earthq. Res. Inst. Univ. Tokyo v84, 57–69. (in Japanese with English abstract).
Si, H., and Midorikawa, S. (1999). New Attenuation Relationships for Peak Ground Acceleration and Velocity Considering Effects of Fault Type and Site Condition. Nihon Kenchiku Gakkai Kozokei Ronbunshu 64, 63–70. (in Japanese with English abstract). doi:10.3130/aijs.64.63_2
Si, H., and Midorikawa, S. (2000). “New Attenuation Relations for Peak Ground Acceleration and Velocity Considering Effects of Fault Type and Site Condition,” in Proceedings of the 12th World Conference on Earthquake Engineering, Auckland, New Zealand, January 30 - February 4 2000. paper no. 0532.
Takagi, R., Uchida, N., Nakayama, T., Azuma, R., Ishigami, A., Okada, T., et al. (2019). Estimation of the Orientations of the S‐net Cabled Ocean‐Bottom Sensors. Seismol. Res. Lett. 90, 2175–2187. doi:10.1785/0220190093
Todoriki, M., Furumura, T., and Maeda, T. (2017). Effects of Sea Water on Elongated Duration of Ground Motion as Well as Variation in its Amplitude for Offshore Earthquakes. Geophys. J. Int. 208, 226–233. doi:10.1093/gji/ggw388
Umino, N., and Hasegawa, A. (1984). Three-Dimensional Qs Structure in the Northeastern Japan Arc. Jssj 37 (2), 217–228. (in Japanese with English abstract). doi:10.4294/zisin1948.37.2_217
Wessel, P., and Smith, W. H. F. (1998). New, Improved Version of Generic Mapping Tools Released. Eos Trans. AGU 79, 579. doi:10.1029/98EO00426
Fujiwara, H., Kawai, S., Aoi, S., Morikawa, N., Senna, S., Azuma, H., Ooi, M., Hao, K.X., Hasegawa, N., Maeda, T., Iwaki, A., Wakamatsu, K., Imoto, M., Okumura, T., Matsuyama, H., and Narita, A. (2012). Some improvements of seismic hazard assessment based on the 2011 Tohoku earthquake. Technical Note of the National Research Institute for Earth Science and Disaster Prevention 379, 1–349. (in Japanese)
Keywords: S-net, ocean-bottom seismograph network, Japan Trench, MeSO-net, Kanto Basin, earthquake early warning, peak ground acceleration, strong-motion duration
Citation: Dhakal YP and Kunugi T (2021) An Evaluation of Strong-Motion Parameters at the S-net Ocean-Bottom Seismograph Sites Near the Kanto Basin for Earthquake Early Warning. Front. Earth Sci. 9:699439. doi: 10.3389/feart.2021.699439
Received: 23 April 2021; Accepted: 05 July 2021;
Published: 21 July 2021.
Edited by:
Francisco Javier Nuñez-Cornu, University of Guadalajara, MexicoReviewed by:
Thorne Lay, University of California, Santa Cruz, United StatesRyota Takagi, Tohoku University, Japan
Copyright © 2021 Dhakal and Kunugi. This is an open-access article distributed under the terms of the Creative Commons Attribution License (CC BY). The use, distribution or reproduction in other forums is permitted, provided the original author(s) and the copyright owner(s) are credited and that the original publication in this journal is cited, in accordance with accepted academic practice. No use, distribution or reproduction is permitted which does not comply with these terms.
*Correspondence: Yadab P. Dhakal, ydhakal@bosai.go.jp