the Creative Commons Attribution 4.0 License.
the Creative Commons Attribution 4.0 License.
 | 02 Jul 2021
Complex rift patterns, a result of interacting crustal and mantle weaknesses, or multiphase rifting? Insights from analogue models
Pauline Chenin
Duncan Erratt
Gianreto Manatschal
Guido Schreurs
During lithospheric extension, localization of deformation often occurs along structural weaknesses inherited from previous tectonic phases. Such weaknesses may occur in both the crust and mantle, but the combined effects of these weaknesses on rift evolution remain poorly understood. Here we present a series of 3D brittle–viscous analogue models to test the interaction between differently oriented weaknesses located in the brittle upper crust and/or upper mantle. We find that crustal weaknesses usually express first at the surface, with the formation of grabens parallel to their orientation; then, structures parallel to the mantle weakness overprint them and often become dominant. Furthermore, the direction of extension exerts minimal control on rift trends when inherited weaknesses are present, which implies that present-day rift orientations are not always indicative of past extension directions. We also suggest that multiphase extension is not required to explain different structural orientations in natural rift systems. The degree of coupling between the mantle and upper crust affects the relative influence of the crustal and mantle weaknesses: low coupling enhances the influence of crustal weaknesses, whereas high coupling enhances the influence of mantle weaknesses. Such coupling may vary over time due to progressive thinning of the lower crustal layer, as well as due to variations in extension velocity. These findings provide a strong incentive to reassess the tectonic history of various natural examples.
- Article
(27920 KB) - Full-text XML
- BibTeX
- EndNote


Over the course of continental rifting, initial localization of deformation often occurs along structural weaknesses inherited from previous tectonic phases (e.g. Wilson, 1966; Morley et al., 1990; Nelson et al., 1992; Bonini et al., 1997; Corti, 2012). These initial weaknesses may be situated anywhere in the lithosphere, although structural heterogeneities tend to be attenuated or erased at great depth where the temperature is high (T>800 300 ∘C depending on the geothermal gradient, the nature of the rock involved and the extension rate; Braun et al., 1999; Yamakasi et al., 2006). On Earth, regions of stable continental lithosphere are usually dominated by two strong layers: the brittle upper crust and the brittle upper lithospheric mantle, decoupled from each other by a weaker, ductile lower crust (e.g. Brun, 1999; Burov and Watts, 2006; Burov, 2011; Zwaan et al., 2019). Inherited weaknesses situated in either of these strong layers are most likely to be reactivated and affect subsequent rift architecture (Chenin and Beaumont, 2013). As a result, initial deformation may localize independently in both competent lithospheric layers and ultimately will have to interact as the ductile lower crust progressively thins during extension (e.g. Sutra et al., 2013).
Crustal and mantle weaknesses can have very different orientations and relative weakness and may (or may not) play a role during subsequent rifting. Weaknesses in the upper lithospheric mantle range from large-scale tectonic features such as major suture zones or “mantle scars” to microscopic fabric related to preferred orientations of olivine crystals (e.g. Tommasi et al., 2009), which are found in continental lithospheres around the globe (Heron et al., 2016, 2019, and references therein). The (upper) continental crust often contains a variety of (often older) structures, such as thrusts, faulted basins shear zones and tectonic foliations, that may have no direct relation to the underlying mantle weaknesses. For instance the various structural orientations occurring in the crust of the European plate near the Alps are mostly unrelated to the Alpine suture zone (e.g. Dèzes et al., 2004; Schori et al., 2021, and references therein). Moreover, the opening of an ocean as part of a Wilson cycle does not always fully reuse the original suture zone from the preceding orogenic event but may choose to follow other lithospheric weaknesses that are more suitably oriented or deform more readily, as for instance observed in the North Atlantic realm (Wilson, 1966; Krabbendam, 2001; Chenin et al., 2019; Schiffer et al., 2020). Similarly, less suitably oriented crustal weaknesses or inherited structures that do not sufficiently weaken the crust are not always reactivated or may have only minor effects on rift development (e.g. East African Rift, North Sea of Gulf of Aden, Ring, 1994; Henza et al., 2011; Bell et al., 2014; Phillips et al., 2016; Fossen et al., 2016; Claringbould et al., 2017; Heron et al., 2019; Wang et al., 2021, and references therein).
The (partial) reactivation of structural weaknesses can lead to complex rift structures with different structural orientations, but as pointed out by Reeve et al. (2015), these complex rifts can easily be misinterpreted as the result of changing extension directions over time (i.e. multiphase rifting). Extension is generally considered to be (sub-)perpendicular to the strike of normal faults; hence multiple structural orientations within a rift basin may indicate a change in extension direction over time, as for instance proposed for the North Sea Rift, the Main Ethiopian Rift and Turkana Depression in the East African Rift, and the Labrador Sea (e.g. Bonini et al., 1997; Erratt et al., 1999, 2010; Heron et al., 2019; Wang et al., 2021). Yet it has also been shown that this assumption is often not fully valid due to the influence of structural inheritance, oblique extension and associated regional stress field distributions (e.g. Withjack and Jamison, 1986; Henza et al., 2011; Morley, 2010; Reeve et al., 2015, and references therein). Hence it may be challenging to interpret the tectonic history of a rift basin and to distinguish the role of structural weaknesses during its development.
Tectonic modelling provides an excellent tool to test how differently oriented weaknesses in the crust and mantle interact and subsequently affect rift systems, yet this topic has received only limited attention so far. Some numerical modellers have studied the effects of weaknesses in both the crust and mantle in 2D, showing that the presence, shape and location of lithospheric weaknesses may strongly affect the general style of rifting or allow rifting to take place altogether (Dyksterhuis et al., 2007; Chenin and Beaumont, 2013; Liao and Gerya, 2015; Wenker and Beaumont, 2018; Chenin et al., 2019). However, these 2D models lack the 3D component associated with different structural orientations. Some other numerical modellers have investigated the impact of linear weaknesses in three dimensions, revealing that deformation will follow an obliquely oriented crustal weakness, but that individual rifts will cross the weakness and local horizontal block rotations may occur within the rift zone (Van Wijk, 2005; Brune and Autin, 2013; Duclaux et al., 2020). Furthermore, recent numerical work on rifting in the Labrador Sea illustrates that mantle weaknesses may in some cases overprint crustal structures (Heron et al., 2019). However, so far these 3D numerical modelling studies did not systematically test the competition and interaction between weaknesses in the crust and mantle.
Analogue modelling studies of (pseudo-)2D and 3D rift processes provide some similar insights into the aforementioned numerical studies. However, these modelling efforts also either focused on structural inheritance in the crust or on the effect of mantle weaknesses (e.g. Brun and Tron, 1993; Le Calvez and Vendeville, 2002; Bellahsen and Daniel, 2005; Autin et al., 2010, 2013; Agostini et al., 2011; Zwaan et al., 2016, 2018, 2019; Molnar et al., 2017, 2018, 2019; Wang et al., 2021). To our knowledge, only Molnar et al. (2020) simulated differently oriented mantle and crustal weaknesses in their experiments to reproduce the Red Sea rift. Their results suggest that the overall orientation of the rift is generally controlled by a weak thermal mantle anomaly, whereas inherited crustal weaknesses may segment or partition the rift structure in several sub-basins, localize transfer zones, and subsequently even transform faults. However, the authors only tested a limited set of parameters (i.e. they only completed one model with both mantle and crustal weakness that were 30∘ oblique to each other).
The aim of this study is therefore to determine the relative impact of mantle and crustal structural inheritance on the localization of deformation during early continental rifting (e≤10 % or β≤1.1) by means of analogue tectonic models at the Tectonic Modelling Laboratory of the University of Bern. We used time-lapse photography, particle image velocimetry (PIV) and X-ray CT scanning methods for model analysis, allowing a thorough insight into model evolution. The main result of our modelling efforts is that crustal and mantle weaknesses can simultaneously localize rift structures, indeed leading to intricate fault patterns that may otherwise be interpreted as a result of multiphase extension. Therefore, we conclude that multiphase extension is not required to explain different structural orientations in rift basins, which provides a strong incentive to reassess the tectonic history of a number of natural examples.
2.1 Materials
We used both brittle and viscous materials to simulate the brittle and ductile parts of a 30 km thick crust belonging to a stable continental lithosphere. A 3 cm thick layer of fine quartz sand (ø=60–250 µm) represented a 22.5 km brittle upper crust (following a 3:1 upper-crust-to-lower-crust thickness ratio expected in a stable lithosphere, e.g. Zwaan et al., 2019). The sand was sieved from ca. 30 cm height into the experimental apparatus, ensuring a constant brittle layer density of ca. 1560 kg/m3. We also flattened the sand using a scraper at every centimetre during the build-up of the model in order to avoid lateral variations in layer thickness during model preparation.
We applied a 1 cm thick viscous layer to simulate a 7.5 km thick ductile lower crust below the brittle upper crust. This layer consisted of a mixture of near-Newtonian (η= ca. 1.5×10⁵ Pa s; n=1.05–1.10; Zwaan et al., 2018c) SGM-36 polydimethyl-siloxane (PDMS) and corundum sand (ρspecific=3950 kg/m3, Carlo AG, 2021). Both components were mixed according to a 0.965:1.00 weight ratio. The density of this viscous mixture was similar to the density of the overlying sand layer (ca. 1600 kg/m3), so that the model density profile was analogue to the density profile expected in nature, preventing the unrealistic buoyancy effects that pure, low-density PDMS (ρspecific= ca. 960 kg/m3) would induce. Further material properties are presented in Table 1.
Table 1Model materials.
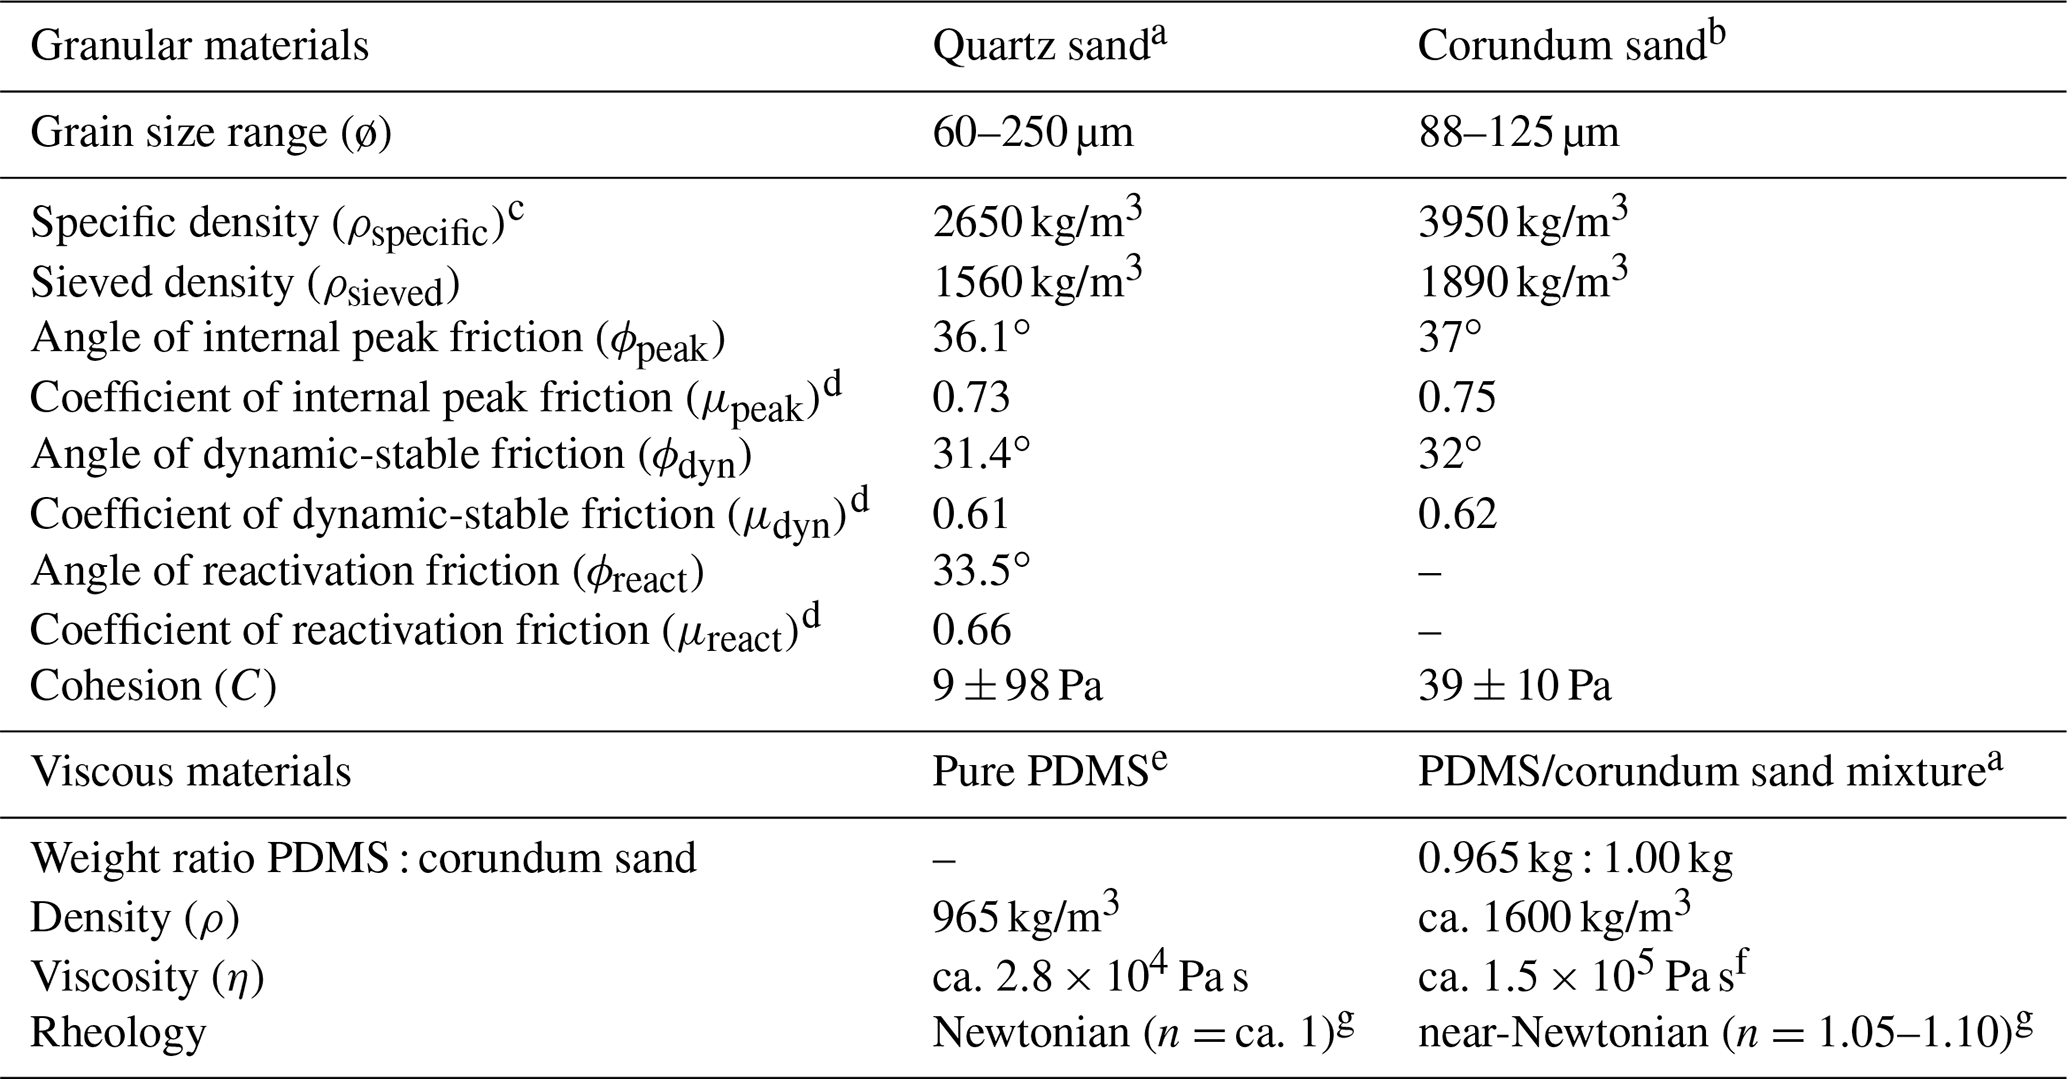
a Quartz sand, PDMS and viscous mixture characteristics after Zwaan et al. (2016, 2018b, c). b Corundum sand characteristics after Panien et al. (2006). c Specific densities after Carlo AG (2021). d μ = tan (ϕ). e Pure PDMS rheology details after Rudolf et al. (2016). f Viscosity value holds for model strain rates s−1. g Power-law exponent n (dimensionless) represents sensitivity to strain rate.
2.2 Set-up
The basic set-up for our experiments involved a mobile base plate underlying the model materials (Fig. 1a, b). The edge of the base plate created a so-called “velocity discontinuity” (VD) as soon as the sidewall to which it was attached moved outward orthogonally away from the model axis. Such a VD has often been used to simulate a (linear) discontinuity, i.e. a large-scale shear zone in the strong upper lithospheric mantle of magma-poor rift systems (e.g. Allemand and Brun, 1991; Tron and Brun, 1991; Brun and Tron, 1993; Michon and Merle, 2000; Gabrielsen et al., 2016; Zwaan et al., 2019). We applied two VD orientations, either parallel or 30∘ oblique to the model axis for model main Series 1 and 2, respectively (the VD's orientation being defined by angle θVD; Fig. 1c, d, Table 2).
Linear weaknesses in the sand layer representing the upper crust were induced by means of either pre-cut faults or “seeds” (Fig. 1b). Pre-cut faults were simply fault planes cut in the sand (e.g. Bellahsen and Daniel, 2005; Tong et al., 2014), in our case by means of fish wire. The fish wire with a diameter of 0.25 mm was placed on top of the viscous layer, and after model construction was completed, removing the wire resulted in a ca. 1 mm wide zone of perturbed sand grains. The initial dip of the pre-cut faults was 60∘ (Andersonian normal fault). Along these fault planes, the coefficient of reactivation friction was lower than the coefficient of internal peak friction (0.73 vs. 0.61, Table 1). Hence the fault plane was ca. 16 % weaker than the surrounding sand layer, thus localizing deformation more easily. Seeds were small semi-circular ridges of viscous material with a diameter of 5 mm, placed on top of the viscous layer representing the lower crust (e.g. Le Calvez and Vendeville, 2002; Zwaan and Schreurs, 2017, Molnar et al., 2019, 2020). Above these seeds the standard sand layer was 33 % thinner and thus 44 % weaker, localizing deformation (Zwaan et al., 2020). Similar to the VD, these crustal weaknesses were oriented in different directions, either parallel () or oblique (θCW = 30 or ) to the model axis, but instead of a single weakness, we applied a sequence of parallel weaknesses (Fig. 1e, f, Table 2). Note that in the case of a model axis-parallel VD, a 30∘ oblique crustal weakness orientation would be the mirror image of a −30∘ orientated seed, thus representing the same set-up that was not necessary to repeat. Next to the models with crustal weaknesses, we also present results of models without such weaknesses for reference purposes.
As extension is applied by moving the sidewall outward, a regional orthogonal extension field develops. This extension field could be oblique to both the simulated mantle and crustal weaknesses, as a function of their respective orientation (Fig. 1c–f, Table 2). The standard extension velocity is a constant 2 cm/h. Also, the effects of faster extension (v=4 cm/h) was tested (Sub-series 2.3; see Table 1); however, the final bulk extension was always 3 cm (so that e=10 % or β=1.1 at the end of a model run, given an initial model width of 30 cm). Similarly, some models explored the effects of a thicker viscous layer of 2.5 cm, but the total model height was always kept at 4 cm (i.e. the sand layer was 0.5 cm thinner in these models). A total of 15 models are included in this paper, some of which were re-runs of selected models in a CT scanner (Table 2). Repeating these selected models showed good reproducibility, indicating that our modelling method is robust.
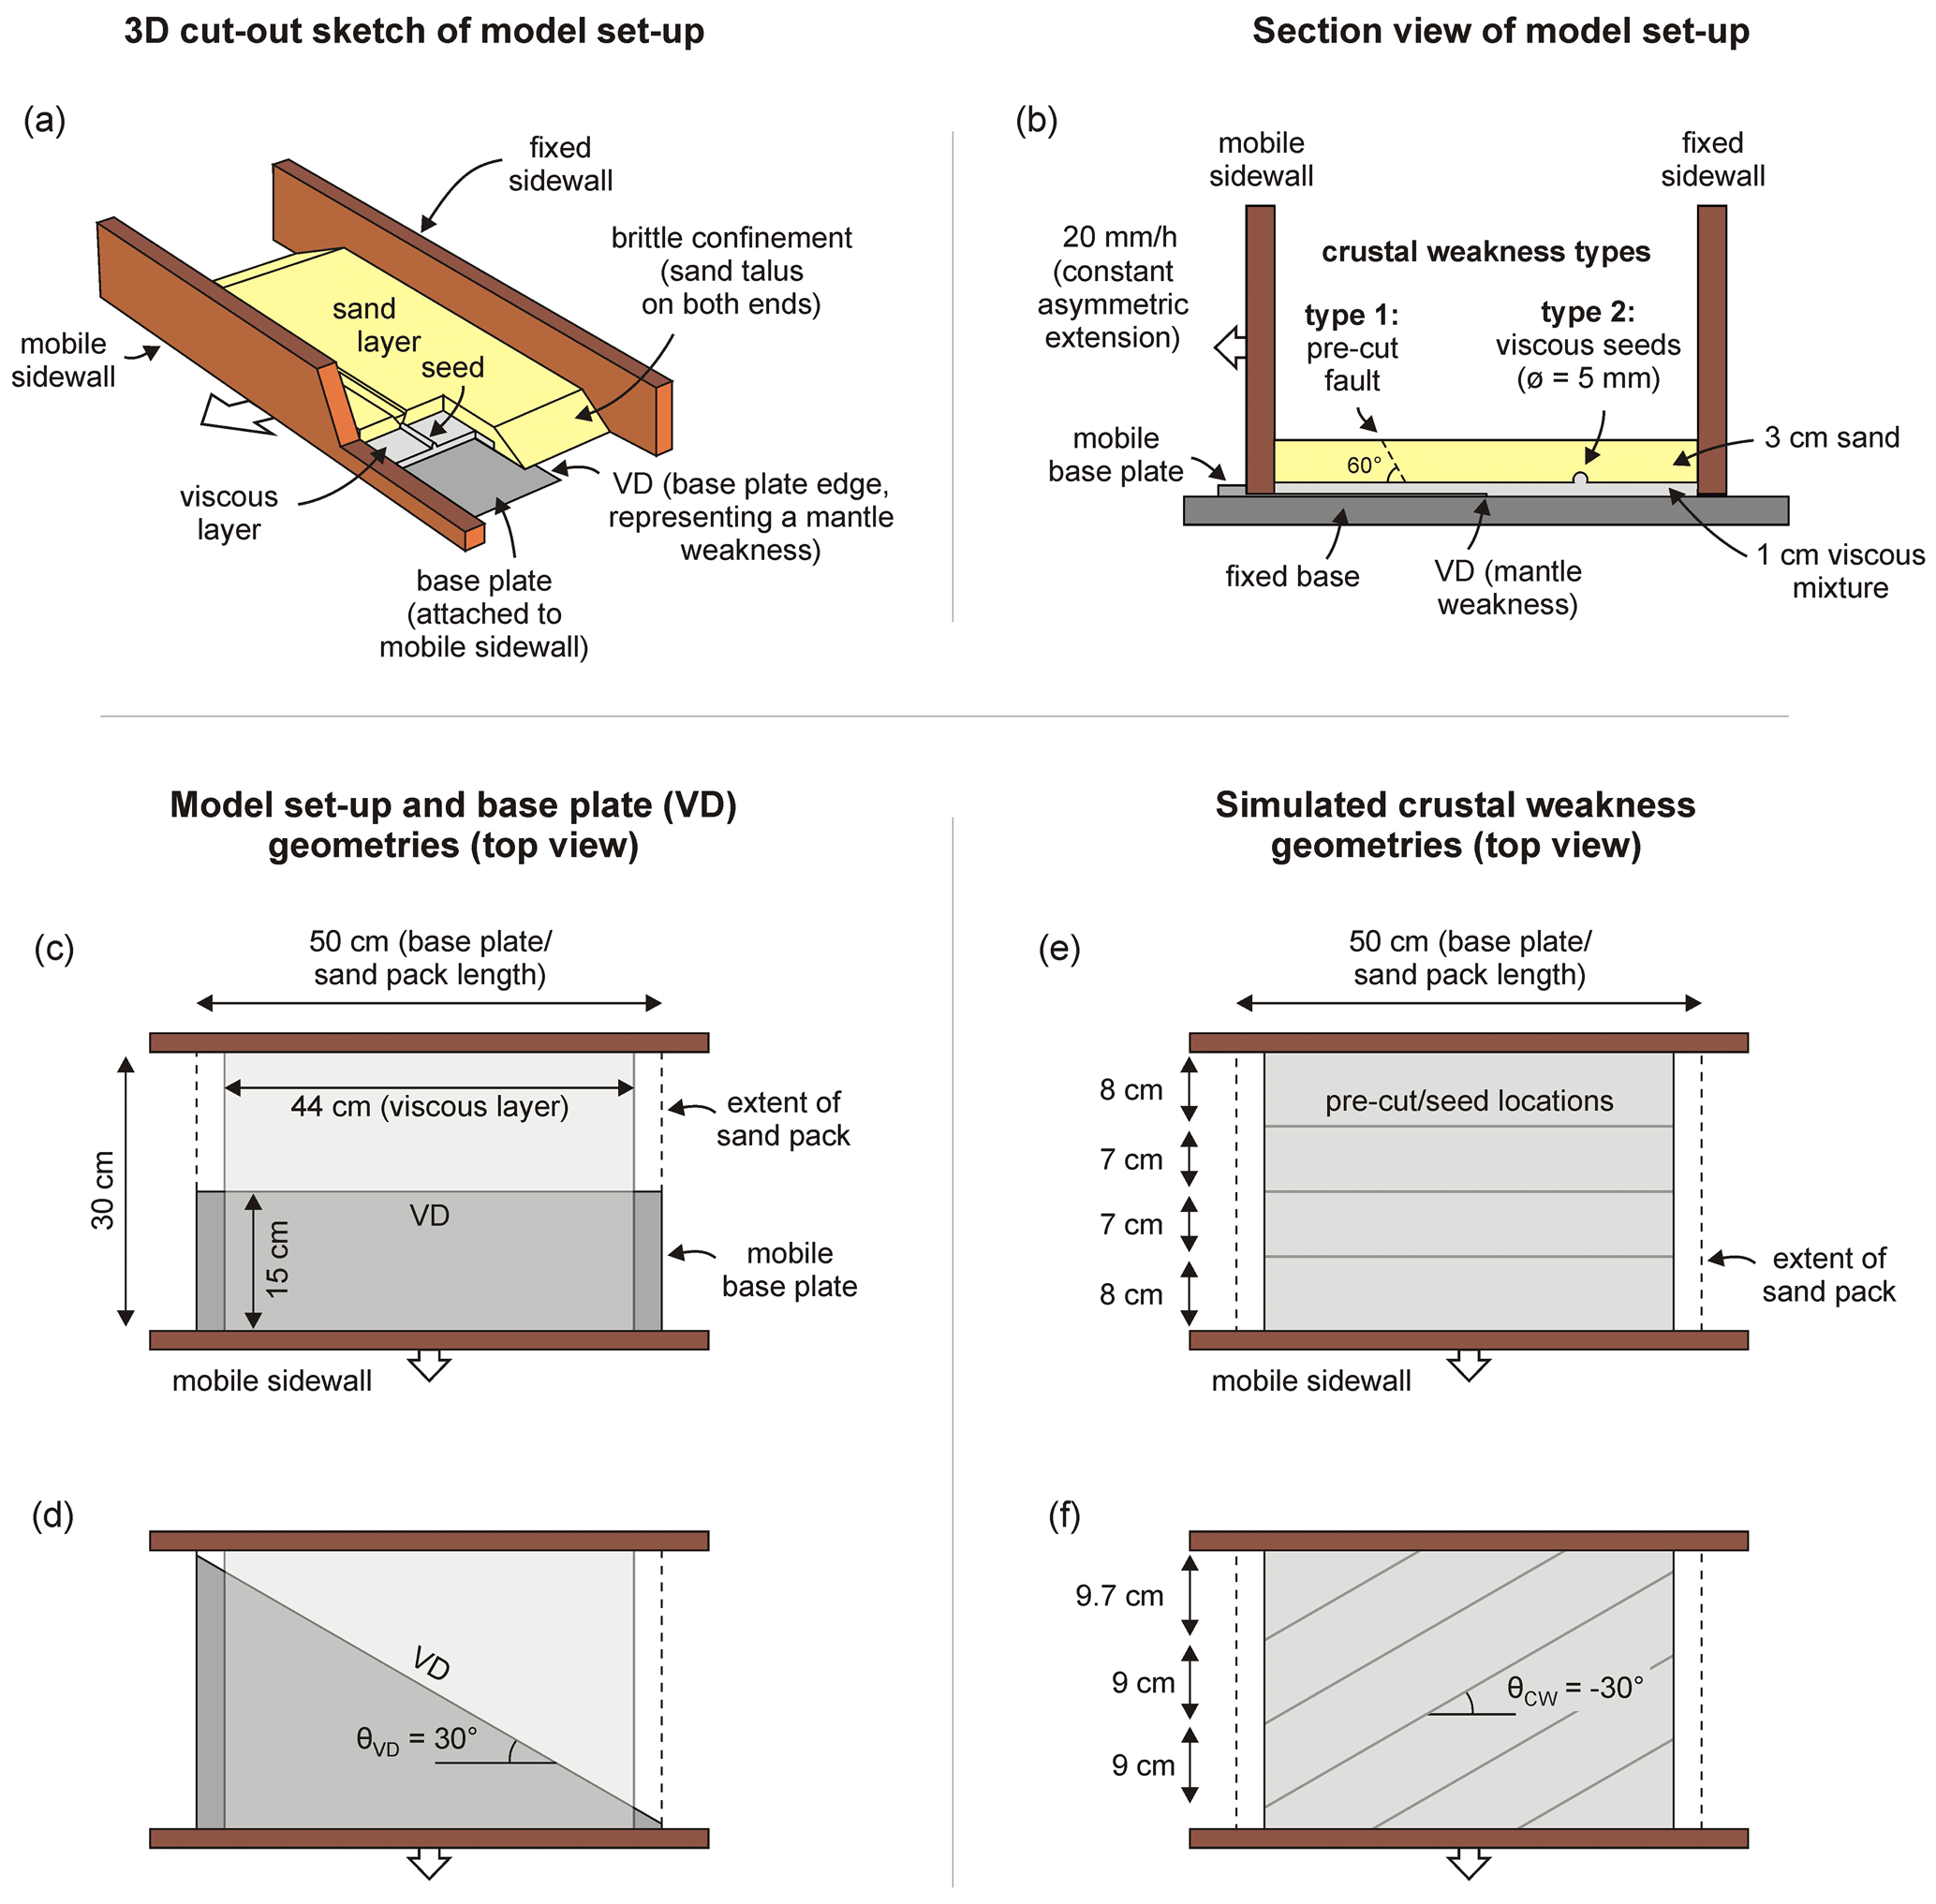
Figure 1Model set-up. (a) 3D sketch of general set-up. VD: velocity discontinuity representing a weakness (e.g. a shear zone) in the strong upper mantle. (b) Section view depicting standard model layering and the two types of crustal weaknesses (pre-cuts and viscous seeds). (c–d) Model set-up and base plate geometries shown in map view. (c) Base plate configuration for main Series 1 (with VD parallel to model axis or ). (d) Base plate configuration for main Series 2 (with VD 30∘ oblique to model axis or ). (e–f) Examples of crustal weakness geometries at the top of the viscous layer, shown in map view. (e) Model axis-parallel crustal weaknesses (). (f) Crustal weaknesses −30∘ oblique to the model axis (∘).
Table 2Model parameters.
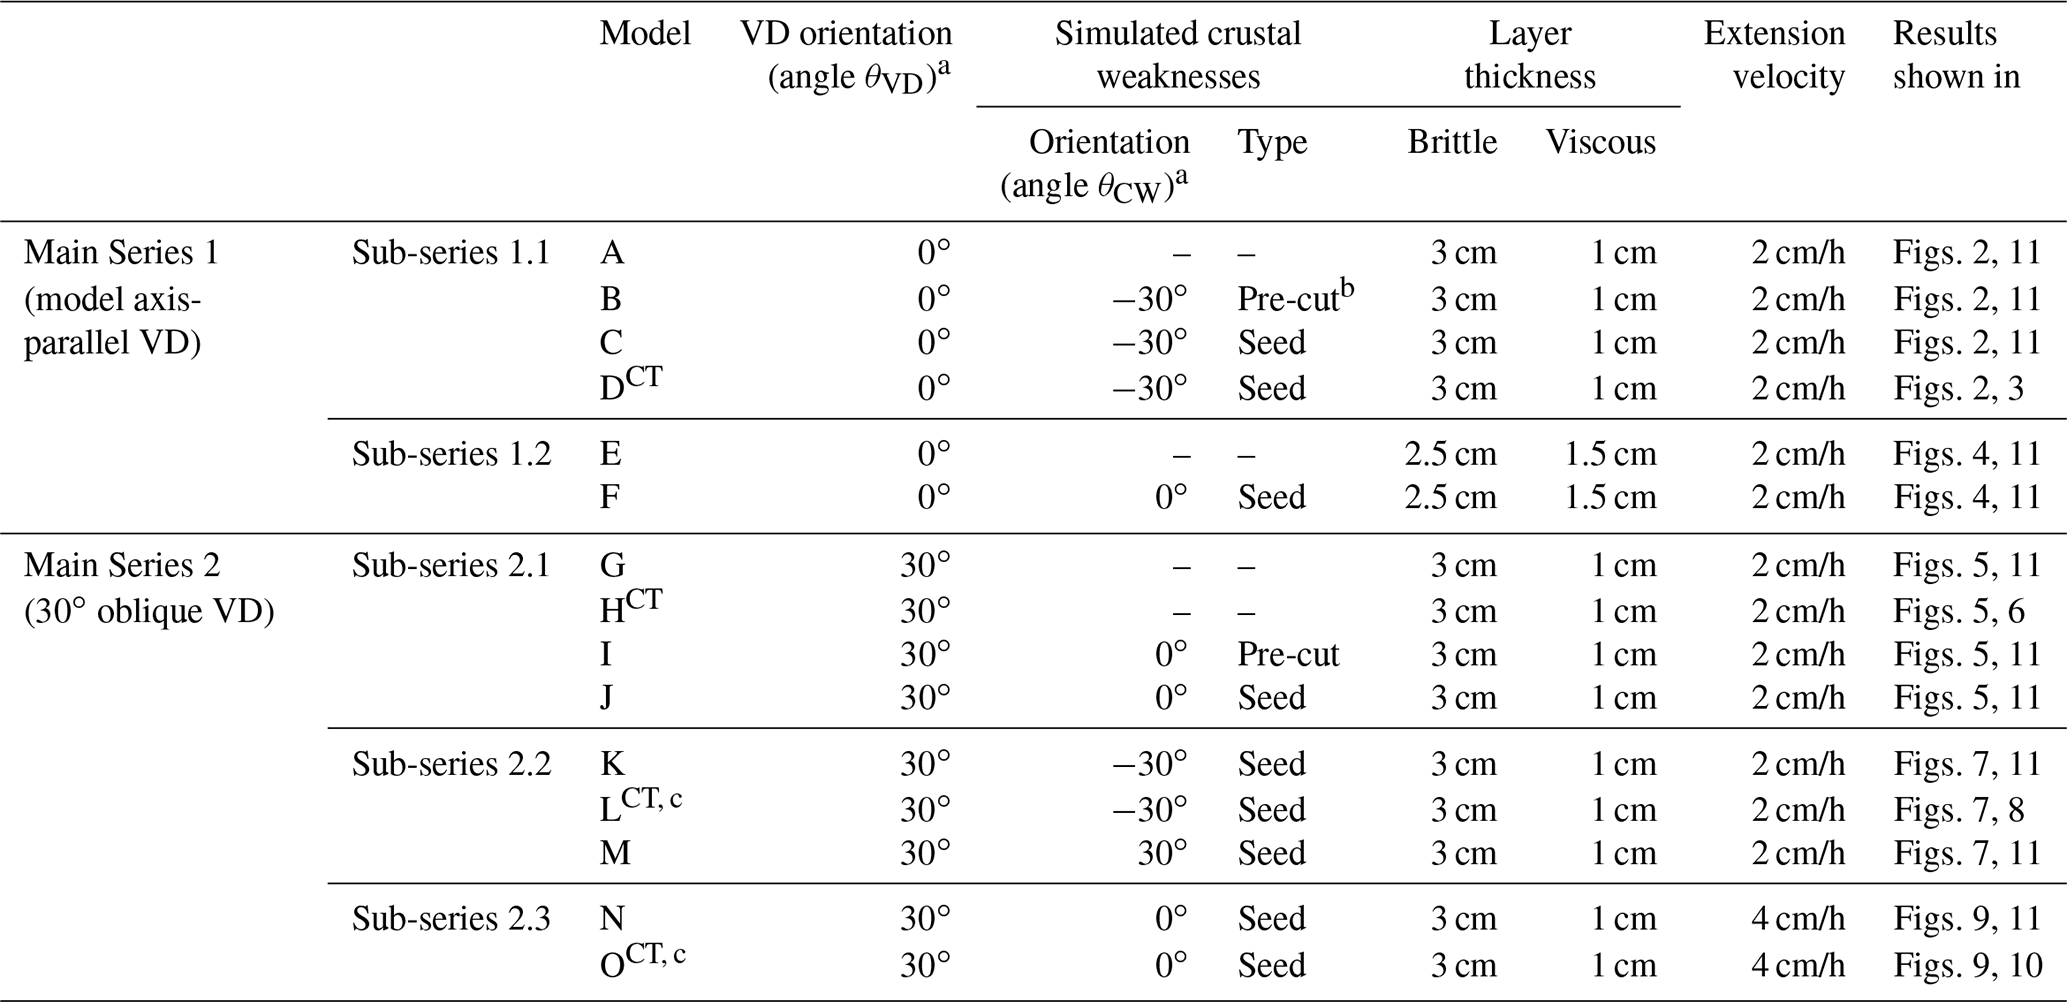
a VD: velocity discontinuity, representing a mantle weakness, CW: (simulated) crustal weakness. b Pre-cut fault inclination 40∘ instead of 60∘. c No high-resolution oblique photographs available due to technical issues during the model run. CT CT-scanned models.
2.3 Model monitoring and analysis
Basic monitoring of model evolution for all models was done by means of time lapse photography. We applied a Nikon D200 (10.2 MPx) camera for map-view images, and two obliquely oriented Nikon D810 (36.3 MPx) cameras providing a stereoscopic view of the model after every mm of extension (i.e. after every min, or in the case of Models N and O with double extension velocity, after every 30 s). A 4×4 cm grid of thin < 1 mm thick corundum sand applied on the model surface allowed for visual assessment of horizontal displacements. Note that Models L and O lack the oblique photographs due to technical issues, so that only map-view pictures were available (Table 2).
These photographs not only provided a visual impression of surface model evolution, but also allowed more detailed analysis and quantification of deformation by means of PIV techniques (e.g. Adam et al., 2005; Boutelier et al., 2019, and references therein). The PIV analysis was performed using DaVis 10.2 software from LaVision, which compares the time lapse images to derive vector fields of horizontal displacements over time. These horizontal displacement vector fields were subsequently applied to extract incremental maximum normal strain, which is taken as a proxy of active deformation in the model at specific time steps. We applied the high-resolution Nikon D810 oblique photographs for PIV analysis (after correction for the deformation due to the obliquity). Since no oblique photographs were available for models L and O, we used the lower-quality Nikon D200 photographs for PIV analysis instead.
In addition to the PIV analysis, we re-ran four selected models in a CT scanner (Table 2) to obtain insights into their internal structural evolution. CT scanning exploits the differences in attenuation (mostly a function of density), allowing the visualization of features inside an otherwise opaque object (e.g. Naylor et al., 1994; Colletta et al., 1991; Schreurs et al., 2003). The scanning was done using the Siemens Somaton Definition AS X-ray CT scanner of the University of Bern Institute of Forensic Medicine. We scanned the models at intervals of 2.5 mm of extension, providing a complete picture of their evolution. The CT data were subsequently visualized and analysed by means of open-source software (Horos: https://horosproject.org, last access: 29 June 2021).
2.4 Scaling
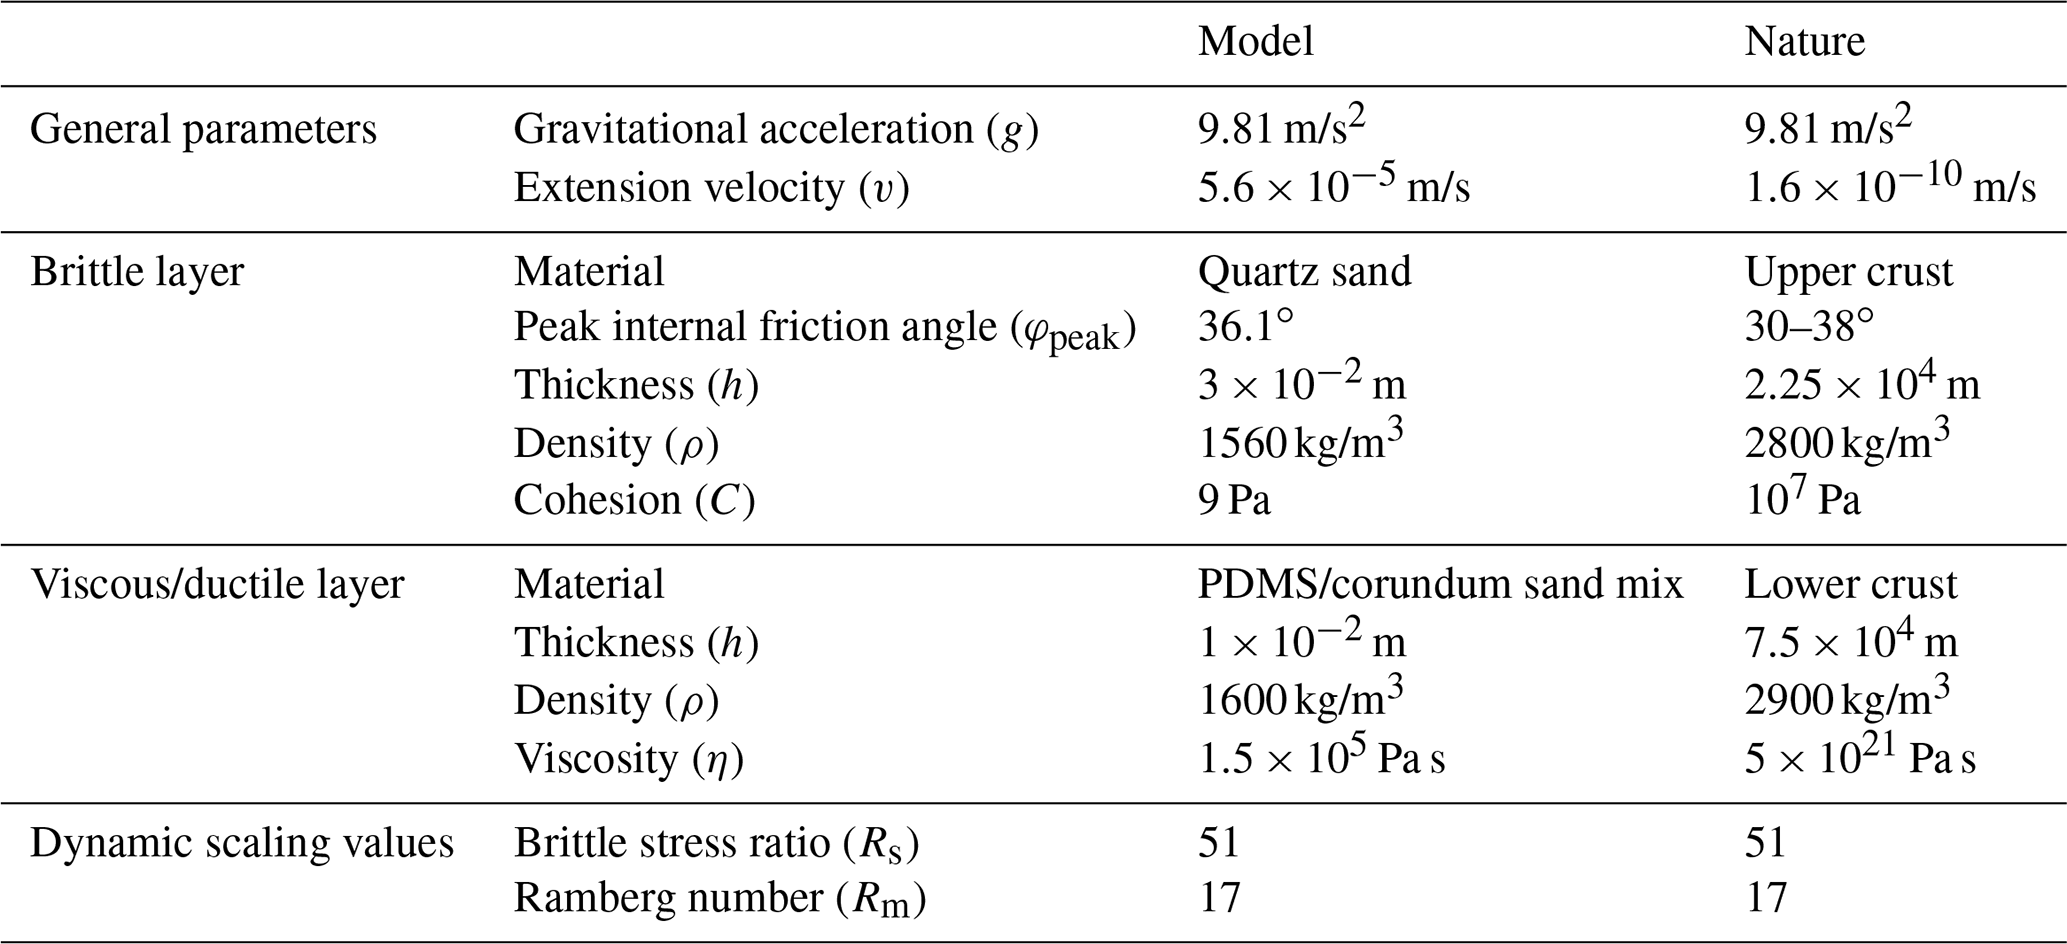
Model scaling procedures serve to make sure that the experiment properly represents the natural prototype. Brittle materials have time-independent rheology, so that the main concern for scaling purposes is the angle of internal friction of the sand (36.1∘), which is similar in models and nature (31–38∘; Byerlee, 1978; Table 3). Yet when scaling viscous materials, one needs to take into account their time-dependent rheology. We start with the basic formula addressing the stress ratios between model and nature (, where ρ∗, h∗ and g∗ are density, length and gravity ratios, respectively (Hubbert, 1937; Ramberg, 1981). We can then acquire the strain rate ratio from the stress and viscosity ratios σ∗ and η∗ (Weijermars and Schmeling, 1986): . Knowing the strain rate ratio, the following equations yield the velocity and time ratios (v∗ and . When assuming a relatively high lower crustal viscosity of ca. 5×10²¹ Pa s that may be representative for early rift systems (e.g. Buck, 1991), 1 h in our models thus translates to ca. 3 Myr in nature and our standard model velocity (20 mm/h) scales up to ca. 5 mm/yr. These values are similar to typical rift extension velocities (several mm/yr; e.g. Saria et al., 2014, Fig. 1b). An overview of scaling parameters is provided in Table 3.
An additional scaling test concerns the dynamic similarity of the model with respect to nature. Dynamic similarity between the brittle model layer and its upper crustal equivalent is estimated with the ratio Rs between the gravitational stress and cohesive strength or cohesion C (Ramberg, 1981; Mulugeta, 1998): Rs = gravitational stress cohesive strength = (. A cohesion of 12 MPa for natural materials in the upper crust, combined with a 9 Pa cohesion in the sand, yields an Rs of 51 for both model and nature. This natural cohesion value of 12 MPa is slightly lower than cohesions measured in rock deformation labs (e.g. Handin, 1969; Jaeger and Cook, 1976; Twiss and Moore, 1992) but is acceptable, since in nature, the lithosphere is generally weakened by several phases of deformation. When assessing viscous materials, the Ramberg number Rm applies (Weijermars and Schmeling, 1986): Rm = gravitational stress viscous strength = . The Ramberg number for both the model and natural materials is 17. With both our Rs and Rm model values very similar to those in nature, we consider our models adequately scaled for the simulation of continental rift tectonics.
In the following sections we systematically present our analogue modelling results. Section 3.1 concerns the model results from Sub-series 1.1 that involve a model axis-parallel VD, which reveal the influence of different types of (obliquely oriented) crustal weaknesses. In Sect. 3.2 we describe the results from model Sub-series 1.2, showing the effect of a thicker lower crustal layer on models in which crustal weaknesses and the VD are all parallel to the model axis. Section 3.3 concerns our Sub-series 2.1 and 2.2 models that were designed to explore the influence of an oblique VD, combined with the effects of various crustal weakness orientations. Finally, in Sect. 3.4 we present the results from Sub-series 2.3, in which we tested the effects of extension velocity in models with an oblique VD and model-axis parallel crustal weaknesses.
3.1 Analysis of Sub-series 1.1 experiments: impact of the type of crustal weaknesses
The PIV-derived incremental strain evolution of models A–D from Sub-series 1.1 (with model axis-parallel VD) shows that all models develop rift structures, but clear differences occurred as a function of the presence and type of simulated crustal weaknesses (Fig. 2). Reference Model A, without simulated crustal weaknesses, developed early on two deformation zones on both sides of VD that became clearly visible on PIV images after 5 mm of extension (e=1.7 %; Fig. 2a). These deformation zones subsequently localized along discrete faults bounding a set of two parallel grabens on each side of the VD after 10 mm of extension (e=3.3 %), which form a central rift zone (Fig. 2b). This system remained in place until the end of the model run (30 mm of extension, e=10 %), when a new normal fault started to appear away from the model axis (Fig. 2d).
Introducing a series of oblique pre-cut faults in Model B caused important changes in our model results, segmenting and increasing the distance between the VD-parallel graben and inducing a set of secondary oblique graben structures. The −30∘ oriented pre-cut faults were reactivated early on (i.e. after ca. 5 mm of extension or e=1.7 %), and two additional deformation zones parallel to the VD developed (similar to those observed in Model A, Fig. 2a, although some discrete faults already appeared within these zones at this early stage, Fig. 2f). As the model developed and normal faulting further localized along the VD-parallel deformation zones, the interference of the pre-cut faults with the VD-parallel normal faults caused the latter to appear to be slightly offset (Fig. 2g–j). This resulted in a segmentation or partition of the grabens along the model axis in the sub-graben, which were straight and continuous in reference Model A (Fig. 2a–e). It also induced a greater distance between both VD-parallel grabens compared to the reference model (ca. 4 cm vs. 0 cm; Fig. 2d, e, i, j). In addition, minor secondary (half-)graben structures developed along the pre-cut seeds (Fig. 2i, j).
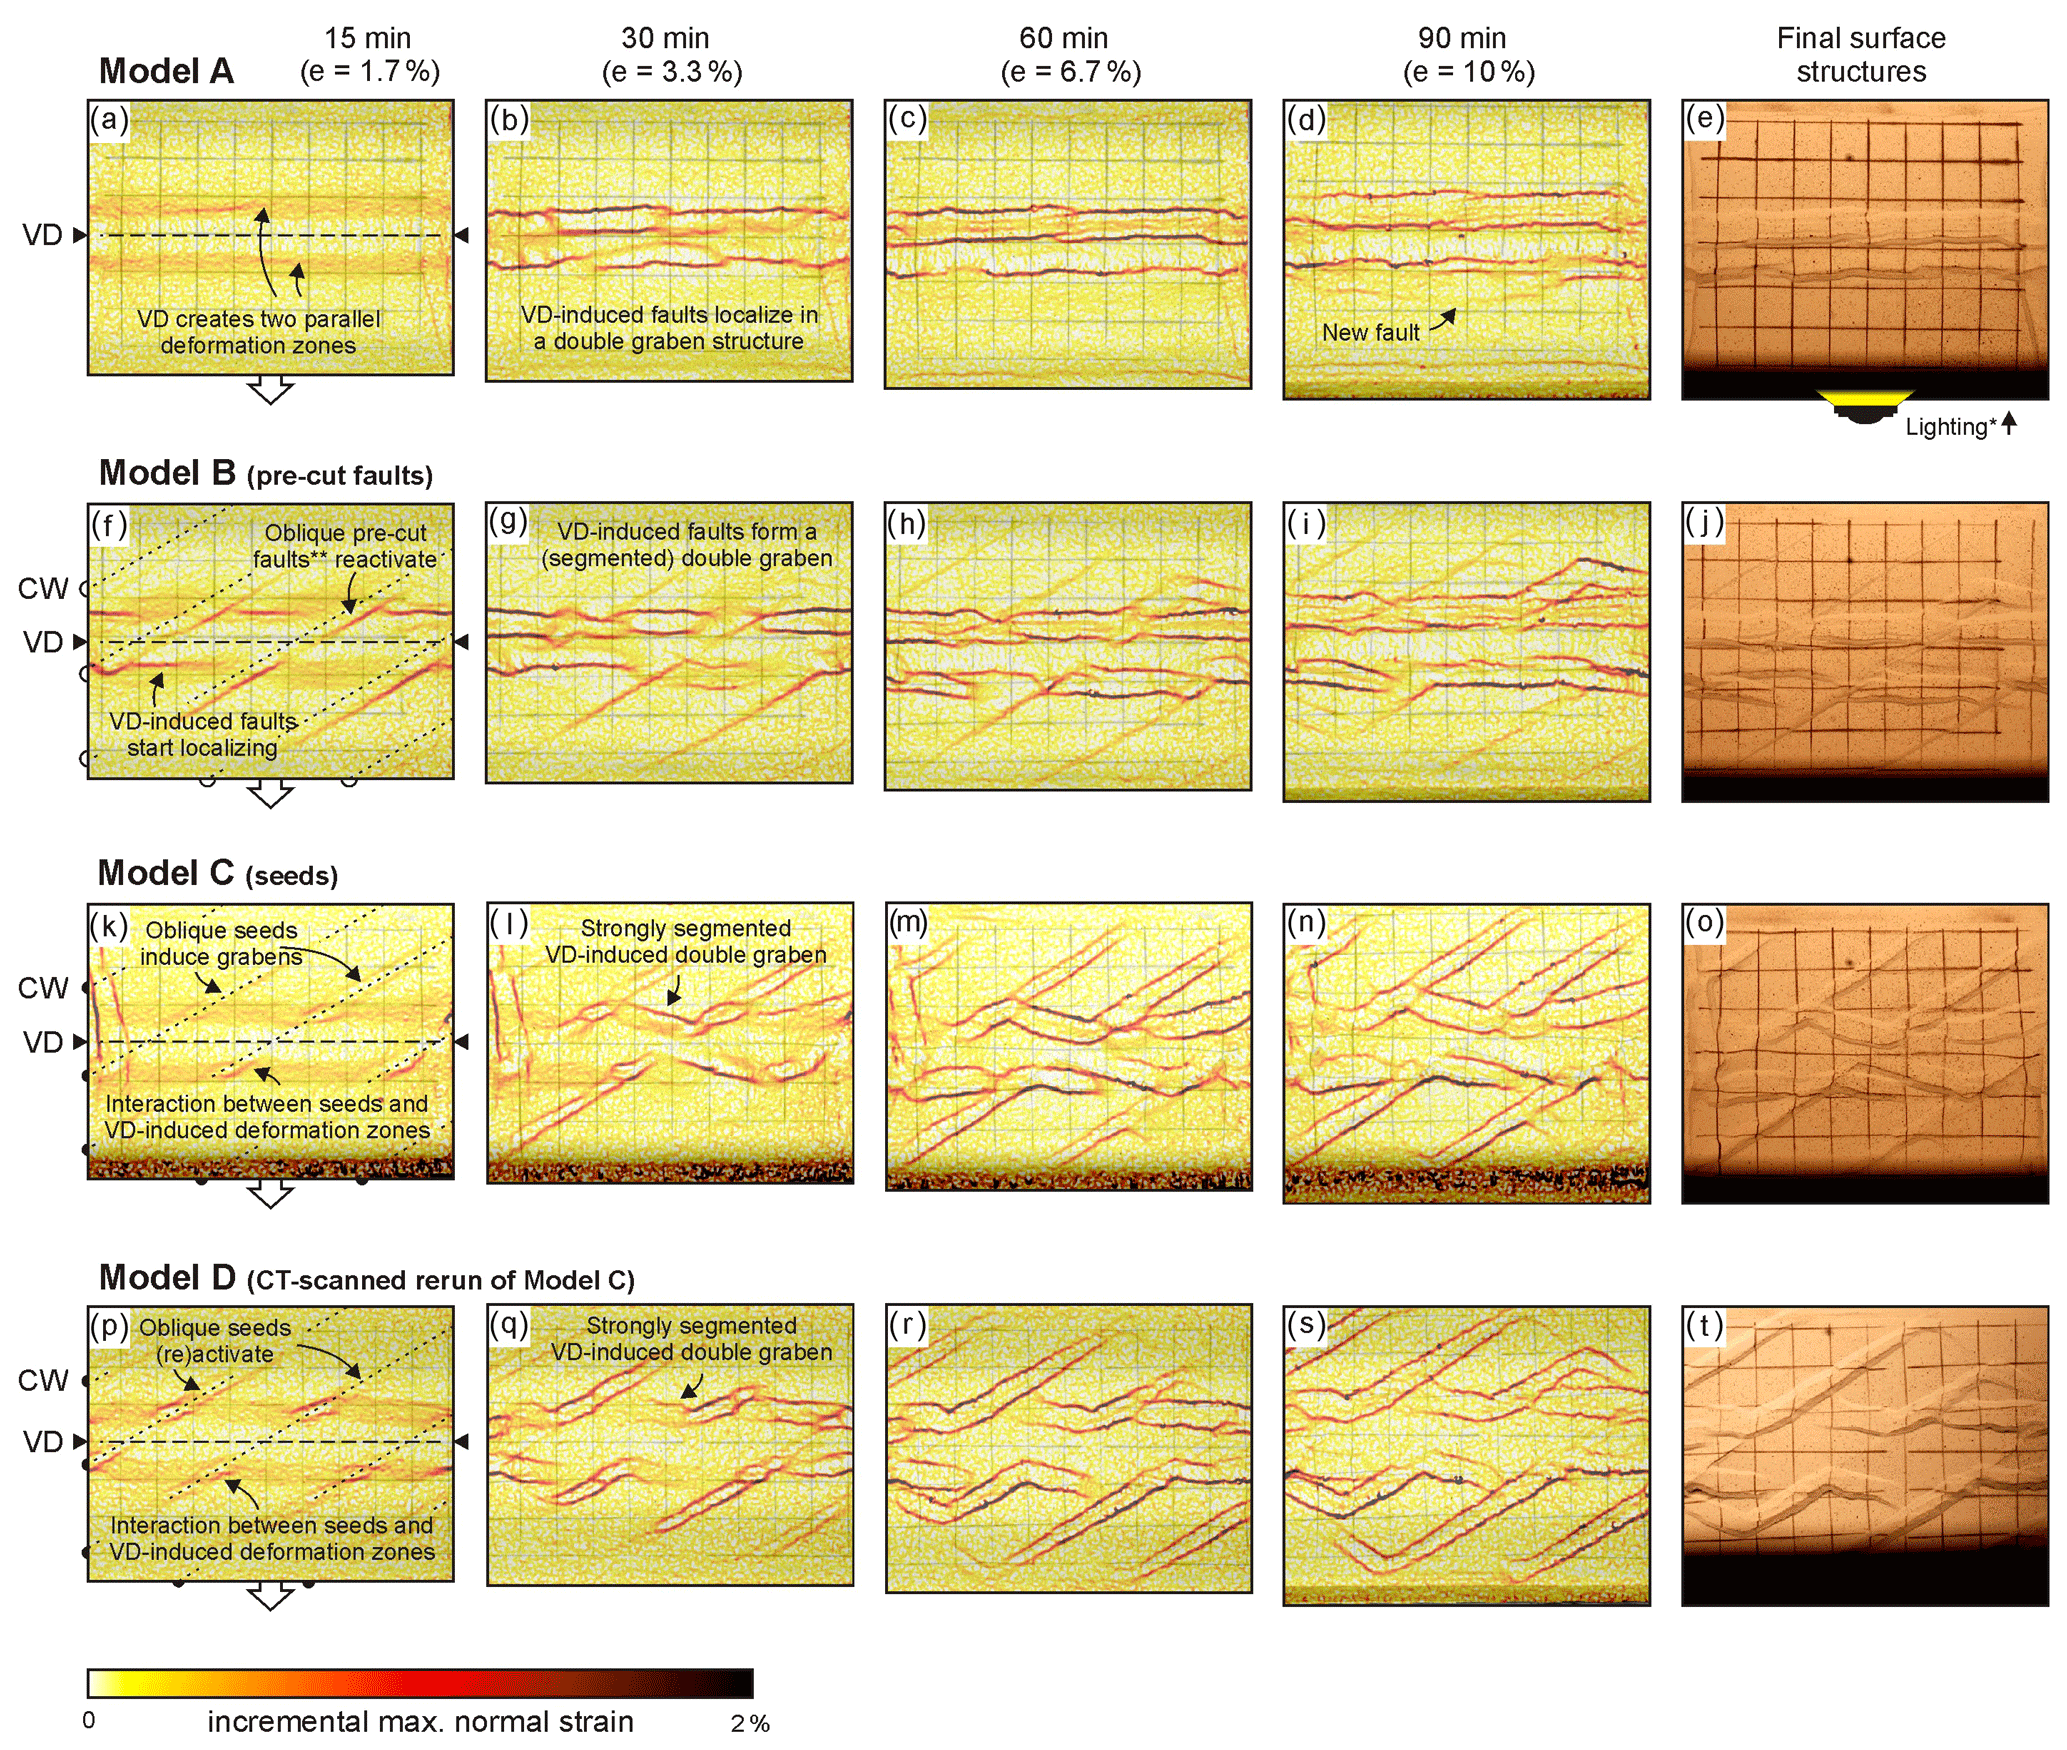
Figure 2Incremental maximum normal strain maps of Sub-series 1.1 models obtained through PIV analysis (with model axis-parallel VD and −30∘ oblique weaknesses in the brittle cover, if applied), taken as a proxy of fault activity. The increments for PIV analysis were 1 min, i.e. every 0.33 mm of extension. The original model map-view pictures are visible in the background. The right-hand column depicts the model surface at the end of each experiment. VD: velocity discontinuity. CW: (simulated) crustal weakness. ∗ Shadows cast by one-sided lighting allowing a better visualization of the final surface structures. The locations of the pre-cut faults at the base of the sand layer are indicated; the offset of the surface expression of the faults is due to their inclination within the brittle layer (Fig. 1b).
Applying −30∘ oriented seeds in Models C and D (where Model D is a CT-scanned rerun of Model C) created a very similar segmentation and graben offset to Model B (where crustal weaknesses are pre-cut faults), although this segmentation was expressed more visibly in Models C and D. At an early stage (5 mm of extension or e=1.7 %), the VD-parallel deformation zones developed, but strain clearly localizes along the seeds as well, creating small grabens at an angle to those generated by the VD (Fig. 2k, p). Furthermore, where both systems interfered, strain along the seed-parallel graben faults was enhanced (Fig. 2k, p). As extension continued, two VD-parallel grabens formed in the centre of the model, but these grabens were significantly segmented and appear to be offset by the well-developed oblique graben structures parallel to the seeds (Fig. 2l–o, q–t).
The CT scans of Model D provide additional insights into the model's internal evolution (Fig. 3). As shown by the PIV results, the CT data clearly indicated that the seeds localize early faulting after ca. 5 mm of extension (e=1.7 %, Fig. 3a–c). The 3D CT imagery also reveals that the VD generated a general rift zone along the axis of the model early on (Fig. 3c), which is not well-defined in section view (Fig. 3a, b), but the borders of which are visible in the shape of VD-parallel deformation zones on PIV top views (Fig. 2a, f, k, p). This rift zone became more expressed over time as normal (boundary) faults started to appear, after 10 mm of extension (e=3.3 %; Fig. 3d, e). At the same moment, the two grabens parallel to the VD seen on PIV-derived strain maps (Fig. 2l–n, q–s) are also clearly visible on both sections and 3D images (Fig. 3e, f).
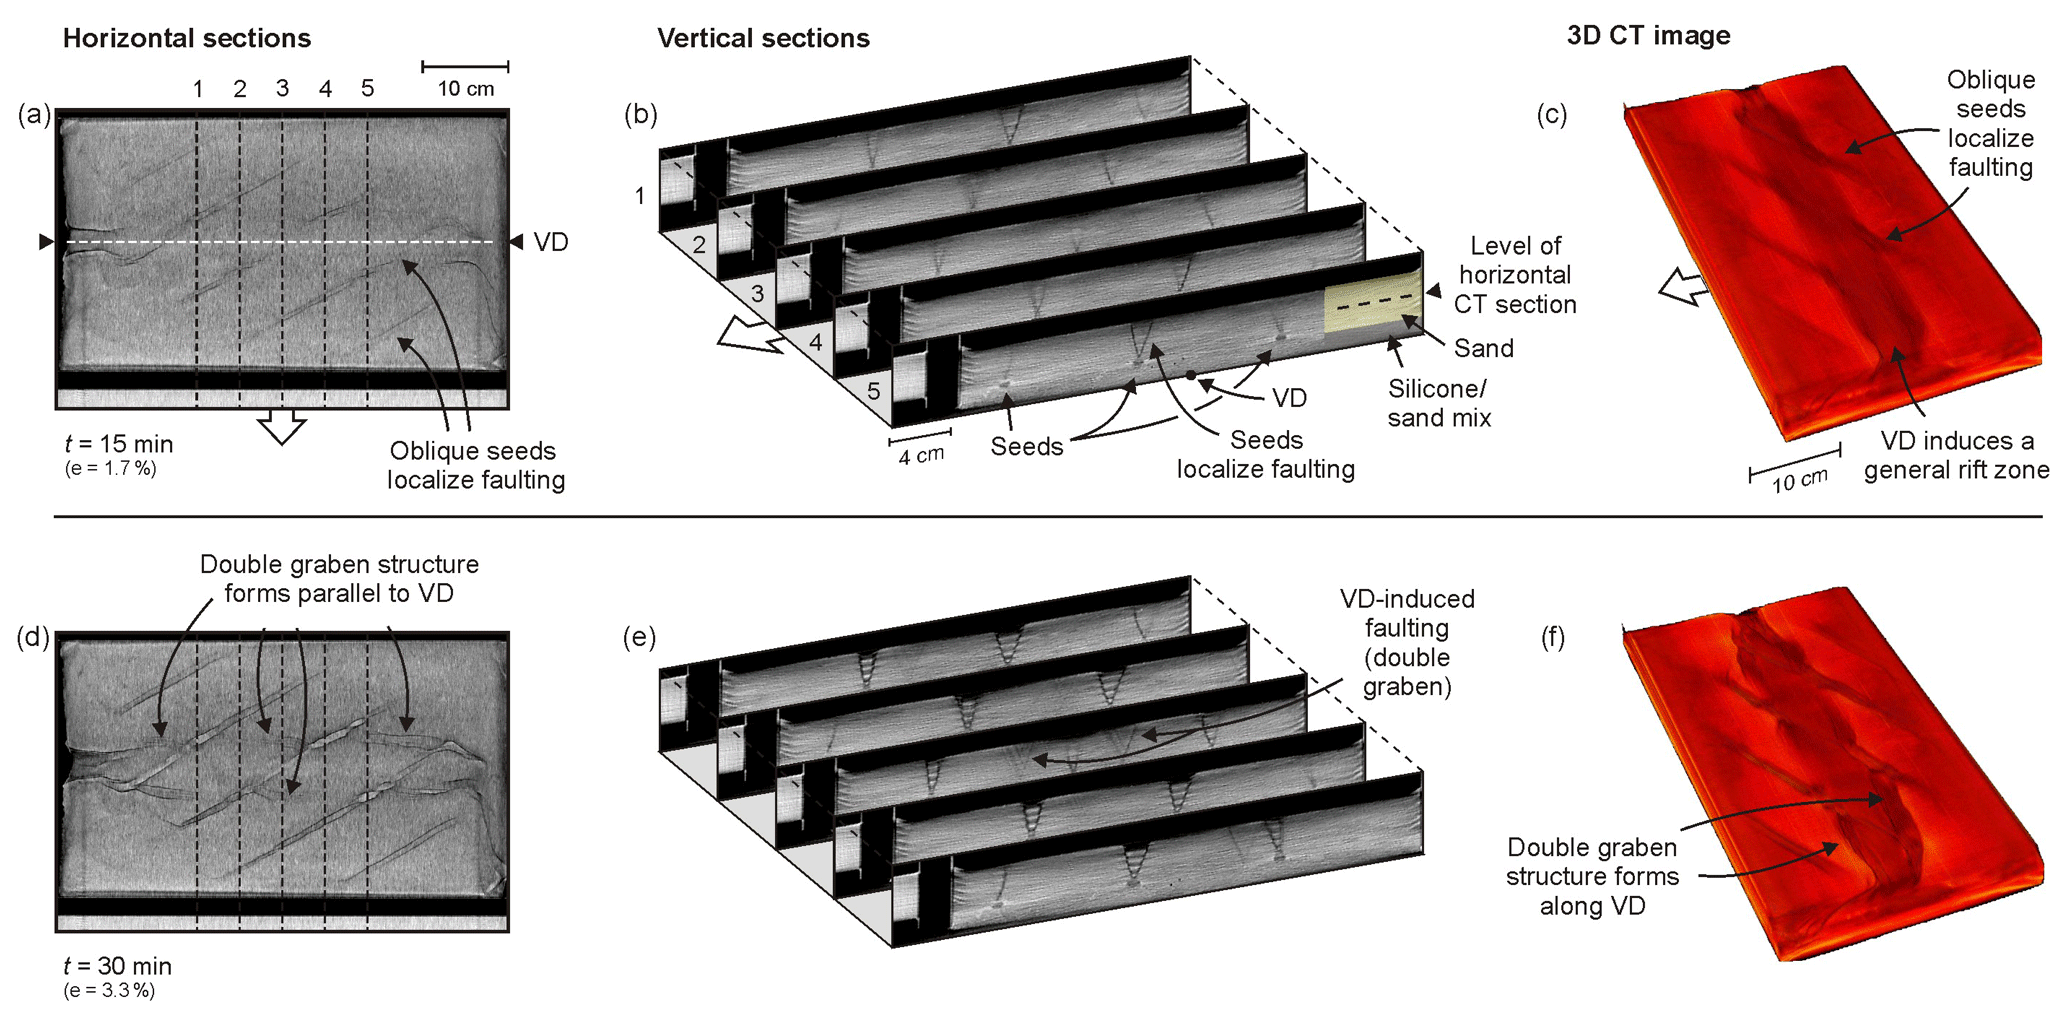
Figure 3CT analysis of Model D (model axis-parallel VD, −30∘ oblique seeds, CT-scanned rerun of Model C). (a, d) Horizontal sections through the brittle layer. (b, e) Serial cross sections. (c, f) 3D CT images. Note that the colours in these images represent CT-scanning intensities and are not to be interpreted as a measure of model surface altitude.
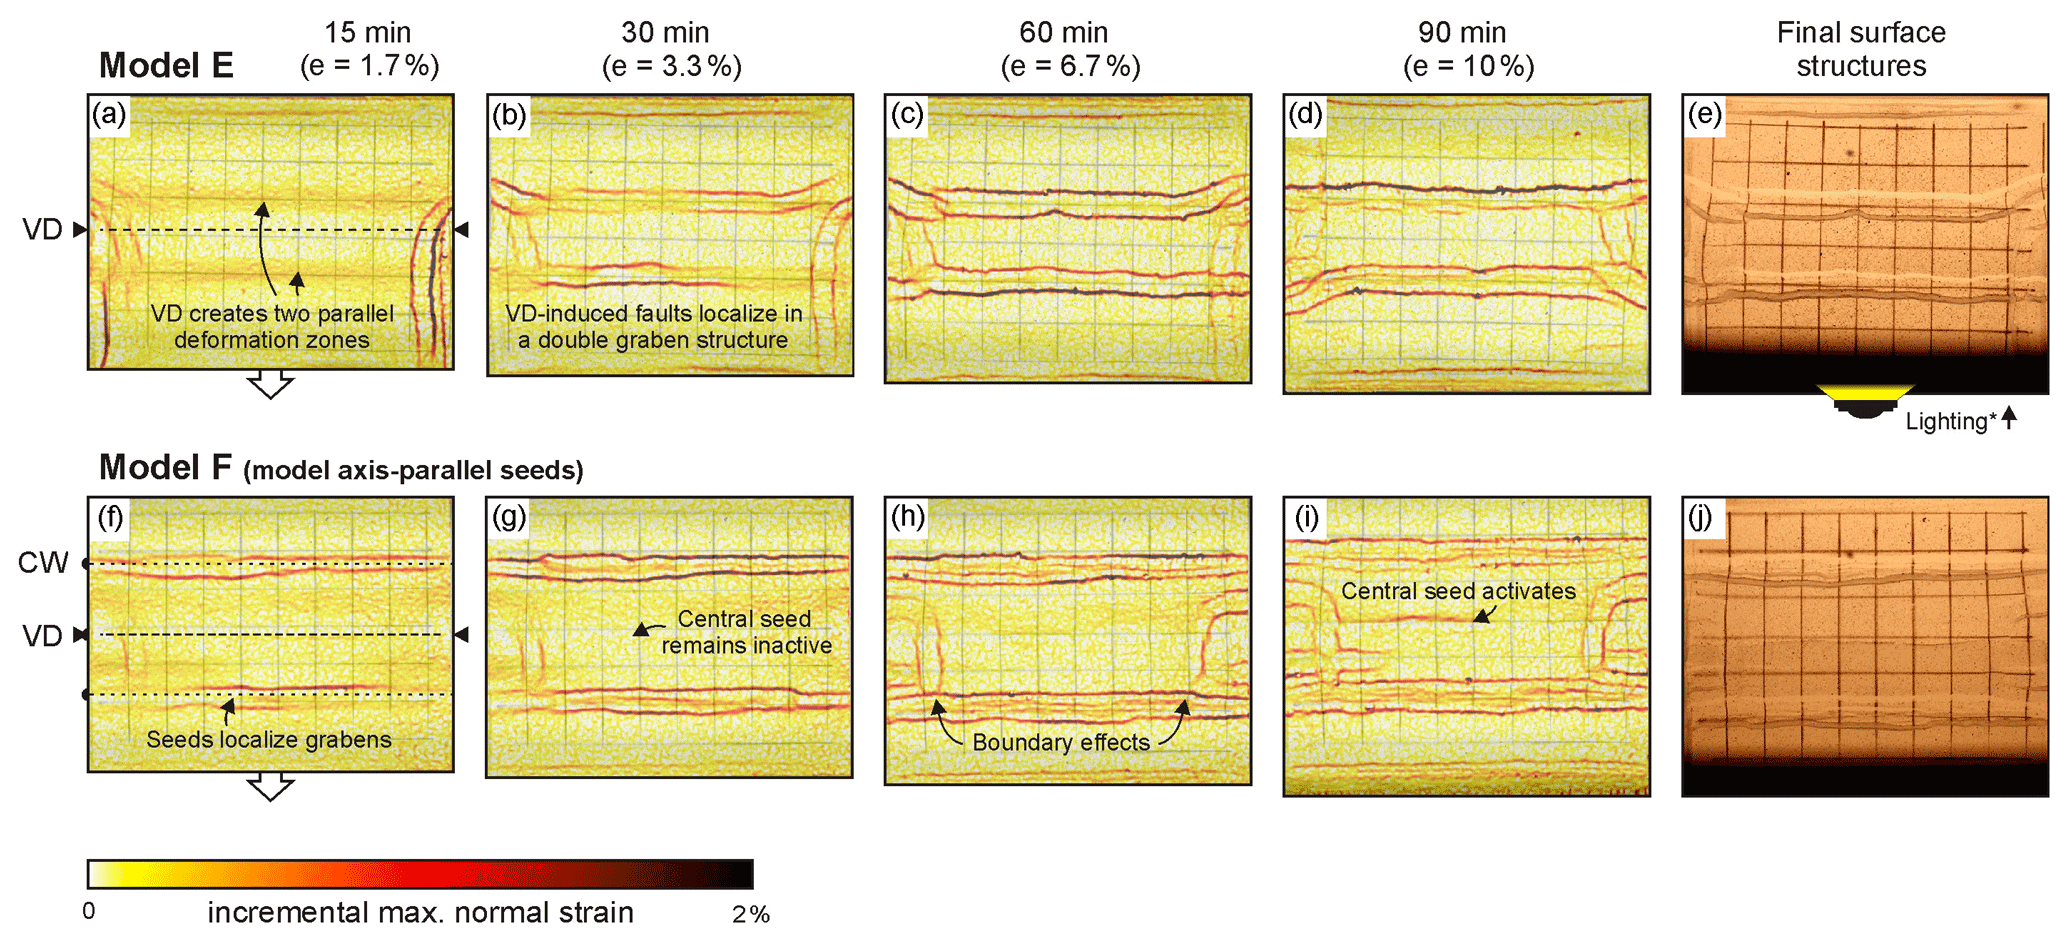
Figure 4Incremental maximum normal strain maps of Sub-series 1.2 models (with model axis-parallel VD, and equally oriented seeds, if applied) obtained through PIV analysis, taken as a proxy of fault activity. Note that these models have a thicker (1.5 cm) viscous layer and a thinner (2.5 cm) brittle cover than the other models in this paper (standard layering being 3 cm of brittle material on top of 1 cm of viscous material). The increments for PIV analysis were 1 min, i.e. every 0.33 mm of extension. The original model map-view pictures are visible in the background. Note that Model F includes a crustal weakness (seed) above and parallel to the VD. The right-hand column depicts the model surface at the end of each experiment. VD: velocity discontinuity. CW: (simulated) crustal weakness. * Shadows cast by one-sided lighting allowing a better visualization of the final surface structures
3.2 Analysis of Sub-series 1.2 experiments: impact of viscous layer thickness
Models E and F from Sub-series 1.2 were run with a slightly thicker viscous layer than the other models (1.5 cm instead of 1 cm; Table 2) but still provided insights into the effects of seeds oriented parallel to the VD, which was itself aligned to the model axis (Fig. 4). Model E, without seeds or pre-cuts, developed a double graben somewhat similar to Model A, although the grabens in Model E are farther apart, flanking a central horst (Figs. 2a–e, 4a–e). When adding the model-axis parallel seeds in Model F, the outermost seeds localize deformation and the double graben structure (Fig. 4f–j) becomes even wider when compared to Model E (Fig. 4a–e). We furthermore observe the late-stage development of a normal fault structure in the middle of the central horst block of Model F, along the central seed (Fig. 4i, j). Both Models E and F develop some boundary effects at the short ends of the set-up, where the sand talus partially collapses, creating minor grabens perpendicular to the main structures (Fig. 4).
3.3 Analysis of Sub-series 2.1 and 2.2 experiments: impact of VD obliquity with respect to extension direction
The results from Models G and H, with a 30∘ oblique VD but without simulated crustal weaknesses (where Model H is a CT-scanned rerun of Model G), provide a general reference for our Series 2 models (Fig. 5a–j). Both these models produced two deformation zones parallel to the VD in their initial stages (5 mm of extension or e=1.7 %), very similar to the deformation zones observed in Model A (Figs. 2a, 5a, f). However, Models G and H developed a series of right-stepping en échelon normal faults along these initial deformation zones, connected by relay ramps, which contrasts with the through-going normal faults in Model A (Figs. 2a–e, 5a–j). These en échelon normal faults form the boundary of the rift zone, which continued to widen over time while the faults grew in length (Fig. 5a–j).
The CT-scans of model H provide high-quality visualization of both the complex surface and internal structural model evolution resulting from an oblique VD (Fig. 6). We observe the early initiation of the en échelon faults after 5 mm of extension (e=1.7 %) in vertical CT sections, and the development of the rift zone between these en échelon faults in 3D view (Fig. 6b–f). In addition, the CT scans reveal that two graben structures developed on both sides of the rift zone, reminiscent of the double graben system found in Models A and E (both with model axis-parallel VD but no simulated crustal weaknesses; Figs. 2a–e, 4a–e).
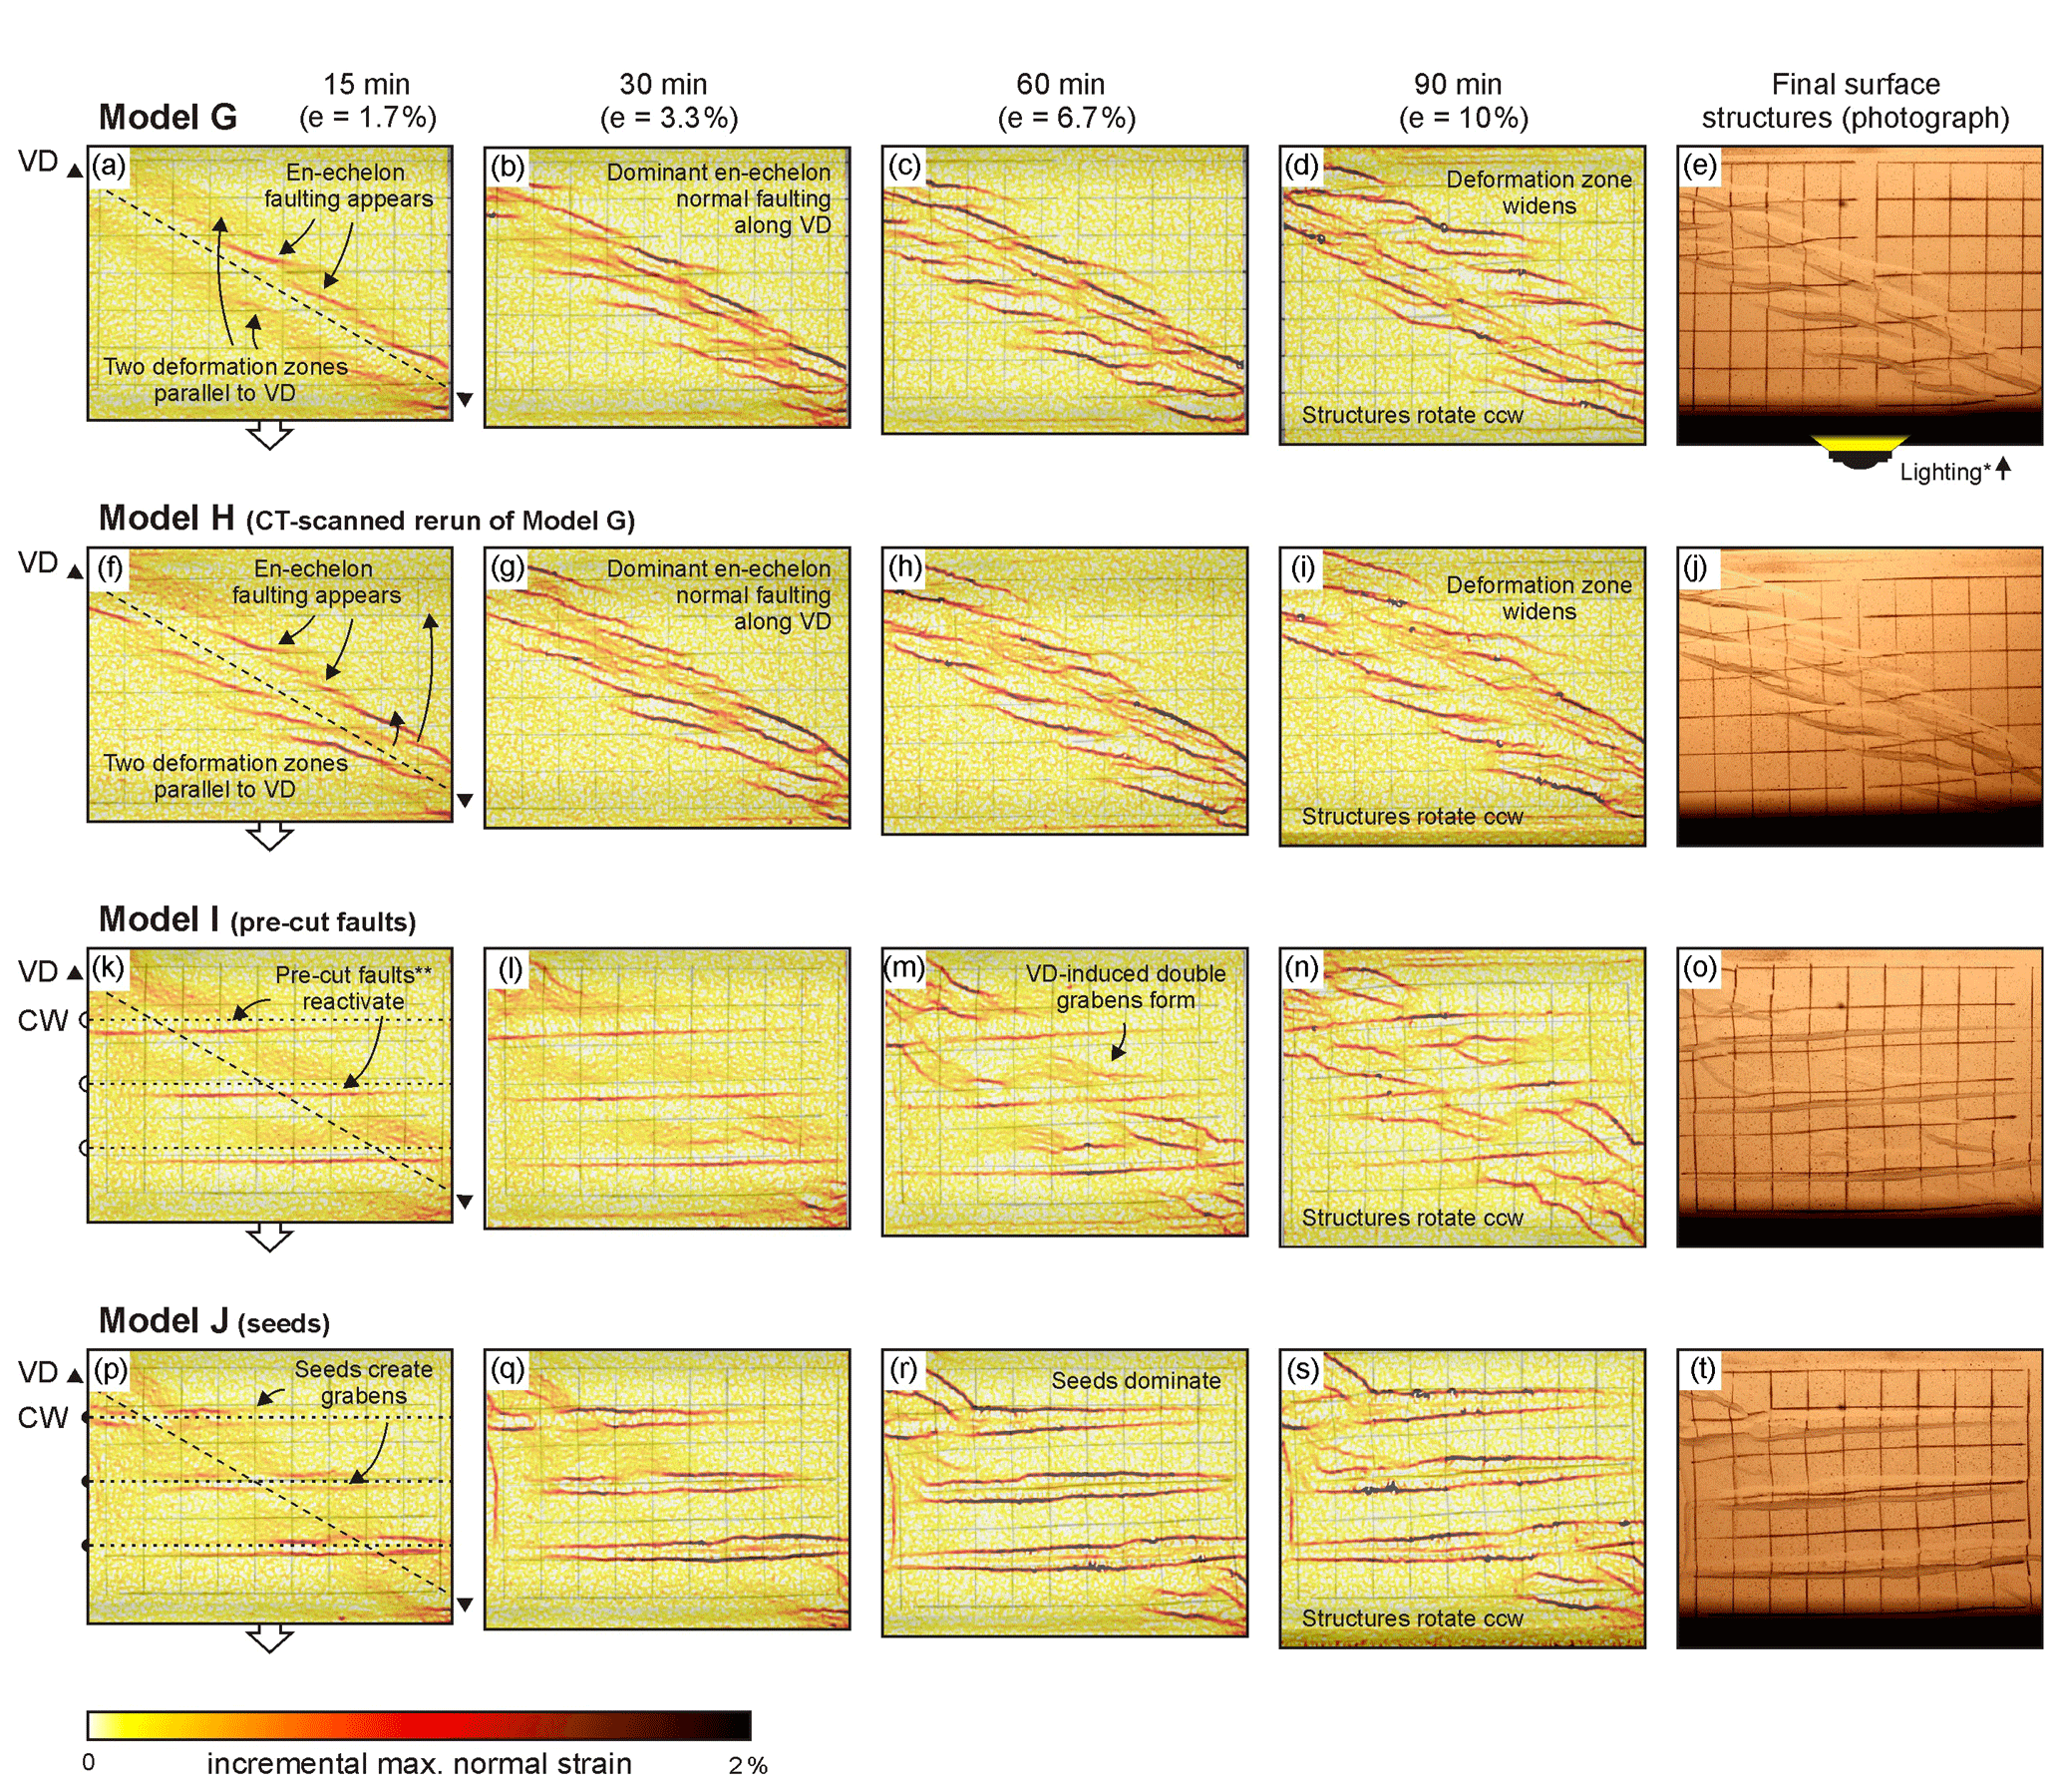
Figure 5Incremental maximum normal strain maps of models G–J from Sub-series 2.1 (with 30∘ oblique VD and model axis-parallel crustal weaknesses in the brittle cover, if applied) obtained through PIV analysis, taken as a proxy of fault activity. The increments for PIV analysis were 1 min, i.e. every 0.33 mm of extension. The original model map-view pictures are visible in the background. The right-hand column depicts the model surface at the end of each experiment. VD: velocity discontinuity. CW: (simulated) crustal weakness. ccw: counter-clockwise. ∗ Shadows cast by one-sided lighting allowing a better visualization of the final surface structures. The location of the pre-cut faults at the base of the sand layer are indicated, the offset of their surface expression is due to their inclination (Fig. 1b).
Introducing crustal weaknesses in Models I and J strongly affected the subsequent rift structures by segmenting them and by taking up significant amounts of deformation (Fig. 5k–t), even more so than in Sub-series 1.1. We found that the pre-cut faults in Model I strongly localized deformation, so much so that the reactivated pre-cut faults overprint the model surface structures (Fig. 5k–o). Note that these faults (similarly to Model B; Fig. 2f–j) did not develop symmetric grabens but half-grabens as only a single boundary fault was present (Fig. 5l–o). Yet, we also observed the early development of VD-parallel deformation zones and eventually of a double graben structure between the dominant pre-cut faults (Fig. 5k–o). Applying seeds as crustal weaknesses in Model J localized deformation even more, to the point that almost no features related to the VD were present (Fig. 5p–t). This contrasts with the observations from our Sub-series 1.1 models, in which the VD-(sub-)parallel grabens remained well-developed at all times (Figs. 2–3). Furthermore we observed a general counter-clockwise rotation in map view in Models G-J (Fig. 5d, e, i, j, n, o, s, t).
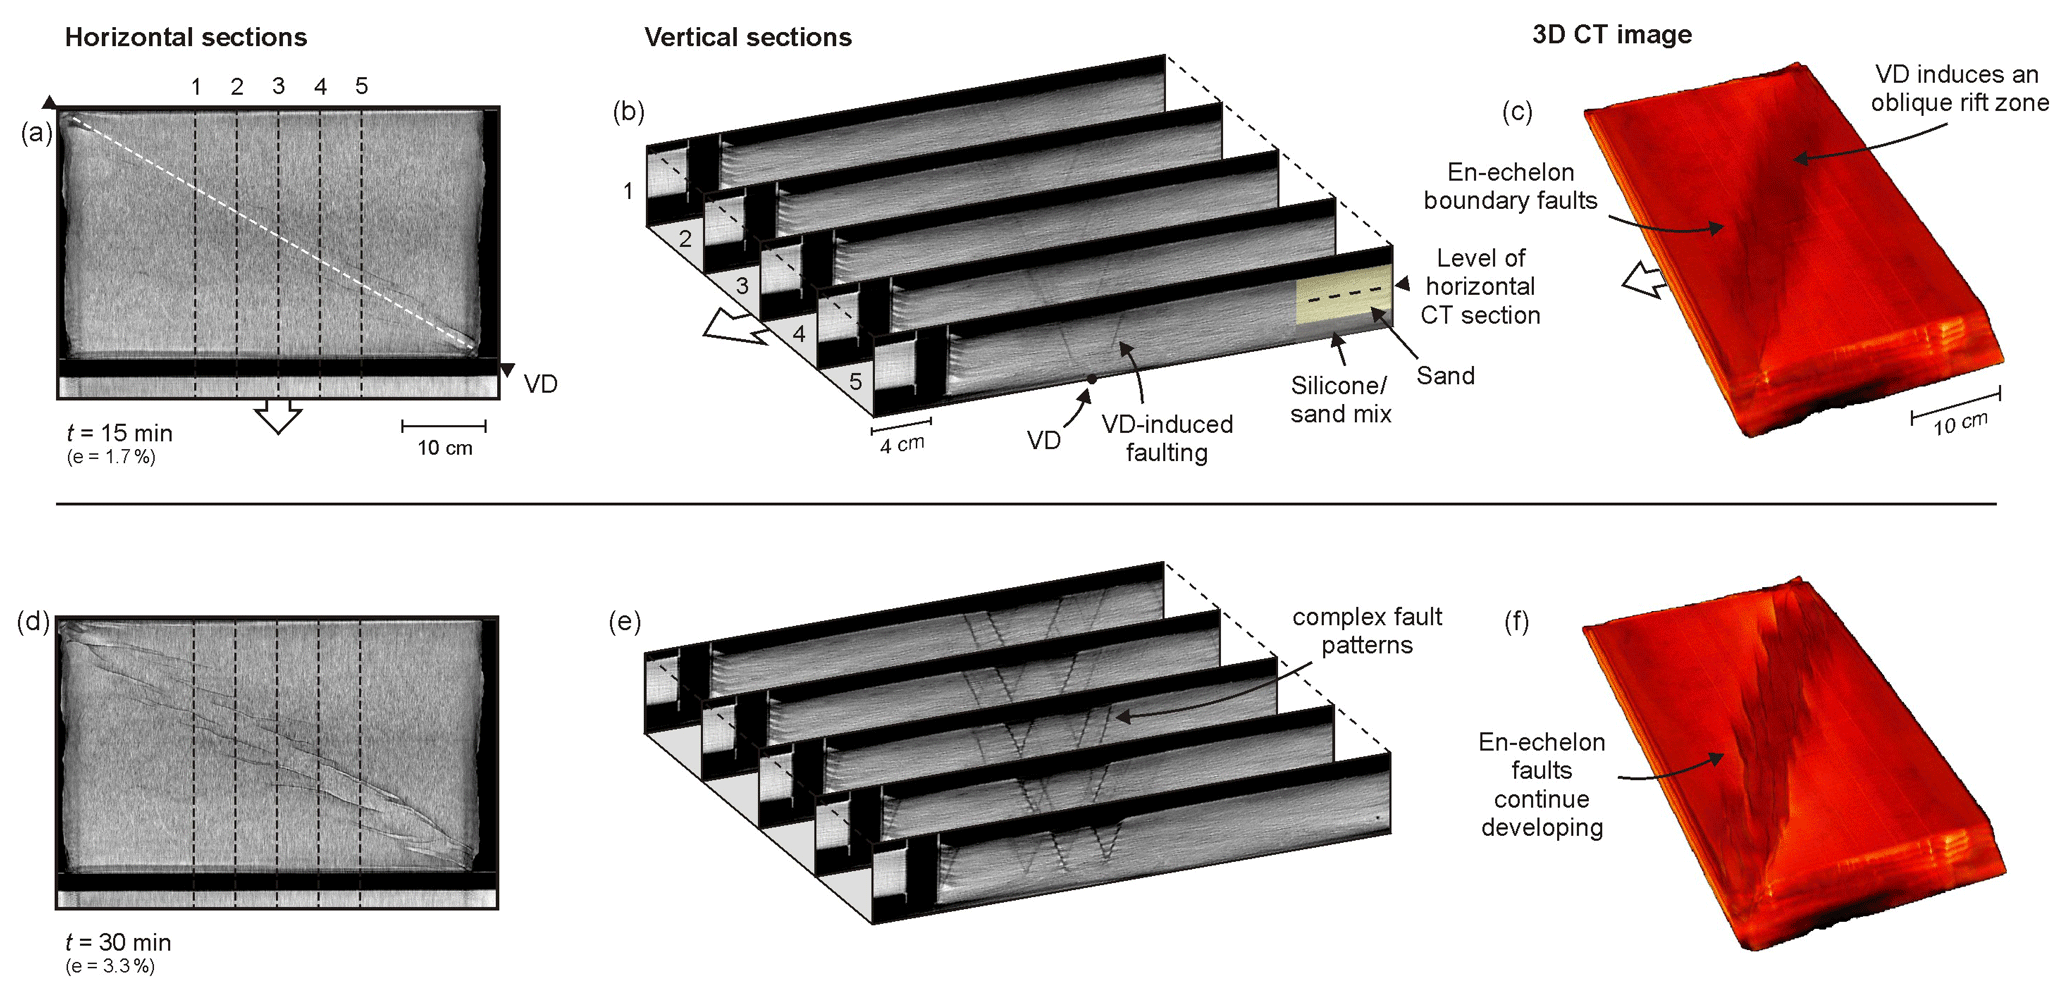
Figure 6CT analysis of Model H (30∘ oblique VD, no crustal weaknesses simulated, CT-scanned rerun of Model G). (a, d) Horizontal sections through the brittle layer. (b, e) Serial cross sections. (c, f) 3D CT images. Note that the colours in these images represent CT-scanning intensities and are not to be interpreted as a measure of model surface altitude.
The results from the additional models with a −30∘ oblique VD highlight the effect of seed orientation on the final model structure in this type of experiment (Model K, its CT-scanned rerun Model L, and Model M; Figs. 7 and 8). Model K, with a −30∘ oblique series of seeds, developed a VD-parallel deformation zone and a series of right-stepping en échelon double grabens following the VD trend, intersected and apparently offset by a second series of smaller grabens that developed along the seeds (Fig. 7a–j). These smaller seed-induced grabens appeared later on the strain maps than the grabens forming above the model axis-parallel seeds in Model J (Fig. 5p–t), and the initial stage of Model K was rather similar to Models G and H (30∘ oblique VD but without simulated crustal weaknesses; Figs. 5a, f, 7a). As the deformed grid of the final surface images revealed, the normal faults in Model K had a moderate oblique slip component (Fig. 7e). Model L had the same set-up as Model K, but no high-resolution photographs of this CT-scanned rerun of Model K were available for similarly detailed PIV analysis. However, the PIV results (and final surface structures) match the general features described for Model K (Fig. 7a–j).
Despite the lack of PIV resolution, the CT images of Model L revealed the early evolution of this segmentation and the associated complex internal structure (Fig. 8). We found that even if the PIV analysis did not show clear faulting along the seeds after 5 mm of extension (e=1.7 %), the CT sections reveal that the seeds already started localizing deformation (Fig. 8a, b), but not to a sufficient degree to appear on the surface strain maps (Fig. 7a, f). As the model run continued, the CT data show the evolution of increasingly complex (interacting) fault systems that became challenging to visualize by vertical CT sections but are reasonably distinct on horizontal CT sections and well defined in 3D CT images (Fig. 8d–f).
Finally, Model M showed how, in a set-up in which both the VD and seeds are 30∘ oblique, highly linear grabens developed instead of the en échelon basins observed in Models G and H without seeds (Figs. 5a–j, 7k–o). In contrast to the previous models with an oblique VD, Model M did not develop a double deformation zone parallel to the VD during the initial stage of deformation; instead only a single deformation zone appeared after 5 mm of extension (e=1.7 %, Fig. 7k). As the model continued deforming, this deformation zone evolved into a large graben structure, flanked by additional grabens induced by the seeds that already localized in the earlier phase of the model run (Fig. 7k–o). As with Models K and L, the deformed surface grid indicated a minor oblique slip component (Fig. 7e, j, o).
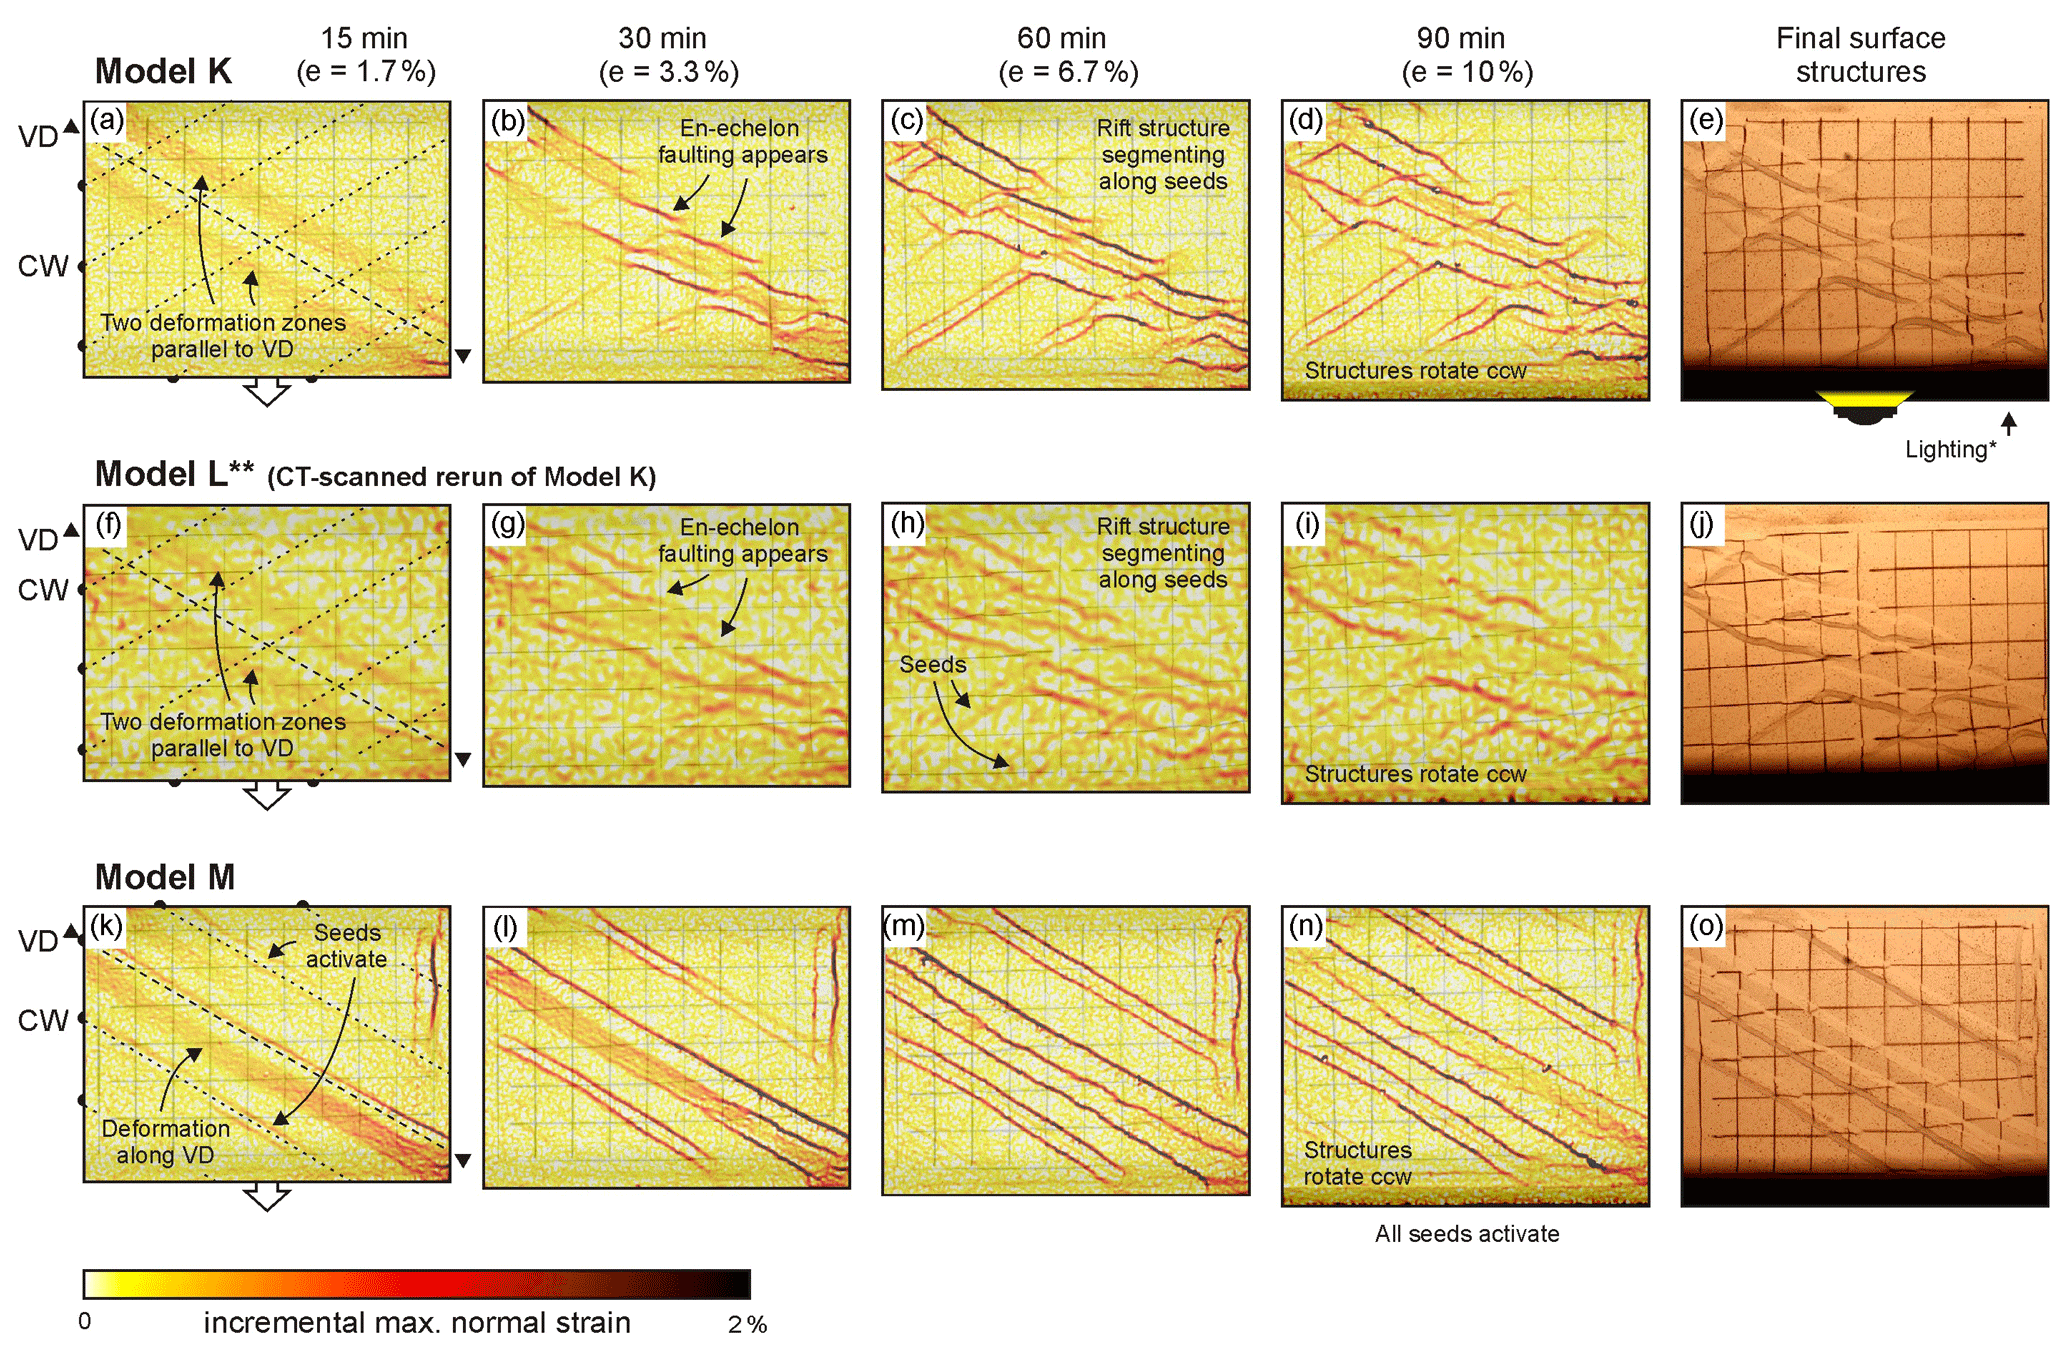
Figure 7Incremental maximum normal strain maps of models K–M from Sub-series 2.2 (with 30∘ oblique VD and oblique seeds in the brittle cover) obtained through PIV analysis, taken as a proxy of fault activity. The increments for PIV analysis were 1 min, i.e. every 0.33 mm of extension. The original model map-view pictures are visible in the background. The right-hand column depicts the model surface at the end of each experiment. Note that Model M includes a crustal weakness (seed) above and parallel to the VD. VD: velocity discontinuity. CW: (simulated) crustal weakness. ccw: counter-clockwise. ∗ Shadows cast by one-sided lighting allowing a better visualization of the final surface structures. Due to technical issues, the PIV analysis of Model L is less detailed.
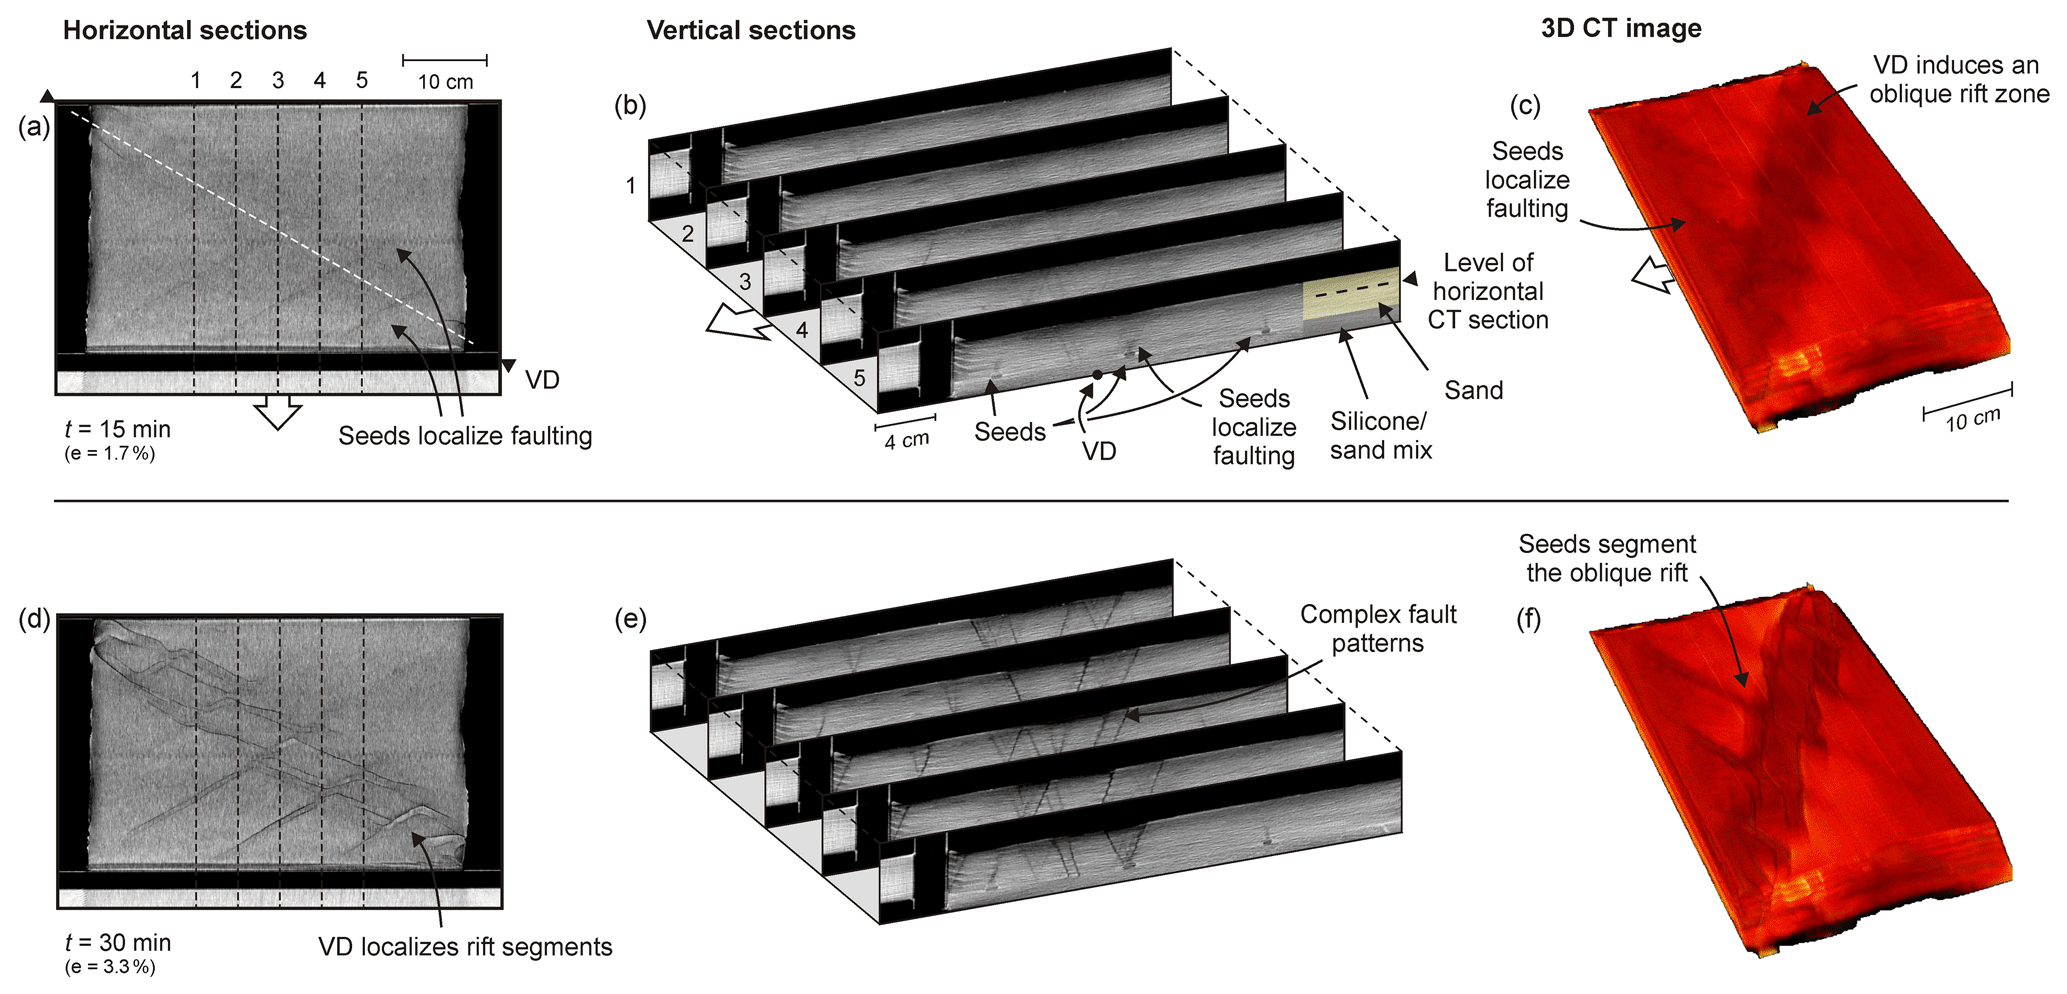
Figure 8CT analysis of Model L (30∘ oblique VD, −30∘ oblique seeds, CT-scanned rerun of Model K). (a, d) Horizontal sections through the brittle layer. (b, e) Serial cross sections. (c, f) 3D CT images. Note that the colours in these images represent CT-scanning intensities and are not to be interpreted as a measure of model surface altitude.
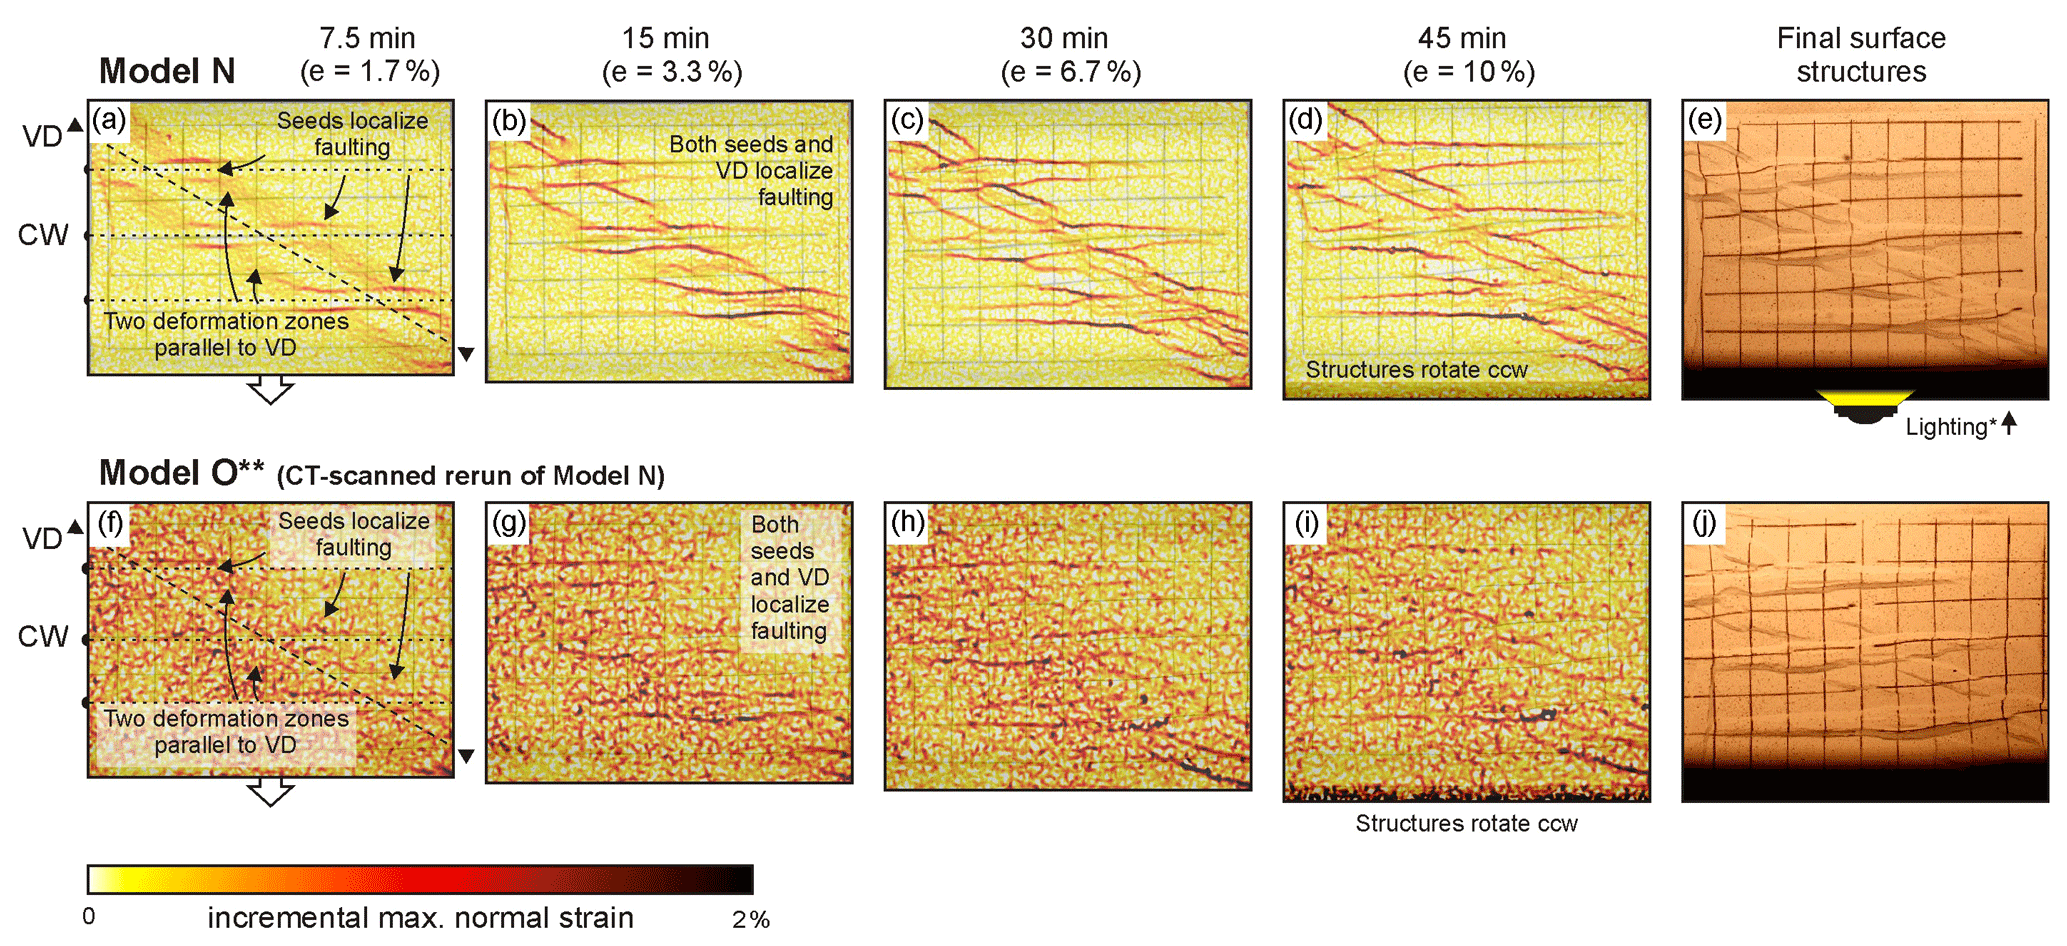
Figure 9Incremental maximum normal strain maps of models N and O from Sub-series 2.3 (with 30∘ oblique VD, model axis-parallel weaknesses in the brittle cover and a double extension velocity of 40 mm/h; compare to reference models G and H, Fig. 5a–j) obtained through PIV analysis, taken as a proxy of fault activity. The increments for PIV analysis were 1 min, i.e. every 0.33 mm of extension. The original models map-view pictures are visible in the background. The right-hand column depicts the model surface at the end of each experiment. VD: velocity discontinuity. CW: (simulated) crustal weakness. ccw: counter-clockwise. ∗ Shadows cast by one-sided lighting allowing a better visualization of the final surface structures. Due to technical issues, the PIV analysis of Model O is less detailed.
3.4 Analysis of Sub-series 2.3 experiments: impact of the extension velocity
Besides the orientation of simulated mantle and crustal weaknesses, the extension velocity is an important factor affecting rift evolution, as shown by Sub-series 2.3 Models N and O (where Model O is a CT-scanned rerun of Model N; Fig. 9). In both these models we use the same set-up as Model J, with the difference that the extension velocity in Models N and O was twice as high as in Model J (40 mm/h instead of the standard 20 mm/h; Figs. 5p–t, 9). As a result, we found that the seed-induced grabens became less dominant in favour of the VD-parallel deformation zones and the subsequent double graben structures along the VD (Figs. 5p–t, 9). The VD-related structures were even better developed than in Model I, which had only pre-cut faults (Figs. 5k–o, 9). As the high-velocity models evolved, a general counter-clockwise rotation occurred, similar to the other models (Fig. 9d, e, i, j). Although the resolution of the PIV analysis results from Model O is reduced due to technical issues, they support the general impression obtained from Model N (Fig. 9).
The CT imagery of Model O reveals its early internal evolution associated with the complex interaction between the VD-induced and seed-controlled rift structures (Fig. 10). Similar to the PIV results, CT imagery also shows that the early evolution of Model O was characterized by discrete faulting above the seeds after 5 mm of extension (e=1.7 %), together with more distributed deformation along a central rift zone parallel to the VD (Figs. 9, 10a–c). As deformation continued, deformation along the VD also localized faulting (Fig. 10d–f). After 20 mm of extension (e=6.7 %), a clear series of double grabens was visible on both sides of the VD, interrupted by the seed-parallel grabens (Fig. 10g–i).
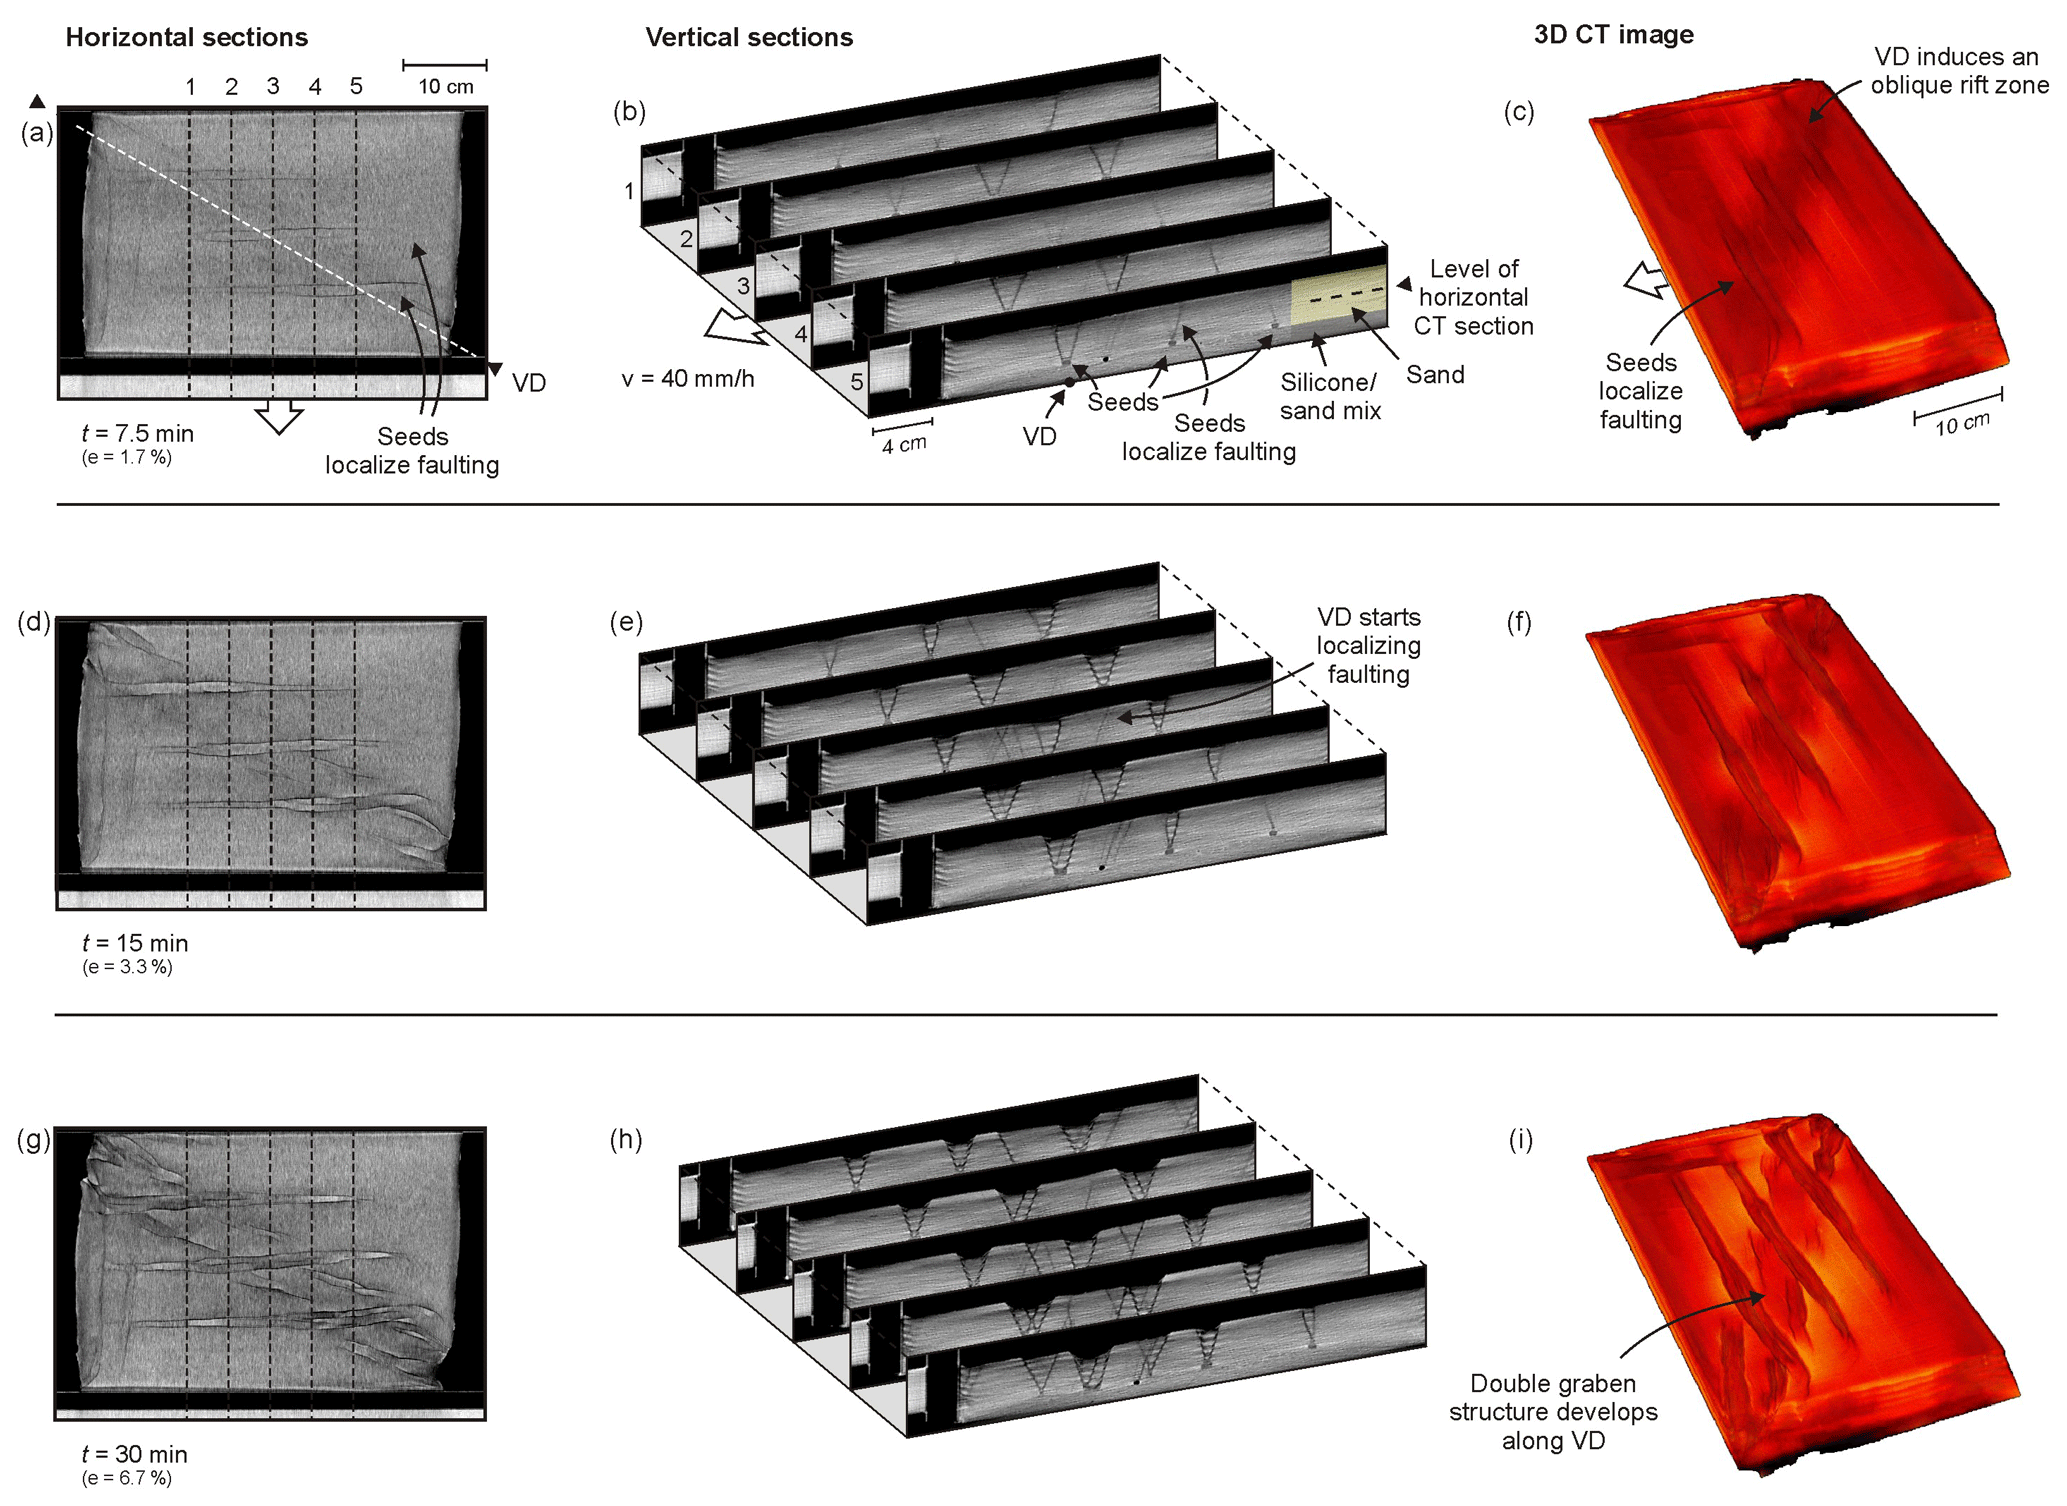
Figure 10CT analysis of Model O (30∘ oblique VD, model axis-parallel seeds, doubled extension velocity, CT-scanned rerun of Model N). (a, d, g) Horizontal sections through the brittle layer. (b, e, h) Serial cross sections. (c, f, i) 3D CT images. Note that the colours in these images represent scanning intensities and are not to be interpreted as a measure of model surface altitude.
4.1 Summary of model results
The results of our brittle–viscous analogue models illustrate the effects of differently oriented mantle and crustal weaknesses on rift structures, as well as the effects of extension velocity (Fig. 11). Firstly, the general orientation of the VD (mantle weakness), when no seeds or pre-cuts were present, had a clear impact on subsequent rift structures (Fig. 11a–c). We found that when the VD was aligned with the model axis and oriented orthogonally to the general extension direction, it initially induced two deformation zones parallel to the VD (Fig. 11a, b). These deformation zones subsequently localized normal faulting in a double graben structure, and the horizontal distances between these grabens were larger in models with a thicker viscous layer (Fig. 11b). An obliquely oriented VD also created two initial deformation zones parallel to the VD (Fig. 11c), but in contrast to models with a VD parallel to the model axis, the 30∘ oblique VD induced a subsequent series of en échelon grabens, which partially aligned to be sub-perpendicular to the direction of regional extension (Fig. 11a–c). All oblique VD models also registered a slight counter-clockwise rotation along the VD.
Adding different types of structures that simulate inherited crustal weaknesses to the brittle layer had an important effect on rift development. The model results illustrate that the pre-cut faults, which were characterized by a weakening of the sand layer by ca. 16 % (difference in friction coefficient; Sect. 2.2 and Table 1), partially overprinted and segmented the general deformation zone and subsequent double graben pattern associated with the VD (Fig. 11d, e). This overprinting and segmentation was even more pronounced in the models with viscous seeds, which represented a weakening of the sand layer by 44 % (Zwaan et al., 2020), therefore more strongly localizing deformation and faulting in the brittle layer (Fig. 11f–j).
The orientation of the simulated weaknesses with respect to both the regional extension direction and other weaknesses had an important effect on their subsequent (re-)activation (Fig. 11d–k). Both the VD and modelled crustal weaknesses had the strongest influence when they were oriented orthogonally to the direction of regional extension, the ideal setting for normal fault development (Fig. 11d–j). When either the VD or simulated crustal weaknesses were oriented obliquely to the regional extension direction, they had less control on the resulting rift. Yet when the VD and the simulated crustal weaknesses were parallel to each other, both effectively localize deformation, even when they were oriented obliquely to the direction of regional extension (Fig. 11j). However, the final structures of these models with VD-parallel crustal weaknesses were very different from the structures in the reference models with no crustal weaknesses at all; while en échelon faults sub-orthogonal to the extension direction eventually form in models with only a VD, no grabens develop sub-orthogonal to the extension direction when both crustal weaknesses and mantle VD are parallel and at an angle with the extension direction (compare Fig. 11c and j).
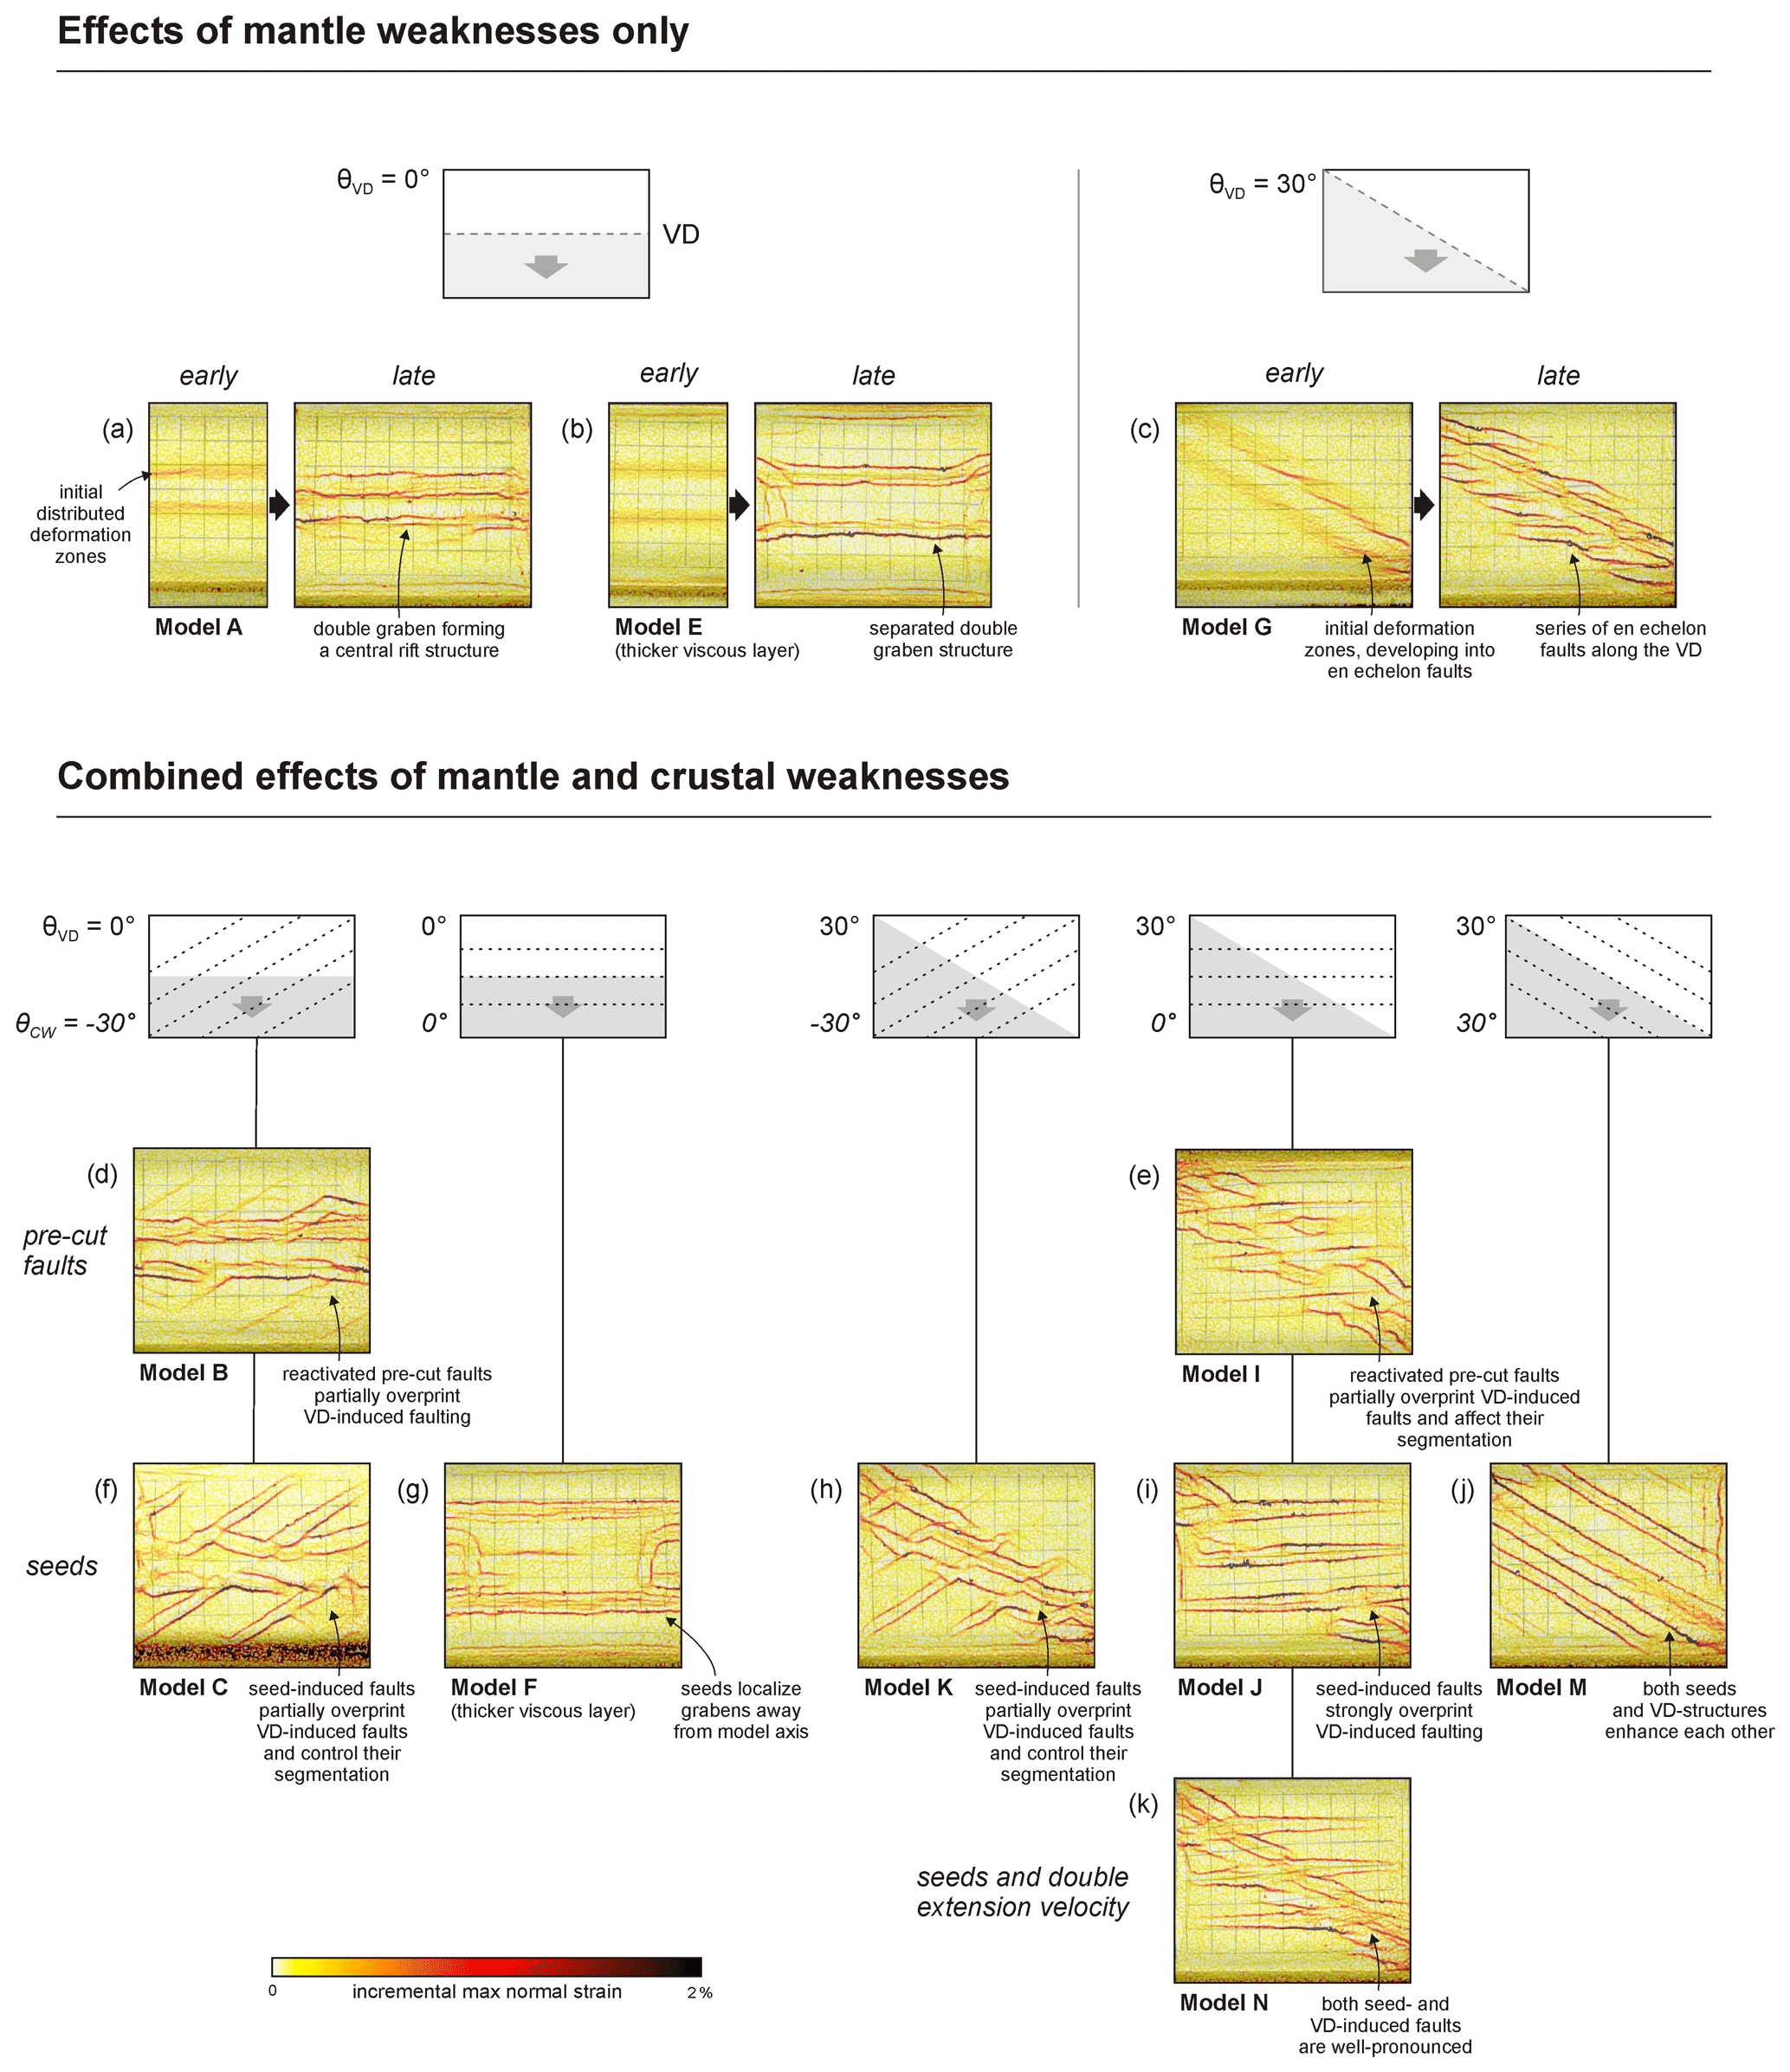
Figure 11Summary of model results (PIV-derived incremental maximum normal strain) as a function of mantle discontinuity geometry, as well as type and geometry of crustal weakness, and extension velocity. The top views represent the incremental deformation during the final model stage (e=10 %), as well as during the initial model stage (e=1.6 %) in (a–c). Angle θVD provides the orientation of the VD (velocity discontinuity, representing a mantle weakness), whereas angle θCW provides the angle of the simulated crustal weaknesses (see Fig. 1c–f for definitions).
Both the VD and the simulated crustal weaknesses localized deformation from the start of the model runs, but in different ways. Simulated crustal weaknesses usually dominate in the early stages of extension, while VD deformation trends appear later at the surface, once the strain from the VD has been transferred through the viscous layer into the sand cover. The resulting deformation is first diffuse but may later evolve into well-marked (offset) fault zones and grabens (Figs. 5–10, 11d–j, 12a). By contrast, the pre-cuts and seeds directly induced localized deformation in the shape of faulting (Figs. 5–10, 11d–j).
Furthermore, faster extension enhanced the influence of the VD on rift structure development (Fig. 11k). Increasing the extension velocity caused enhanced coupling between the base plate and the overlying materials. Hence the VD can overprint the otherwise dominant control of the seeds in these models (compare Fig. 11i and k). Conversely, slower extension rates should have the opposite effect, increasing the influence of weaknesses in the sand layer on the development of rift structures.
4.2 Comparison with previous analogue and numerical studies
The results from our models with only a VD are very much in line with previous analogue and numerical modelling work. The double graben systems in our orthogonal extension models (Fig. 11a, b) reflect the double grabens observed by, for example, Tron and Brun (1991), Michon and Merle (2000, 2003), Dyksterhuis et al. (2007) and Zwaan et al. (2019) (Fig. 12a, b). These double graben structures are due to the development of two shallow-dipping shear zones in the viscous layer that have their origin at the VD (Michon and Merle, 2003; Zwaan et al., 2019). Where these VD-induced shear zones reach the brittle cover layer they cause the development of a graben. This viscous shear zone also explains the wider spacing between both grabens in the model with a thicker viscous layer; assuming a constant dip angle, the shear zone transfers deformation farther away from the VD (Figs. 11a, b, 12a, b). This viscous shear zone effect also occurs when the VD orientation is oblique to the extension direction, but here the early deformation zones are overprinted by en échelon faults that are sub-perpendicular to the extension direction (Fig. 11c). Such en échelon fault structures are typical for oblique extension systems and are reported in numerous analogue modelling studies (with or without base plate set-ups) and numerical work (e.g. Tron and Brun, 1991; McClay and White, 1995; Bonini et al., 1997; Clifton et al., 2000; Van Wijk 2005; Agostini et al., 2009; Autin et al., 2010; Corti et al., 2013; Brune and Autin, 2013; Philippon and Corti, 2016; Duclaux et al., 2020), but it should be noted that the right-stepping en échelon arrangement of the fault in our models with a 30∘ oblique VD would become a left-stepping arrangement in the mirrored case, i.e. with a −30∘ oblique VD. These studies also registered the general (counter-clockwise) rotation observed in our oblique VD models. Furthermore, the final en échelon double rift structure that developed in our oblique VD models (Fig. 11c) is found in analogue models with oblique mantle weaknesses by Autin et al. (2013) as well.
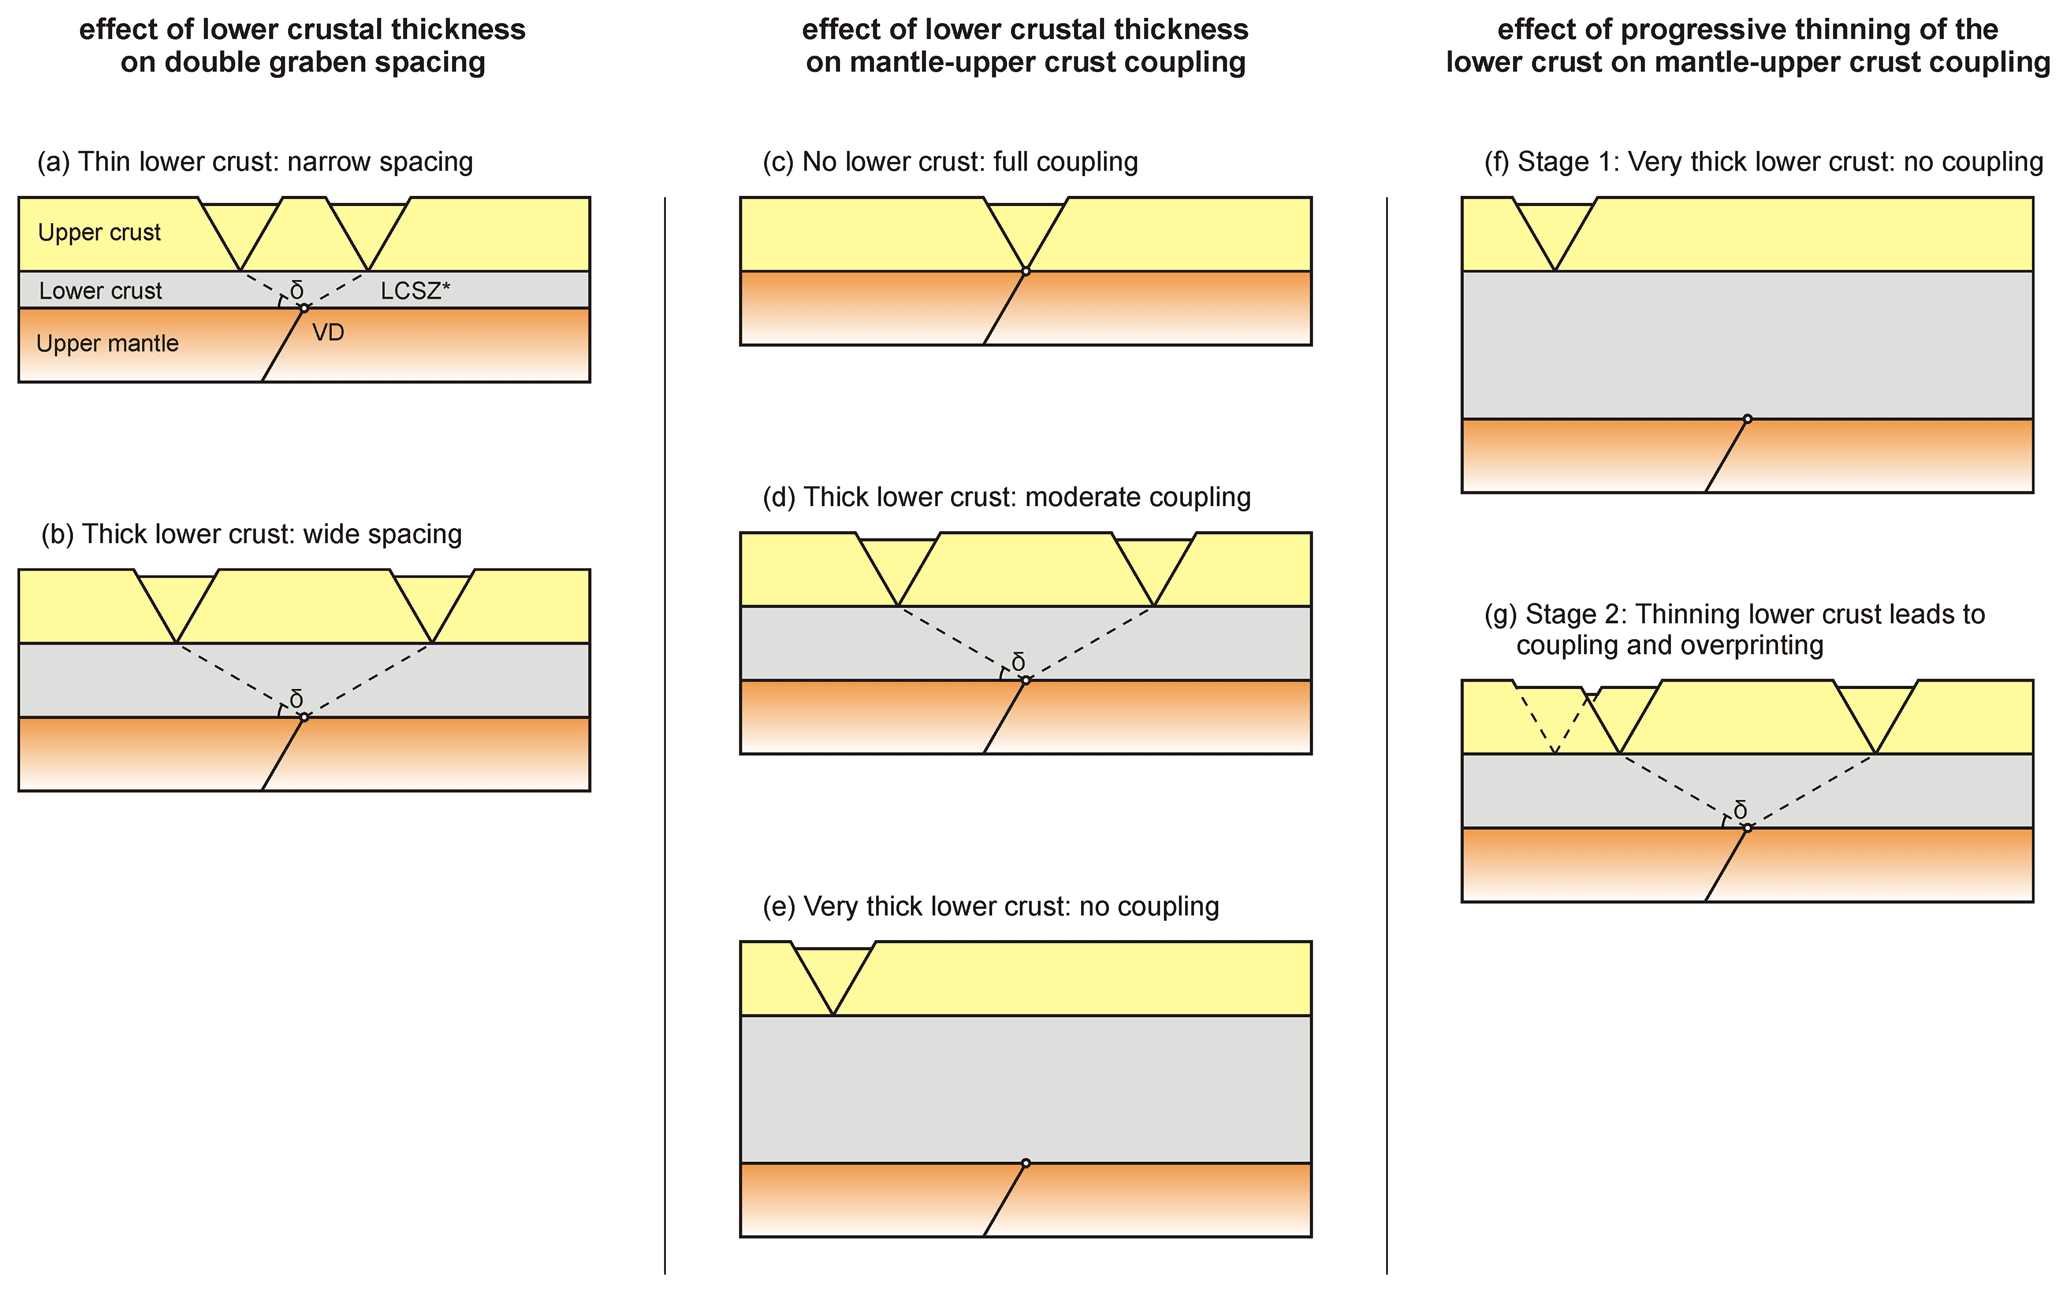
Figure 12Schematic 2D sketches depicting how lower crustal thickness variations may affect rift structures. (a–b) A thicker lower crust widens the spacing between double grabens related to lower crustal shear zones (LCSZ) originating from a mantle shear zone simulated by a velocity discontinuity (VD) in our models. (c–e) The degree of coupling between the mantle and crust is strongly affected by lower crustal thickness: the thicker the lower the crust, the less coupling occurs. When no coupling occurs, deformation in the upper crust can localize along crustal weaknesses only (e.g. Zwaan et al., 2019). Note, however, that coupling is also affected by extension velocity (e.g. Brun, 1999; Zwaan et al., 2019; see Models J and N, Fig. 11i, k. (f–g) Progressive thinning of the lower crust during rifting may cause a previously decoupled system to become coupled, so that previous upper crustal weakness-controlled structures may be overprinted by mantle-weakness controlled structures. * The LCSZ dip angle (δ) is considered to be constant in all cases.
The varying impacts of the different types of crustal weaknesses on rift structures concur with previous models. For example, Wang et al. (2021) show how the amount of extension in a previous deformation phase determines the magnitude of the inherited weaknesses. In their analogue models, smaller amounts of previous extension (e = ca. 4 %) leads to less defined structures that have less effect on deformation during a subsequent deformation phase, whereas greater initial extension (e = ca. 12 %) leads to more developed structures that are more likely to be reactivated and control subsequent faulting. Henza et al. (2011) described a very similar relation between initial deformation and reactivation. The pre-cut faults in our models would then correspond to a first phase with less developed inherited structures only mildly affecting subsequent faulting (Fig. 11d, e), whereas the seeds in our models have much more impact and would represent the second option involving more developed structural inheritance (Fig. 11f–j). A similar effect of different grades of weakness seems to occur in the numerical rifting models of Dyksterhuis et al. (2007), although these models are more focused on the effects of large-scale weaknesses on general rift style (wide versus narrow rifting; see also Brun, 1999).
The decreasing influence of a crustal or mantle weakness as it is oriented more obliquely to the extension direction is also observed in previous analogue and numerical models. For instance, the studies by McClay and White (1995), Bellahsen and Daniel (2005), Henza et al. (2011), Zwaan and Schreurs (2017), Deng et al. (2018), Heron et al. (2019), Molnar et al. (2019) and Maestrelli et al. (2020) show that a linear weakness that is (sub-)parallel to the extension direction is unlikely to be reactivated, and if such a structure is reactivated it takes up less deformation than a structure oriented more obliquely to the extension direction. Note, however, that a VD can always force (some) deformation in the overlying model materials (e.g. Acocella et al., 1999; Dauteuil et al., 2002). However, when both types of model weaknesses are parallel, even when orientated obliquely to the extension direction, localization of deformation was enhanced along both weaknesses, simply because the total “lithospheric” weakness is more pronounced (Fig. 11j). This mutual enhancement is also seen in the numerical models by Heron et al. (2019). It is furthermore important to stress that in our models with oblique weaknesses only, these weaknesses account for all deformation, and no structures orthogonal to the regional direction of extension occur (Fig. 11h, j). Although these oblique structures resemble standard grabens bounded by normal faults at first sight, they underwent some oblique slip. As far as we are aware, most of these complex features resulting from interacting oblique structures presenting crustal and mantle weaknesses have not been described in previous modelling studies.
However, the respective roles of mantle weaknesses, represented by the VD, and simulated crustal weaknesses in our Models C and D are in line with the observations from the analogue modelling work by Molnar et al. (2020), but we explore a much broader parameter space. Molnar et al. (2020) show that a broad viscous weak zone simulating a thermal mantle anomaly (having a similar function to the VD in our models, i.e. mimicking a mantle weakness), has a dominant effect during orthogonal rifting, whereas 30∘ obliquely oriented crustal weaknesses (seeds) only have a secondary influence, even though they still sufficiently localize deformation to segment or partition the rift structure. These results are highly consistent with our observations from Models C and D that had a very similar set-up (Figs. 2k–t, 3, 11f). However, we went a step further by testing various other crustal and mantle weakness orientations and found that the simulated mantle weakness may not always affect surface structures during the early stages of progressive rifting, likely due to decoupling, a factor that is also present in the 2D numerical models described by Chenin and Beaumont (2013).
Our models also show that the extension velocity affects the degree of coupling between the mantle (VD) and the overlying materials. When extension is fast, the rheology of the viscous layer above the VD becomes more rigid (e.g. Brun, 1999; Zwaan et al., 2019). As a result of this enhanced rigidity, the viscous layer no longer acts as a decoupling layer as it would if extension were slower. Now the viscous layer can directly transfer deformation into the sand layer, strongly localizing deformation along the VD and over-ruling the otherwise dominant control of the seeds (Fig. 11k). Conversely, a decreased extension velocity would decouple overlying layers from the VD, allowing more influence from the seeds (Fig. 12e). This decoupling may be similar to the tectonic situation simulated numerically by Liao and Gerya (2015).
Finally, the results of our models that include differently oriented simulated mantle and crustal weaknesses bear resemblance to previous analogue models involving multi-phase extension with changing extension directions (Fig. 11d–k), but this resemblance does not stand up to scrutiny upon closer inspection. Although these previous studies produce different rift orientations and complex rift segmentation structures (e.g. Bonini et al., 1997; Henza et al., 2010, 2011; Withjack et al., 2017; Ghosh et al., 2020; Wang et al., 2021), a very important contrast is that these differently oriented rifts or normal faults were formed and active at different times in the evolution of the model, whereas the differently oriented rifts in our models were generally active during most of the model evolution (Figs. 2–10).
4.3 Model strengths and limitations
Although our models provide important insights into the influence of and interaction between a mantle and crustal weaknesses, there are inherent limitations. For example, we did not include syn-rift sedimentation. However, the lack of syn-rift sedimentation is not expected to have a significant influence on early rifting since accommodation space is limited (Zwaan et al., 2018a). Similarly, no thermal effects, magmatism or isostatic effects of the mantle were simulated, which is permissible, as these are not considered to be important during the early evolution of a rift zone. The same is true for the constant extension direction and extension velocity in our models, which may vary during the long-term evolution of a rift system (e.g. Brune et al., 2016) but can be considered constant during early rifting.
Our models cannot go beyond the initial stage of continental rifting; no thermal effects, phase changes, continental break-up and oceanic spreading can be simulated. Although some analogue modellers have successfully simulated more advanced rift stages (e.g. Brun and Beslier, 1996; Molnar et al., 2017; Khalil et al., 2020), numerical methods are currently more suitable for such late-stage rift modelling (e.g. Brune et al., 2016; Liao and Gerya, 2015; Tetreault and Buiter, 2018; Wenker and Beaumont, 2018; Chenin et al., 2019). Directly comparing our simple analogue models with these more complex numerical models is therefore challenging.
However, the relative simplicity of our model set-up has the benefit of allowing us to clearly distinguish the effects of specific parameters on the subsequent rift structures. Furthermore, our results provide detailed information on internal and external deformation in our models through the unique application of CT imagery and high-resolution PIV analysis. This combination of techniques allows for an unprecedented detailed analogue model analysis, revealing the complexity of model evolution that is not readily captured by directly observing top-view images.
4.4 Implications for interpreting natural rift systems
Our analogue model results may have important implications for the interpretation of natural rift systems in which inherited structural weaknesses are present. In particular, the results show that differently oriented crustal and mantle weaknesses can simultaneously localize deformation to create complex rift arrangements with different structural orientations, including the segmentation into individual grabens, as for instance reported in the North Sea (e.g. Erratt et al., 1999; Fossen et al., 2016; Phillips et al., 2019) (Fig. 11). At first sight, the complex rift structures observed at the final stage of the model runs (similar to current-day field observations; see right-hand columns in Figs. 2, 4, 5, 7, 9) would often seem to suggest a multiphase rifting history with a changing extension direction to explain the different fault set orientations, in line with previous analogue modelling work (e.g. Bonini et al., 1997; Withjack et al., 2017; Ghosh et al., 2020; Wang et al., 2021). Such changing extension directions have been invoked to explain the current state of various similarly complex natural examples in East Africa and in the North Sea Rift (e.g. Roberts et al., 1990; Bonini et al., 1997; Erratt et al., 1999, 2010, and references therein). Yet our models confirm the idea put forward by Reeve et al. (2015) that such complex rift structures can also form during a single continuous rift phase with a constant extension direction. This means that a multiphase rift evolution involving different extension directions is not always required to explain different structural orientations in rift basins.
Moreover, our model results indicate that the type of weakness as well as its orientation with respect to the regional extension direction is important. Studies of various natural examples confirm that not all inherited weaknesses present in a system need to reactivate (e.g. Wilson 1966; Bell et al., 2014; Phillips et al., 2016; Schiffer et al., 2020; Wang et al., 2021, and references therein), and the observation that normal faults do not need to be (sub-)perpendicular to the regional extension direction (Fig. 11h, j) confirms the idea that structural orientations themselves might not always be reliable indicators for inferring past extension directions (e.g. Philippon et al., 2015; Morley, 2010; Reeve et al., 2015). These important insights derived from our models suggest that we may need to reassess the tectonic history of various complex rift structures in the North Sea Rift or the East African Rift. In particular, attention should be dedicated to detailed fault activity analysis such as that recently performed by Claringbould et al. (2017, 2020), Phillips et al. (2019) and Samsu et al. (2019) in order to distinguish whether important changes in extension direction did occur.
A further model observation useful for the interpretation of natural rifts are the effects of coupling between the simulated mantle and crust. As shown in our model, such coupling is a function of extension velocity but also depends on the thickness and viscosity of the ductile lower crust (e.g. Brun, 1999; Zwaan et al., 2019, Figs. 11i, k, 12c–e). It follows that decoupling between the mantle and crustal layers in natural settings may cause the effect of mantle weaknesses to be less apparent during the early stages of extension (Fig. 12e, f). Hence crustal weaknesses can dominate the rift structure arrangement at the surface during early rift stages. Conversely, strong coupling between the mantle and crustal layers may overrule the effect of any crustal weaknesses if a weak heterogeneity exists in the stronger upper mantle (Chenin and Beamont, 2013; Zwaan et al., 2019, Fig. 12c). We would like to highlight that these small but significant details would also be hard to distinguish when interpreting the final model stage, or a natural example. A further important possibility is that the general thinning of the lower crust during initial rifting (or changes in extension velocity, e.g. Brune et al., 2018) may cause increased coupling over time (Sutra et al., 2013), so that initially dominant crustal weaknesses may be overprinted by mantle influences as rifting progresses (Fig. 12f, g).
In this paper we presented a series of brittle–viscous analogue models to study how differently oriented mantle and crustal weaknesses may interact and affect rift development. Our model results bring us to the following conclusions:
In the absence of simulated crustal weaknesses, the modelled rift system is governed by the velocity discontinuity or VD representing a mantle weakness. The resulting structure is a rift zone parallel to the VD. In the case of a VD that is orthogonal to the extension direction, this rift zone consists of large, normal faults striking perpendicular to the extension direction. In contrast, an oblique VD leads to en échelon normal faulting at an angle to both the VD and the extension direction.
Simulated crustal weaknesses can (partially) overprint and partition the general rift structure developing along the VD in various sub-grabens. The larger the decrease in strength due to these crustal weaknesses with respect to the undisturbed brittle layer, the larger their control on the resulting rift pattern. In general, crustal weaknesses localize faulting first, after which the VD-induced faults develop and interfere.
The orientation of the simulated mantle or crustal weaknesses with respect to the extension direction has a significant impact on its reactivation. A weakness that is oriented orthogonally to the extension direction is likely to localize normal faulting, whereas an oblique weakness is less likely to do so. Yet if mantle and crustal weaknesses are parallel, they might amplify each other's effect, and if both weaknesses are oblique, no faulting orthogonal to the extension direction may occur. As a result, structural orientations are not always indicative of past extension directions.
The coupling between the mantle and the overlying crustal layers determines the relative influence of the crustal and mantle weakness (VD) on rift evolution. When coupling is strong (e.g. due to fast extension), the VD is the dominant weakness, whereas crustal weaknesses become more impactful when coupling is low. Coupling may vary over time due to progressive thinning of the lower crustal layer, as well as due to variations in extension velocity, so that early structures controlled by crustal weaknesses can be overprinted by later mantle-controlled structures.
Most importantly, our models show that crustal and mantle weaknesses with different orientations can both simultaneously produce rift structures. This means that in order to explain different structural orientations in rift basins, multiphase extension is not always required. These findings, together with the observation that structural trends should not always reflect past extension directions, provide a strong incentive to reassess the tectonic history of various natural examples.
Images and videos of the models, including PIV analysis results and CT imagery, are freely available in a data publication stored by GFZ Data Services (Zwaan et al., 2021, https://doi.org/10.5880/fidgeo.2021.020).
All authors were involved in the conceptualization of the project. FZ developed the modelling methodology; completed the investigation, formal analysis and visualization; and wrote the original draft. All authors were involved in the review and editing of the text. GS organized the acquisition of funding and resources.
The authors declare that they have no conflict of interest.
We thank Nicole Schwendener for her assistance during the CT-scanning process, and to Timothy Schmid, Michael Rudolf, Matthias Rosenau and the software engineers from LaVision (Dave Hollis, Horst Nagel and Torsten Siebert) for technical support during the PIV analysis in DaVis. We are also grateful to Kirsten Elger for her help in creating the GFZ data publication containing the supplementary material (Zwaan et al., 2021), and we thank editor Zoe Mildon as well as Thomas Phillips and an anonymous reviewer for providing constructive feedback. This research was funded by the Swiss National Science Foundation (grant 200021-178731, http://p3.snf.ch/Project-178731, last access: 29 June 2021), which also covered the open-access publication costs.
This research has been supported by the Schweizerischer Nationalfonds zur Förderung der Wissenschaftlichen Forschung (grant no. 178731).
This paper was edited by Zoe Mildon and reviewed by Thomas Phillips and one anonymous referee.
Acocella, V., Facenna, C., Funiciello, R., and Rosetti, F.: Sand-box modelling of basement-controlled transfer zones in extensional domains, Terra Nova, 11, 149–156, https://doi.org/10.1046/j.1365-3121.1999.00238.x, 1999.
Adam, J., Urai, J. L., Wieneke, B., Oncken, O., Pfeiffer, K., Nukowski, N., Lohrmann, J., Hoth, S., Van der Zee, W., and Schmatz, J.: Shear localisation and strain distribution during tectonic faulting – new insights from granular-flow experiments and high-resolution optical image correlation techniques, J. Struct. Geol., 27, 283–301, https://doi.org/10.1016/j.jsg.2004.08.008, 2005.
Agostini, A., Corti, G., Zeoli, A., and Mulugeta, G.: Evolution, pattern, and partitioning of deformation during oblique continental rifting: Inferences from lithospheric-scale centrifuge models, Geochem. Geophy. Geosy., 10, Q11015, https://doi.org/10.1029/2009GC002676, 2009.
Agostini, A., Bonini, M., Corti, G., Sani, F., and Mazzarini, F.: Fault architecture in the Main Ethiopian Rift and comparison with experimental models: Implications for rift evolution and Nubia-Somalia kinematics, Earth Planet. Sc. Lett., 301, 479–492, https://doi.org/10.1016/j.epsl.2010.11.024, 2011.
Allemand, P. and Brun, J.-P.: Width of continental rifts and rheological layering of the lithosphere, Tectonophysics, 27, 283–301, https://doi.org/10.1016/0040-1951(91)90314-I, 1991.
Autin, J., Bellahsen, N., Husson, L., Beslier, M.-O., Leroy, S., and d'Acremont, E.: Analog models of oblique rifting in a cold lithosphere, Tectonics, 29, TC6016, https://doi.org/10.1029/2010TC002671, 2010.
Autin, J., Bellahsen, N., Leroy, S., Husson, L., Beslier, M.-O., and d'Acremont, E.: The role of structural inheritance in oblique rifting: Insights from analogue models and application to the Gulf of Aden, Tectonophysics, 607, 51–64, https://doi.org/10.1016/j.tecto.2013.05.041, 2013.
Bell, R. E., Jackson, C. A.-L., Whipp, P. S., and Clements, B.: Strain migration during multiphase extension: observations from the northern North Sea, Tectonics, 33, 1936–1963, https://doi.org/10.1002/2014TC003551, 2014.
Bellahsen, N. and Daniel, J. M.: Fault reactivation control on normal fault growth: an experimental study, J. Struct. Geol., 27, 769–780, https://doi.org/10.1016/j.jsg.2004.12.003, 2005.
Bonini, M., Souriot, T., Boccaletti, M., and Brun, J.-P.: Successive orthogonal and oblique extension periodes in a rift zone: Laboratory experiments with application to the Ethiopian Rift, Tectonics, 16, 347–362, https://doi.org/10.1029/96TC03935, 1997.
Boutelier, D., Schrank, C., and Regenauer-Lieb, K.: 2-D finite displacements and strain from particle imaging velocimetry (PIV) analysis of tectonic analogue models with TecPIV, Solid Earth, 10, 1123–1139, https://doi.org/10.5194/se-10-1123-2019, 2019.
Braun, J., Chéry, J., Poliakov, A., Mainprice, D., Vauchez, A., Tomassi, A., and Daignières, M.: A simple parameterization of strain localization in the ductile regime due to grain size reduction: A case study for olivine, J. Geophys. Res.-Sol. Ea., 104, 25167–25181, https://doi.org/10.1029/1999JB900214, 1999.
Brun, J.-P.: Narrow rifts versus wide rifts: inferences for the mechanics of rifting from laboratory experiments, Philos. T. Roy. Soc. A, 357, 695–712, https://doi.org/10.1098/rsta.1999.0349, 1999.
Brun, J.-P. and Beslier, M. O.: Mantle exhumation at passive margins, Earth Planet. Sc. Lett., 142, 161–173, https://doi.org/10.1016/0012-821X(96)00080-5, 1996.
Brun, J.-P. and Tron, V.: Development of the North Viking Graben: inferences from laboratory modelling, Sediment. Geol., 86, 31–51, https://doi.org/10.1016/0037-0738(93)90132-O, 1993.
Brune, S. and Autin, J.: The rift to break-up evolution of the Gulf of Aden: Insights from 3D numerical lithospheric-scale modelling, Tectonophysics, 607, 65–79, https://doi.org/10.1016/j.tecto.2013.06.029, 2013.
Brune, S., Williams, S. E., Butterworth, N. P., and Müller, R. M.: Abrupt plate accelerations shape rifted continental margins, Nature, 536, 201–204, https://doi.org/10.1038/nature18319, 2016.
Buck, R. W.: Models of Continental Lithospheric Extension, J. Geophys. Res.-Sol. Ea., 96, 20161–20178, https://doi.org/10.1029/91JB01485, 1991.
Burov, E. B.: Rheology and strength of the lithosphere, Mar. Petrol. Geol., 28, 1402–1443, https://doi.org/10.1016/j.marpetgeo.2011.05.008, 2011.
Burov, E. B. and Watts, A. B.: The long-term strength of continental lithosphere: “jelly sandwich” or “crème brûlée”?, GSA Today, 16, 4–10, https://doi.org/10.1130/1052-5173(2006)016<4:tltSOc>2.0.cO;2, 2006.
Byerlee, J.: Friction of Rocks, Pure Appl. Geophys., 116, 615–626, https://doi.org/10.1007/BF00876528, 1978.
Carlo AG: Carlo Bernasconi AG webpage, available at: https://www.carloag.ch, last access: 29 June 2021.
Chenin, P. and Beaumont, C.: Influence of offset weak zones on the development of rift basins: Activation and abandonment during continental extension and breakup, J. Geophys. Res.-Sol. Ea., 118, 1698–1720, https://doi.org/10.1002/jgrb.50138, 2013.
Chenin, P., James, S., Lavier, L. L., Manatschal, G., Picazo, S., Müntener, O., Karner, G. D., Figueredo, P. H., and Johnson, C.: Impact of mafic underplating and mantle depletion on subsequent rifting: A numerical modeling study, Tectonics, 38, 2185–2207, https://doi.org/10.1029/2018TC005318, 2019.
Claringbould, J. S., Bell, R. E., Jackson, C. A.-L., Gawthorpe, R. L., and Odinsen, T.: Pre-existing normal faults have limited control on the rift geometry of the northern North Sea, Earth Planet. Sc. Lett., 475, 190–206, https://doi.org/10.1016/j.epsl.2017.07.014, 2017.
Claringbould, J. S., Bell, R. E., Jackson, C. A.-L., Gawthorpe, R. L., and Odinsen, T.: Pre-breakup extension in the northern North Sea defined by complex strain partitioning and heterogeneous extension rates, Tectonics, 39, e2019TC005924, https://doi.org/10.1029/2019TC005924, 2020.
Clifton, A. E., Schlische, R. W., Withjack, M. O., and Ackermann, R. V.: Influence of rift obliquity on fault-population systematics: results of experimental clay models, J. Struct. Geol., 22, 1491–1509, https://doi.org/10.1016/S0191-8141(00)00043-2, 2000.
Colletta, B., Letouzey, J., Pinedo, R., Ballard, J. F., and Balé, P.: Computerized X-ray tomography analysis of sandbox models: Examples of thin-skinned thrust systems, Geology, 16, 1063–1067, https://doi.org/10.1130/0091-7613(1991)019<1063:CXRTAO>2.3.CO;2, 1991.
Corti, G.: Evolution and characteristics of continental rifting: Analog modeling-inspired view and comparison with examples from the East African Rift System, Tectonophysics, 522–523, 1–33, https://doi.org/10.1016/j.tecto.2011.06.010, 2012.
Corti, G., Philippon, M., Sani, F., Keir, D., and Kidane, T.: Re-orientation of the extension direction and pure extensional faulting at oblique rift margins: comparison between the Main Ethiopian Rift and laboratory experiments, Terra Nova, 25, 396–404, https://doi.org/10.1111/ter.12049, 2013.
Dauteuil, O., Bourgeois, O., and Mauduit, T.: Lithosphere strength controls oceanic transform zone structure: insights from analogue models, Geophys. J. Int., 150, 706–714, https://doi.org/10.1046/j.1365-246X.2002.01736.x, 2002.
Deng, C., Gawthorpe, R. L., Fossen, H., and Finch, E.: How does the orientation of a preexisting basement weakness influence fault development during renewed rifting? Insights from three-dimensional discrete element modeling, Tectonics, 37, 2221–2242, https://doi.org/10.1029/2017TC004776, 2018.
Dèzes, P., Schmid, S. M., and Ziegler, P. A.: Evolution of the European Cenozoic Rift System: interaction of the Alpine and Pyrenean orogens with their foreland lithosphere, Tectonophysics, 389, 1–33, https://doi.org/10.1016/j.tecto.2004.06.011, 2004.
Duclaux, G., Huismans, R. S., and May, D. A.: Rotation, narrowing, and preferential reactivation of brittle structures during oblique rifting, Earth Planet. Sc. Lett., 531, 115952, https://doi.org/10.1016/j.epsl.2019.115952, 2020.
Dyksterhuis, S., Rey, P., Müller, R. D., and Moresi, L.: Effects of initial weakness on rift architecture, Geol. Soc. Spec. Publ., 282, 443–455, https://doi.org/10.1144/SP282.18, 2007.
Erratt, D., Thomas, G. M., and Wall, G. R. T.: The evolution of the Central North Sea Rift, Petroleum Geology Conference Series 5, Geological Society, London, UK, 63–82, https://doi.org/10.1144/0050063, 1999.
Erratt, D., Thomas, G. M., Hartley, N. R., Musum, R., Nicholson, P. H., and Spisto, Y.: North Sea hydrocarbon systems: some aspects of our evolving insights into a classic hydrocarbon province, Petroleum Geology Conference Series 7, Geological Society, London, UK, 37–56, https://doi.org/10.1144/0070037, 2010.
Fossen, H., Khani, H. F., Faleide, J. I., Ksienzyk, A. K., and Dunlap, W. J.: Post-Caledonian extension in the West Norway–northern North Sea region: the role of structural inheritance, Geological Society, London, UK, 439, 465–486, https://doi.org/10.1144/SP439.6, 2016.
Ghosh, N., Hatui, K., and Chattopadhay, A.: Evolution of fault patterns within a zone of pre-existing pervasive anisotropy during two successive phases of extensions: an experimental study, Geo-Mar. Lett., 40, 53–74, https://doi.org/10.1007/s00367-019-00627-6, 2020.
Handin, J.: On the Coulomb-Mohr Failure Criterion, J. Geophys. Res., 74, 5343–5348, https://doi.org/10.1029/JB074i022p05343, 1969.
Henza, A. A., Withjack, M. O., and Schlische, R. W.: Normal-fault development during two phases of non-coaxial extension: An experimental study, J. Struct. Geol., 32, 1656–1667, https://doi.org/10.1016/j.jsg.2009.07.007, 2010.
Henza, A. A., Withjack, M. O., and Schlische, R. W.: How do the properties of a pre-existing normal-fault population influence fault development during a subsequent phase of extension?, J. Struct. Geol., 33, 1312–1324, https://doi.org/10.1016/j.jsg.2011.06.010, 2011.
Heron, P. J., Pysklywec, R. N., and Stephenson, R.: Lasting mantle scars lead to perennial plate tectonics, Nat. Commun., 7, 11834, https://doi.org/10.1038/ncomms11834, 2016.
Heron, P. J., Peace, A. L., McCaffrey, K. J. W., Welford, J. K., Wilson, R., van Hunen, J., and Pysklywec, R. N.: Segmentation of Rifts Through Structural Inheritance: Creation of the Davis Strait, Tectonics, 38, 2411–2430, https://doi.org/10.1029/2019TC005578, 2019.
Hubbert, M. K.: Theory of scale models as applied to the study of geologic structures, Geol. Soc. Am. Bull., 48, 1459–1520, https://doi.org/10.1130/GSAB-48-1459, 1937.
Jaeger, J. C. and Cook, N. G. W.: Fundamentals of Rock Mechanics, Chapman & Hall, London, UK, Wiley, New York, USA, https://doi.org/10.1017/CBO9780511735349, 535 pp., 1979.
Khalil, H. M., Capitanio, F. A., Betts, P. G., and Cruden, A. R.: 3-D analog modeling constraints on rifting in the Afar region, Tectonics, 39, e2020TC006339, https://doi.org/10.1029/2020TC006339, 2020.
Krabbendam, M.: When the Wilson Cycle breaks down: how orogens can produce strong lithosphere and inhibit their future reworking, Geol. Soc. Spec. Publ., 184, 57–75, https://doi.org/10.1144/GSL.SP.2001.184.01.04, 2001.
Le Calvez, J. H. and Vendeville, B. C.: Experimental designs to model along-strike fault interaction, in: Analogue modelling of large-scale tectonic processes, edited by: Schellart, W. and Passchier, C. W., Electronic Edition, Journal of the Virtual Explorer, The Virtual Explorer Pty. Ltd., Conder, Australia, 1–17, https://doi.org/10.3809/jvirtex.2002.00043, 2002.
Liao, J. and Gerya, T.: From continental rifting to seafloor spreading: Insight from 3D thermo-mechanical modeling, Gondwana Res., 28, 1329–1343, https://doi.org/10.1016/j.gr.2014.11.004, 2015.
Maestrelli, D., Montanari, D., Corti, G., Del Ventisette, C., Moratti, G., and Bonini, M.: Exploring the interactions between rift propagation and inherited crustal fabrics through experimental modeling, Tectonics, 39, e2020TC006211, https://doi.org/10.1029/2020TC006211, 2020.
McClay, K. R. and White, M. J.: Analogue modelling of orthogonal and oblique rifting, Mar. Petrol. Geol., 12, 137–151, https://doi.org/10.1016/0264-8172(95)92835-K, 1995.
Michon, L. and Merle, O.: Crustal structures of the Rhinegraben and the Massif Central grabens: An experimental approach, Tectonics, 19, 896–904, https://doi.org/10.1029/2000TC900015, 2000.
Michon, L. and Merle, O.: Mode of lithospheric extension: Conceptual models from analogue modeling, Tectonics, 22, 1028, https://doi.org/10.1029/2002TC001435, 2003.
Molnar, N. E., Cruden, A. R., and Betts, P. G.: Interactions between propagating rotational rifts and linear rheological heterogeneities: Insights from three-dimensional laboratory experiments, Tectonics, 36, 420–443, https://doi.org/10.1002/2016TC004447, 2017.
Molnar, N. E., Cruden, A. R., and Betts, P. G.: Unzipping continents and the birth of microcontinents, Geology, 46, 451–454, https://doi.org/10.1130/G40021.1, 2018.
Molnar, N. E., Cruden, A. R., and Betts, P. G.: Interactions between propagating rifts and linear weaknesses in the lower crust, Geosphere, 15, 1617–1640, https://doi.org/10.1130/GES02119.1, 2019.
Molnar, N. E., Cruden, A. R., and Betts, P. G.: The role of inherited crustal and lithospheric architecture during the evolution of the Red Sea: Insights from three dimensional analogue experiments, Earth Planet. Sc. Lett., 544, 116377, https://doi.org/10.1016/j.epsl.2020.116377, 2020.
Morley, C. K.: Stress re-orientation along zones of weak fabrics in rifts: An explanation for pure extension in “oblique” rift segments?, Earth Planet. Sc. Lett., 297, 667–673, https://doi.org/10.1016/j.epsl.2010.07.022, 2010.
Morley, C. K., Nelson, R. A., Patton, T. L., and Munn, S. G.: Transfer Zones in the East African Rift System and Their Relevance to Hydrocarbon Exploration in Rifts (1), AAPG Bull., 74, 1234–1253, https://doi.org/10.1306/0C9B2475-1710-11D7-8645000102C1865D, 1990.
Mulugeta, G.: Squeeze box in a centrifuge, Tectonophysics, 148, 323–335, https://doi.org/10.1016/0040-1951(88)90139-4, 1988.
Naylor, M. A., Laroque, J. M., and Gauthier, B. D. M.: Understanding extensional tectonics: insights from sandbox models, in: International Symposium on Geodynamic Evolution of Sedimentary Basins, Moscow, Russia, 18–23 May 1992, 69–83, https://www.osti.gov/etdeweb/biblio/399440 (last access: 29 June 2021), 1994.
Nelson, R. A., Patton, T. L., and Morley, C. K.: Rift-Segment Interaction and Its Relation to Hydrocarbon Exploration in Continental Rift Systems (1), AAPG Bull., 76, 1153–1169, https://doi.org/10.1306/BDFF898E-1718-11D7-8645000102C1865D, 1992.
Panien, M., Schreurs, G., and Pfiffner, A.: Mechanical behaviour of granular materials used in analogue modelling: insights from grain characterisation, ring-shear tests and analogue experiments, J. Struct. Geol., 28, 1710–1724, https://doi.org/10.1016/j.jsg.2006.05.004, 2006.
Philippon, M. and Corti, G.: Obliquity along plate boundaries, Tectonophysics, 693, 171–182, https://doi.org/10.1016/j.tecto.2016.05.033, 2016.
Philippon, M., Willingshofer, E., Sokoutis, D., Corti, G., Sani, F., Bonini, M., and Cloetingh, S.: Slip re-orientation in oblique rifts, Geology, 43, 147–150, https://doi.org/10.1130/G36208.1, 2015.
Phillips, T. B., Jackson, C. A., Bell, R. E., Duffy, O. B., and Fossen, H.: Reactivation of intrabasement structures during rifting: A case study from offshore southern Norway, J. Struct. Geol., 91, 54–73, https://doi.org/10.1016/j.jsg.2016.08.008, 2016.
Phillips, T. B., Fazlikhani, H., Gawthorpe, R. L., Fossen, H., Jackson, C. A.-L., Bell, R. E., Faleide, J. I., and Rotevatn, A.: The influence of structural inheritance and multiphase extension on rift development, the northern North Sea, Tectonics, 38, 4099–4126, https://doi.org/10.1029/2019TC005756, 2019.
Ramberg, H.: Gravity, Deformation and the Earth's Crust, Academic Press, London, UK, 1981.
Ring, U.: The influence of preexisting structure on the evolution of the Cenozoic Malawi rift (East African rift system), Tectonics, 13, 313–326, https://doi.org/10.1029/93TC03188, 1994.
Roberts, A. M., Yielding, G., and Badley, M. E.: A kinematic model for the orthogonal opening of the late Jurassic North Sea rift system, Denmark-mid Norway, in: Tectonic Evolution of the North Sea Rifts, edited by: Blundell, D. J. and Gibbs, A. D., Oxford University Press, Oxford, UK, 180–199, https://doi.org/10.1017/S0016756800020094, 1990.
Rudolf, M., Boutelier, D., Rosenaus, M., Schreurs, G., and Oncken, O.: Rheological benchmark of silicone oils used for analog modeling of short- and long-term lithospheric deformation, Tectonophysics, 684, 12–22, https://doi.org/10.1016/j.tecto.2015.11.028, 2016.
Samsu, A., Cruden, A. R., Hall, M., Micklethwaite, S., and Denyszyn, S. W.: The influence of basement faults on local extension directions: Insights from potential field geophysics and field observations, Basin Res., 31, 782–807, https://doi.org/10.1111/bre.12344, 2019.
Saria, E., Calais, E., Stamps, D. S., Delvaux, D., and Hartnady, C. J. H.: Present-day kinematics of the East African Rift, J. Geophys. Res.-Sol. Ea., 119, 3584–3600, https://doi.org/10.1002/2013JB010901, 2014.
Schori, M., Zwaan, F., Schreurs, G., and Mosar, J.: Pre-existing basement faults controlling deformation in the Jura Mountains fold-and-thrust belt: insights from analogue models, Tectonophysics, 228980, https://doi.org/10.1016/j.tecto.2021.228980, online first, 2021.
Schreurs, G., Hänni, R., Panien, M., and Vock, P.: Analysis of analogue models by helical X-ray computed tomography, Geol. Soc. Spec. Publ., 215, 213–223, https://doi.org/10.1144/GSL.SP.2003.215.01.20, 2003.
Sutra, E., Manatschal, G., Mohn, G., and Unternehr, P.: Quantification and restoration of extensional deformation along the Western Iberia and Newfoundland rifted margins, Geochem. Geophy. Geosy., 14, 2575–2597, https://doi.org/10.1002/ggge.20135, 2013.
Tetreault, J. L. and Buiter, S. J. H.: The influence of extension rate and crustal rheology on the evolution of passive margins from rifting to break-up, Tectonophysics, 746, 155–172, https://doi.org/10.1016/j.tecto.2017.08.029, 2018.
Tomassi, A., Knoll, M., Vauchez, A., Signorelli, J. W., Thoraval, C., and Logé, R.: Structural reactivation in plate tectonics controlled by olivine crystal anisotropy, Nat. Geosci., 2, 423–427, https://doi.org/10.1038/ngeo528, 2009.
Tong, H., Koyi, H., Huang, S., and Zhao, H.: The effect of multiple pre-existing weaknesses on formation and evolution of faults in extended sandbox models, Tectonophysics, 626, 197–212, https://doi.org/10.1016/j.tecto.2014.04.046, 2014.
Tron, V. and Brun, J.-P.: Experiments on oblique rifting in brittle-ductile systems, Tectonophysics, 188, 71–84, https://doi.org/10.1016/0040-1951(91)90315-J, 1991.
Twiss, R. J. and Moore, E. M.: Structural Geology, W. H. Freeman and Company, New York, USA, 544 pp., 1992.
Wang, L., Maestrelli, D., Corti, G., Zou, Y., and Shen, C.: Normal fault reactivation during multiphase extension: analogue models and application to the Turkana Depression, East Africa, Tectonophysics, 811, 228870, https://doi.org/10.1016/j.tecto.2021.228870, 2021.
Weijermars, R. and Schmeling, H.: Scaling of Newtonian and non-Newtonian fluid dynamics without inertia for quantitative modelling of rock flow due to gravity (including the concept of rheological similarity), Phys. Earth Planet. In., 43, 316–330, https://doi.org/10.1016/0031-9201(86)90021-X, 1986.
Wenker, S. and Beaumont, C.: Can metasomatic weakening result in the rifting of cratons?, Tectonophysics, 746, 3–21, https://doi.org/10.1016/j.tecto.2017.06.013, 2018.
Wilson, J. T.: Did the Atlantic Close and then Re-Open?, Nature, 211, 676–681, https://doi.org/10.1038/211676a0, 1966.
Withjack, M. O. and Jamison, W. R.: Deformation produced by oblique rifting, Tectonophysics, 126, 99–124, https://doi.org/10.1016/0040-1951(86)90222-2, 1986.
Withjack, M. O., Henza, A. A., and Schlische, R. W.: Three-dimensional fault geometries and interactions within experimental models of multiphase extension, AAPG Bull., 101, 1767–1789, https://doi.org/10.1306/02071716090, 2017.
Yamasaki, T., O'Reilly, B., and Readman, P.: A rheological weak zone intensified by post-rift thermal relaxation as a possible origin of simple shear deformation associated with reactivation of rifting, Earth Planet. Sc. Lett., 248, 134–146, https://doi.org/10.1016/j.epsl.2006.05.019, 2006.
Zwaan, F. and Schreurs, G.: How oblique extension and structural inheritance influence rift segment interaction: Insights from 4D analog models, Interpretation, 5, SD119–SD138, https://doi.org/10.1190/INT-2016-0063.1, 2017.
Zwaan, F., Schreurs, G., Naliboff, J., and Buiter, S. J. H.: Insights into the effects of oblique extension on continental rift interaction from 3D analogue and numerical models, Tectonophysics, 693, 239–260, https://doi.org/10.1016/j.tecto.2016.02.036, 2016.
Zwaan, F., Schreurs, G., and Adam, J.: Effects of sedimentation on rift segment evolution and rift interaction in orthogonal and oblique extensional settings: Insights from analogue models analysed with 4D X-ray computed tomography and digital volume correlation techniques, Global Planet. Change, 171, 110–133, https://doi.org/10.1016/j.gloplacha.2017.11.002, 2018a.
Zwaan, F., Schreurs, G., Gentzmann, R., Warsitzka, M., and Rosenau, M.: Ring-shear test data of quartz sand from the Tectonic Modelling Lab of the University of Bern (CH), GFZ Data Services, https://doi.org/10.5880/fidgeo.2018.028, 2018b.
Zwaan, F., Schreurs, G., Ritter, M., Santimano, T., and Rosenau, M.: Rheology of PDMS-corundum sand mixtures from the Tectonic Modelling Lab of the University of Bern (CH), GFZ Data Services, https://doi.org/10.5880/fidgeo.2018.023, 2018c.
Zwaan, F., Schreurs, G., and Buiter, S. J. H.: A systematic comparison of experimental set-ups for modelling extensional tectonics, Solid Earth, 10, 1063–1097, https://doi.org/10.5194/se-10-1063-2019, 2019.
Zwaan, F., Scheurs, G., and Rosenau, M.: Rift propagation in rotational versus orthogonal extension: Insights from 4D analogue models, J. Struct. Geol., 135, 103946, https://doi.org/10.1016/j.jsg.2019.103946, 2020.
Zwaan, F., Chenin, P., Erratt, D., Manatschal, G., and Schreurs, G.: CT data, PIV analysis results and surface view videos of analogue models of interacting crustal and mantle weaknesses during rifting, GFZ Data Services, https://doi.org/10.5880/fidgeo.2021.020, 2021.