An Advanced Finite Element Modeling for the Failure of Notched Ceramic Matrix Composite With TFP Patch Reinforcement
 Gang Zhao1,2
  Jianbo Tang3,2
  Jun Wang4,2
  Yunsheng Chen4,2
  Yajie Feng2
  Yousi Chen1 Shiqing Xin3 Xigao Jian1 Shuxin Li5
  Shouhai Zhang1* Jian Xu1,2*
- 1State Key Laboratory of Fine Chemicals, Liaoning High Performance Polymer Engineering Research Center, School of Chemical Engineering, Dalian University of Technology, Dalian, China
- 2Engineering Laboratory of Advanced Energy Materials, Ningbo Institute of Material Technology and Engineering, Chinese Academy of Science, Ningbo, China
- 3School of Computer Science and Technology, Shandong University, Qingdao, China
- 4University of Chinese Academy of Sciences, Beijing, China
- 5State Key Laboratory of Materials Synthesis and Processing, Wuhan University of Technology, Wuhan, China
An advanced modeling strategy for notched ceramic matrix composite coupons with patch reinforcement was proposed to investigate the failure mechanisms. This model considered the tailored fiber–placed (TFP) yarn details obtained from the design phase and the embedded element concept which was used to successfully overcome the meshing difficulties. Inter-ply “glue” layers were simulated using the surface-based contact cohesive element method, so the delamination due to interfacial material discontinuity and damage can be well reproduced and analyzed. For composite ply, the energy-based composite progressive damage model that is independent of the mesh size was applied. Virtual test campaign was performed with a variety of geometrical and material parameters, and the damage and failure mechanisms based on the stress analysis can be revealed to support the design optimization of patch reinforcement.
Introduction
Continuous silicon carbide fiber–reinforced silicon carbide ceramic matrix (SiCf/SiC) composites are considered to be candidate accident-tolerant fuel (ATF) cladding materials due to their excellent ablation resistance, corrosion resistance, and radiation tolerance (Snead et al., 2007). However, despite the substantial achievements, there are still some key problems that need to be solved to satisfy the requirement of engineering application. For example, it is often inevitable to manufacture open holes or notches in the engineering composite components. In the assembling process of SiCf/SiC composite flame holders (Berdoyes et al., 2005), some hole flanges are needed for joining (Figure 1A). In the roller kiln or tunnel kiln system, there are also some holes in the silicon carbide ceramic beam and rod for assembly (Figures 1B,C). Nevertheless, the SiCf/SiC composites have the properties of high hardness and brittleness, and the stress concentration caused by notches, holes, or attachment points is a threat to structural safety and reliability.
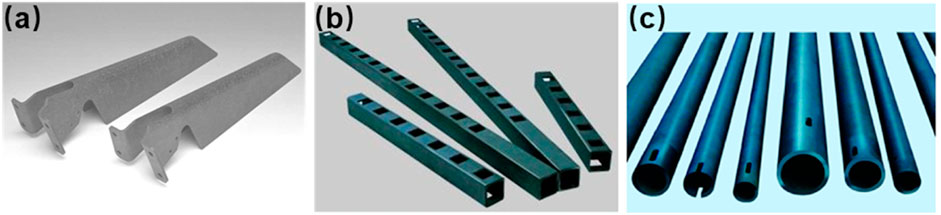
FIGURE 1. SiC ceramic matrix open-hole composite components: (A) flame holders; (B) beam; (C) rod.
The presence of a hole or notch in a composite laminate is associated with stress concentration and out-of-plane stresses and will produce a change in the failure mechanisms and a failure strength reduction of the laminate compared to a laminate without a notch. In the breakage of an open hole or notch laminate subjected to engineering loads, several failure mechanisms can be observed including matrix cracking, fiber breakage, and delamination. Consequently, local reinforcement around an open hole or notch is often required in the composite structure design. Although the mechanical joining technique with bolted reinforcement widely used in the traditional engineering materials such as steel, aluminum, or plastic provides an easy engineering solution, the drilled holes required for the bolted joints in the composite laminate will further remarkably reduce the strength of the structure by additional fiber breakage and delamination. The detailed damage introduced by the drilling process can be found in the works of Hocheng and Tsao (2006), Tsao and Hocheng (2004), and Srinivasa Rao et al. (2008). Consequently, innovative reinforcement methods for the composite laminate with an open hole or notch are required in engineering structure design.
The tailored fiber placement (TFP) technology that is based on embroidery machines was developed by the Institute of Polymer Research Dresden (Crothers et al.; Gliesche and Feltin; Rothe and Feltin, 1994). According to the designed reinforcement paths, the machine will stitch a yarn onto a base material in almost any desired orientation. Other than isotropic materials whose stress concentration can be only reduced by geometrical optimization, the anisotropic materials, such as FRPs, can be optimized based on the tailored fiber orientations that locally follow the principal stresses. Therefore, the maximum properties can be achieved along the fiber direction. Meanwhile, the stress concentration introduced by notches can be efficiently reduced to the largest extent. Gliesche et al. (2003) applied the TFP technique to a notched textile composite specimen. It was reported that the damage of the reinforced sample started outside of the reinforced area. The strength of the sample was 94% that of the un-notched specimen and 33% higher than that of the one without reinforcement.
The notched sample has been numerically studied since the 1970s. Earlier researchers employed the finite element (FE) method (Hillerborg et al., 1976; Kwon and Berner, 1995; Kwon and Craugh, 2001), in which the damage modes were considered and micromechanical constitutive law was applied. Thereafter, continuum damage modeling (CDM) (Chang and Chang, 1987; Davila et al., 2005; Forghani et al., 2013) and discrete modeling, e.g., cohesive element method (Turon et al., 2010), were developed to study the damage caused by stress concentration.
In contrast to the sample with an open hole or with traditional reinforcements, however, the notched sample reinforced by the TFP patch has rarely been studied. Koricho et al. (2015) investigated the TFP-made specimen in comparison with drilled composite samples, both experimentally and numerically. The FE model of Koricho was based on the 2D Hashin failure criterion. Temmen et al. developed a tool chain to optimize the TFP process. The Puck failure criterion was adopted in order to distinguish the fiber rupture from the inter-fiber fracture of the stitched yarn. Gliesche et al. (2003) carried out research on the reinforcement of the TFP patch on the unidirectional laminate. However, the work of Koricho, Temmen, and Gliesche did not explicitly reproduce the single yarn embedded in the patch that exhibited high inhomogeneity. Meanwhile, the ply–ply and patch–sample interfacial properties, which affect the damage initiation location and propagation, were not accounted for.
Furthermore, the studies on mechanical properties of the reinforced sample with an open hole or notch are mainly focused on polymer matrix composites rather than ceramic matrix composites. This is partly due to the fact that ceramic matrix composite technology is still being developed and the ceramic matrix composite experiments are time-, money-, and energy-consuming. However, the stress concentrations caused by a hole or notch are inevitable with the gradual application of ceramic matrix composite materials. As a result, it is vital to investigate the strength of open-hole ceramic matrix composites and the related reinforcement methods.
In this paper, an advanced three-dimensional modeling strategy for the TFP patch–reinforced ceramic matrix composite sample with an open hole is presented. It possesses the following features:
1) The placed yarn that is consolidated in the patch is fully simulated as a piece-wise orthotropic material using solid elements. It is nested in the matrix mesh using the “embedded element technique.”
2) To predict the material damage of the yarn and the sample with an open hole that is strengthened by woven fabrics, an energy-based damage evolution mode proposed by Maimí et al. (2007) is applied. The damage in a ply is triggered by the maximum stress failure criterion.
3) The interface between the TFP patch and the composite sample, as well as those between plies in the composite sample, is simulated using the surface-based cohesive behavioral properties, which can well represent a quasi-zero-thickness cohesive layer.
A Python script is written to automatically generate the FE model according to user definitions, e.g., coupon size, hole diameter, size of the reinforcement, number of plies, fiber orientations, and material properties. With this FE model, the progressive damage of the TFP yarn, woven composite plies, and interfacial delamination can be analyzed. The model is applied to investigate the damage mechanism of the patch-reinforced sample with a variety of geometrical and material parameters. The results provide a promising opportunity for quick design and optimization.
Model Construction
TFP Yarn Mesh
Following the designed pattern in CAD software (Figures 2A, C), the yarn is placed and stitched onto the base material to produce the reinforcement (Figures 2B, D). With the chemical vapor infiltration (CVI) technique, the TFP reinforcement could be consolidated within the SiC matrix to produce the composite reinforcement patches. Thereafter, the patch and the sample could be joined with the Ti3SiC2 tapes and the in situ reaction TiC gradient layer via FAST (Zhou et al., 2018), while the open holes of the patch and base sample are aligned together to form the TFP patch reinforcement.
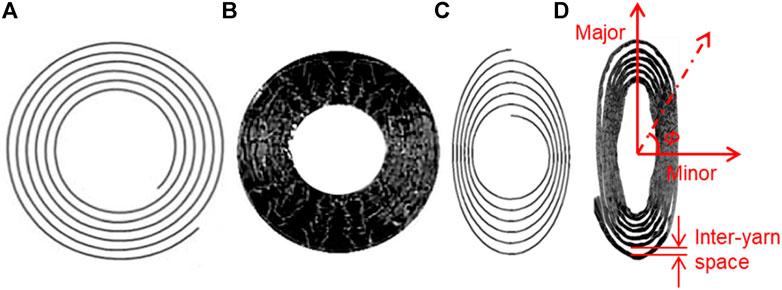
FIGURE 2. TFP patches: (A,C) TFP patterns designed in CAD software; (B,D) stitched yarns (Gliesche et al., 2003).
The TFP pattern is defined in CAD software in the format of “STandard for the Exchange of Product model data” (STP), from which the points’ coordinates can be extracted. Based on these point coordinates, the yarn’s 3D mesh is generated (Figure 3A). Each element is defined with a local coordinate that follows the local fiber orientation (Figure 3B). A typical feature is demonstrated in Figure 2D that the stitched yarn has a transitional cross-sectional area and inter-yarn space. The yarn width and space gradually reduce to the minimum, respectively, when the angle
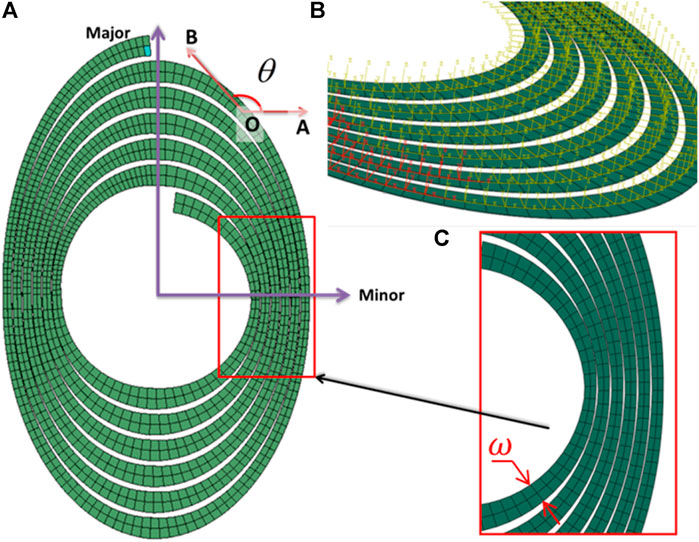
FIGURE 3. Mesh of the TFP yarn: (A) 3D solid mesh generated following the pattern in Figure 2C, (B) orthotropic material with local fiber orientation definition, and (C) transitional yarn width and inter-yarn space.
The instant width of the TFP yarn can be calculated as
where the angle
where
TFP Patch Reinforcement
The geometric outer contour of the TFP patch reinforcement is a standard circle or a standard ellipse with a hole. In the traditional continuous model, the matrix mesh is obtained by Boolean subtraction of the TFP patch and the yarn mesh. However, the extremely tiny inter-yarn space between yarns makes the matrix mesh too small, which leads to poor mesh quality and high computational cost.
An alternative is the “mesh superposition technique” (McGlockton et al., 2003; Yang and Cox, 2010), with which the yarn mesh is embedded into the mesh of the matrix material (Figure 4). Actually, the “mesh superposition technique” is a method of multi-point constraints in Abaqus. Geometrically, the matrix mesh includes the yarn mesh. The matrix mesh is the host mesh, which is considered an independent model from the point of view of translational degrees of freedom (DOFs). The kinematic constraints are created between the nodes of the embedded and the host elements. The translational degrees of freedom of the embedded node are interpolated as the values of the DOFs of the surrounding host nodes.
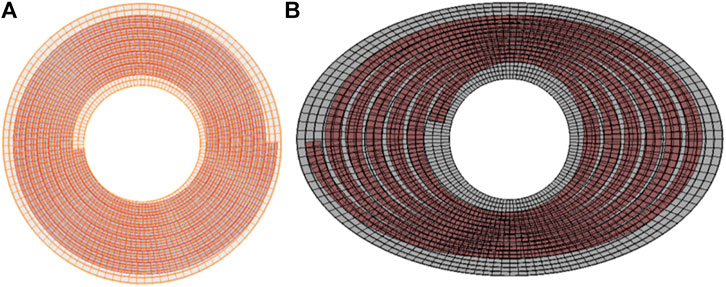
FIGURE 4. “Mesh superposition technique” applied to the TFP patch: (A) circular patch and (B) elliptical patch. The yarn mesh is embedded into the matrix mesh to avoid the meshing difficulties at the places where the inter-yarn space is extremely tiny.
The mesh superposition technique is an effective solution to the problem of composite meshing, as the volume mesh of the separate parts is much simpler and more efficient than that in a full model.
Sample With Open Hole
As shown in Figure 5A, the coupon is partitioned into specific sections (1) and (2), to apply the local refined structural mesh. The locally well-structured mesh serves the purpose of dealing with high stress concentration near the hole.
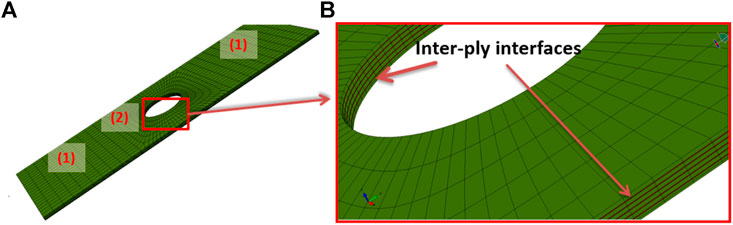
FIGURE 5. Sample with an open hole: (A) a locally refined mesh is used to deal with stress concentration; (B) inter-ply interfaces are modeled using the “surface-based cohesive behavior model.”
In Figure 5B, each ply of the composite is modeled. There are two ways to create the interface between neighboring plies or between the TFP patch and the base laminate sample: “cohesive element,” and “surface-based cohesive behavior model” (SBCBM). Compared to the cohesive element, the SBCBM, which correlates the inter-ply traction and separation between plies, is physically realistic and numerically efficient. Usually, the inter-ply interface is so thin that the thickness, which is normally needed by cohesive elements, is negligibly small and hard to obtain. Moreover, the SBCBM does not require the contacting surface pair possessing a coincident mesh by sharing common nodes. Bonded by the SBCBM, an FE model of the single-side TFP-patched composite laminate sample is assembled together and demonstrated in Figure 6. This model contains 28,376 elements, which are linear solid elements C3D8 containing eight integration points, and 40,876 nodes in total. The model will be solved using the Abaqus explicit solver.
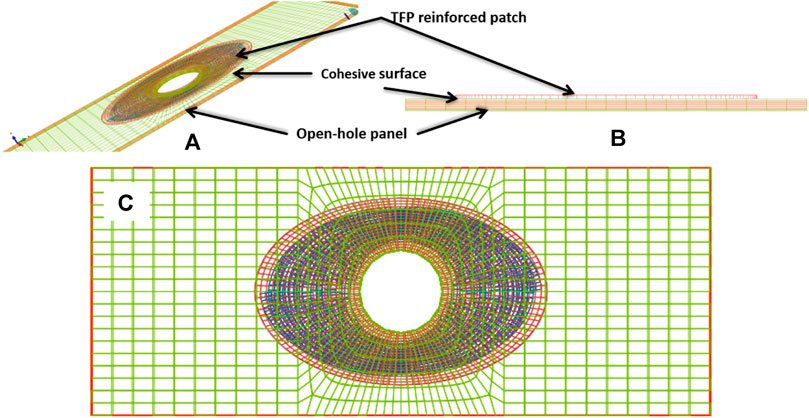
FIGURE 6. The whole set of TFP-reinforced coupons where the TFP patch and plies are assembled together using the SBCBM: (A) ISO view of the model, (B) side view of the model, and (C) top view.
Material Models
Interfacial Models
Traction–Separation Failure Model
As aforementioned, the ply interfaces are modeled using the SBCBM. The corresponding linear damage evolution is demonstrated in Figure 7. Instead of using strain and stress, this damage evolution model is a correlation between the traction force and the separation displacement. In the elastic zone (
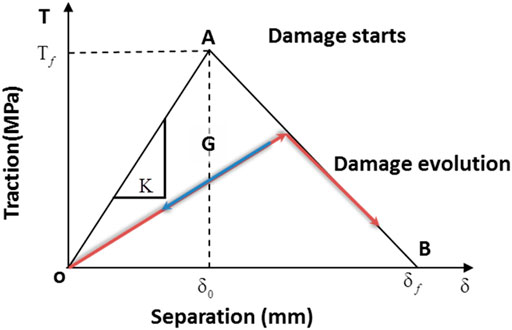
FIGURE 7. Linear damage evolution of the traction–separation model.
When the damage evolution is assumed to be linear as shown in Figure 7, the fracture energy
The fracture energies,
Damage Model
The damage initiation is triggered by the quadratic nominal stress criterion, as shown in the following equation:
The Macaulay brackets
where
Considering the interfacial properties for epoxy matrix composites and SiC matrix composites are different, the different input data are listed in Table 1.
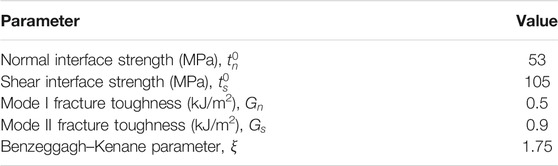
TABLE 1. Interfacial properties for SiC matrix composites (Choi and Kowalik, 2008; Liu et al., 2016).
Composite Ply Model
Continuum Damage Model
Muñoz et al. (2015) proposed a continuum damage model to describe the progressive damage of the composite ply. Five damage functions that represent fiber loading directions are defined in Table 2.
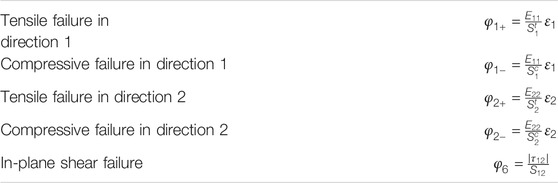
TABLE 2. Damage activation functions for a composite ply (Muñoz et al., 2015).
In Table 2, the symbols
where
After the onset of damage, the damage propagation is controlled by damage activation functions
where
where
where
Input of Consolidated TFP Yarn and Woven Laminates
The consolidated TFP yarn can be treated as a homogeneous and transverse isotropic material. The strength components, stiffness components, and Poisson’s ratios of the impregnated yarns are calculated (Table 3) using Chamis’s equations (Chamis et al., 2013) based on the properties of constituents provided by Presby et al. (2019) (Table 4).
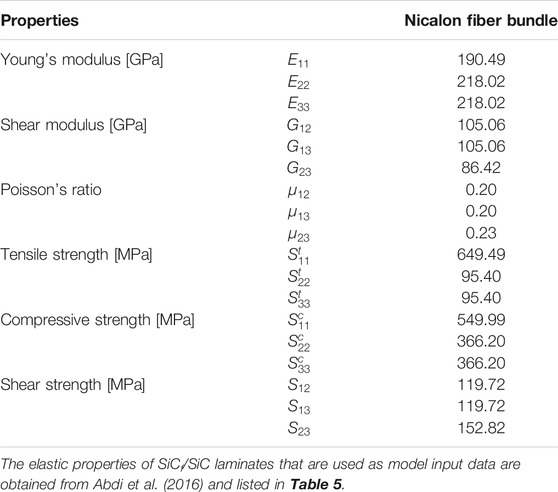
TABLE 3. Mechanical properties of the fiber bundle consolidated with the SiC matrix, calculated using Chamis’s equations (fiber volume fraction
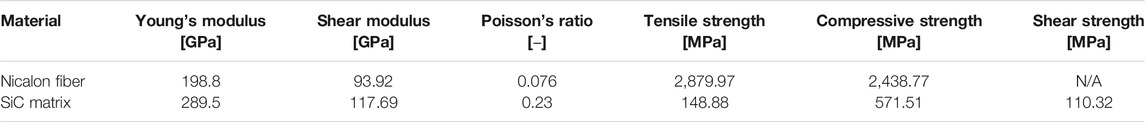
TABLE 4. Typical mechanical properties of the fiber and matrix (Presby et al., 2019).
Numerical Tests
Numerical Tests on Notched Sample
Strength Prediction
A comprehensive study on strength and fracture criteria in fabric composite samples with a circular hole was carried out by virtual test. The detailed elastic properties of the woven SiCf/SiC composite samples that contain [0, 45, −45, 0] plies are listed in Table 5.
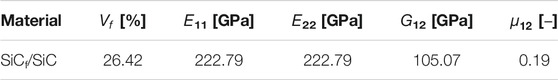
TABLE 5. Elastic properties of SiCf/SiC woven composites (Abdi et al., 2016).
To run a calculation, the necessary material properties as input for the model are already provided in Material Models. The dimensions of the notched sample are described in Figure 8. The radius of the hole varies from 2 to 10 mm, in order to investigate the dependence of failure on hole size.
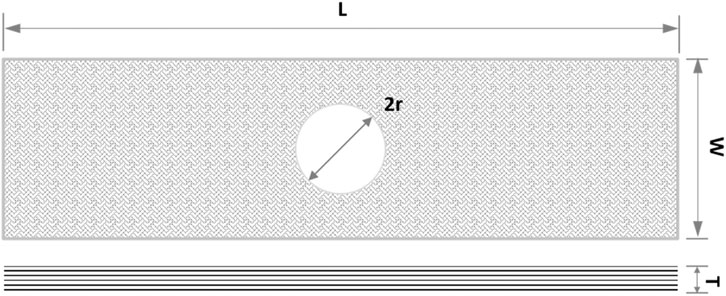
FIGURE 8. Dimensions of the sample: L = 150 mm, W = 40 mm, T = 1 mm, and r = 2–10 mm.
The calculated strengths of the drilled sample with different hole radii (2–10 mm) are listed in Table 6. The residual strength of the laminate with an open-hole radius of 10 mm is only 36.32% of the strength of the un-notched laminate. In this case, it is necessary to adopt reinforcement methods for the composite laminate with an open hole or notch.
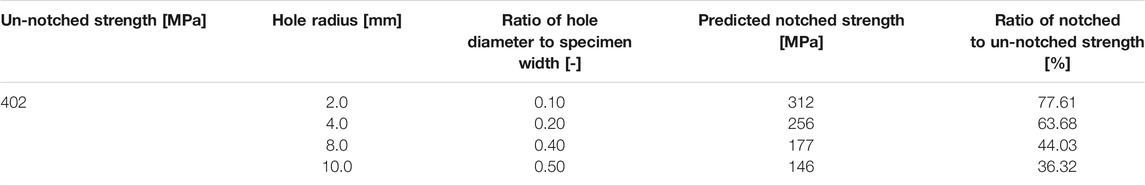
TABLE 6. Predicted results of the notched woven SiCf/SiC composite sample: the sample’s width is 40 mm.
Stress Analysis
In Figure 9, the tension and shear contours immediately before the damage onset for a [0, 45, −45, 0] laminate, which has a hole radius of R = 10 mm, are demonstrated. The stress concentration factor, which is defined as the ratio of the maximum tensile stress value on the edge of the hole (Figures 9A–D) to the value of external tensile stress (90 MPa), is 4.4 and 2.2 for 0o and 45o plies, respectively. The external tensile stress means loading force divided by the material cross-section without the hole. The stress concentration factor indicates that the fiber rupture will take place firstly in 0o plies and then extend to ±45o plies (Figure 10). Under the on-axis loading, the ±45o plies (Figures 9F, G) bear the shear loadings effectively, three times those of 0o plies (legends in Figures 9E, H).
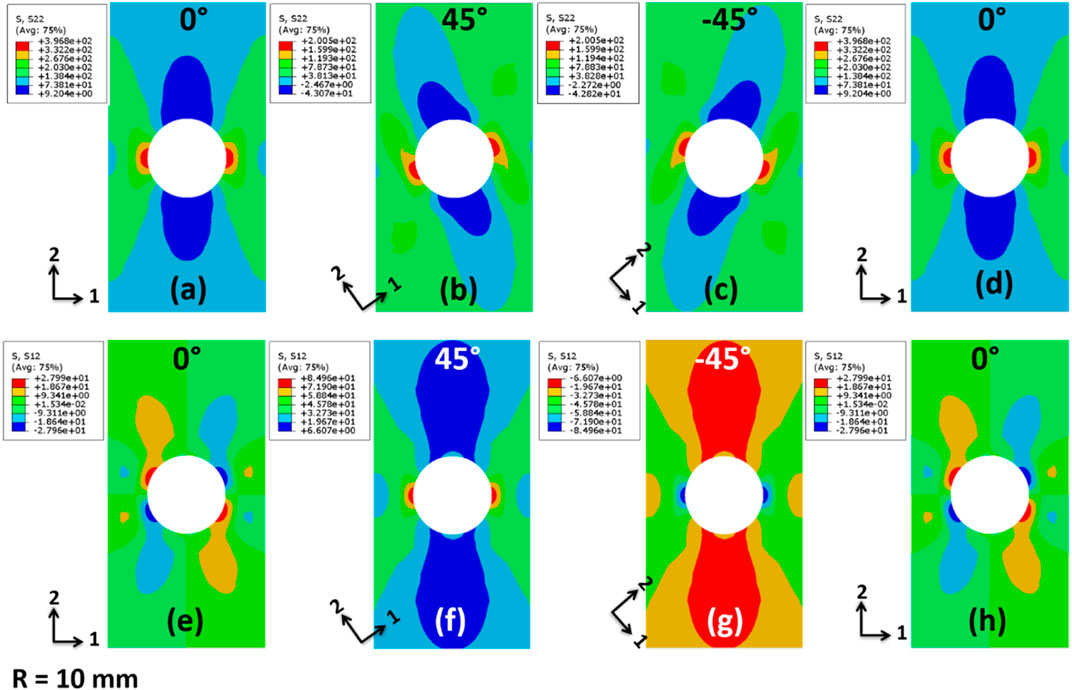
FIGURE 9. Stress contours of [0, 45, –45, 0] laminates immediately before damage onset (tensile stress
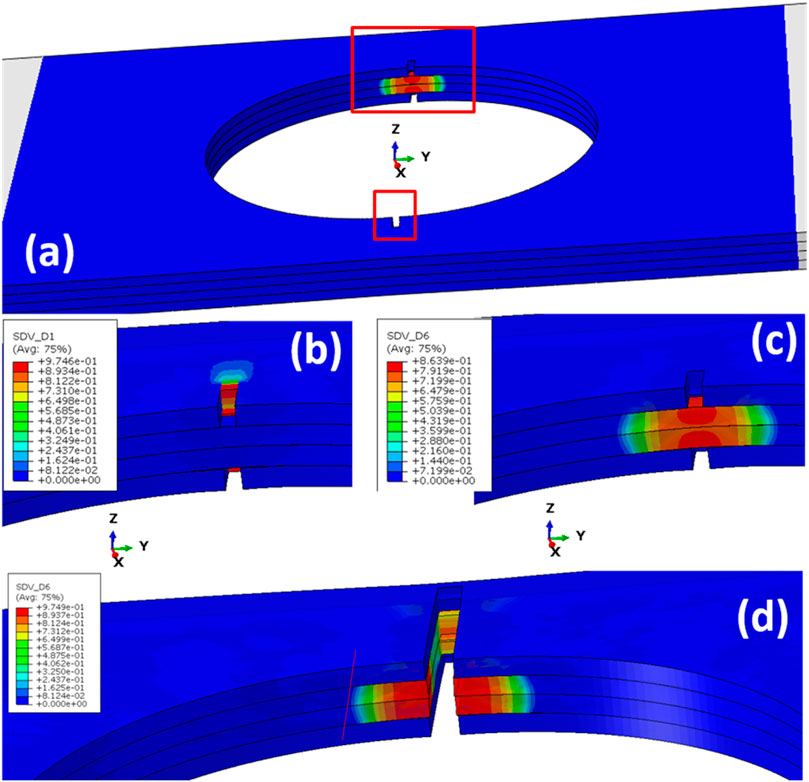
FIGURE 10. Damage development: (A) damage onset; (B) cracks propagate in 0o plies (external tensile stress
When element deletion is activated, the aforementioned damage initiation and propagation can be clearly demonstrated, as shown in Figure 10. The cracks (due to fiber rupture, damage variable
Delamination
It is obvious that stress concentration “amplifies” the loading at the hole circumference. Furthermore, due to high material discontinuity at the interfaces between the 0o ply and the 45o ply, the in-plane shear stress (Figure 11A) and out-of-plane shear stress (Figures 11B, C) help to form the mild interfacial damage (Figure 11D) in an early stage when the external stress is only 45 MPa. Remarkable delamination presents when the 0o laminate starts to degrade (Figure 11E), when the external load reaches 90 MPa. The delamination grows fast till the final failure (Figure 11F). The delamination between ±45o plies, where the in-plane shear and out-of-plane shear are neglectable, is milder than that between the 0o ply and the 45o ply (Figures 11D, E).
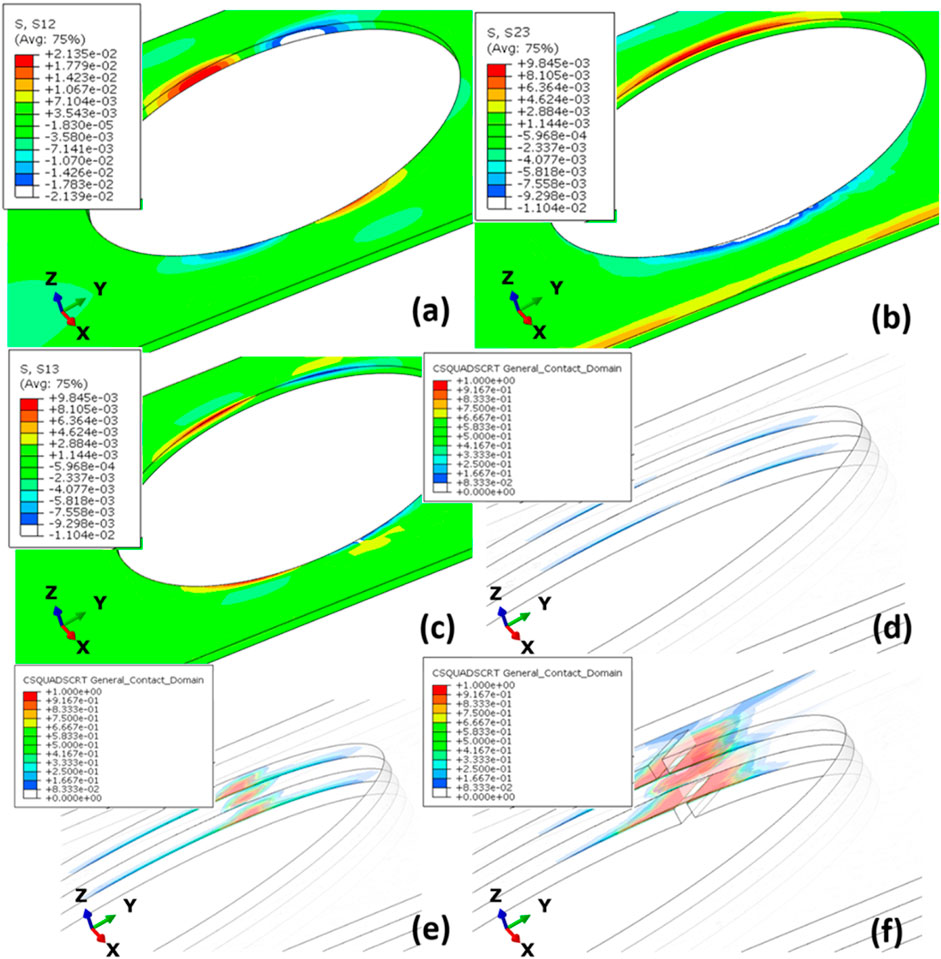
FIGURE 11. Delamination evolution: (A) in-plane shear stress at the interfaces between the 0o ply and the 45o ply, (B, C) out-of-plane shear stress between the 0o ply and the 45o ply, (D) interface damage starts when the external tensile stress is 45 MPa, (E) delamination starts when 0o plies start to damage (tensile stress
Numerical Tests on Notched Sample With Patch Reinforcement
With the help of the FE model, virtual test campaign is carried out for notched samples reinforced by circular annular (CA) and elliptical annular (EA) patches, based on the patching parameters listed in Table 7.
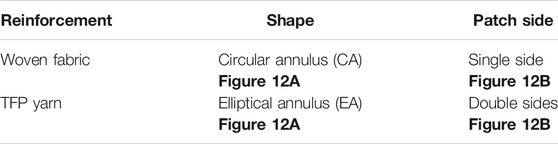
TABLE 7. Patching parameters to be studied in virtual test campaign.
The dimensions of the virtual test samples are delineated in Figure 12A, where the patch matrix material is set to invisible. The geometrical parameters of the samples are as follows: L = 150 mm, W = 60 mm, T = 2 mm, r = 10 mm, D = 47 mm, a = 41 mm, and b = 80 mm, where D, a, and b are the outer diameter of the CA patch and outer major axis and minor axis of the EA patch, respectively. The single-side reinforced (SSR) and double-side reinforced (DSR) samples are sketched in Figure 12B.
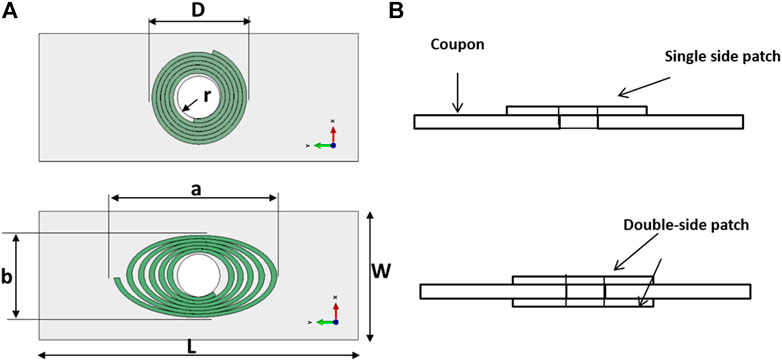
FIGURE 12. Sketches of the virtual test samples: (A) sketches of the CA- and EA-reinforced samples; (B) sketches of SSR and DSR samples. The dimensions of the sample are L = 150 mm, W = 60 mm, T = 2 mm, r = 10 mm, D = 47 mm, a = 41 mm, and b = 80 mm.
Study on Patching Parameters
In Figures 13A, B, the ultimate applied stress and apparent moduli of the CA patch–reinforced sample, as well as those of the undrilled sample and drilled sample, are delineated. The abbreviations OP, NP, WS, WD, YS, and YD represent the original sample without hole, sample with a hole, and drilled sample with woven SSR, with woven DSR, with TFP SSR, and with TFP DSR, respectively. From Figures 13A, B, two conclusions can be drawn: 1) The TFP patch exhibits overwhelming advantages in terms of enhancing the strength. In contrast to the woven fabric, the TFP yarn seems to be more efficient in resisting the maximum principal stress. 2) DSR samples show higher strengths and moduli than SSR samples. SSR (Figure 13C) cannot omit the stress concentration on the un-patched side (Figure 13E), where the damage and crack occur earlier. In contrast, the DSR samples (Figure 13D), where the same total amount of reinforcement (evenly separated on double sides) as in SSR is used, can ideally balance the load, eliminate the stress concentration, and delay the damage onset (Figure 13F).
FIGURE 13. Study on patching parameters: (A) comparison of ultimate stress, (B) comparison of apparent moduli, (C) SSR sample, (D) DSR sample, (E) S22 contour for the SSR sample, and (F) S22 contour for the DSR sample.
In order to analyze the stress distribution around the hole, S22 contours are sampled clockwise from the front and back sides of the sample along the hole edges (Figure 14). For the SSR sample, the back edge has patch reinforcement, while the front has not (Figures 13C, E). It is worth noting that the stress (solid-square–symboled curve in Figure 14) obtained from the front edge in Figures 13C, E shows larger oscillation and higher peak values of 400 MPa, while the edge with patch reinforcements reads a value of about 350 MPa. This higher local stress leads to earlier damage onset and well explains the aforementioned conclusion ii).
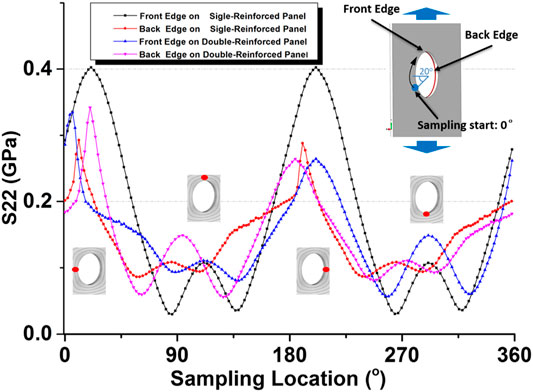
FIGURE 14. S22 distribution on the edges of the hole of the SSR sample and DSR sample.
Study on Patch Shape
In Figures 15A, B, the ultimate applied stress and apparent moduli for CA and EA patch–reinforced samples, as well as those of the undrilled and drilled samples, are delineated. Obviously shown in Figures 15A, B, the EA patches exert more effectiveness in enhancing the apparent properties of the drilled samples. The TFP DSR can increase the strength from 146 MPa up to 319 MPa, 79% of the strength (402 MPa) of the undrilled sample (Figure 15A). The apparent modulus increases from 195.4 GPa up to 235.1 GPa, higher than that of the undrilled one (222.8 GPa) (Figure 15B).
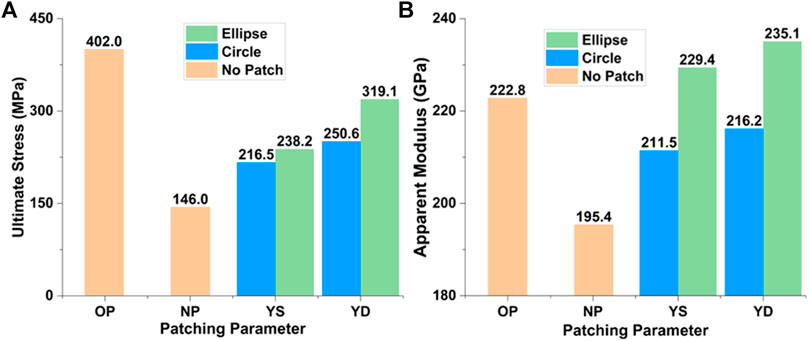
FIGURE 15. Study on patch shape: (A) comparison of ultimate tensile stress; (B) comparison of apparent moduli. The abbreviations YS and YD represent the drilled sample with TFP SSR and TFP DSR, respectively.
The S22 distributions on the edges of the hole for circular annular (CA) and elliptical annular (EA) TFP patch–reinforced samples are extracted and compared in Figure 16. Stress curves are extracted from both sides of the SSR sample. The stress curves on the unpatched side show higher oscillations. The peak values of the CA-patched sample reach 415 MPa, 15 MPa higher than that of the EA-patched sample. This indicates that the former has an earlier damage initiation and thus lower strength (Figure 15A). Comparing the stress curves from the patched side, the curve (solid triangles) of the EA-patched sample is much flatter than the CA counterpart (solid circles), which suggests the EA patch has more efficiency in reducing the local stress concentration.
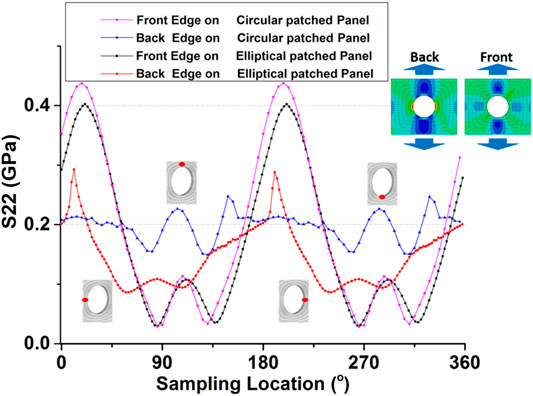
FIGURE 16. S22 distribution on the edges of the hole of CA- and EA-TFP single-side reinforced (SSR) samples.
The tensile stress along the longitudinal axis of the notched coupons and patches (vertical red lines sketched on the sample and patches) on the contacted surfaces of the EA and CA patch–reinforced samples is extracted along with and without the nominal elastic energy along the axes (Figure 17). Stress curves are extracted from the patch side of the SSR sample. When applied with the same external strain, the former stress curve shows higher values in zones I and II (outside of the patching area). The local stress reaches the maximum of 200 MPa on the boundary between zones I and III, as well as that between zones II and III. This implies that the damage will take place on the drilled sample next to the edge of the patch when the patch is strong enough and perfectly bonded.
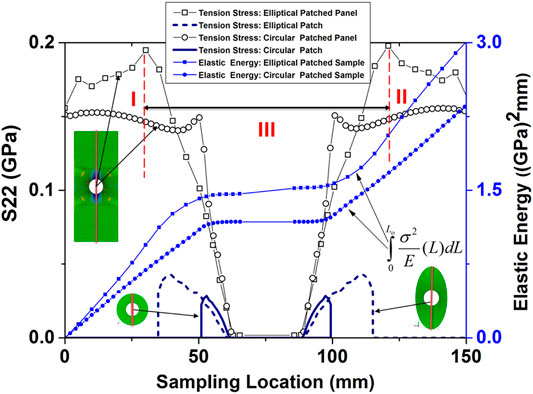
FIGURE 17. Tensile stress (S22) along the longitudinal axes of the patched samples and patches.
The total elastic energy stored in the sample can be represented as
where
where L and w are the length of the sample and the width of the elements lying on the loading sampling path.
where subscripts and superscripts “Ellip,” “Circ,” “S,” and “P” stand for elliptical and circular patches and the drilled sample and patch, respectively. The integrals in the above equation are calculated and presented in Figure 17, too. It is apparent that
Conclusion
In this work, an advanced progressive damage FE model for the notched ceramic matrix composite laminate reinforced by the special TFP composite patch has been established. An energy-based composite progressive damage model that is independent of the mesh size is applied. This model also accounts for the TFP yarn details that are inherited from TFP path design. The embedded element concept is used to successfully avoid the meshing difficulties. The inter-ply “glue” layer is simulated using the surface-based contact method, and the delamination due to interfacial material discontinuity and damage can be well reproduced and analyzed. A virtual test campaign was carried out based on a variety of geometrical and material parameters. Based on the stress analysis, the related damage mechanism was revealed. From the FE analysis, the following conclusions can be drawn:
1) The optimized TFP patch is more efficient in minimizing the stress concentration around the hole edges than the woven fabric.
2) The double-side reinforcement, compared to the single-side counterpart, reduces the stress concentration introduced by the geometrical asymmetry on the unpatched side and thus highly increases the modulus and strength.
3) The elliptical patch has shown better mechanical performance. The apparent strength reaches 79% of the un-notched sample, while the modulus exceeds that of the original sample.
In summary, the proposed FE model well simulated the damage behavior of the patch-reinforced ceramic matrix composite sample. Through the FE analysis, the double-side elliptical sample reinforced by the TFP yarn is highly recommended. In the future work, nevertheless, to correctly predict the orientation of crack propagation, especially that in 45o plies, the enhanced FE method or the orientated mesh should be utilized.
Data Availability Statement
The original contributions presented in the study are included in the article/Supplementary Material, and further inquiries can be directed to the corresponding authors.
Author Contributions
GZ carried out investigation, ran the software, contributed to testing code components, and wrote the first draft of the manuscript. JT performed the methodology. GZ, JT, JW, YC, and YF curated the data. JW, YC, and YF were responsible for modeling and simulation. YC, SX, XJ, SZ, and JX contributed to supervision and funding acquisition. SL revised the first draft of the manuscript. SZ and JX contributed to project administration. GZ and JX contributed to supporting algorithms and reviewed and edited the paper.
Funding
This work was supported by the National Natural Science Foundation of China (No. 52075526) and the Dalian University of Technology 2019 Discipline Platform Fund (No. 1000-82212201). The authors also gratefully acknowledge the National Key Research and Development Program (No. 2018YFB1107500), the “Ningbo 3315 Plan Innovation Team” (No. 2017A-28-C), the “Transformational Technologies for Clean Energy and Demonstration,” the Strategic Priority Research Program of the Chinese Academy of Sciences (No. XDA21010205), and the financial support from the National Young Talents Program of China.
Conflict of Interest
The authors declare that the research was conducted in the absence of any commercial or financial relationships that could be construed as a potential conflict of interest.
Publisher’s Note
All claims expressed in this article are solely those of the authors and do not necessarily represent those of their affiliated organizations, or those of the publisher, the editors and the reviewers. Any product that may be evaluated in this article, or claim that may be made by its manufacturer, is not guaranteed or endorsed by the publisher.
References
Abdi, F., Godines, C., Morscher, G. N., Choi, S., Villa Montero, M., Han, Z., et al. (2016). Foreign Object Damage and Fatigue after Impact Simulations on Flat and Curved Hi Nicalon and Hi Nicalon Type S (Mi Sic) Specimens at Room and 1200 C Using Building Block Approach in Turbo Expo: Power for Land, Sea, and Air. V006T002A007: American Society of Mechanical Engineers. doi:10.1115/gt2016-58086
Bažant, Z. P., and Oh, B. H. (1983). Crack Band Theory for Fracture of concrete. Matériaux et Construction 16, 155–177. doi:10.1007/BF02486267
Benzeggagh, M. L., and Kenane, M. (1996). Measurement of Mixed-Mode Delamination Fracture Toughness of Unidirectional Glass/epoxy Composites with Mixed-Mode Bending Apparatus. Composites Sci. Tech. 56, 439–449. doi:10.1016/0266-3538(96)00005-X
Berdoyes, I., Thebault, J., Bouillon, E., and Solide, S. P. (2005). Improved SiC/SiC and C/C Materials Applications Parts. Eur. Congr. Adv. Mater. Process., 1–7.
Chamis, C. C., Abdi, F., Garg, M., Minnetyan, L., Baid, H., Huang, D., et al. (2013). Micromechanics-based Prqogressive Failure Analysis Prediction for WWFE-III Composite Coupon Test Cases. J. Compos. Mater. 47, 2695–2712. doi:10.1177/0021998313499478
Chang, F.-K., and Chang, K.-Y. (1987). A Progressive Damage Model for Laminated Composites Containing Stress Concentrations. J. Compos. Mater. 21, 834–855. doi:10.1177/002199838702100904
Choi, S. R., and Kowalik, R. W. (2008). Interlaminar Crack Growth Resistances of Various Ceramic Matrix Composites in Mode I and Mode II Loading. J. Eng. Gas Turbines Power 130. doi:10.1115/1.2800349
Crothers, P. J., Drechsler, K., Feltin, D., Herszberg, I., and Bannister, M.. The Design and Application of Tailored Fibre placementFailure Criteria for FRP Laminates. 11. International Conference On Composite Materials, 39, 323–345. doi:10.1177/0021998305046452
Davila, C.G., Camanho, P. P., and Rose, C.A. (2005). Failure Criteria for FRP Laminates. J. Compos. Mater. 39, 323-345. doi:10.1177/0021998305046452
Diehl, T. (2008). On Using a Penalty-Based Cohesive-Zone Finite Element Approach, Part II: Inelastic Peeling of an Epoxy-Bonded Aluminum Strip. Int. J. Adhes. Adhesives 28, 256–265. doi:10.1016/j.ijadhadh.2007.06.004
Forghani, A., Zobeiry, N., Vaziri, R., Poursartip, A., and Ellyin, F. (2013). A Non-local Approach to Simulation of Damage in Laminated Composites. Lancaster, PA: DEStech Publications, Inc.
Gliesche, K., and Feltin, D. Automated Manufacture of Textile Reinforcements by Tailored Fiber Placement. International Symposium on Composites Manufacturing for Aircraft Structures, 30–31.
Gliesche, K., Hübner, T., and Orawetz, H. (2003). Application of the Tailored Fibre Placement (TFP) Process for a Local Reinforcement on an "Open-Hole" Tension Plate from Carbon/epoxy Laminates. Composites Sci. Tech. 63, 81–88. doi:10.1016/S0266-3538(02)00178-1
Hillerborg, A., Modéer, M., and Petersson, P.-E. (1976). Analysis of Crack Formation and Crack Growth in concrete by Means of Fracture Mechanics and Finite Elements. Cement Concrete Res. 6, 773–781. doi:10.1016/0008-8846(76)90007-7
Hocheng, H., and Tsao, C. C. (2006). Effects of Special Drill Bits on Drilling-Induced Delamination of Composite Materials. Int. J. Machine Tools Manufacture 46, 1403–1416. doi:10.1016/j.ijmachtools.2005.10.004
Koricho, E. G., Khomenko, A., Fristedt, T., and Haq, M. (2015). Innovative Tailored Fiber Placement Technique for Enhanced Damage Resistance in Notched Composite Laminate. Compos. Structures 120, 378–385. doi:10.1016/j.compstruct.2014.10.016
Kwon, Y. W., and Berner, J. M. (1995). Micromechanics Model for Damage and Failure Analyses of Laminated Fibrous Composites. Eng. Fracture Mech. 52, 231–242. doi:10.1016/0013-7944(95)00017-P
Kwon, Y. W., and Craugh, L. E. (2001). Progressive Failure Modeling in Notched Cross-Ply Fibrous Composites. Appl. Compos. Mater. 8, 63–74. doi:10.1023/A:1008909000755
Liu, H. T., Yang, L. W., Sun, X., Cheng, H. F., Wang, C. Y., Mao, W. G., et al. (2016). Enhancing the Fracture Resistance of Carbon Fiber Reinforced SiC Matrix Composites by Interface Modification through a Simple Fiber Heat-Treatment Process. Carbon 109, 435–443. doi:10.1016/j.carbon.2016.08.047
Maimí, P., Camanho, P. P., Mayugo, J. A., and Dávila, C. G. (2007). A Continuum Damage Model for Composite Laminates: Part II - Computational Implementation and Validation. Mech. Mater. 39, 909–919. doi:10.1016/j.mechmat.2007.03.006
Mcglockton, M. A., Cox, B. N., and Mcmeeking, R. M. (2003). A Binary Model of Textile Composites: III High Failure Strain and Work of Fracture in 3D Weaves. J. Mech. Phys. Sol. 51, 1573–1600. doi:10.1016/S0022-5096(03)00038-3
Muñoz, R., Martínez-Hergueta, F., Gálvez, F., González, C., and Llorca, J. (2015). Ballistic Performance of Hybrid 3D Woven Composites: Experiments and Simulations. Compos. Structures 127, 141–151. doi:10.1016/j.compstruct.2015.03.021
Presby, M. J., Mansour, R., Manigandan, K., Morscher, G. N., Abdi, F., Godines, C., et al. (2019). Characterization and Simulation of Foreign Object Damage in Curved and Flat SiC/SiC Ceramic Matrix Composites. Ceramics Int. 45, 2635–2643. doi:10.1016/j.ceramint.2018.10.207
Rothe, H., and Feltin, D. (1994). Textile Constructions that Conform to Power Flux-Novel Reinforcement Structures for Composite. Proc. TECTEXTIL Frankfurt.
Snead, L. L., Nozawa, T., Katoh, Y., Byun, T.-S., Kondo, S., and Petti, D. A. (2007). Handbook of SiC Properties for Fuel Performance Modeling. J. Nucl. Mater. 371, 329–377. doi:10.1016/j.jnucmat.2007.05.016
Srinivasa Rao, B., Rudramoorthy, R., Srinivas, S., and Nageswara Rao, B. (2008). Effect of Drilling Induced Damage on Notched Tensile and Pin Bearing Strengths of Woven GFR-Epoxy Composites. Mater. Sci. Eng. A 472, 347–352. doi:10.1016/j.msea.2007.03.023
Temmen, H., Degenhardt, R., and Raible, T.. Tailored fibre placement optimization tool. 25th International Congress of Aeronautical Sciences, 44, 1085–1090. doi:10.1016/j.ijmachtools.2004.02.019
Tsao, C. C., and Hocheng, H. (2004). Taguchi Analysis of Delamination Associated with Various Drill Bits in Drilling of Composite Material. Int. J. Mach. Tools Manuf. 44 (10), 1085-1090. doi:10.1016/j.ijmachtools.2004.02.019
Turon, A., Camanho, P. P., Costa, J., and Renart, J. (2010). Accurate Simulation of Delamination Growth under Mixed-Mode Loading Using Cohesive Elements: Definition of Interlaminar Strengths and Elastic Stiffness. Compos. Structures 92, 1857–1864. doi:10.1016/j.compstruct.2010.01.012
Yang, Q. D., and Cox, B. (2010). Predicting Failure in Textile Composites Using the Binary Model with Gauge-Averaging. Eng. Fracture Mech. 77, 3174–3189. doi:10.1016/j.engfracmech.2010.08.004
Keywords: finite element model, tailored fiber–placed, progressive damage model, notched composite sample, patch reinforcement
Citation: Zhao G, Tang J, Wang J, Chen Y, Feng Y, Chen Y, Xin S, Jian X, Li S, Zhang S and Xu J (2021) An Advanced Finite Element Modeling for the Failure of Notched Ceramic Matrix Composite With TFP Patch Reinforcement. Front. Mater. 8:701193. doi: 10.3389/fmats.2021.701193
Received: 28 April 2021; Accepted: 02 July 2021;
Published: 05 August 2021.
Edited by:
Lothar Wondraczek, Friedrich Schiller University Jena, GermanyReviewed by:
Stuart Phoenix, Cornell University, United StatesMuhammad Sufyan Javed, Jinan University, China
Copyright © 2021 Zhao, Tang, Wang, Chen, Feng, Chen, Xin, Jian, Li, Zhang and Xu. This is an open-access article distributed under the terms of the Creative Commons Attribution License (CC BY). The use, distribution or reproduction in other forums is permitted, provided the original author(s) and the copyright owner(s) are credited and that the original publication in this journal is cited, in accordance with accepted academic practice. No use, distribution or reproduction is permitted which does not comply with these terms.
*Correspondence: Shouhai Zhang, zhangshh@dlut.edu.cn; Jian Xu, xujian1028@dlut.edu.cn