Towards Underwater Macroplastic Monitoring Using Echo Sounding
 Sophie Broere1*
  Tim van Emmerik2
  Daniel González-Fernández3
  Willem Luxemburg1
  Matthieu de Schipper4
  Andrés Cózar3
  Nick van de Giesen1
- 1Water Resources Section, Faculty of Civil Engineering and Geosciences, Delft University of Technology, Delft, Netherlands
- 2Hydrology and Quantitative Water Management Group, Wageningen University and Research, Wageningen, Netherlands
- 3Departamento de Biología, Instituto Universitario de Investigación Marina, University of Cádiz and European University of the Seas, Puerto Real, Spain
- 4Department of Hydraulic Engineering, Faculty of Civil Engineering and Geosciences, Delft University of Technology, Delft, Netherlands
Plastics originating from land are mainly transported to the oceans by rivers. The total plastic transport from land to seas remains uncertain because of difficulties in measuring and the lack of standard observation techniques. A large focus in observations is on plastics floating on the water surface. However, an increasing number of observations suggest that large quantities of plastics are transported in suspension, below the water surface. Available underwater plastic monitoring methods use nets or fish traps that need to be deployed below the surface and are labor-intensive. In this research, we explore the use of echo sounding as an innovative low-cost method to quantify and identify suspended macroplastics. Experiments under controlled and natural conditions using a low-cost off-the-shelf echo sounding device show that plastic items can be detected and identified up to 7 m below the river surface. Eight different debris items (metal can, cup, bottles, food wrappers, food container) were characterized based on their reflection signature. Reflectance from plastic items diverged significantly from organic material and non-plastic anthropogenic debris. During a multi-day trial field expedition in the Guadalete river, Spain, we found that between 0.8 and 6.3 m depth considerable quantities of plastics are transported. As most plastic monitoring and removal strategies focus on the upper layer below the surface (up to approximately 1.5 m depth), a substantial share of the total plastic transport may be neglected. With this paper we 1) demonstrate that echo sounding is a promising tool for underwater plastic monitoring, and 2) emphasize the importance of an improved understanding of the existing plastic loads below the surface.
Introduction
Plastic pollution in aquatic ecosystems is of increased global concern due to its negative impact on ecosystem health and human livelihood (Cózar et al., 2014; Lau et al., 2020; van Emmerik and Schwarz, 2020). Much of the plastic daily discarded on land is leaked into rivers, and transported into the world’s oceans (van Emmerik and Schwarz, 2020; Meijer et al., 2021). However, estimates of plastic transport from rivers into the oceans are associated with great uncertainties due to methodological difficulties to accurately quantify land-based plastic fluxes into the aquatic environment. To improve the understanding of plastic transport dynamics from source to sink, reliable observations are crucial.
Plastics are abundant in all components of river systems: floating at the surface, accumulated on riverbanks and floodplains, deposited in the sediment, and suspended in the water column (Schwarz et al., 2019; van Emmerik et al., 2020). Currently available measurement methods primarily focus on floating plastics (González-Fernández and Hanke, 2017; van Emmerik et al., 2018) or plastic on riverbanks (Vriend et al., 2020), partially because measurements of plastics below the surface are more difficult due to practical constraints. Previous efforts to quantify subsurface plastics depended on heavy-duty cranes or ships to deploy subsurface nets (Morritt et al., 2014; Liedermann et al., 2018; Schöneich-Argent et al., 2020), which often comes with high labor intensity and equipment costs. Observations of subsurface plastics cannot be neglected, as recent work shows that underwater plastics make up the largest portion of the plastic mass balance in the Atlantic Ocean (Pabortsava and Lampitt, 2020). To date, it is unknown to what extent this also holds for river systems. As rivers are assumed to be one of the main plastic input sources into the oceans, there is a need to monitor the suspended plastics in rivers.
To overcome the challenges with current underwater monitoring methods, we explore the use of sonar technology as a potential solution. Sonar (Sound Navigation Ranging), or echo sounding, is based on transmitting soundwaves into the water, which reflects on objects like fish, vegetation and river bed. The return time and the strength of the returning signal indicate object distance from the transducer and material robustness, respectively. Sonar is currently used for purposes such as fish detection and seabed mapping, and can potentially be combined with plastic monitoring. Monitoring with sonar can reduce the labour intensity and equipment costs compared to the convential monitoring method using nets. Besides, there is no dependence on fixed structures to deploy the measuring device from. Another advantage of sonar compared to net measurements is that the full water column can be covered, without obstructing navigation.
Recent research tested the use of sonar for detecting litter objects in marine environments (Valdenegro-Toro, 2019). In their research, they proposed the use of Deep Neural Networks to survey and detect marine debris in the bottom of water bodies from forward-looking sonar images. A set of objects was placed at the bottom of a small water tank and forward-looking sonar images were generated using an ARIS Explorer 3,000 sensor. Investigating the reflections of specific items and opportunities to detect plastic items in more dynamic water bodies, such as rivers, has not been done to date.
The main goal of this research is to explore the potential of echo sounding for riverine macroplastic (>0.5 cm) monitoring below the water surface using an off-the-self low-cost sensor. We systematically investigated the use of sonar for plastic monitoring through 1) indoor controlled tests, 2) semi-controlled outdoor tests, and 3) uncontrolled application under natural conditions. The controlled tests, to get an insight into the scanning technique and detection abilities of the echo sounder, were performed in a swimming pool. During these tests, several influencing factors on the sonar signal were examined. The semi-controlled tests were carried out in the Rio de San Pedro, Spain. This test aimed to investigate the plastic detection of sonar for different plastic items, including also metal and rubber debris items. Lastly, the sonar was applied for macroplastic monitoring under natural conditions in the Guadalete river, Spain.
Methods
Principles of Echo Sounding
Sonar technology is based on the transmission of a sound signal and receiving the reflection. The transmitted sound waves travel from the sonar transducer in the shape of a cone with increasing footprint. The beam angle of the cone depends on the frequency with which the signal is emitted and the transducer technology. In general, the higher the frequency, the smaller the cone angle. For this research, a single beam sonar with Compressed High Intensity Radiated Pulse (CHIRP) technology is used. The CHIRP technology differs from traditional sonars in the way frequencies are emitted. A CHIRP sonar emits a continuous flow of a range of frequencies, while a traditional sonar sends out a single frequency pulse at a time. By emitting pulses with different frequencies, ranging from low to high, clearer sonar readings of higher resolution can be obtained, which enables improved target separation compared to traditional sonars (Christ and Wernli, 2014).
Many echo sounding appliances translate sonar scans into sonar backscatter images. The displayed signals obtained with, for instance, fish finders are a result of a 2D horizontal scan over the depth. Since the 2D spherical plane is transformed to one point on the backscatter image, no indication of where the fish is present in the scanned horizontal plane can be obtained. Emitting a burst of pluses results in a vertical profile of single points at a certain moment in time. When displaying continuously, the horizontal axis on the backscatter imagery indicates time, the depth below the sensor is presented on the vertical axis. In this way, information about the position of the fish over the depth of the water column can be collected.
Sensor
The experiments performed were executed using the Deeper Smart Sonar CHIRP+ (Deeper CHIRP+), which is a low-cost commercial fish finder. The sensor is a floating, GPS and Wi-Fi enabled fish finder, using CHIRP technology. It has a diameter of 6.35 cm and a weight of 90 g. The Deeper CHIRP + enables scanning aquatic areas with three different beam widths (7, 16, 47°) with corresponding frequency domains (675, 290, 100 kHz), allowing for accurate target determination and separation (up to 1 cm).
The Deeper CHIRP + operates with the Deeper Smart Sonar mobile application, which can be installed on a phone or tablet. In the app, the different settings, such as the scanning beam width and sensitivity can be selected. Besides the sonar readings, information about the water depth and temperature are provided in the app. The sonar scan data can be saved and uploaded to Lakebook, an online platform where data of the scanning activities can be stored and viewed. From Lakebook, only raw bathymetry data can be exported as CSV format. Exporting raw data on signal strength and intensity is not possible. This sensor was chosen because of the ratio between scanning resolution/target separation and price. Besides, the ability to save and store scanning data was advantageous. The downside of this sensor is the limitation of raw sonar data export.
Since raw sonar data could not be exported, screenshots of the sonar signal reflections were taken and processed using MATLAB. The obtained screenshots were segmented, using K-Means clustering, to exclude the background pixels (Shan, 2018). The output of the K-Means clustering method was validated using a segmentation algorithm in Python, and (randomly) checked by hand. Binary images were obtained from which the dimensions of the sonar signal reflection could be calculated in pixels. The “width” of the sonar reflection in the backscatter imagery depicts the time the object is underneath the transducer, and is influenced by velocity of the flow (and object) with respect to the sonar transducer. To correct for this, the width and depth dimensions of the sonar reflection were calculated separately. The signal width was scaled for the flow velocity measured by recording the time of movement over a known distance. An example sonar recording including a plastic bag, bottle and fish is shown in Figure 1.
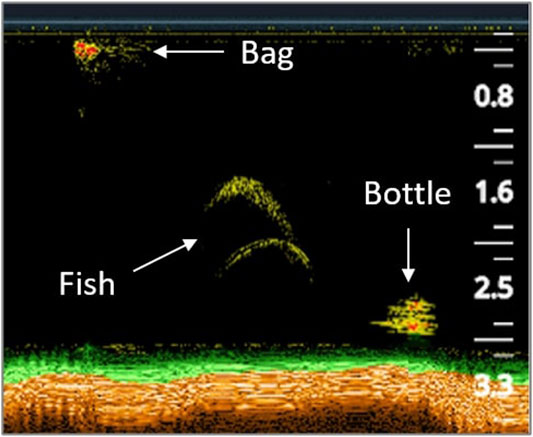
FIGURE 1. Sonar image example including a plastic bag, bottle and fish. Obtained using the Deeper CHIRP + fish finder. The numbers on the vertical axis present the depth below the water surface (m).
Controlled Tests in the Pool
The controlled tests aimed to investigate influencing factors on sonar reflection, such as the orientation of objects, flow velocity and object depth. We conducted three experiments to isolate the effects of 1) object size, 2) object depth, 3) flow velocity. Additionally, we tested the influence of object orientation on the sonar signal reflection.
The controlled tests were done in the Kerkpolder swimming pool in Delft (51° 59′ 25.9″ N 4° 19′ 53.3″ E). A framework of ropes was constructed, allowing passing items underneath the sensor at different depths, velocity, and orientation, see Figure 2. We minimized the influence of object orientation during the first experiments by using spherical balloons filled with water as test objects. The reflected signal was therefore mainly influenced by actual object size, depth and flow velocity.
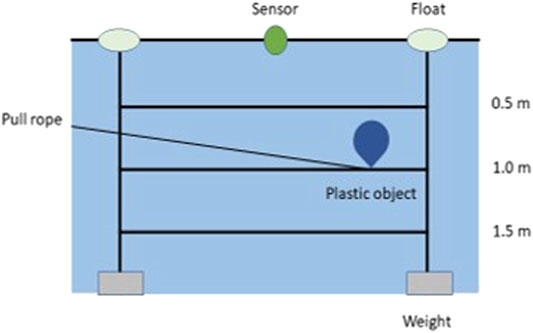
FIGURE 2. The experimental set-up used during the controlled tests in the swimming pool.
To investigate if a larger object returns a larger sonar signal reflection, a small (8 cm diameter) and large balloon (15 cm diameter), filled with water (same as ambient water), were passed underneath the sensor for fixed depth (0.5 m) and speed (0.15 m/s). The flow velocity was defined by recording the time of movement (pulling the objects with a rope) over a fixed distance. Secondly, to see if the depth of an object in the water column does influence the sonar signal return, the balloon of 15 cm was passed by the sensor at a depth of 0.5 and 1 m below the water surface, at a fixed velocity of 0.15 m/s. Thirdly, the influence of flow velocity on the sonar signal reflection was examined by pulling the 15 cm balloon underneath the sensor for fixed depth (0.5 m) at two different flow velocities, 0.15 and 0.25 m/s, respectively. These different experiments were repeated ten times. The flow velocities were chosen because of practical limitations. The maximum velocity was restricted to 0.25 m/s, 0.15 m/s was used as velocity between 0 and 0.25 m/s. We tested the influence of object orientation in a separate experiment. For this, we used a filled 1.5 L plastic water bottle. The bottle was fixed to a depth of 1 m and held horizontally orientated for a duration of 30 s. This was thereafter repeated for the bottle being vertical orientated.
The used echo sounder has several options for beam width. We used a beam angle (total angle) of 7°, which provides the highest scanning resolution (target separation of 1 cm) and lowest spatial resolution (smallest scanning area). These beam settings result in a blind zone of 15 cm at the water surface, for which the sensor is not able to detect objects due to surface clutter. In the end, the significance of the results was determined using an independent t-test with 0.05 as significance level.
Semi-Controlled Tests in the Rio de San Pedro (Spain)
Semi-controlled test were carried out in the Rio de San Pedro, a tidal river close to the city of Puerto Real, Spain (36° 31′ 53.9″ N 6° 12′ 56.5″ W). This location was chosen because of its varying flow rate and salinity levels, besides the tests could be performed using an existing platform. The width and depth at the measuring location were 100 and 5 m, respectively. Floating items passing the river could easily be observed by the eye. The goal was to obtain data on plastic detection with sonar for different plastic items. The sensor was deployed in the Rio de San Pedro [Figure 3 (1)] to collect reflection signals for specific plastic objects, and test the performance under natural river conditions. During these tests, the river flow velocity was measured and on average 0.22 m/s. The experiment was conducted by releasing a set of objects, attached to thin fishing lines, repeatedly into the river, passing the scanning beam of the sensor between 0.5 and 2.5 m below the surface. As the objects were released into the river, they passed the sensor driven by the river flow velocity, as illustrated in Figure 4 (1). This was repeated ten times per item. To obtain a robust dataset, and apply the sensor for varying conditions (turbidity and salinity), this experiment was repeated on five days (3, 10, 14, 25 and 29 October, 2019). The set of items used for this experiment was based on the most abundant plastic items in river systems according to literature (González Fernández et al., 2018; van Emmerik et al., 2020). To obtain a broad overview of the detection abilities of sonar, items of different dimensions and material properties were used. The set included a cup, bag, can, small plastic bottle, large plastic bottle, small food packaging item, large food packaging item, and a food container (photos of the objects and the object dimensions are presented in the Supplementary Materials). During these tests, the scanning beam width of the sensor was set to the narrow beam of 7°. To analyse if the sonar signal footprint was significantly different for the tested items, an independent t-test with a significance level of 0.05 was used.
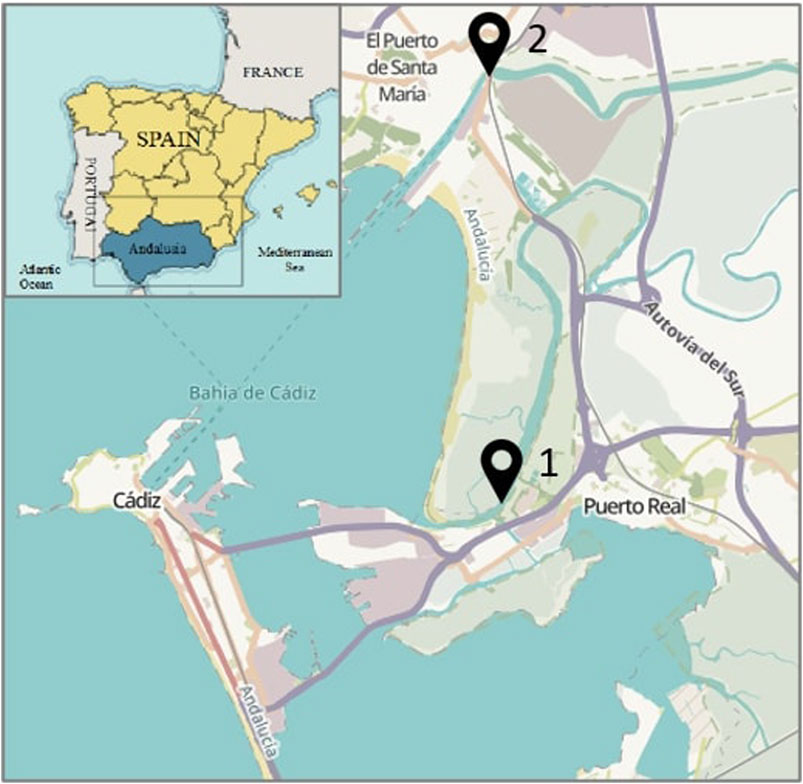
FIGURE 3. The measuring locations used during the fieldtrip in Andalusia, Southern Spain. Location 1, Rio de San Pedro, used for the semi-controlled tests with plastic targets at five days in October 2019. Location 2, Rio de Guadalete, were multiday monitoring is performed for varying tide, at 8 days in October 2019.
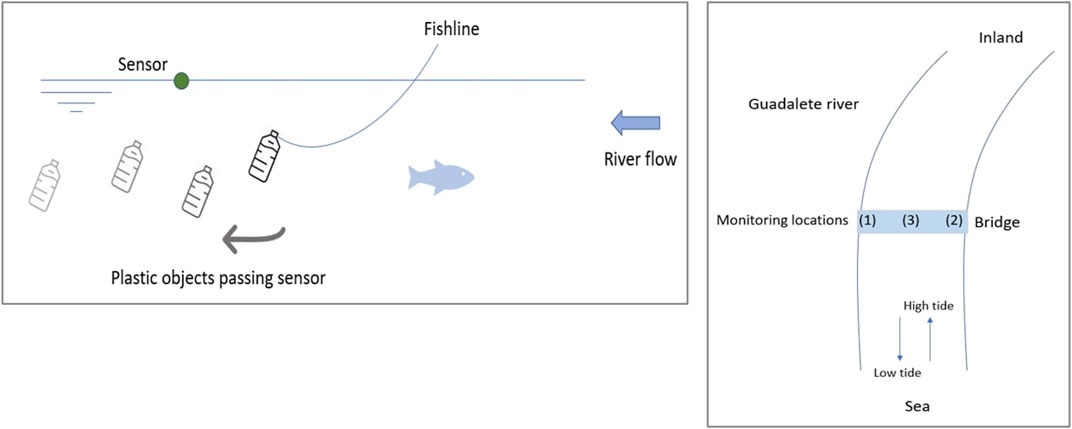
FIGURE 4. Experimental set-ups for the semi-and uncontrolled tests. Set-up 1 (Left), applied in the Rio de San Pedro, passing plastic items underneath the sensor. Set-up 2 (Right), the three monitoring locations over the cross-section of the Rio de Guadalete. Monitoring was performed for 11 sets at location 1, 2 sets at location 2 and 5 sets at location 3.
Field Tests in the Rio de Guadalete (Spain)
The objective of the third experimental campaign was to apply the sensor for monitoring macrolitter in a natural river system. To test the sensor in a natural river system, the sensor was operated during 18 h of monitoring in the Guadalete river in El Puerto de Santa Maria, Spain (36°35′58.6″N 6°13′17.5″W). The Guadalete River basin drains an area of 3,397 km2 and discharges annually 600 million m3 into the Atlantic Ocean. The Guadalete river is known as one of the most polluted rivers in Spain. In the river basin 390,542 inhabitants are located, the estimated mismanaged waste is 6,073 tonnes per year (González-Fernández et al., 2021). It has an average width of 100 m, the depth at the measuring location was approximately 6.3 m. The sensor was deployed from a pedestrian bridge (of 100 m wide) over the river. The river monitoring took place on 8, 11, 17, 22, 23, 24, 26 and October 28, 2019 for varying tidal conditions. The average measured river flow velocity during this experimental campaign was 0.32 m/s. Items floating on the water surface could be detected by visual observation. Monitoring was done for 1 h per testing day and tidal condition. We started monitoring at one location (Location 1) to investigate the influence of tide on the plastic transport. To investigate the cross-sectional litter distribution, we later added monitoring locations 2 and 3. The river flow at the measurement location was bidirectional because of tidal influence in the Gulf of Cádiz (Atlantic Ocean). We therefore investigated the difference in vertical and cross-sectional litter distribution for ingoing and outgoing tide. The monitoring location and setup is shown in Figure 3 (2) and Figure 4 (2).
Plastic litter objects were identified based on the backscatter images obtained during the semi-controlled tests, using both the signal signature as the signal indicated strength (color). Fish were discarded from the sonar readings by their specific arc-shaped reflection (Figure 1). To correct for the shape of the angled scanning beam (cone), the monitored items over the river depth were scaled to 1 m river width. The depth was divided into four zones. For each zone, the total number of items per hour is presented. Besides, a division is made between the two tidal flow conditions (incoming tide and outgoing tide).
The sensor was deployed using the wide beam (47°) which enables scanning with the highest spatial resolution (largest scanning area) but the lowest scanning resolution (least detailed scanning). These beam settings result in a blind zone of 80 cm depth for which objects cannot be detected by the sensor. The significance of the results is determined using an independent t-test with 0.05 as significance level.
Results
Controlled Tests in the Pool
A significant relation was found between the sonar signal reflection and the actual item size (calculated p-value = 0.01). A larger item (15 cm balloon) resulted in a larger displayed sonar signal compared to a smaller item (8 cm balloon). No significant relation was observed between the depth at which an item is present in the water column and the sonar signal reflection (calculated p-value = 0.22). A significant relation was found between the flow velocity and the signal reflection (calculated p-value = 0.00001). For items passing with a larger flow velocity (0.25 m/s), the signal reflection was significantly smaller compared to the signal reflection for a lower flow velocity (0.15 m/s).
Based on these results, we identified some potential sources of uncertainty. We found several outliers in the observations, that may be explained by the method for pulling the items through the water. These outliers can be caused by pulling the objects with a rope instead of letting them naturally flow in the water when passing the sensor. Pulling could induce water displacement in front of the objects and possible disturbance in the sonar signal. Moreover, the filled balloons were not as spherical as envisioned and deformed while pulling them through the water. This deformation (changing object dimensions) could lead to a spread in the observed sonar reflections.
Moreover, there was no clear influence of object depth evident from the sonar signal. However, only two different depths (0.5 and 1 m) were examined. Possibly the influence of depth can be present when testing for a larger range in depth. Lastly, tests were performed at two different velocities (0.15 and 0.25 m/s). It was found that the velocity with which items pass the sensor does influence the sonar signal reflection. A higher flow velocity results in a smaller reflection, compared to a lower flow velocity. It is, however, not tested to what extent objects can still be identified with increasing flow velocity.
The results obtained from the bottle orientation test are displayed in Figure 5. The signal reflection differed significantly for the horizontal and vertical orientated bottle. The sonar reflection for the horizontal and vertical placement of the bottle was 10 and 28 cm, respectively. Compared to the actual dimensions of the water bottle, which is 8.5 cm diameter and 27 cm height, the depth of the sonar signal reflection corresponds approximately to the order of magnitude of the actual dimensions of the bottle.

FIGURE 5. Results obtained during object (bottle) orientation experiment of the controlled tests in the swimming pool. The orange line presents the median, the box is bounded by the first (Q1) and third (Q3) quartile, the whiskers are bounded by the upper and lower data point within the inter-quartile-range (IQR = Q3–Q1). Data points outside the whisker are marked as dots.
Semi-Controlled Tests in the Rio de San Pedro
From the semi-controlled experiments, in the Rio de San Pedro, we found that the average reflection footprints of specific items (including metal) varied substantially (Figure 6). It seems the detected items can be characterized by specific sonar reflections. When looking at the actual item size and the reflection footprint, one would expect, according to the results in section 3.1 that a larger item results in a larger sonar reflection footprint. This is however not the case for all items tested.
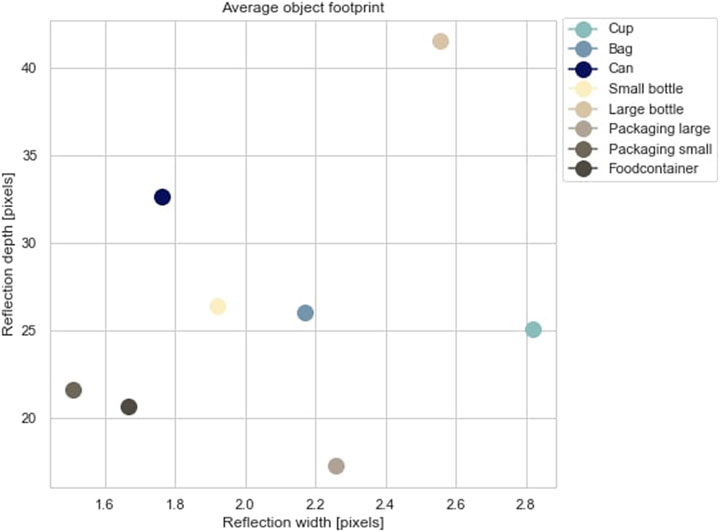
FIGURE 6. The average sonar reflection footprint (depth and width) of the different items tested.
Besides, a variation in the data is observed, Figure 7. The reflection depth, width and area data for the different items are not consistent but spread. When comparing the reflectance depth, width and area of the different items, Table 1, we see that at least one dimension is significantly different for 18 out of the 28 combinations. This supports the potential for litter qualification using sonar.
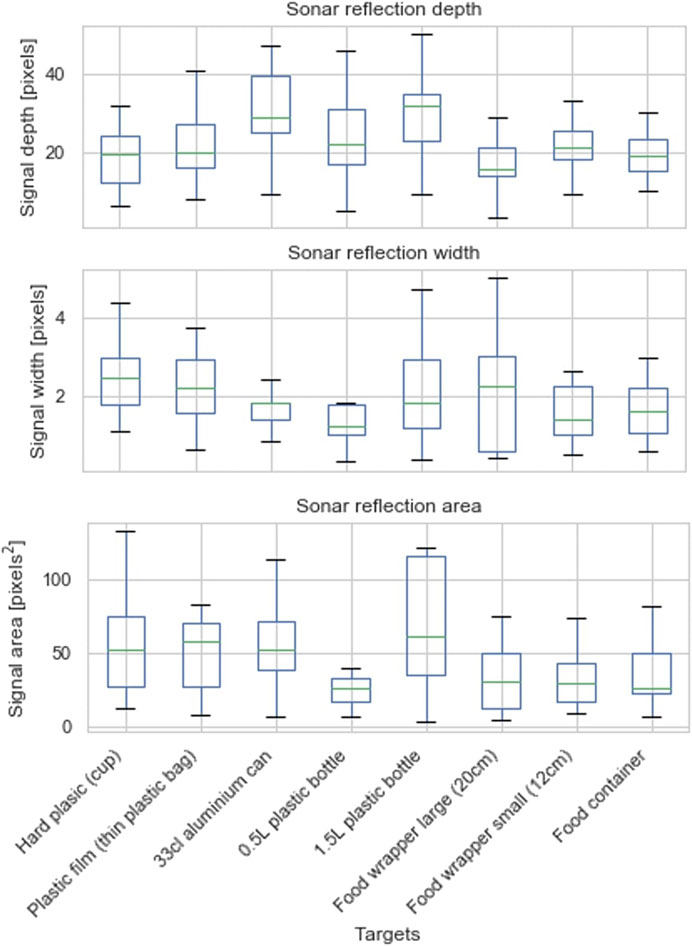
FIGURE 7. The total data of the sonar reflection depth, width and area, for the different debris items (targets). The green line presents the median, the box is bounded by the first (Q1) and third (Q3) quartile, the whiskers are bounded by the upper and lower data point within the inter-quartile-range (IQR = Q3–Q1).
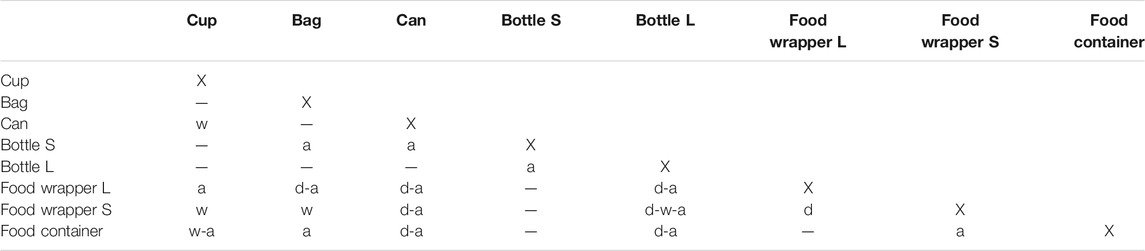
TABLE 1. The significance in depth (d), width (w), and area (a) of the sonar footprints for the tested items compared to each other. When there is a significant difference, the depth, width or area (d-w-a) is indicated.
Possible reasons for the inconsistency (spreading and no direct link with the actual item size) in the data is the influence of the orientation and deformation of the objects. For example, a water bottle, as shown in Figure 5, can result in a very different footprint when orientated differently. Moreover, items such as plastic bags and packaging are likely to deform, which can lead to potentially very different sonar reflections. This makes the identification of items according to their sonar footprint complex.
Besides the dimensions of the sonar signal reflection, the sonar signal intensities are also examined. The metal can corresponds to the highest signal intensity and the food wrapper to the lowest signal intensity. When comparing this to the material properties of the items it can be recognized that for some objects the measurements fit the expectations (higher material density results in higher sonar signal intensity). However, no direct link between the sonar signal intensity and the material properties of the total of tested objects was observed in this study. The potential of classifying items based on their material properties and sonar reflections seems although interesting to investigate further, using for example Artificial Intelligence.
Field Application in the Rio de Guadalete
Lastly, the sensor was applied during a multiday trial monitoring campaign in the Rio de Guadalete. The number of monitored items per hour are shown in Figure 8. In total, the river was monitored for 18 h over eight different days and varying location over the cross-section of the river. The results showed that significantly more items are transported during river ebb tide (water flows from inland to the sea), compared to the river flood tide (water flows from the sea inland).

FIGURE 8. Total monitored items during the field campaign using the wide scanning beam (47°), for the three different locations over the river’s cross-section. Left: monitored items for river water level going from low to high (water flows from the sea inland). Right: monitored items for river water level going from high to low (water flows from inland towards sea).
On average, during ebb tide (high to low river tide), 38 items/hour were detected by the sensor. For flood tide (low to high river tide), 19 items/hour were detected. Furthermore, we found a difference in litter items over the river cross-section. It appears that more litter is transported at location 1 compared to locations 2 and 3. In order to find an explanation, the river’s cross-section was mapped using the sensor, showing that the river bottom is not uniformly shaped over the width of the river. We observed erosion on the outer bend, which coincides with the monitored litter transport peak. Generally, flow velocities are higher in the outer bend and potentially more items could pass the sensor compared to the inner bend, however more replicates at each location would need to be conducted to confirm this conclusion.
Besides counting litter items, the depth at which the litter particles were present is indicated, leading to the particle distribution as illustrated in Figure 9. For each zone, the total number of items per hour is presented. No clear difference is observed for the two tidal flow conditions (IN-OUT). According to the results presented in Figure 9, most litter items are present in Zone 1. An important remark is that due to surface clutter a blind zone, for which the sensor is not able to detect objects, of 80 cm was present at the water surface. In other words, items present in the top 80 cm of the water column are not taken into account. Based on our findings, 50 percent of the monitored litter is present in deeper layers (Zone 2, 3, and 4) of the water column.
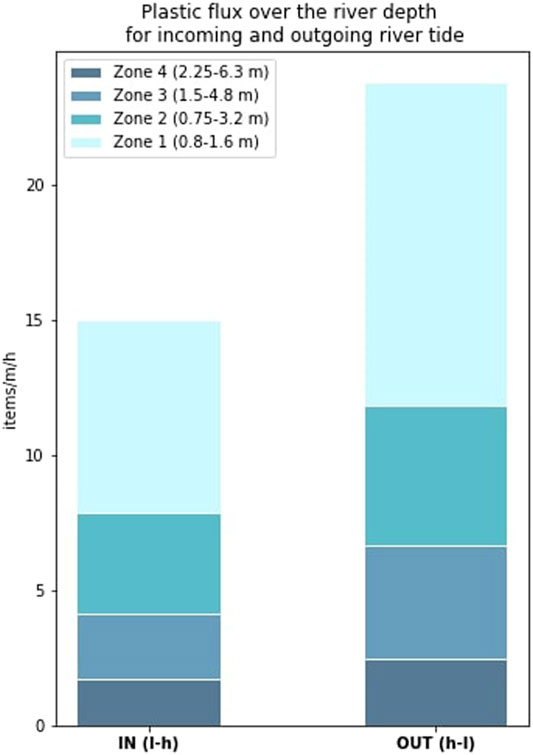
FIGURE 9. Monitored litter (items/hour/m river width) distribution over the river depth (divided in four zones) for incoming and outgoing river tide.
Note that the counted litter items were identified as plastics according to the footprint data obtained during the semi-controlled test. However, the dataset collected during the semi-controlled experiments does not cover the total range of possible litter items. Therefore there is the possibility that other litter items are wrongly identified as plastics, leading to a higher plastic load than actually present. To ensure litter items are correctly identified as plastics, more research is needed to determine footprints of different types of items such as other anthropogenic debris and organic litter. Fish resulted in a very distinct signal reflection, illustrated in Figure 1, and are accordingly assumed to be filtered correctly from the data.
Synthesis
In this paper, we demonstrate that 1) plastics can be detected below the surface using sonar, 2) specific macroplastic items have unique reflections, and 3) results from the Guadalete river suggest plastic items below the surface accounts for a substantial share of the total transport.
Using Echo Sounding to Detect Plastic
Our findings show that echo sounding has potential for monitoring subsurface litter including macroplastics, metal and rubber. Debris items can be detected and possibly be classified based on their size and material properties. Being able to monitor suspended plastics in rivers takes us a step closer to estimate global plastics transport rates.
The dimensions of objects in the sonar reflection imagery are related to the actual size of the passing object (a larger item results in a larger reflection). However, sonar reflections are found to be sensitive to object orientation and deformation. Another factor that influences the sonar reflection is flow velocity. Items passing with high velocity are displayed significantly smaller than items passing with low velocities. The flow velocity upper limit for the detection of objects using echo sounding was not considered in this study (it was tested up to 0.25 m/s). During the semi-controlled tests and the field monitoring, the average flow rate were 0.22 and 0.32 m/s, respectively, which are the same order of magnitude of the controlled test. Depending on the actual object size, higher flow velocity could probably be a limiting factor for plastic detection using echo sounding.
For a widespread application of the echo sounding technique in riverine plastic monitoring some challenges remain. More fundamental testing is needed to discard other litter types (vegetation etc.) from the sensor readings, to be certain on monitoring only anthropogenic litter and plastics. Furthermore, the classification of the different plastic litter objects would be beneficial for source identification and targeted cleaning strategies. We did not find a direct link between object size, material properties and reflected signal. However, our results showed that the potential is there. Very specific and consistent testing of objects ranging in either size or material property could contribute to more robust monitoring using echo sounding.
The Deeper CHIRP+ and Potential of Other Sensors
For this research we used the Deeper CHIRP + fish finder. We chose this sensor because of its accessible price, size, and user-friendliness. For a proof-of-concept this sensor suited his purpose well. The main disadvantage of this sensor is the limitation in raw data export. No raw sonar data could be exported, therefore screenshots of the sonar signals were processed. In general, the accuracy of the results could be affected due to sonar image processing, instead of using raw sonar data.
The sensor was deployed using its different scanning beam settings. For the different settings, blind zones occur near the water surface at which no objects can be detected. For the narrow and wide scanning beam, a blind zone of 15 and 80 cm, respectively, is present. During the executed tests, it was assured that the items passed the sensor below the blind zone. However, for the monitoring activity in the Guadalete river, it needs to be considered that the collected data does not include the full river depth, due to the blind zone at the water surface. For most echo sounding devices, blind zones or blanking distances are present. This leads to limited employability in shallow waters and the use for near-surface objects. Using echo sounding, the surface versus depth distribution of litter cannot be derived directly. The impact of this is however limited since most research efforts and cleaning strategies focus, due to sampling difficulties, on (near) surface plastics (approximately up to 1.5 m depth), and therefore the potential of monitoring with echo sounding devices beyond this 1.5 m proves its complementarity.
Different, more advanced sensors, such as an ADCP or Multibeam echo sounder could potentially lead to more detailed sonar readings and allowing particle size/properties indication. ADCPs are designed for velocity measurements but are currently applied for various purposes. The study of Sassi et al. (2012) shows the applicability of ADCP for monitoring suspended particulate matter in rivers and marine environments. Additionally, using horizontally mounted ADCPs at riverbanks, which enables monitoring during high discharges (Hoitink et al., 2009), indicates also the potential for litter monitoring in rivers. However, the costs of these devices are large (>20.000 Euro) compared to conventional fish finders, which makes them less broadly applicable.
Monitoring in Natural Rivers
When applying the obtained knowledge from the controlled and semi-controlled tests to the field, the following aspects should be considered when using echo sounding as a monitoring technique. As previously stated, the actual litter size is hard to estimate from the sonar readings because of object orientation, deformation, and flow velocity, implying an uncertainty when using the sensor for monitoring purposes. In addition, obtained data on litter transport depends on the chosen beam width, leading to the presence of a blind zone at the water surface.
From the monitoring data obtained in the Guadalete river, a distinct difference between fish and anthropogenic litter could be observed. When comparing the sonar signal data to fish finding theory, fish can be discarded from other objects by the specific shaped signal. However, this assumption is only based on fish finding theories and has not been validated in practice.
For this study we performed tests under controlled, semi-controlled and natural conditions. When reflecting on the tests and the results, we see that for the controlled tests the outcome is clear and the least influenced by varying conditions. The results going from controlled testing to monitoring in the Guadalete river get more influenced and are more difficult to relate to.
In general, monitoring underwater macroplastic remains challenging. This research showed the potential of echo sounding as monitoring technique. However, to go to fully unsupervised monitoring, more insight is needed in the impact of water characteristics such as turbidity, salinity, heavy metal concentrations and levels of phytoplankton on the performance of the echo sounder. In addition, the characteristics of the plastics itself (e.g. size, type, density, depth of suspension) play a crucial role in the detection and monitoring abilities.
Plastics in Suspension
According to our results, 50 percent of the plastics are present below 1.6 m from the water surface (measured from 0.8 m depth due to blind zone). This has a large impact on current monitoring projects, which focus mostly on the plastics in the top layer (1.5 m). Taking into account the material properties of (suspended) plastics, it is likely that litter items are present at different depths based on their density. Moreover, turbulence, litter shape and vegetation may also influence the vertical location of the particles.
The fact that, in the Guadalete river, 50% of the transported litter was present in deep layers of the water column stresses the importance of monitoring subsurface plastics, as they likely account for a large share of the total plastic transport. Recent work shows that underwater plastics make up the largest portion of the plastic mass balance in the Atlantic Ocean (Pabortsava and Lampitt, 2020), this might be the same in rivers. If we want to solve the plastic crisis, more effort is needed to develop monitoring methodologies for underwater plastics. The river surface cannot be the carpet of the future (everything beneath we don’t see).
Conclusion
Echo sounding can be used for detecting suspended riverine macroplastics. Litter items can be counted, while fish can be discarded from the specific signal reflections. Moreover, mean item reflection signals yield unique combinations of width, depth and surface, which can potentially be used to identify different litter types. Litter size was related to the sonar signature, although factors such as flow velocity, object orientation and deformation need to be also considered when estimating size. This remains challenging and further experiments are needed to collect more robust reflection statistics on litter items. In the Guadalete river, significantly more suspended litter is transported when water flows towards the sea compared to water flowing inland. Echo sounding is potentially useful to gain a better understanding of the suspended litter transport, from which prevention and mitigation strategies could be optimized. For further research, it is recommended to use an echo sounder for which the raw sonar data can be exported as a standard digital file. Moreover, the set of test objects should be extended, including a wider range of sizes and shapes. Objects of different size made of the same material and objects of the same size and different material properties should be combined for testing. Side-scan or multibeam sonars might also lead to more accurate characterization of litter sizes and materials.
Data Availability Statement
The original contributions presented in the study are included in the article/Supplementary Materials, further inquiries can be directed to the corresponding author.
Author Contributions
Conceptualization: SB, TE, WL, Methodology: SB, TE, WL, DG-F, Formal Analysis: SB, Data collection: SB, DG-F, Visualization: SB, TE, Writing–original draft: SB, TE, Writing–reviewing and editing: all authors.
Funding
SB was received funding from the Lamminga Fund and the department of Water Resources Management (TU Delft). The work of TE is supported by the Veni research program The River Plastic Monitoring Project with project number 18211, which is (partly) funded by the Dutch Research Council (NWO).
Conflict of Interest
The authors declare that the research was conducted in the absence of any commercial or financial relationships that could be construed as a potential conflict of interest.
Acknowledgments
This paper is based on the MSc thesis: The sound of plastic: A proof-of-concept for detecting suspended riverine macroplastics with echo sounding (Broere, 2020), Delft University of Technology, Netherlands. The data collection was done in collaboration with the University of Cádiz, for which we are thankful.
Supplementary Material
The Supplementary Material for this article can be found online at: https://www.frontiersin.org/articles/10.3389/feart.2021.628704/full#supplementary-material
References
Broere, S. (2020). The Sound of Plastic: A Proof-Of-Concept for Detecting Suspended Riverine Macroplastics with echo Sounding. Delft: Delft University of TechnologyAvailable at: https://repository.tudelft.nl/islandora/object/uuid%3A0e4e725b-07cd-4e8f-a2b0-da6961a72058?collection=education (Accessed May 1, 2020).
Christ, R. D., and Wernli, R. L. (2014). Sonar. ROV Man. 387–424. doi:10.1016/b978-0-08-098288-5.00015-4
Cózar, A., Echevarría, F., González-Gordillo, J. I., Irigoien, X., Úbeda, B., Hernández-León, S., et al. (2014). Plastic Debris in the Open Ocean. Proc. Natl. Acad. Sci. 111 (28), 10239–10244. doi:10.1073/pnas.1314705111
González Fernández, D., and Hanke, G.the RiLON network (2018). Floating Macro Litter in European Rivers - Top Items. EUR 29383 EN, Publications Office of the European Union. doi:10.2760/316058
González-Fernández, D., Cózar, A., Hanke, G., Viejo, J., Morales-caselles, C., Bakiu, R., et al. (2021). Floating Macrolitter Leaked from Europe into the Ocean. Nat. Sustain. 4, 474–483. doi:10.1038/s41893-021-00722-6
González-Fernández, D., and Hanke, G. (2017). Toward a Harmonized Approach for Monitoring of Riverine Floating Macro Litter Inputs to the Marine Environment. Front. Mar. Sci. 4 (March), 1–7. doi:10.3389/fmars.2017.00086
Hoitink, A. J. F., Buschman, F. A., and Vermeulen, B. (2009). Continuous Measurements of Discharge From a Horizontal Acoustic Doppler Current Profiler in a Tidal River. Water Resour. Res. 45 (11), W11406. doi:10.1029/2009WR007791
Lau, W. W. Y., Shiran, Y., Bailey, R. M., Cook, E., Stuchtey, M. R., Koskella, J., et al. (2020). Evaluating Scenarios toward Zero Plastic Pollution. Science. 369 (6510), 1455–1461. doi:10.1126/science.aba9475
Liedermann, M., Gmeiner, P., Pessenlehner, S., Haimann, M., Hohenblum, P., and Habersack, H. (2018). A Methodology for Measuring Microplastic Transport in Large or Medium Rivers. Water. 10 (4), 414–512. doi:10.3390/w10040414
Meijer, L. J. J., van Emmerik, T., van der Ent, R., Schmidt, C., and Lebreton, L. (2021). More Than 1000 Rivers Account for 80% of Global Riverine Plastic Emissions into the Ocean. Sci. Adv. 7 (18), 1–14. doi:10.1126/sciadv.aaz5803
Morritt, D., Stefanoudis, P. V., Pearce, D., Crimmen, O. A., and Clark, P. F. (2014). Plastic in the Thames: A River Runs Through it. Mar. Pollut. Bull. 78 (1–2), 196–200. doi:10.1016/j.marpolbul.2013.10.035
Pabortsava, K., and Lampitt, R. S. (2020). High Concentrations of Plastic Hidden Beneath the Surface of the Atlantic Ocean. Nat. Commun. 11 (1), 1–11. doi:10.1038/s41467-020-17932-9
Sassi, M. G., Hoitink, A. J. F., and Vermeulen, B. (2012). Impact of Sound Attenuation by Suspended Sediment on ADCP Backscatter Calibrations. Water Resour. Res., 48 (9), W09520. doi:10.1029/2012WR012008
Schöneich-Argent, R. I., Dau, K., and Freund, H. (2020). Wasting the North Sea? - A Field-Based Assessment of Anthropogenic Macrolitter Loads and Emission Rates of Three German Tributaries. Environ. Pollut. 263, 114367. doi:10.1016/j.envpol.2020.114367
Schwarz, A. E., Ligthart, T. N., Boukris, E., and van Harmelen, T. (2019). Sources, Transport, and Accumulation of Different Types of Plastic Litter in Aquatic Environments: A Review Study. Mar. Pollut. Bull. 143, 92–100. doi:10.1016/j.marpolbul.2019.04.029
Shan, P. (2018). Image Segmentation Method Based on K-Mean Algorithm. J. Image Video Proc. 2018 (1), 81. doi:10.1186/s13640-018-0322-6
Valdenegro-Toro, M. (2019). Deep Neural Networks for Marine Debris Detection in Sonar Images. Available at: http://arxiv.org/abs/1905.05241 (Accessed August 10, 2020). doi:10.1109/ecmr.2019.8870959
van Emmerik, T., and Schwarz, A. (2020). Plastic Debris in Rivers. WIREs Water. 7 (1), e1398. doi:10.1002/wat2.1398
van Emmerik, T., Kieu-Le, T.-C., Loozen, M., van Oeveren, K., Strady, E., Bui, X.-T., et al. (2018). A Methodology to Characterize Riverine Macroplastic Emission into the Ocean. Front. Mar. Sci. 5 (October), 1–11. doi:10.3389/fmars.2018.00372
van Emmerik, T., Roebroek, C., de Winter, W., Vriend, P., Boonstra, M., and Hougee, M. (2020). Riverbank Macrolitter in the Dutch Rhine-Meuse delta. Environ. Res. Lett. 15, 104087. doi:10.1088/1748-9326/abb2c6
Keywords: macroplastic, hydrology, sonar, marine litter, microplastic
Citation: Broere S, van Emmerik T, González-Fernández D, Luxemburg W, de Schipper M, Cózar A and van de Giesen N (2021) Towards Underwater Macroplastic Monitoring Using Echo Sounding. Front. Earth Sci. 9:628704. doi: 10.3389/feart.2021.628704
Received: 12 November 2020; Accepted: 01 July 2021;
Published: 20 July 2021.
Edited by:
David Glenn Chandler, Syracuse University, United StatesReviewed by:
Ahmed Kenawy, Mansoura University, EgyptKathy A. Townsend, University of the Sunshine Coast, Australia
Copyright © 2021 Broere, van Emmerik, González-Fernández, Luxemburg, de Schipper, Cózar and van de Giesen. This is an open-access article distributed under the terms of the Creative Commons Attribution License (CC BY). The use, distribution or reproduction in other forums is permitted, provided the original author(s) and the copyright owner(s) are credited and that the original publication in this journal is cited, in accordance with accepted academic practice. No use, distribution or reproduction is permitted which does not comply with these terms.
*Correspondence: Sophie Broere, sophiebroere@gmail.com