Development of Engineered Cementitious Composites Using Sea Sand and Metakaolin
 Qiyao Yao
 Zuo Li
 Chenyu Lu
 Linxin Peng1,2,3
  Xiaodan Teng
- 1School of Civil Engineering and Architecture, Guangxi University, Nanning, China
- 2Key Laboratory of Disaster Prevention and Structural Safety of Ministry of Education, Guangxi University, Nanning, China
- 3Guangxi Key Laboratory of Disaster Prevention and Engineering Safety, Guangxi University, Nanning, China
- 4Hualan Design & Consulting Group, Nanning, China
- 5Guangxi Transportation Science & Technology Group CO., LTD, Nanning, China
The present study investigates the possibility of using sea sand, instead of silica sand, in producing engineered cementitious composites (ECCs) and the optimal mix proportion, mechanical behavior, and erosive effect of chloride ions on sea sand ECCs (SECCs). Nine groups of SECC specimens were prepared based on the orthogonal test design, and these cured for the uniaxial tensile, uniaxial compression, and fracture energy tests. The roundness and sphericity of sea sand and silica sand were quantified by digital microscopy. The microstructure and composition of SECCs were characterized by scanning electron microscopy (SEM) and X-ray diffraction (XRD). The mix proportions of SECCs with a tensile strain capacity more than 2% and a compressive strength more than 60 MPa were obtained. The factor analysis of these serial tests revealed that the contents of both fly ash and sea sand have a significant effect on the compressive strength and tensile strain capacity of SECCs. The fracture energy test revealed that the matrix fracture toughness of SECCs significantly increases with the increase in sea sand content. The XRD analysis revealed that the addition of metakaolin can enhance the ability of SECCs to bind chloride ions, and with the increase in chloride ion content, the ability of SECCs to bind chloride ions would improve. The results of the present study provide further evidence of the feasibility of using sea sand in the production of ECCs, in order to meet the requirements of diverse concrete components on ductility and durability.
Introduction
Engineered cementitious composites (ECCs) are a novel structural material with high resistance to crack and damage and were originally proposed by Li and Leung (Li and Leung, 1992). With the addition of fibers, the tensile strain–hardening characteristic of more than 2% ultimate tensile strain can be obtained, which is approximately 200 times that for ordinary concrete. Excellent crack control, good resistance to wear and spalling, provides ECCs great potentials in the replacement of mainstream building materials (Li et al., 2003; Kojima et al., 2004; ECC Technology Network, 2005; Rokogo and Kanda, 2005; Li and Xu, 2009; Zhong, et al., 2021). However, the aggregate used by ECCs is generally fine silica sand, which is priced at 20–30 times more than untreated sea sand (price varies by region). This high cost limits ECCs’ large-scale production and further application in the construction industry. Therefore, it is a promising approach to use sea sand in the place of fine silica sand, in order to reduce the cost of production.
In addition, the preparation of ECCs by sea sand not only saves costs but also eliminates the time-consuming problem of transporting silica sand from inland to coastal areas, thereby shortening the construction period. Huang et al. (Huang et al., 2020a) discussed the feasibility of producing seawater sea sand ECCs (SS-ECCs) by compressive tests and direct tensile tests, and the results indicated that seawater and sea sand slightly increase the compressive strength by 12% and marginally decrease the tensile strength by 6% and tensile strain capacity by 18%. Furthermore, some scholars (Huang et al., 2020b; Huang et al., 2021; Yu et al., 2021) comprehensively investigated the influence of sea sand size, polyethylene fiber length, and fiber volume dosage on the mechanical performance and crack characteristics of SS-ECCs. They proposed a probabilistic method to analyze the reliability of the tensile strain capacity of SS-ECCs, a five-dimensional representation to assess the overall performance of SS-ECCs, and a probabilistic model to describe the stochastic nature and evolution of crack width. Yao et al. (Yao et al., 2022) used sea sand to partially replace silica sand, in combination with BFRP bars, in order to greatly improve the tensile strength of SECCs. Although the effect of sea sand on the mechanical behavior of ECCs has been previously examined, until recently, few data hinted at the importance of chloride ions and the negative effects on the mechanical property of SECCs.
In terms of replacing silica sand with sea sand, the high content of chloride ions in sea sand would corrode the reinforcement. In the present study, metakaolin was added to alleviate the erosive impact of chloride ions, and the comprehensive effects of the amount of fly ash and sea sand on the mechanical properties of SECCs were investigated, according to the orthogonal test design method and the typical ECC design basis (Li, 2012). Analysis of variance (ANOVA) and range analysis were performed on the data through uniaxial tensile and uniaxial compression tests, in order to obtain the optimal fit ratio for tensile strain capacity and compressive strength. The roundness and sphericity of sand were quantified using a digital microscope to distinguish the grain morphology of sea sand from that of the silica sand matrix. Scanning electron microscopy (SEM) and X-ray diffraction (XRD) were used to analyze the mechanism of factor action from a microscopic viewpoint and the chemical composition. In addition, the influence of matrix fracture toughness on the tensile properties of SECCs was investigated using the fracture energy test. The present study would provide reference for further research on the engineering applications of SECC proportion design, contributing to the establishment of the balance between the economy and material properties.
Materials and Methods
In the replacement of silica sand with sea sand, there is concern that the high content of chloride ions in sea sand would corrode the steel reinforcement. There are two binding forms of chloride ions in cement-based materials. One is physical adsorption, that is, chloride ions are adsorbed on the surface of the C-S-H gel. However, the binding force is relatively weak, making it easy to be damaged due to the conversion of the adsorbed chloride ions into free chloride ions (Wang et al., 2013). The other form is chemical binding. Previous studies (Ben-Yair, 1974) have revealed that, in the case of mixed chloride ions, chloride ions would react with the cement hydration product Ca(OH)2 to generate CaCl2 and subsequently react with C3A in the cement to generate Friedel’s salt. The chemical reaction is as follows:
The above chemical reaction shows that the binding of chloride ions is mainly due to the formation of Friedel’s salt, and the amount of chloride ions that are bound usually increases with an increment in the effectiveness of the Al2O3 content in cementitious materials. Compared with various supplementary cementitious materials (silica powder, slag, and fly ash), metakaolin (45% Al2O3) has the highest binding rate of chloride ions (Thomas et al., 2012). As the content of Al2O3 in the matrix increases (the content of C3A increases in the matrix), the equilibrium equation (2) of the chemical reaction moves to the right. That is, as the metakaolin content increases, the binding rate of chloride ions also increases. Furthermore, metakaolin can refine the pore structure of concrete, reduce chloride ion transport channels, and improve chloride ion penetration resistance (Zeng et al., 2015). However, the Al2O3 content in cement is merely approximately 5–12%, while metakaolin can reach as high as 40%. Therefore, metakaolin was added in the present experiment to bind the chloride ion and refine the pore structure.
In addition, after the replacement of silica sand with sea sand, which is generally a medium-size sand, the increase in aggregate particle size would lead to more tortuous crack paths (Li, 2012). Thus, the matrix fracture toughness (Km) would not be conducive to multiple cracks. Considering that Km in the matrix decreases with the increase in fly ash content (Turk and Nehdi, 2018), the investigators attempted to increase the fly ash content to reduce the fracture toughness (Km) of the matrix, thereby maintaining the ductility of the SECC.
Orthogonal Experimental Design
The orthogonal test is a mathematical method for conducting multifactorial tests based on statistical principles and the orthogonal theory (Statistics group of institute of mathematics CAS, 1975). The orthogonal test selects sufficient representative samples from the full-scale test, according to orthogonality, in order to analyze the relationship between factors and results. The representative samples have the characteristics of uniform dispersion and neat comparison, which is the main method for the fractional factor analysis design. In the present study, the orthogonal test was used to determine the optimal mix proportion. The orthogonal test is widely used in research works and can handle complex issues with significantly lower cost and less time (Bai et al., 2009).
In the present study, the experimental factors to be considered were sea sand content (factor A), metakaolin content (factor B), and fly ash content (factor C). The basis of the orthogonal test is the orthogonal table, and according to the number of different factors or values, different orthogonal tables are selected. The test factors and levels are presented in Table 1. The L9(34) orthogonal table (Gao et al., 2019) was applied for the present study. The mix proportions used in the orthogonal test are presented in Table 2.
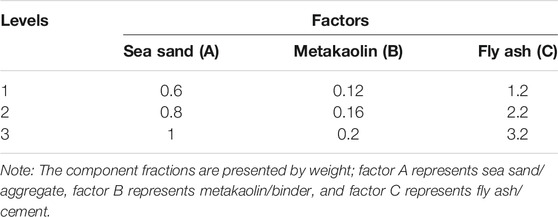
TABLE 1. Test factors and levels.
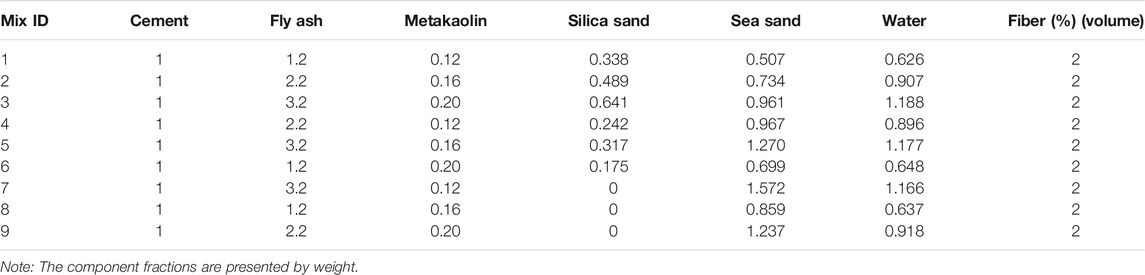
TABLE 2. Mix proportions of SECCs.
Raw Materials and Specimen Preparation
SECCs comprise ordinary Portland cement [Class P.O 42.5, Guangxi, China (General Administration of Quality Supervision, Inspection and Quarantine of the People's Republic of China, 2007)], fly ash (aggregate size 13 μm, Class I, Henan, China), metakaolin (aggregate size 6.5 μm, Henan, China), fine silica sand (aggregate size 106 μm, Jiangsu, China), sea sand (chloride content 0.21%, fineness modulus 2.43, and shell particle content 4.4%; the grading curve is presented in Figure 1; Philippines), water, polycarboxylate superplasticizer (water reducing rate 25%, Anhui, China), and 2% (volume %) polyvinyl alcohol fiber (the physical and mechanical characteristics are presented in Table 3; Kuraray, Japan). The average aggregate diameter used in this study is the average length diameter Dl. By adding the diameters of all the aggregates of the sample and dividing them by the total number of aggregate diameters, the average diameter of the aggregates obtained is equal to the arithmetic mean of the diameters of all the particles and is called the average length diameter Dl. (Zhang et al., 2000). The chemical composition of cement, fly ash, and metakaolin is presented in Table 4. The grading curves for fly ash, metakaolin, and silica sand were determined by particle size analysis (PSA), as shown in Figure 1. The sand-to-binder and water-to-binder ratios were 0.36 and 0.27, respectively. The dose of the water-reducing agent was adjusted according to the consistency of the mixture during mixing. The adjustment principle was that the slump of the mixture should reach 200 ± 10 mm.
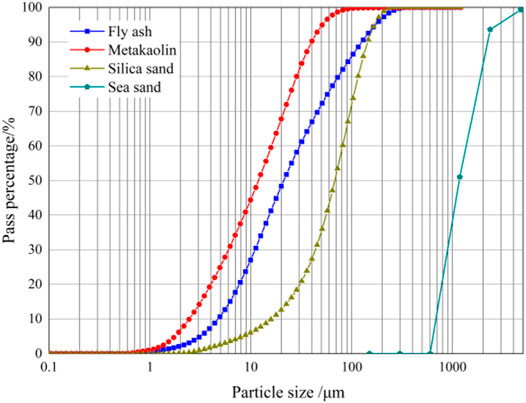
FIGURE 1. Particle size distribution of fly ash, metakaolin, silica sand, and sea sand.

TABLE 3. Physical and mechanical characteristics of the PVA fiber.
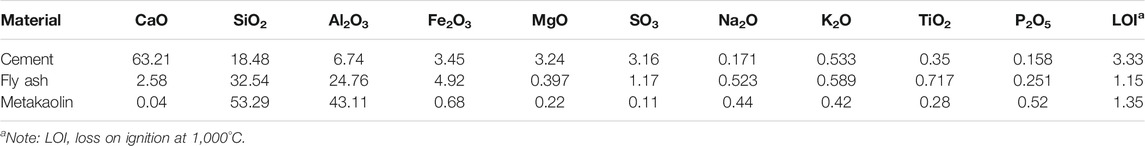
TABLE 4. Chemical composition of cement, fly ash, and metakaolin (%).
The uniaxial compression compressive strength of SECCs was measured using cubes, with a dimension of 70.70 mm × 70.70 mm × 70.70 mm, which has been widely used in China (Ministry of Industry and Information of the People’s Republic of China, 2018). Then, a 400 mm × 100 mm × 15 mm rectangular plate was used for the tensile test (Li et al., 2001). Four 2 mm thick aluminum plates were pasted at the two ends of the plate specimen to reduce the potential stress concentration caused by the clamping part.
The mixing procedure was initiated by dry mixing of cement, metakaolin, sea sand, fly ash, and fine silica sand using a standard mortar mixer for 2 min (140 rpm). Afterward, the water and water reducer were added to the dry components (stirred at 285 rpm for 5 min), and the PVA fibers were slowly mixed while stirring at 285 rpm for 5 min. Then, the specimens were shaken for 1 min after pouring and allowed to stand for 24 h in an environment with a temperature of 25 ± 3°C and a relative humidity of 65 ± 2%. Next, the specimens were stored at a relative humidity of 95 ± 5% and a temperature of 20 ± 2°C, at the age of 28 days. Three specimens were prepared for each proportion used for the tensile test, and three specimens were prepared for each proportion used for the compressive test. The tensile tests were conducted using a microcomputer-controlled electro-hydraulic servo universal testing machine. In the tensile test, the loading method was displacement controlled, and the loading rate was 0.20 mm/min. In the compression test, the loading rate was 0.30 MPa/s.
In order to determine the influence of the fracture toughness of the matrix on the tensile property of SECCs, a three-point bending test on the notched beam was conducted according to ASTM E399-12 (ASTM, 2009). The specimen size was 354 mm × 75 mm × 40 mm. Before the test, a 30.0 mm deep notch was cut at the middle bottom of the specimen, as shown in Figure 2A. During the test, a clip extensometer was used to measure the crack mouth opening displacement (CMOD), with a loading rate of 0.05 mm/min. The loading details are presented in Figure 2B.
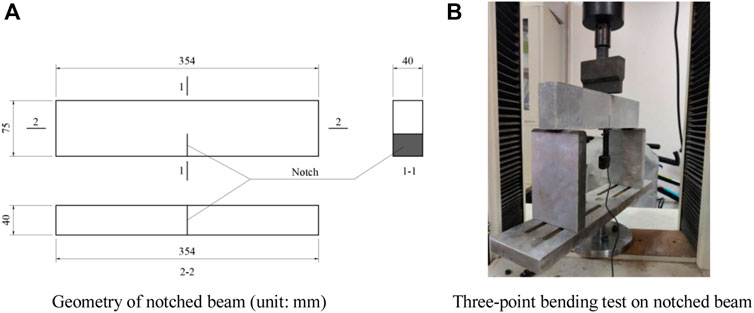
FIGURE 2. Notched beam size and loading method. (A) Geometry of the notched beam (unit: mm). (B) Three-point bending test on the notched beam.
Results and Discussions
Uniaxial Tensile Performance
Test Results
The ultimate tensile stress and ultimate tensile strain of SECCs are listed in Table 5. The ultimate tensile strain of SECCs with different mix proportions ranges between 0.38 and 2.4%. The tensile specimen with more than 15% difference compared to the average value was eliminated based on the experimental standard (Ministry of Industry and Information of the People’s Republic of China, 2018). The stress–strain curves of the two tensile tests are presented in Figure 3. It can be observed from the stress–strain curve that all mixtures exhibited distinct strain-hardening characteristics. Followed by cracking, the bridging capacity of the fiber restricts further crack propagation, and the fluctuation of stress on the curve reflects the generation of multiple cracking behaviors on the specimen surface. In order to scientifically analyze the influence of various factors on SECCs, range analysis and variance analysis were performed on the data in Table 5. The null column in the table is actually a comprehensive column of uninvestigated interactions and other unknown influencing factors, which can reflect the errors caused by random factors.
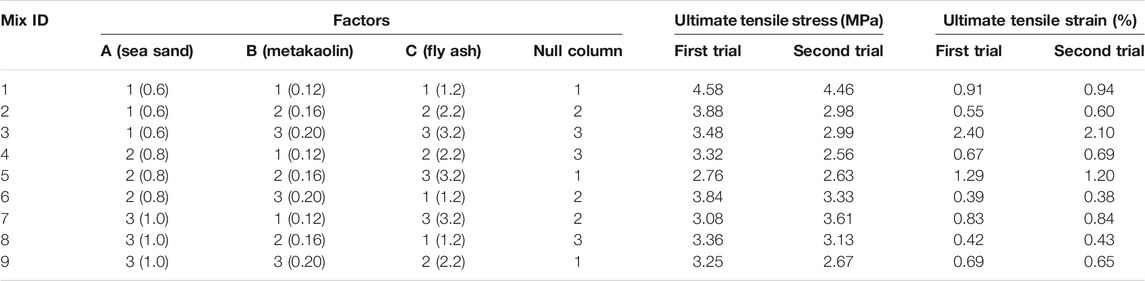
TABLE 5. Results of the uniaxial tensile test of SECCs.
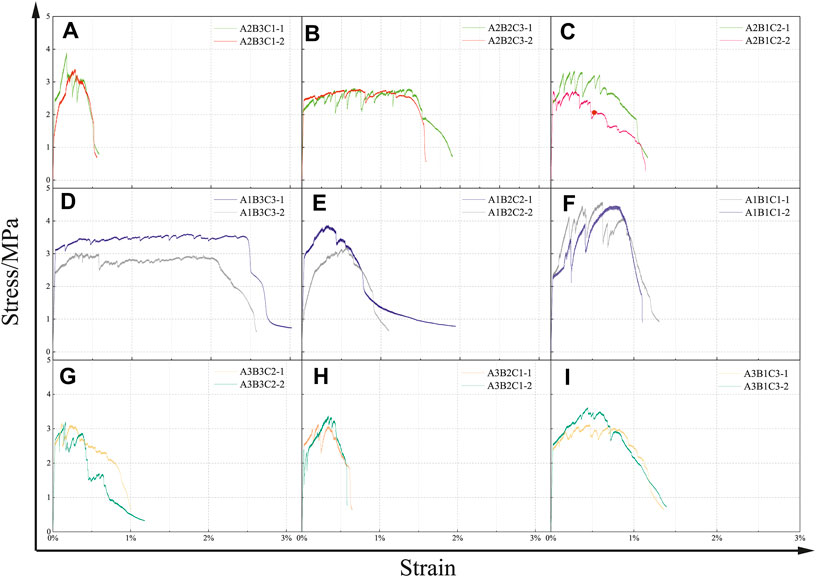
FIGURE 3. Tensile stress–strain curves of SECCs. (A): A2B3C1; (B): A2B2C3; (C): A2B1C2; (D): A1B3C3; (E): A1B2C2; (F): A1B1C1; (G): A3B3C2; (H): A3B2C1; (I): A3B1C3.
Range Analysis
Range analysis can quickly and intuitively analyze the primary and the secondary order of influencing factors and obtain the optimal mix proportion of SECCs. Range analysis was carried out, and the analysis results for ultimate tensile stress are presented in Table 6. The order of influence of each factor on ultimate tensile stress is fly ash content > sea sand content > metakaolin content, and the optimal mix proportion is A1B1C1. It can be observed from the optimal proportion that the ultimate tensile stress was the greatest when the content of sea sand and fly ash was the lowest. This is because a lower Km is attained with the increase in fly ash (Li, 2012), and the decrease in Km resulted in the decrease in tensile strength. The addition of sea sand also reduced the ultimate tensile stress, but its influence was less than that of fly ash. However, the matrix fracture toughness Km of the ECC matrix increased with the increase in aggregate particle size. This can be attributed to the fact that an increase in aggregate size can lead to fiber reunion, which prevents fibers from performing well in bridging (Li and Li, 2013), ultimately leading to the reduction in ultimate tensile strength. In the present study, digital microscopy was used to quantify the particle morphology of sea sand and silica sand, in order to determine whether there are morphological factors other than particle size that affect the mechanical properties of SECCs. The reason for the minimal effect of metakaolin on the ultimate tensile stress of SECCs is that although metakaolin can refine the pore structure and improve the tensile strength of SECCs to a certain extent, it mainly plays the role of binding the chloride ion in the matrix. Furthermore, this has the least amount in the matrix. Therefore, this has a minimal effect on the ultimate tensile stress of SECCs.
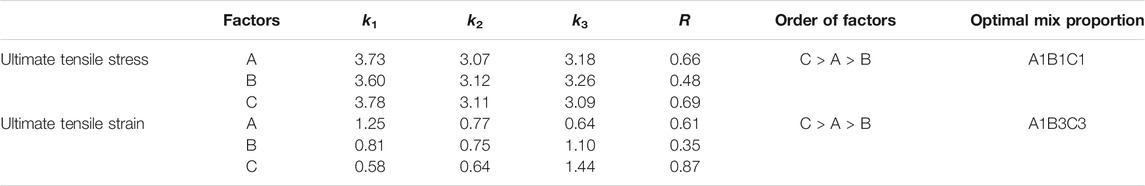
TABLE 6. Range analysis of the uniaxial tensile test of SECCs.
According to the range analysis of the ultimate tensile strain, the order of influence of each factor on the ultimate tensile strain is also fly ash content > sea sand content > metakaolin content, and the optimal mix proportion is A1B3C3. This is because as the content of fly ash increases, the chemical bonding of the fiber/matrix interface decreases, and the frictional bonding increases (Yang, 2007). In particular, the interface bond would be helpful for the fiber pull-out failure, rather than the fiber tensile failure, in the matrix. Furthermore, the increase in fly ash would reduce the matrix fracture toughness Km. Both trends are conducive to the development of multiple cracks in SECCs and improving the ductility. In order to further confirm this result, the destruction of fibers in specimens was observed using a scanning electron microscope after unloading. The range analysis results revealed that the enhancement amplitude for matrix fracture toughness by sea sand (when the content was 0.6) was less than the reduction amplitude for matrix fracture toughness by fly ash (when FA/C was 3.2). However, when the sea sand content was ≥0.8, the increase of matrix fracture toughness for sea sand was greater than the decrease of matrix fracture toughness for fly ash. In general, the ultimate tensile strain generally decreases with the increase in sea sand content. In addition, with the same amount of sea sand, the higher the content of fly ash, the better the ductility, which is consistent with the previous discussion.
Analysis of Particle Morphology
The critical issue to be addressed for the SECC mix proportion design is to satisfy both the strength and energy criteria (Li, 2012). The strength criterion must initially be met when microcracks are generated. That is, the first cracking strength controlled by the matrix fracture toughness should be less than the fiber bridging capacity σ0 at any given potential crack surface:
In addition, the energy criterion must be satisfied. The flat crack propagation mode requires an energy balance, that is, the work performed by the tensile load applied on the matrix σssδss must be equal to the energy required to break down the toughness of the crack-tip material Jtip and the energy required to open the fiber bridging crack from 0 to δss:
where
where Ec refers to Young’s modulus of the matrix, and the left side of Eq. 4 is called the complementary energy. When σ(δ) reaches the bridging stress σ0(δ0), the complementary energy reaches the maximum value:
In order to achieve steady-state cracking, the following is necessary:
As an important ingredient for typical ECCs, sand has an important impact on the basic mechanical properties, workability, shrinkage rate, and material cost of materials (Li, 2011). A larger aggregate particle size increases the sinuosity of the crack propagation and matrix fracture toughness Km (Li, 2012). This is not conducive to flat crack propagation necessary for ECCs and can cause fiber reunion, resulting in the insufficient fiber bridging capacity of flat cracks (Li and Li, 2013). Wu et al. (Wu et al., 2019) explored the influence of the morphological parameters of sand on the mechanical performance of ECCs and determined the morphological parameters (including particle roundness and sphericity) of river sand using image analysis and computer algorithms.
Wadell and Hakon (Wadell, 1932; Wadell, 1933) first proposed the use of roundness to describe the sharpness of particle corners. As shown in Figure 4, rin refers to the radius of the maximum inscribed circle, ri refers to the radius of the ith inscribed circle, and n refers to the total number of corner circles. The roundness of sand particles is defined as the ratio between the average radius of the curvature at the particle corners and the maximum radius of the inner circle in the following equation:
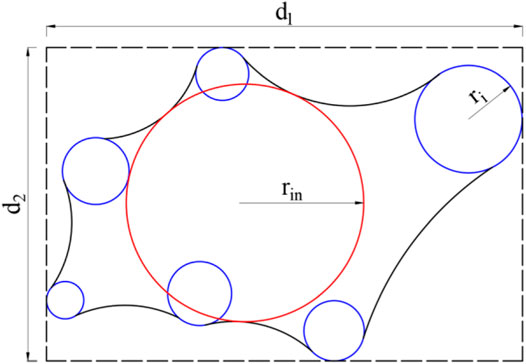
FIGURE 4. Geometric features of sand particles.
R ranges from 0 to 1. The rounder the sand, the closer the value of R to 1. The sphericity of sand particles describes the approximation degree of the projected area of particles to a circle (Krumbein and Sloss, 1951) as the ratio of the particle width d2 to the particle length d1 in Eq. 9. For the sphericity of spherical particles, S is equal to 1. For elongated particles, S≪1:
Under a digital microscope, the sphericity and roundness of silica sand and sea sand are calculated, as shown in Figure 5. The yellow circle represents the inner circle of the sand corners, while the red circle represents the maximum inner circle of the sand particles. A total of 100 complete sand particles were randomly selected from the electronic images of these two kinds of sand, and the roundness and sphericity were calculated and averaged. It can be observed from the calculation results that the sphericity and roundness of these two kinds of sand are not significantly different, and the main difference lies in the particle size and main component. The average particle size of sea sand is 0.42 mm, while the average particle size of silica sand is 0.10 mm. In addition, the main components of sea sand are SiO2 and CaCO3, while the main component of silica sand is SiO2. Therefore, the difference in aggregate morphology between sea sand and silica sand has minimal impact on the fracture toughness of the SECC matrix. This is consistent with the previous discussion that the influence of aggregates on the ultimate tensile stress and ultimate tensile strain of SECCs mainly lies in the particle size.
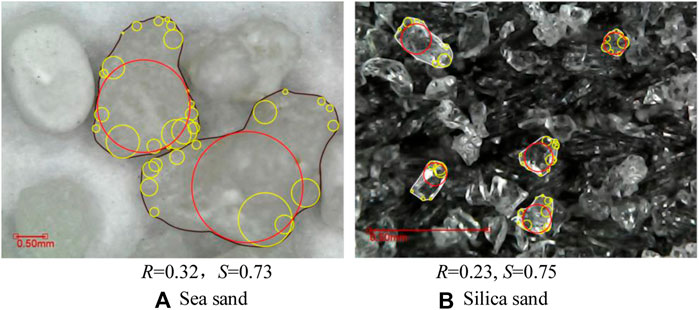
FIGURE 5. Schematic diagram for the roundness and sphericity calculation of (A) sea sand and (B) silica sand.
Morphology Analysis
After the uniaxial tensile test, the sections of each group of specimens, with a size of 15 mm × 15 mm × 10 mm, were taken out using a small cutting machine. A Phenom scanning electron microscope was used for observation, under an accelerating voltage of 15 kV.
On the microscopic observation of SECC failure surfaces with different mix proportions, the destruction of fibers in different proportions could be clearly observed. In the present study, the tensile failure sections of , , and were analyzed with the classical ratio of M45 (Singh et al., 2019) as the control. The SEM test results are presented in Figure 6.
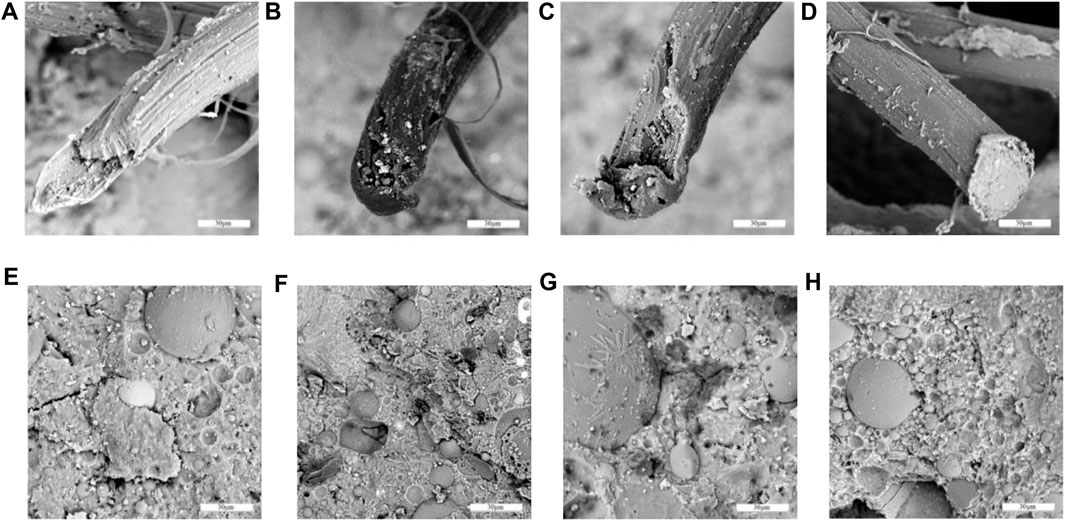
FIGURE 6. SEM images of the microstructure on the fracture surface of ECCs: (A) and (E) represent A1B3C3, (B) and (F) represent A2B2C3, (C) and (G) represent , and (D) and (H) represent M45.
According to the SEM observations, the fibers in the matrix had tensile failure, regardless of the content of sea sand for SECCs. This was attributable to the fact that, in the energy criterion, in order to fully play the role of the bridging fiber in the matrix, the bond strength of the fiber/matrix should be moderate. That is, if the bond strength is lower, the fiber tension–softening phenomenon would occur, while if the bond strength is higher, the possibility of fiber rupture would increase, thereby reducing Jb', which is not conducive to multiple cracks. Besides, the increase of fly ash content can reduce the chemical bonding strength at the fiber/matrix interface (Li, 2012). The fly ash content of the SECC matrix varies in different mix proportions; therefore, the chemical bond strength of the fiber/matrix interface is different.
The ductility of SECCs is significantly influenced by the fracture toughness of the matrix. In order to determine the influence of different sea sand content on the fracture toughness of the SECC matrix, the three-point bending test of the notched beam was carried out. The results are summarized in Table 7. The fracture toughness Km is calculated according to Eqs. 10, 11 (Yu et al., 2018). The load–CMOD curve is presented in Figure 7A. As shown in Figure 7B, the content of sea sand has a significant influence on Km:
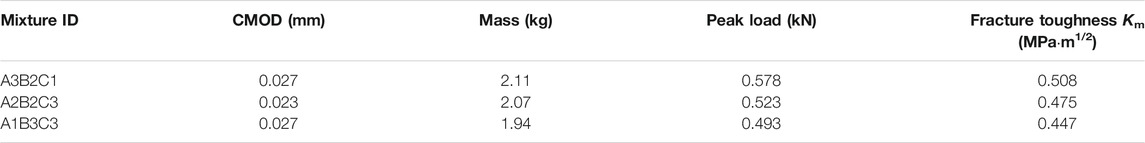
TABLE 7. Fracture toughness of the mixture.
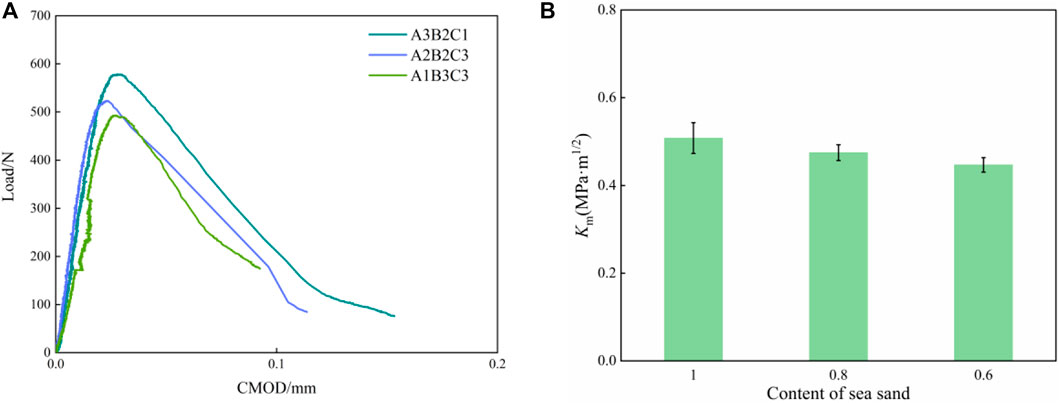
FIGURE 7. (A) Load–CMOD curve of specimens and (B)Km of the mixture under the three-point bending load.
The matrix fracture toughness significantly increases with the increase in sea sand content. This is not conducive to the realization of the energy criterion and leads to the excessive rupture number of the fiber. In contrast, for M45 without sea sand, more fibers were observed in the SEM images for pull-out failure, while few fibers had tensile failure.
Fly ash has three effects in the matrix: microaggregate effect, activity effect, and morphological effect (Yan, 2007). In the SEM images, fly ash particles with a complete grain shape and smooth surface (not involved in the secondary hydration reaction) and fly ash particles attached to the C-S-H gel (already involved in the secondary hydration reaction) could be clearly observed. With the increase in fly ash content, the amount of fly ash without the secondary hydration reaction increases. This significantly improves the pore structure and compactness of the matrix. In addition, the C-S-H gel formed by fly ash participating in the secondary hydration reaction was closely bound to the fly ash. When the matrix was damaged, the fly ash took the hydration products away from the matrix, leaving spherical holes on the fractured surface. Although the increase in fly ash content can reduce the chemical bonds of the fiber/matrix and increase the friction bonds (Yang, 2007), it would still be difficult to balance the improvement of matrix fracture toughness caused by the addition of sea sand. Thus, in ECCs mixed with sea sand, all fibers had tensile failure. However, the ultimate tensile strain of A1B3C3 with the highest fly ash content and the least sea sand content could still reach 2%. This is consistent with the previous discussion that both the increase in interfacial bonds and decrease in fracture toughness of the matrix contribute to the improvement of the ductility of ECCs.
Variance Analysis
Variance analysis can distinguish the differences in test results due to the changes in factor levels from differences due to fluctuations in error. The variance analysis for the ultimate tensile stress and ultimate tensile strain test results for SECCs is presented in Tables 8, 9. It can be observed in Table 8 that fly ash content is the main factor that affects ultimate tensile stress, and sea sand content merely has a certain influence on ultimate tensile stress. Furthermore, it can be observed in Table 9 that the content of fly ash and sea sand had a significant influence on the ultimate tensile strain and that the content of fly ash had a more significant influence. However, the change in metakaolin content had no significant influence on the ultimate tensile strength and ultimate tensile strain of SECCs. This is consistent with the results of the range analysis, which shows that the orthogonal analysis result is reasonable.
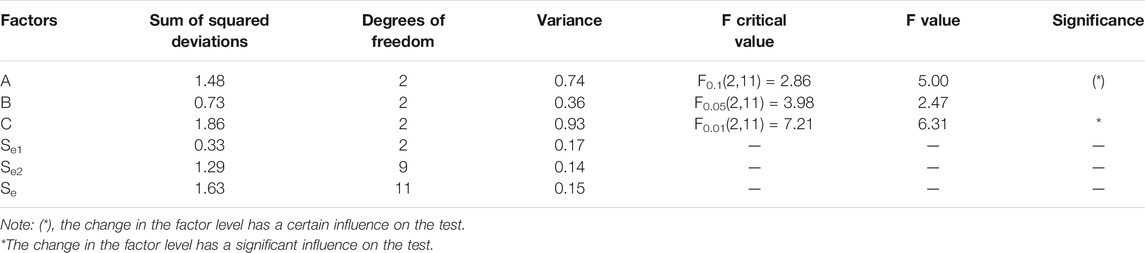
TABLE 8. Analysis of variance for the ultimate tensile stress test.
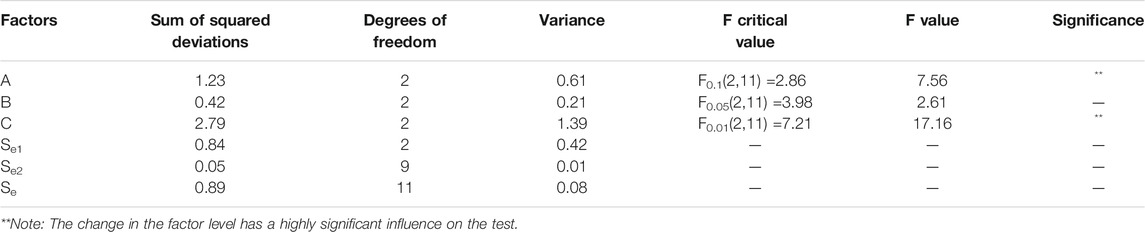
TABLE 9. Analysis of variance for the ultimate tensile strain test.
Compressive Performance
Test Results
The compressive strength test results for SECCs are presented in Table 10. The compressive strength for SECCs in the nine groups with different mixing proportions ranged between 37.81 and 64.66 MPa. All tested SECCs met the requirements for the design strength grade.
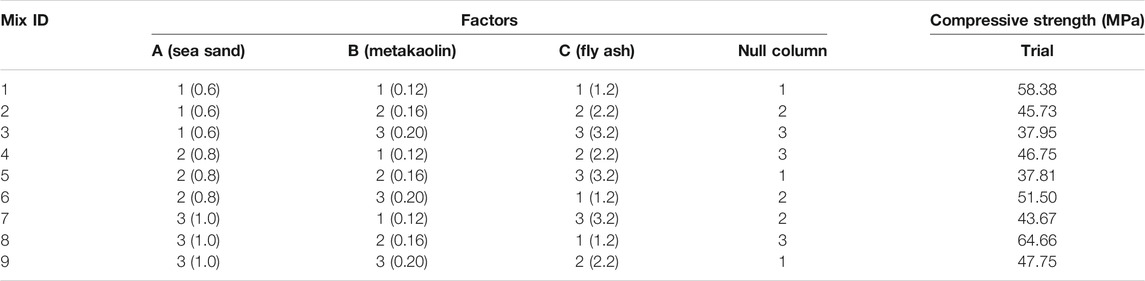
TABLE 10. Results of the compressive strength test for SECCs.
Range Analysis
The range analysis for the SECC compressive test data was carried out, and the results are presented in Table 11. The order of factors that affect the compressive strength is fly ash content > sea sand content > metakaolin content, and the optimal proportion is . The content of fly ash was also the main factor that affected the compressive strength of SECCs. An appropriate content of fly ash can promote the secondary hydration of cement and fill pores, in order to improve the strength. However, if the fly ash is increased, the amount of cement per unit volume decreases, the effective water-to-cement ratio to control the hydration reaction increases, and the early compressive strength of the material decreases (Fu and Cai, 2019). Therefore, when the content of sea sand is the same, the compressive strength of SECCs decreases with the increase in fly ash content.

TABLE 11. Range analysis for the compressive strength test of SECCs.
Furthermore, sea sand is a secondary factor that affects the compressive strength of SECCs. This can be attributed to the fact that sea sand has a higher density due to the composition of shell particles, which is calcium carbonate. Although calcium carbonate has no gelation, shell particles are strong and durable, which reduce the porosity, to some extent (Xiao et al., 2017). Therefore, the increase of sea sand content contributes to the improvement of the compressive strength of SECCs. The influence of the change in metakaolin content on the tensile performance and compressive performance of SECCs cannot be observed from the range analysis and variance analysis. Therefore, the present study analyzed the action of metakaolin from the chemical point of view.
X-Ray Diffraction Pattern Analysis
Considering that it is difficult to obtain the effect of metakaolin on the basic mechanical properties of SECCs with the orthogonal test and that it is also difficult to observe Friedel’s salt in the SEM images, SECC samples that were aged for 28 days were used for the XRD analysis of the nine mixed proportions, in order to demonstrate chemical reactions (Eqs. 1, 2) and the change in metakaolin content. The samples were crushed and ground in mortar. Then, anhydrous ethanol was added during grinding to stop hydration. After grinding to cement fineness, the samples were collected and dried in an oven at 50 ± 5°C, in order to prevent the hydration products from decomposition at high temperature. Next, the powder samples were analyzed using an X-ray diffractometer (Rigaku D/MAX 2500V, Japan) with a scanning speed of 4°/min and a test range of 5°–60°. The generation of Friedel’s salt was observed.
The XRD test patterns for the nine groups of SECC and M45 are presented in Figure 8. The diffraction characteristic peaks for Friedel’s salt were d = 7.78, 3.88, 3.76, 2.85, 2.41, and 1.69 Å (2θ = 11.35°, 22.86°, 23.64°, 31.32°, 37.21°, and 53.91°). According to the diffraction pattern, the main crystal components in SECCs were ettringite (AFt), calcium carbonate, Friedel’s salt, unhydrated tricalcium silicate and dicalcium silicate, calcium hydroxide, and silica dioxide, while calcium carbonate and Friedel’s salt were not present in M45.
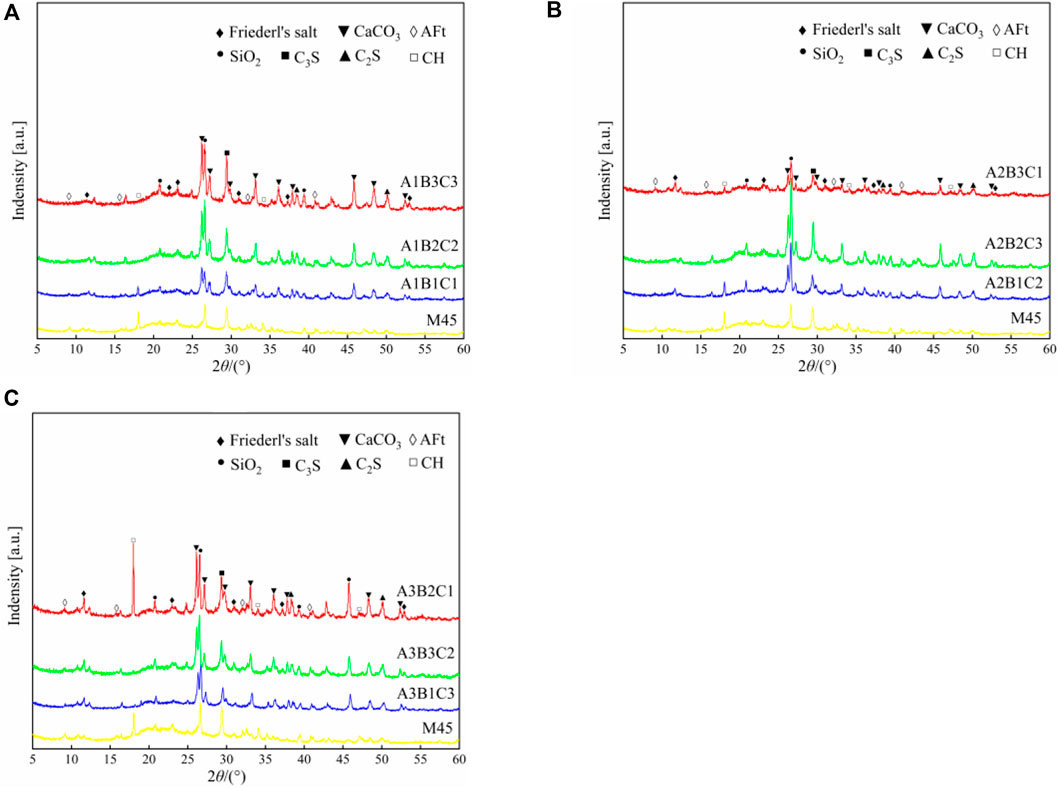
FIGURE 8. X-ray diffraction pattern for SECC and M45.(A): The sea sand content is 60%; (B): The sea sand content is 80%; (C): The sea sand content is 100%.
Effects of Sulfate Ions on Phase Composition
In the case of mixing chloride ions in sea sand, C3A in the matrix reacts with the chloride ion to form Friedel’s salt in the cement hydration process, and the use of sulfate in the cementation material (the SO3 content in cement was the highest, 3.16%) would cause competition between the sulfate ion and the chloride ion for C3A. However, in the hydration process of cement mixed with chloride ions, it has been generally considered that the C3A phase preferentially reacts with sulfate ions to form AFt until the sulfate ions are exhausted, and subsequently, Friedel’s salt is generated (Wang et al., 2013). Hence, the peak value of AFt in the diagram was not obvious. Furthermore, the addition of various mineral admixtures reduced the absolute production amount of AFt. If the fly ash content is increased, the cement content decreases, and the sulfate ions in the matrix on the whole also decrease. Therefore, in the proportion with the least fly ash content (FA/C = 1.2), the peak value of AFt was the most obvious.
Analysis of Causes Affecting the Production of Friedel’s Salt
It can be observed from Figures 8A–C that the diffraction peak intensity of Friedel’s salt increases with the increase in sea sand content. Therefore, the increase of sea sand content (i.e., the increase in chloride ion content) increases the content of Friedel’s salt. This can be attributed to the fact that metakaolin and fly ash both contain a significant amount of C3A, which can fully react with the chloride ions in sea sand to form Friedel’s salt (Wang et al., 2013). Therefore, if the chloride ion content is increased, the content of Friedel’s salt also increases. In addition, in the initial stage of mixing, the chloride ion at the far end of the surface of sea sand is dissolved in the solution, at the interface between sea sand and cement paste. In the later stage of mixing, along with the hydration of cement, the chloride ions near the surface of sea sand would gradually spread outward, with sea sand as the center. Some of free chloride ions formed Friedel’s salt with hydration products, while the other parts were distributed around the aggregate or adsorbed by the C-S-H gel (Xing et al., 2006). Therefore, the diffraction peak of Friedel’s salt was not obvious for the proportion with less sea sand content (less chloride ion content). However, the chloride ion mainly reacts with metakaolin to produce Friedel’s salt (Wang et al., 2013), thereby affecting the mechanical properties of SECCs. In the present study, the curing time was short, and Friedel’s salt content generated by the reaction was small. Hence, it was difficult to observe the macro effect of metakaolin.
Variance Analysis
The variance analysis for the SECC compressive strength test results is presented in Table 12. As illustrated in Table 12, the content of both sea sand and fly ash had influences on the SECC compressive strength. Fly ash was still the main factor that affected the compressive strength, and the influence of sea sand content was less than that of fly ash. Furthermore, there was no significant difference in the influence of metakaolin content on compressive strength. The variance analysis result was consistent with the range analysis result. Hence, the orthogonal analysis result is reasonable.
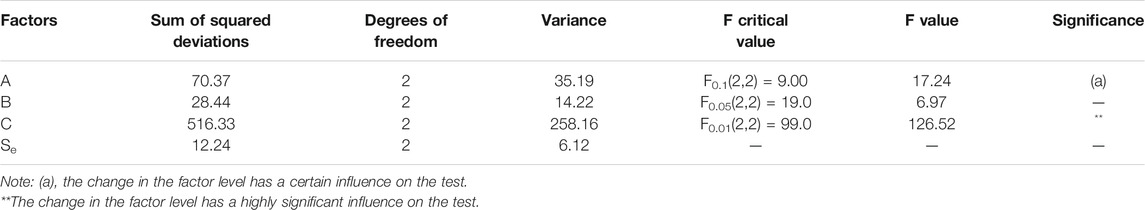
TABLE 12. Analysis of variance for the compressive strength test.
Conclusion
In the present study, range and variance analysis, XRD analysis, and SEM analysis were applied to investigate the SECC uniaxial tensile and compressive performances. The following conclusions were obtained.
The ultimate tensile strain of SECCs was 0.38–2.40%, the ultimate tensile stress of SECCs was 2.56–4.58 MPa, and the compressive strength of SECCs was 37.81–64.66 MPa. The content of fly ash and sea sand had a highly significant positive effect on ultimate tensile strain. Furthermore, the fly ash content had a highly significant negative effect on compressive strength, and the ultimate tensile stress and compressive strength were less affected by the sea sand content.
For the parameter ranges, the content of fly ash and sea sand almost completely determined the ductility of SECCs. The increase in fly ash content significantly increased the ductility of SECCs. The decrease of cement content and the increase of fly ash content led to the decrease of SECC compressive strength. Furthermore, the ultimate tensile strain decreased with the increase in sea sand content, and by observation and calculation using a digital microscope, sea sand and silica sand had similar sphericity and roundness, except for the difference in particle size and chemical composition. Moreover, the fracture energy test revealed that the matrix fracture toughness of SECCs significantly increased with the increase in sea sand content.
Although the content of metakaolin had minimal influence on the basic mechanical properties of SECCs in the test, which could contribute to the lack of curing time and the incomplete reaction of C3A in metakaolin with the chloride ion in sea sand, Friedel’s salt could be observed in the XRD analysis, and this content increased with the increase in sea sand content (chloride ion content). Therefore, metakaolin is indispensable for binding chloride ions in the SECC matrix to improve durability.
In the SECC uniaxial tensile test, it could be observed from the SEM test that the fiber failure mode was tensile failure. Finally, the mixed proportions of group 3 (FA/C was 3.2, the sea sand content was 0.6, and the metakaolin content was 0.2) and group 8 (FA/C was 1.2, the sea sand content was 1, and the metakaolin content was 0.16) were recommended for SECCs, based on the results of the present study.
In the present study, more economical, site-specific, and durable SECC proportions were obtained while maintaining the ductility of SECCs at more than 2%. Depending on the engineering application, the proportion of high ductility (ultimate tensile strain 2.4%, compressive strength 37.95 MPa, and ultimate tensile stress 3.48 MPa) or high compressive strength (compressive strength 64.66 MPa, ultimate tensile strain 0.42%, and ultimate tensile stress 3.36 MPa) can be selected, which can meet the tensile strain capacity, corrosion resistance, or strength requirements of practical constructions.
Data Availability Statement
The original contributions presented in the study are included in the article/supplementary material, and further inquiries can be directed to the corresponding author.
Author Contributions
QY designed the experiment and involved in data analysis. QY and XT investigated the data and wrote the manuscript. QY, ZL, CL, and XT performed the methodology. QY, ZL, CL, and XT revised the manuscript. XT involved in funding acquisition and project administration.
Funding
The authors are grateful for the financial support provided by the China Postdoctoral Science Foundation (No. 2018M633298), the National Natural Science Foundation of China (Nos. 51738004, 51878186, 11962001), the Innovation Project of Guangxi Graduate Education (No. YCSW2019048), the National Key Research and Development Program (No. 2019YFC1511103), and the Guangxi Innovation-driven Major Project (No. GuiKe AA18118055).
Conflict of Interest
The author YL was employed by Guangxi Transportation Science & Technology Group CO., LTD., and now by Hualan Design & Consulting Group.
The remaining authors declare that the research was conducted in the absence of any commercial or financial relationships that could be construed as a potential conflict of interest.
Publisher’s Note
All claims expressed in this article are solely those of the authors and do not necessarily represent those of their affiliated organizations, or those of the publisher, the editors and the reviewers. Any product that may be evaluated in this article, or claim that may be made by its manufacturer, is not guaranteed or endorsed by the publisher.
References
ASTM (2009). Standard Test Method for Linear-Elastic Plane-Strain Fracture Toughness KIC of Metallic Materials. New York: ASTM International, E399–09.
Bai, W., Zhang, J., Yan, P., and Wang, X. (2009). Study on Vibration Alleviating Properties of Glass Fiber Reinforced Polymer concrete through Orthogonal Tests. Mater. Des. 30 (4), 1417–1421. doi:10.1016/j.matdes.2008.06.028
Ben-Yair, M. (1974). The Effect of Chlorides on concrete in Hot and Arid Regions. Cement Concrete Res. 4 (3), 405–416. doi:10.1016/0008-8846(74)90106-9
ECC Technology Network (2005). Repair of Mitaka Dam. Available at: http://www.engineeredcomposites.com/Applications/mitaka dam.html (Accessed April 6, 2020).
Fu, B. Q., and Cai, X. R. (2019). Effect of Large Amount Fly Ash on Properties of High Toughness Fiber Reinforced Cementitious Composites. Concrete (08), 88–91. doi:10.3969/j.issn.1002-3550.2019.08.020
Gao, N., Gao, J., Hu, X. L., Xu, X. X., Sun, R. J., and Lu, Q. (2019). Mix Proportion Design of UHTCC Based on Orthogonal Test. Concrete 000 (006), 55–60. doi:10.3969/j.issn.1002-3550.2019.06.013
General Administration of Quality Supervision, Inspection and Quarantine of the People's Republic of China. (2007). Common Portland Cement. Beijing: Standards Press of China, GB 175–2007.
Huang, B.-T., Wu, J.-Q., Yu, J., Dai, J.-G., and Leung, C. K. (2020a). High-strength Seawater Sea-Sand Engineered Cementitious Composites (SS-ECC): Mechanical Performance and Probabilistic Modeling. Cement and Concrete Composites 114, 103740. doi:10.1016/j.cemconcomp.2020.103740
Huang, B.-T., Yu, J., Wu, J.-Q., Dai, J.-G., and Leung, C. K. (2020b). Seawater Sea-Sand Engineered Cementitious Composites (SS-ECC) for marine and Coastal Applications. Composites Commun. 20, 100353. doi:10.1016/j.coco.2020.04.019
Huang, B.-T., Wu, J.-Q., Yu, J., Dai, J.-G., Leung, C. K. Y., and Li, V. C. (2021). Seawater Sea-Sand Engineered/strain-Hardening Cementitious Composites (ECC/SHCC): Assessment and Modeling of Crack Characteristics. Cement Concrete Res. 140, 106292. doi:10.1016/j.cemconres.2020.106292
Kojima, S., Sakata, N., and Kanda, T. (2004). Application of Direct Sprayed ECC for Retrofitting Dam Structure Surface Application for Mitaka-Dam. Concrete J. 42, 135–139.
Krumbein, W. C., and Sloss, L. L. (1951). Stratigraphy and Sedimentation. Soil Sci. 71 (5), 401. doi:10.1097/00010694-195105000-00019
Li, M., and Li, V. C. (2013). Rheology, Fiber Dispersion, and Robust Properties of Engineered Cementitious Composites. Mater. Struct. 46 (3), 405–420. doi:10.1617/s11527-012-9909-z
Li, Q. H., and Xu, S. L. (2009). Performance and Application of Ultra High Toughness Cementitious Composite: A Review. Eng. Mech. 26, 23–67.
Li, V. C. (2011). Engineered Cementitious Composites (ECC)-material, Structural, and Durability Performance Concrete Construction Engineering Handbook. Boca Raton: CRC Press
Li, V. C. (2012). Tailoring ECC for Special Attributes: A Review. Int. J. Concr Struct. Mater. 6 (3), 135–144. doi:10.1007/s40069-012-0018-8
Li, V. C., Fischer, G., Kim, Y., Lepech, M. D., Qian, S., Weimann, M., et al. (2003). Durable Link Slabs for Jointless Bridge Decks Based on Strain-Hardening Cementitious Composites. Deterioration.
Li, V. C., and Leung, C. K. Y. (1992). Steady‐State and Multiple Cracking of Short Random Fiber Composites. J. Eng. Mech. 118 (11), 2246–2264. doi:10.1061/(asce)0733-9399(1992)118:11(2246)
Li, V. C., Wang, S. X., and Wu, C. (2001). Tensile Strain-Hardening Behavior or Polyvinyl Alcohol Engineered Cementitious Composite (PVA-ECC). ACI Mater. J. 98, 483–492. doi:10.1089/apc.2006.20.829
Ministry of Industry and Information of the People’ s Republic of China (2018). Standard Test Method for the Mechanical Properties of Ductile Fiber Reinforced Cementitious Composites. Beijing, China: China Building Materials Press. JC/T 2461-2018
Rokogo, K., and Kanda, T. (2005). Proceedings of International Workshop on HPFRCC in Structural Applications. Bagneux: RILEM Publications SARL.
Singh, M., Saini, B., and Chalak, H. D. (2019). Performance and Composition Analysis of Engineered Cementitious Composite (ECC) - A Review. J. Building Eng. 26, 100851. doi:10.1016/j.jobe.2019.100851
Statistics group of institute of mathematics CAS (1975). Orthogonal Tests. Beijing, China: People’s Education Press.
Thomas, M. D. A., Hooton, R. D., Scott, A., and Zibara, H. (2012). The Effect of Supplementary Cementitious Materials on Chloride Binding in Hardened Cement Paste. Cement Concrete Res. 42 (1), 1–7. doi:10.1016/j.cemconres.2011.01.001
Turk, K., and Nehdi, M. L. (2018). Coupled Effects of limestone Powder and High-Volume Fly Ash on Mechanical Properties of ECC. Construction Building Mater. 164 (MAR.10), 185–192. doi:10.1016/j.conbuildmat.2017.12.186
Wadell, H. (1932). Volume, Shape, and Roundness of Rock Particles. J. Geology. 40 (5), 443–451. doi:10.1086/623964
Wadell, H. (1933). Sphericity and Roundness of Rock Particles. J. Geology. 41 (3), 310–331. doi:10.1086/624040
Wang, X. G., Shi, C. J., He, F. Q., Yuan, Q., Wang, D. H., Huang, Y., et al. (2013). Chloride Binding and its Effects on Microstructure of Cement-Based Materials. J. Chin. Ceram. Soc. 41 (2), 187–198. doi:10.7521/j.issn.0454-5648.2013.02.11
Wu, H.-L., Yu, J., Zhang, D., Zheng, J.-X., and Li, V. C. (2019). Effect of Morphological Parameters of Natural Sand on Mechanical Properties of Engineered Cementitious Composites. Cement and Concrete Composites 100, 108–119. doi:10.1016/j.cemconcomp.2019.04.007
Xiao, J., Qiang, C., Nanni, A., and Zhang, K. (2017). Use of Sea-Sand and Seawater in concrete Construction: Current Status and Future Opportunities. Construction Building Mater. 155 (30), 1101–1111. doi:10.1016/j.conbuildmat.2017.08.130
Xing, F., Liu, J., Dong, B., and Huo, Y. (2006). Combination Procedure and Mechanism of Sea Sand Type Chloride Ions with Cement Materials. J. Southeast Univ. (Natural Sci. Edition) 36, 167–172.
Yan, P. (2007). Mechanism of Fly Ash's Effects during Hydration Process of Composite Binder. J. Chin. Ceram. Soc. 35, 167–171.
Yang, E. H. (2007). Designing Functionalities into ECC Materials via Micromechanics. [dissertation]. [Michigan]. Beijing, China: University of Michigan.
Yao, Q. Y., Lu, C. Y., Peng, L. X., Teng, X. D., and Luo, Y. J. (2022). Experimental Study on Tensile and Bending Properties of Sea Sand ECC Reinforced by BFRP Bars under Chloride Salt Erosion. Acta Materiae Compositae Sinica. doi:10.13801/j.cnki.fhclxb.20210426.005
Yu, J., Huang, B.-T., Wu, J.-Q., Dai, J.-G., and Leung, C. K. Y. (2021). “Tensile and Compressive Performance of High-Strength Engineered Cementitious Composites (ECC) with Seawater and Sea-Sand,” in Fibre Reinforced Concrete: Improvements and Innovations. BEFIB 2020. RILEM Bookseries. Editors P. Serna, A. Llano-Torre, J. R. Martí-Vargas, and J. Navarro-Gregori (Cham: Springer), Vol. 30, 1034–1041. doi:10.1007/978-3-030-58482-5_91
Yu, K.-Q., Yu, J.-T., Dai, J.-G., Lu, Z.-D., and Shah, S. P. (2018). Development of Ultra-high Performance Engineered Cementitious Composites Using Polyethylene (PE) Fibers. Construction Building Mater. 158, 217–227. doi:10.1016/j.conbuildmat.2017.10.040
Zeng, J. J., Wang, S. N., Fan, Z. H., and Xiong, J. B. (2015). Improvement Effect and Mechanism of Metakaolin on marine concrete Chloride Penetration Resistance. J. Wuhan Univ. Technology 37, 22–28. doi:10.3963/j.issn.1671-4431.2015.04.005
Zhang, M., Weng, Z., Huang, Z., and Pan, Z. (2000). Characterization of Statistical Average Particle Size and Particle Size Distribution. Polym. Mater. Sci. Eng. 16 (005), 1–4. doi:10.3321/j.issn:1000-7555.2000.05.001
Keywords: sea sand, engineered cementitious composites, orthogonal test, SEM, XRD, Friedel’s salt
Citation: Yao Q, Li Z, Lu C, Peng L, Luo Y and Teng X (2021) Development of Engineered Cementitious Composites Using Sea Sand and Metakaolin. Front. Mater. 8:711872. doi: 10.3389/fmats.2021.711872
Received: 19 May 2021; Accepted: 30 June 2021;
Published: 02 August 2021.
Edited by:
Kequan Yu, Tongji University, ChinaReviewed by:
Rui Zhong, Southeast University, ChinaShao-Bo Kang, Chongqing University, China
Yao Ding, Chongqing University, China
Copyright © 2021 Yao, Li, Lu, Peng, Luo and Teng. This is an open-access article distributed under the terms of the Creative Commons Attribution License (CC BY). The use, distribution or reproduction in other forums is permitted, provided the original author(s) and the copyright owner(s) are credited and that the original publication in this journal is cited, in accordance with accepted academic practice. No use, distribution or reproduction is permitted which does not comply with these terms.
*Correspondence: Xiaodan Teng, xdteng@gxu.edu.cn