Cost-Sensitive LightGBM-Based Online Fault Detection Method for Wind Turbine Gearboxes
 Mingzhu Tang
 Qi Zhao1
 - 1School of Energy and Power Engineering, Changsha University of Science and Technology, Changsha, China
- 2Hubei Key Laboratory of Power System Design and Test for Electrical Vehicle, Hubei University of Arts and Science, Xiangyang, China
- 3School of Computer Science and Information Security, Guilin University of Electronic Technology, Guilin, China
In practice, faulty samples of wind turbine (WT) gearboxes are far smaller than normal samples during operation, and most of the existing fault diagnosis methods for WT gearboxes only focus on the improvement of classification accuracy and ignore the decrease of missed alarms and the reduction of the average cost. To this end, a new framework is proposed through combining the Spearman rank correlation feature extraction and cost-sensitive LightGBM algorithm for WT gearbox’s fault detection. In this article, features from wind turbine supervisory control and data acquisition (SCADA) systems are firstly extracted. Then, the feature selection is employed by using the expert experience and Spearman rank correlation coefficient to analyze the correlation between the big data of WT gearboxes. Moreover, the cost-sensitive LightGBM fault detection framework is established by optimizing the misclassification cost. The false alarm rate and the missed detection rate of the WT gearbox under different working conditions are finally obtained. Experiments have verified that the proposed method can significantly improve the fault detection accuracy. Meanwhile, the proposed method can consistently outperform traditional classifiers such as AdaCost, cost-sensitive GBDT, and cost-sensitive XGBoost in terms of low false alarm rate and missed detection rate. Owing to its high Matthews correlation coefficient scores and low average misclassification cost, the cost-sensitive LightGBM (CS LightGBM) method is preferred for imbalanced WT gearbox fault detection in practice.
Introduction
With the increase in the capacity of wind turbine assembly machines, wind power generation brings economic benefits and also raised important crucial challenges related to reliability (Qiao and Lu, 2015; Wang et al., 2019). On the one hand, wind power generation technology has been developed rapidly, but wind turbine (WT) fault detection and condition monitoring technologies have not been improved accordingly, which results in frequent WT faults that cannot be timely maintained; on the other hand, WTs are often located in remote areas with rich wind resources and operated in harsh working environments for a long time, which can easily cause frequent WT faults (Yang et al., 2021). Gearboxes are often operating under tough circumstances, which will cause a high fault rate and irreversible damage to WT. The wind turbine gearbox faults will inevitably affect the performance of WT (Teng et al., 2016a). Therefore, fault detection of WT gearbox is of great significance for reducing the operation and maintenance cost of WTs and improving the power generation efficiency of the entire wind farm (Chen et al., 2017).
WT is a typical complex system, and its operating status is complex and changeable, which brings difficulties to the fault detection and condition monitoring of WTs (Ra et al., 2021; Song et al., 2021). The fault mechanism is complicated, and the correlation characteristics between kinds of feature vectors under various fault types will be different (Liang et al., 2018). Data in the wind turbine SCADA system are usually high-dimensional data, so it is necessary to reduce the dimensionality of the big data in the SCADA system. For instance, Amirat et al. (2018) proposed an ensemble empirical mode decomposition fault diagnosis method. The Pearson correlation analysis method was implemented to select the closest intrinsic mode function and to analyse the data correlation. Yang et al. (2019) adopted the convolution neural network fault diagnosis method, in which the Spearman rank correlation analysis is used to sort the relevant image layers of the convolutional neural network and comprehensively extract data features (Long et al., 2018; Long et al., 2021a). This method effectively verifies the necessity of feature selection and improves the fault detection rate. Since data in the SCADA system are interrelated, feature selection and reducing the dimensionality of the big data of WTs will increase the availability of data samples and improve the accuracy of fault detection (Long et al., 2021b).
Many scholars and experts have carried out extensive and in-depth research on WT fault detection and diagnosis methods, including signal processing methods, multivariate statistical methods, and classification algorithms (Jiang et al., 2015). For example, Teng et al. (2016b) proposed a complex wavelet transform for multifault detection of the WT fault detection method. By analyzing the multiscale enveloping spectrogram, the fault characteristics of weak bearings can be detected and fault diagnosis of WTs can be realized. Due to the nonlinear and nonstationary characteristics of the gearbox, Han et al. (2020) considered the correlation between variables and used a quantitative diagnosis method for gearbox faults based on generalized canonical correlation analysis, which can effectively identify the severity of gearbox faults under various conditions. Gao et al. (2018) explained the drawbacks of the current support vector machine (SVM) algorithm and proposed the WT fault diagnosis method based on the least squares support vector machine. Zheng and Peng (2019) used an improved AdaBoost–SVM method for WT converter fault diagnosis, the wavelet transform is employed to reduce signal noise, and fault feature vectors are input into the improved AdaBoost–SVM classifier to achieve fault diagnosis. Zhang et al. (2018) proposed a wind turbine fault diagnosis method combining Random Forest (RF) and extreme gradient boosting (XGBoost) that were used to establish the data-driven WT fault detection framework. RF is used to rank the features of WTs by importance, and XGBoost trains the ensemble classifier for each specific fault. This method is able to protect against overfitting, and it achieves better wind turbine fault detection results than SVM when processing multidimensional data. Tang et al. (2020) adopted the WT gearbox fault detection method that combines correlation analysis and improved LightGBM. The maximum information coefficient analysis method is adopted to select features for the big data of WTs. The improved LightGBM is implemented by the Bayesian optimization for classification so as to diagnose the fault of WT gearbox. However, the fault diagnosis performance needs to be improved when the data are imbalanced.
To this end, the current fault diagnosis methods for WTs are generally based on machine learning (Stetco et al., 2019), that is, dealing with the existing data to train a fault diagnosis model and using this model to realize fault diagnosis. Machine learning algorithms have been employed to solve the problem of WT fault detection, in which samples are assumed based on a balanced distribution. Most of the current data-driven machine learning methods assume that the number of normal samples and fault samples are close. However, normal samples are specifically much greater than the number of fault samples in the real industrial field. This means that many machine learning methods fail in dealing with imbalanced data and the majority class has higher recognition rate while the minority class fails. During the operation of WTs, faults occur for a short period of time and most of the condition are in normal conditions; therefore, the fault sample is the minority class, and the normal sample is the majority class. However, traditional machine learning methods for WTs fault diagnosis do not consider the data imbalance problems and the losses caused by fault alarms and missing detection. The Gini coefficient and information gain rate are considered as the optimization target, in which the misclassification cost is not introduced in the base classifier evaluation function and the fault detection performance is not very well.
The contributions of this article are summarized as follows:
1) The fault diagnosis method takes misclassification costs into account, and the optimization objective aims to minimize average total cost, which will effectively improve the fault detection rate. The efficiency of the base classifier has been improved, especially in terms of their ability in WT fault detection.
2) Since the fault sample is the minority class and the normal sample is the majority class, a method based on cost-sensitive LightGBM WT fault detection is proposed to deal with the imbalance data distribution problem. Specifically, the cost function is introduced in the weight formula of the LightGBM algorithm to replace the information gain, so that the algorithm pays attention to the minority class in each iteration update, thereby improving the classification effect of imbalanced data.
3) Spearman rank correlation method is used for WT feature selection replacing the raw dataset studied with new attributes ranked in order of correlation; thus, it can help to reduce both the redundancy and the dimension between WT feature datasets and ensure to remove redundant and irrelevant information in the original feature space.
4) Experiment shows that the proposed method can quickly perform fault diagnosis of WTs. Compared with other cost-sensitive ensemble algorithms, the cost-sensitive LightGBM is more suitable for highly imbalanced data and can achieve more accurate fault classification. The experiment verifies the effectiveness and validity of the proposed method.
Related Work
The cost-learning methods aim to minimize total misclassification cost rather than total error. Cost-sensitive learning has attracted significant attention from researchers and scholars. Knoll et al. (1994) proposed misclassification costs to improve the classification accuracy of the decision tree. Domingos (1999) proposed MetaCost, which made use of the bagging algorithm to making the classifier cost sensitive by wrapping a cost-minimizing method. Many scholars attempted to adjust the classifier to be cost-sensitive by adding the cost function to train the algorithm. Among these works, Fan et al. (1999) presented the AdaCost method to reduce the cumulative misclassification cost more than AdaBoost. Fumera and Roli (2002) proposed cost-sensitive SVM under the framework of the structural risk minimization induction principle via minimizing the associate risk. Tremendous cost-sensitive learning has been conducted to improve the classifier performance. It is noteworthy that how to train LightGBM algorithm under an imbalanced fault diagnosis situation is still a problem for real WT fault diagnosis.
Background
Spearman Rank Correlation Method for Feature Selection
Since data from WTs are big and the feature correlation between data has some problems such as low correlation and redundant features, it is necessary to use feature selection on the big data of WTs. The commonly used correlation coefficients include the Pearson linear correlation coefficient, Kendall rank correlation coefficient, Spearman rank correlation coefficient, and tail dependence coefficients (Bonett and Wright, 2000). Since the correlation analysis of characteristics of WTs showed nonlinear correlation between variables, while the Kendall rank correlation coefficient and Spearman rank correlation coefficient have similar properties, the Spearman rank correlation coefficient is used in this work (Croux and Dehon, 2010).
The Spearman rank correlation coefficient is designed to measure the linear or nonlinear relationship of variables. Given two discrete features of x and y and M data samples, the Spearman rank correlation coefficient can be calculated by the following formula:
Here,
Here,
Spearman rank correlation coefficient
The Spearman rank correlation coefficient is designed to measure the correlation between features. If the index with a higher correlation coefficient is directly deleted, some features may be missing. To ensure that the redundancy between fault features is reduced and the information of different features is retained, the feature with the highest Spearman rank correlation coefficient in the raw dataset is selected, while the other fault features and features with high linear correlation are classified into a set of feature sets according to the threshold, until fault features in the original data set are eliminated or selected. The feature selection method is shown in Figure 1.
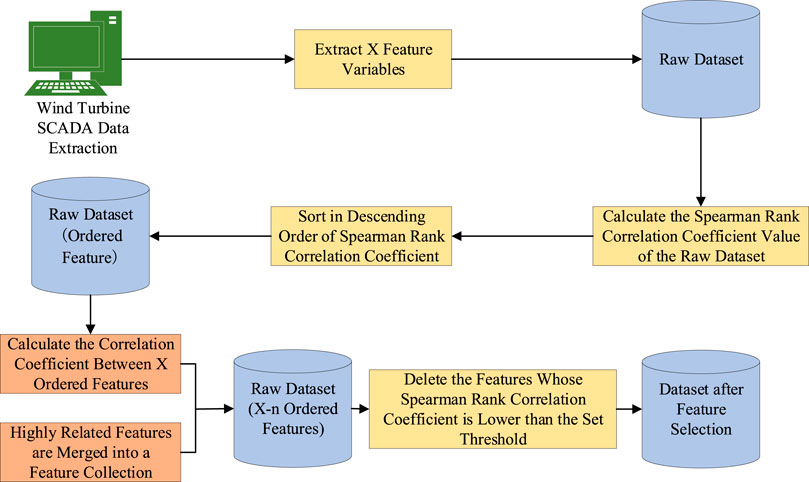
FIGURE 1. Feature selection based on the Spearman rank correlation coefficient.
Cost-Sensitive Learning
Since traditional classification algorithms are not suitable for imbalanced data, a cost-sensitive method was developed (Turney, 1994), that is, by introducing a misclassification cost in attribute splitting instead of information gain, Gini coefficient, and other indicators, which aims to minimize the average total cost and improve the prediction of the minority samples (Tang et al., 2019).
The misclassification costs are usually described as a cost matrix, as shown in Table 1.
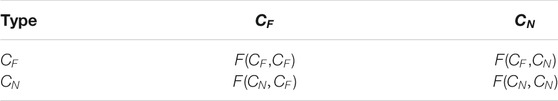
TABLE 1. Cost matrix.
In Table 1,
Given the misclassification cost matrix C, if the actual class is j and the predicted category class is i, if i = j, the prediction is correct. The best prediction result of the sample x should be the class that minimizes the expected total sample:
Here,
A training set S of N samples is given, where
LightGBM Classifier
LightGBM is an improved variant gradient boosting decision tree (GBDT) framework based on the decision tree algorithm (Ke et al., 2017). Given the supervised learning dataset X =
and the objective function
Here,
In LightGBM, Newton’s method is used to quickly approximate the objective function.
where
The information gain in LightGBM is defined as follows:
Compared to the GBM algorithm, the LightGBM algorithm is more efficient in processing high-dimensional big data. This is because of exclusive feature bundling (EFB) algorithm and gradient-based one-side sampling (GOSS) algorithm in LightGBM. The GOSS method introduces a data instance with a constant multiplier and a small gradient, which can sample the data from the big dataset that has the same distribution and characteristics as the raw data and ensuring the classification accuracy while improving the classification speed. In the high-dimensional space, the data are sparsely coded, while in the sparse feature space, nonzero values rarely appear at the same time. The EFB method is used for feature sampling to bundle two features to form a new feature which can decrease the data sample. Besides, the traditional gradient boosting method uses an exhaustive attack method to find segmentation features and thresholds, while LightGBM uses a histogram-based method to find suboptimal solution segmentation features and thresholds and reducing calculation time. Specifically, a certain feature of the data is discretized into a histogram algorithm and the discretized value is used as an index to accumulate statistics in the histogram. After data traversal, the histogram accumulates the required statistics and then according to the discrete value of the histogram, traverses to find the optimal split point. The tree of XGBoost is grown by the level-wise tree growth method (Mitchell and Frank, 2017; Chen and Guestrin 2016) and leaf-wise tree growth in LightGBM; however, leaf-wise splits lead to an increase in complexity and may lead to overfitting, and a tree grown with leaf-wise growth will be deeper when the number of leaves is the same. Figure 2 is a schematic presentation of two tree growth methods.
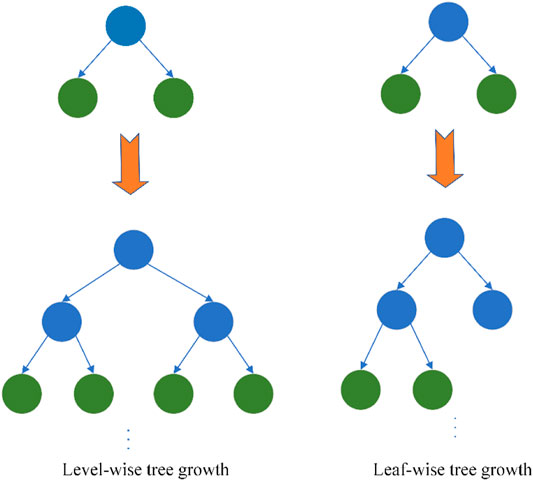
FIGURE 2. Comparison of level-wise tree growth and leaf-wise tree growth.
Because the minority fault samples and majority normal samples of WTs and the LightGBM algorithm are more focusing on the classification of the majority sample, the cost function is introduced to replace the information gain in the weight formula of the algorithm to form the cost-sensitive LightGBM algorithm (Elkan 2001). In each iteration update processing, the algorithm will pay much attention to the minority class which improves identification of the minority class.
Cost-Sensitive LightGBM Algorithm
For binary classification problems, the commonly used logistic loss function of LightGBM is the logistic loss function, and the expression is as follows:
where P represents the posterior probability. In the log loss function of the cost-sensitive LightGBM algorithm (Zheng and Peng, 2019), we replace
where
where
According to Eq. 5, the objective function of CS LightGBM can be written as follows:
where
The first-order loss function
Given the structure of the tree, the optimal weight
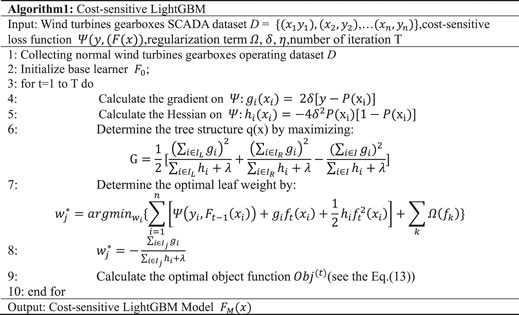
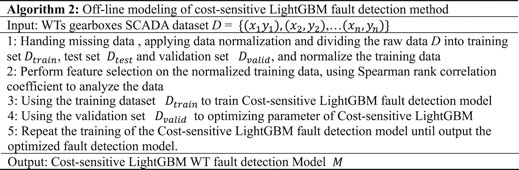
The algorithm of cost-sensitive LightGBM (CS LightGBM) is given as follows.
Cost-Sensitive LightGBM Fault Detection Model
In order to minimize the loss caused by fault alarm and missed detection due to the imbalanced data of WTs, the CS LightGBM fault detection model is established. The WT fault detection process can be divided into two parts: offline modeling and online detection, as shown in Figure 3. The main steps of offline modeling are given as follows.
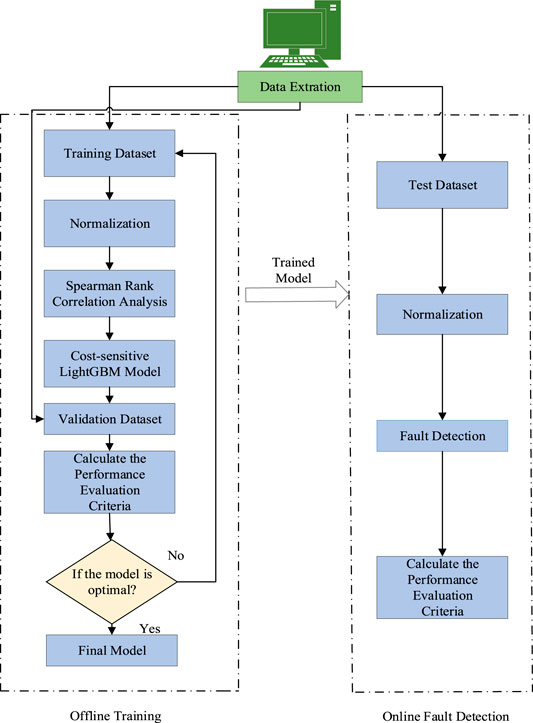
FIGURE 3. Wind turbine fault detection procedure of cost-sensitive LightGBM algorithm.
The main steps of online fault detection are given as follows:
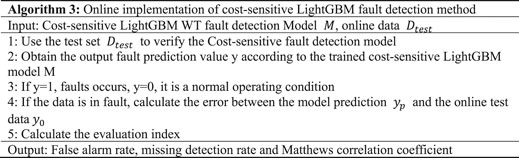
Figure 3 gives out the basic framework of cost-sensitive LightGBM algorithm. The complete fault detection procedure including offline training and online detection is shown in Figure 3. Specifically, the procedure has gone through five phases, namely, data extraction, data preprocessing (normalization), feature selection (Spearman rank correlation), model optimization, and decision making.
Experimental Case
The main structure of WT is shown in Figure 4. The main components of WT include a wind wheel, gearbox, generator, converter, yaw system, pitch system, and hydraulic system. Among these subsystems, the gearbox failure will cause a high fault rate and irreversible damage to WT. In order to verify the effectiveness of CS LightGBM compared with other cost-sensitive ensemble learning methods in the detection of WT gearbox faults, a comparative experiment was set up. The experimental steps are given as follows:
1) Collect raw data from the SCADA system and perform data preprocessing:
2) Use Spearman rank correlation analysis methods to perform feature selection on the extracted features
3) Divide the training set, test set, and validation set into the existing dataset and establish the CS LightGBM offline model
4) Perform online detection based on the established CS LightGBM model
5) Evaluate the fault detection method of CS LightGBM and calculate the false alarm rate, missing detection rate, and Matthews correlation coefficient
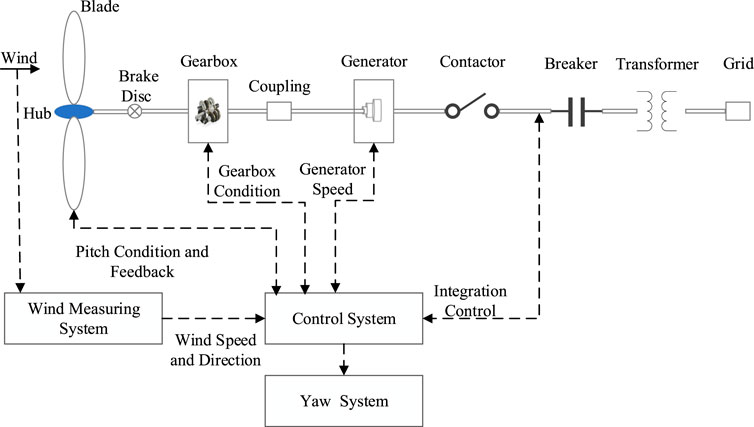
FIGURE 4. Main structure of doubly fed WT.
Feature Extraction
In order to verify the performance of the gearbox fault detection model, the 1.5 MW WT in a wind farm was used as the research object. A 3-year gearbox dataset is extracted from the SCADA data. The sampling interval is 2 s. Through the analysis of the WT gearbox mechanism and expert experience, the data within the period time from 30 min before the start of the fault to 30 min after the fault were selected as the experimental data. A part of the raw data is shown in Table 2.
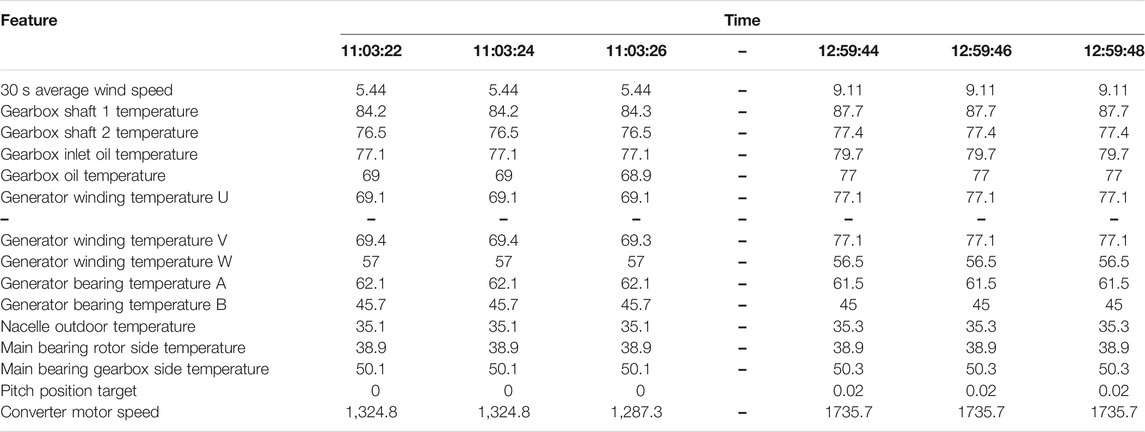
TABLE 2. Part of the raw data of wind turbines on February 27, 2018.
We select the datasets containing gearbox oil temperature overrun fault, gearbox oil filter pressure fault, and gearbox lubrication oil level fault from the SCADA normal operating condition data and record them as Dataset 1, Dataset 2, and Dataset 3, as shown in Table 3.
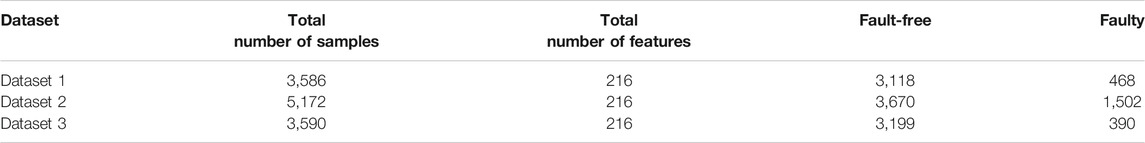
TABLE 3. Dataset description.
Feature Selection
Dataset 1–Dataset 3 contain 3 types of gearbox faults, including the error gearbox oil temperature overrun, error gearbox oil filter pressure, and error gearbox lubrication oil level. To deal with the feature selection of WT, the fault mechanism and the correlated parameters of each fault are analyzed as shown in Table 4.
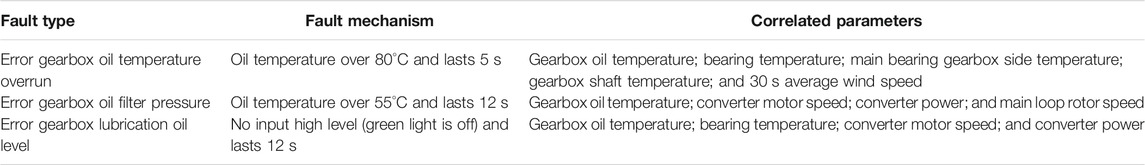
TABLE 4. WT gearbox fault type and correlated parameters.
The gearbox bearing temperature information is used to evaluate the health of the gearbox. When selecting the state parameters, parameters that have a greater impact on parameters are mainly selected. According to the Spearman rank correlation coefficient analysis method, the correlation strength between each state parameter and the gearbox bearing temperature is calculated, as shown in Table 5.
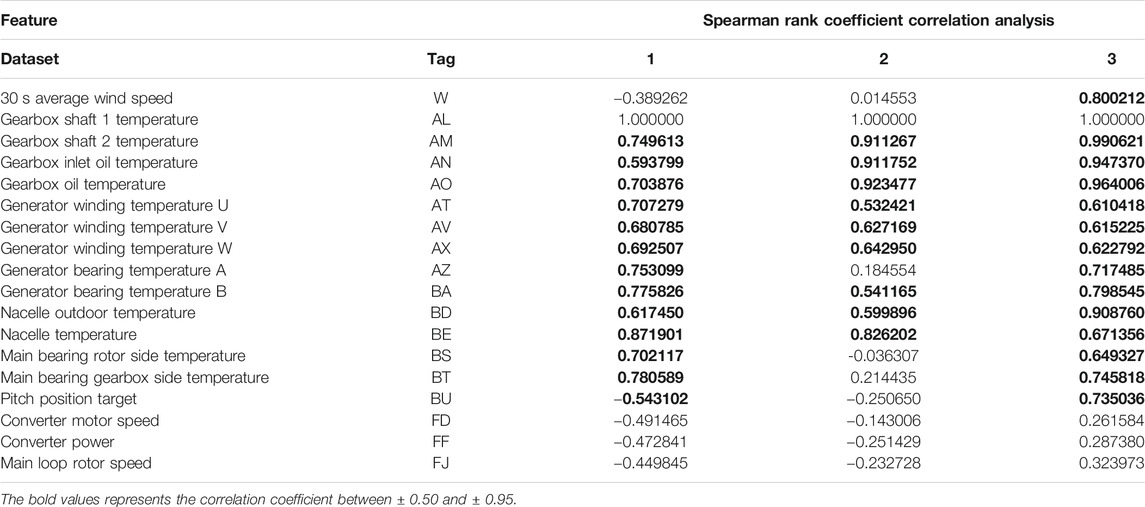
TABLE 5. Gearbox features correlation analysis results.
From the correlation analysis results in Table 5, it can be seen that there is a large difference between features and the gearbox bearing temperature. In order to avoid the influence of irrelevant and weakly related features on the gearbox fault detection, the correlation coefficient is selected between ± 0.50 to ± 0.95, which are shown in bold in Table 5.
Fault Detection Performance Evaluation Criteria
The four states including the normal state, gearbox oil temperature overrun fault, gearbox oil filter pressure fault, and gearbox oil level fault are, respectively, marked as Q = [0,1,2,3], and the dataset is divided into four parts. By combining the three types of faults with the normal state in turn, we perform WT fault detection through the CS LightGBM algorithm to obtain four sets of classification indicators. In order to measure the classification of imbalanced data, the Matthews correlation coefficient (MCC) is introduced to evaluate the fault detection model. At the same time, the false alarm rate (FAR) and missed detection rate (MDR) are used as fault detection evaluation indicators. The mixed matrix of two classification problems is shown in Table 6.
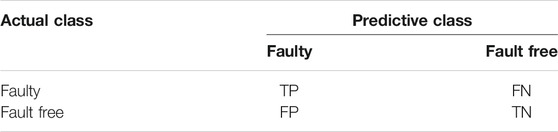
TABLE 6. Confusion matrix.
In this study, true positive (TP) is the number of samples correctly identified as faulty; false positive (FP) is the number of samples wrongly identified as fault free; true negative (TN) is the number of samples correctly identified as fault free; and false negative (FN) is the number of samples wrongly identified as faulty. The indicators under the binary classification are as follows:
Results and Discussion
The experimental data are extracted from a 3-year SCADA dataset of a wind farm. The experiment verifies the effectiveness of the proposed cost-sensitive LightGBM for fault detection of WT gearboxes. In order to further verify the superiority of the method, three advanced fault diagnosis methods were compared, including cost-sensitive AdaBoost (AdaCost), cost-sensitive GBDT (GBDTcost), and cost-sensitive XGBoost (XGBcost). By using different evaluation criteria in three different datasets, Figures 5, 6 show FAR and MDR under different algorithms, respectively. In order to avoid overfitting in the model, a five-fold cross-validation method is used to evaluate the model. The smaller FAR and MDR mean better performance.
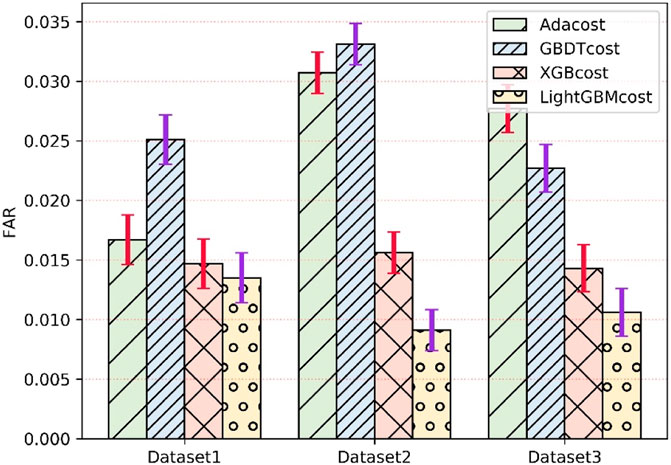
FIGURE 5. False alarm rate of four algorithms for fault detection of wind turbines gearboxes.
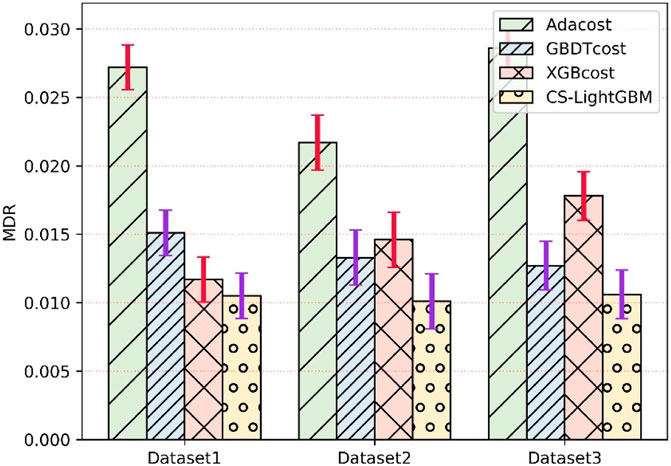
FIGURE 6. Missing detection rate of four algorithms for fault detection of wind turbines gearboxes.
The comparison results of the proposed method and the AdaCost algorithm, GBDTcost algorithm, and XGBcost algorithm under different fault conditions are shown in Figures 5, 6, respectively. It can be seen that the cost-sensitive LightGBM method is lower than the other three algorithms in terms of FAR and MDR, and the XGBcost criteria are generally better than the AdaCost and GBDTcost methods. When analyzing failure dataset 2, the FAR index of the CS LightGBM method is only 1.43% and the MDR index is only 1.01%. This method has good fault detection performance. The traditional cost-sensitive Boost method has high false positives and high false positives in the fault detection process, while the false negative and false positive rates of the CS LightGBM method are lower than those of the other three methods.
Figure 7 shows the MCC of three different fault datasets. The MCC can also be used in the case of imbalanced samples. The closer the MCC is to 1, the better the performance of the method. It can be seen from Figure 6 that the MCC of the cost-sensitive lightGBM method in dataset 2 is as high as 99.61% and the MCC of the remaining datasets is higher than that of the AdaCost, GBDTcost, and XGBcost.
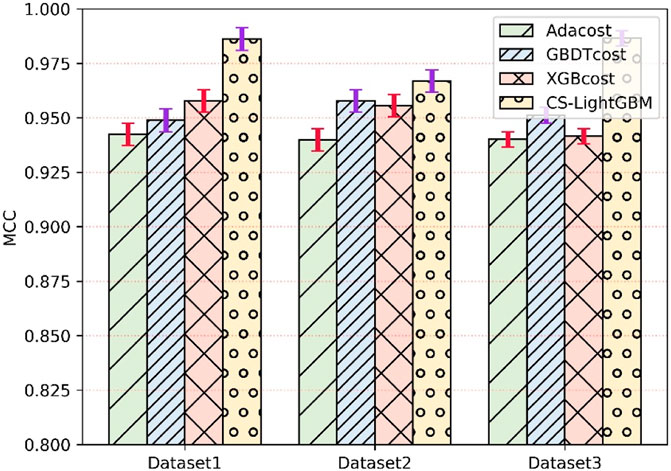
FIGURE 7. Matthews correlation coefficient of four algorithms for fault detection of wind turbines gearboxes.
Conclusion and Future Work
WT gearboxes are operated in harsh conditions for a long time, the fault rate will increase, and it is extremely prone to faults. The accuracy of its diagnosis is often affected by many factors such as harsh environments and extreme weather. In order to improve the accuracy of fault diagnosis, the shortcomings of traditional algorithms are analyzed and compared, and a fault detection method based on CS LightGBM is proposed. The innovation is mainly reflected in the following two aspects:
1) The fault characteristics of the WT gearbox are analyzed, the fault features are extracted, and its fault feature indexes are obtained, by using the correlation between the feature correlation to improve the fault diagnosis performance
2) A method based on CS LightGBM is proposed and applied to the actual fault diagnosis of WTs and compared with the traditional cost-sensitive Boost methods
The experimental study demonstrated that existing algorithms had a low ability of wind turbine’s fault detection. Two points that should be noticed are that the existing algorithm did not perform well just because it is not specially designed for wind turbine fault detection and it still has distinguished competences in industrial fault diagnosis and other fields. The cost-sensitive LightGBM is mainly suitable for imbalanced data, but its ability for other fault diagnosis remains unknown.
A single algorithm cannot detect all the faults in the WT, so the combined algorithm will become the research topic in the future. The comprehensive simulation of WT fault conditions will also be our research topic in the future. That is for all units of WT that are interconnected, and their features are strongly coupled. The occurrence of a fault in a particular component affects all the remaining units. Therefore, it is necessary to establish more compound fault models to conduct a comprehensive analysis of the WT system (Iranmehr et al., 2019).
Data Availability Statement
The original contributions presented in the study are included in the article/supplementary material; further inquiries can be directed to the corresponding author.
Author Contributions
All authors listed have made a substantial, direct, and intellectual contribution to the work and approved it for publication.
Funding
This work was supported in part by the National Natural Science Foundation of China (Grant No. 61403046), the Natural Science Foundation of Hunan Province, China (Grant No. 2019JJ40304), Changsha University of Science and Technology “The Double First Class University Plan” International Cooperation and Development Project in Scientific Research in 2018 (Grant No. 2018IC14), the Research Foundation of the Education Bureau of Hunan Province (Grant No.19K007), Hunan Provincial Department of Transportation 2018 Science and Technology Progress and Innova-tion Plan Project (Grant No. 201843), the Key Laboratory of Renewable Energy Electric-Technology of Hunan Province, the Key Laboratory of Efficient and Clean Energy Utilization of Hunan Province, Innovative Team of Key Technologies of Energy Conservation, Emission Reduction and Intelligent Control for Power-Generating Equipment and System, CSUST, Hubei Superior and Distinctive Discipline Group of Mechatronics and Automobiles(XKQ2021003 and XKQ2021010), National Training Program of Innovation and Entrepreneurship for Undergraduates (Grant No. 202010536016), Major Fund Project of Technical Innovation in Hubei (Grant No. 2017AAA133), and Guangxi Key Laboratory of Trusted Software (No.201728).
Conflict of Interest
The authors declare that the research was conducted in the absence of any commercial or financial relationships that could be construed as a potential conflict of interest.
Publisher’s Note
All claims expressed in this article are solely those of the authors and do not necessarily represent those of their affiliated organizations, or those of the publisher, the editors and the reviewers. Any product that may be evaluated in this article, or claim that may be made by its manufacturer, is not guaranteed or endorsed by the publisher.
References
Amirat, Y., Benbouzid, M. E. H., Wang, T., Bacha, K., and Feld, G. (2018). EEMD-based Notch Filter for Induction Machine Bearing Faults Detection. Appl. Acoust. 133, 202–209. doi:10.1016/j.apacoust.2017.12.030
Bonett, D. G., and Wright, T. A. (2000). Sample Size Requirements for Estimating Pearson, Kendall and Spearman Correlations. Psychometrika 65, 23–28. doi:10.1007/bf02294183
Chen, T., and Guestrin, C. (2016). Xgboost: A Scalable Tree Boosting System. In Proceedings of the 22nd Acm Sigkdd International Conference on Knowledge Discovery and Data Mining, August 13-17, 2016, San Francisco, CA, USA, 785–794.
Chen, Z., Ding, S. X., Peng, T., Yang, C., and Gui, W. (2017). Fault Detection for Non-gaussian Processes Using Generalized Canonical Correlation Analysis and Randomized Algorithms. IEEE Trans. Ind. Electro. 65, 1559–1567. doi:10.1109/TIE.2017.2733501
Croux, C., and Dehon, C. (2010). Influence Functions of the Spearman and Kendall Correlation Measures. Stat. Methods Appl. 19, 497–515. doi:10.1007/s10260-010-0142-z
Domingos, P. M. (1999). A General Method for Making Classifiers Cost-Sensitive. InProceedings of the Fifth ACM SIGKDD International Conference on Knowledge Discovery and Data Mining, San Francisco, CA, USA, August 15-18, 1999; pp. 155–164.
Elkan, C. (2001). The Foundations of Cost-Sensitive Learning. In Proceedings of International Joint Conference on Artificial Intelligence 2, 973–978.
Fan, W., Stolfo, S. J., Zhang, J., and Chan, P. K. (1999). AdaCost: Misclassification Cost-Sensitive Boosting. Proc. Icml, 97–105.
Fumera, G., and Roli, F. J. V. C. A. I. p. L. I. A. (2002). Cost-sensitive Learning in Support Vector Machines. Computer Science.
Gao, Q. W., Liu, W. Y., Tang, B. P., and Li, G. J. (2018). A Novel Wind Turbine Fault Diagnosis Method Based on Intergral Extension Load Mean Decomposition Multiscale Entropy and Least Squares Support Vector Machine. Renew. Energ. 116, 169–175. doi:10.1016/j.renene.2017.09.061
Han, L., Wang, Q., Jiang, K., Wang, X., and Zhou, Y. (2020). Quantitative Diagnosis Method of Gearbox under Varying Conditions Based on ARX Model and Generalized Canonical Correlation Analysis. IEEE Access 8, 40629–40639. doi:10.1109/access.2020.2972381
Iranmehr, A., Masnadi-Shirazi, H., and Vasconcelos, N. (2019). Cost-sensitive Support Vector Machines. Neurocomputing 343, 50–64. doi:10.1016/j.neucom.2018.11.099
Jiang, Q., Yan, X., and Huang, B. (2015). Performance-driven Distributed PCA Process Monitoring Based on Fault-Relevant Variable Selection and Bayesian Inference. IEEE Trans. Ind. Electro. 63, 377–386. doi:10.1109/TIE.2015.2466557
Ke, G., Meng, Q., Finley, T., Wang, T., Chen, W., Ma, W., et al. (2017). Lightgbm: A Highly Efficient Gradient Boosting Decision Tree. Proceedings of Advances in Neural Information Processing Systems 30, 3146–3154. doi:10.5555/3294996.3295074
Knoll, U., Nakhaeizadeh, G., and Tausend, B. (1994). Cost-sensitive Pruning of Decision Trees. Proceedings of European Conference on Machine Learning 784, 383–386. doi:10.1007/3-540-57868-4_79
Liang, H., Chen, Y., Liang, S., and Wang, C. (2018). Fault Detection of Stator Inter-turn Short-Circuit in PMSM on Stator Current and Vibration Signal. Appl. Sci. 8, 1677. doi:10.3390/app8091677
Long, W., Jiao, J., Liang, X., and Tang, M. (2018). An Exploration-Enhanced Grey Wolf Optimizer to Solve High-Dimensional Numerical Optimization. Eng. Appl. Artif. Intelligence 68, 63–80. doi:10.1016/j.engappai.2017.10.024
Long, W., Jiao, J., Liang, X., Wu, T., Xu, M., and Cai, S. (2021a). Pinhole-imaging-based Learning Butterfly Optimization Algorithm for Global Optimization and Feature Selection. Appl. Soft Comput. 103, 107146. doi:10.1016/j.asoc.2021.107146
Long, W., Wu, T., Xu, M., Tang, M., and Cai, S. (2021b). Parameters Identification of Photovoltaic Models by Using an Enhanced Adaptive Butterfly Optimization Algorithm. Energy 229, 120750. doi:10.1016/j.energy.2021.120750
Mitchell, R., and Frank, E. J. (2017). Accelerating the XGBoost Algorithm Using GPU Computing. PeerJ Comp. Sci. 3, 127. doi:10.7717/peerj-cs.127
Qiao, W., and Lu, D. (2015). A Survey on Wind Turbine Condition Monitoring and Fault Diagnosis-Part I: Components and Subsystems. IEEE Trans. Ind. Electron. 62, 6536–6545. doi:10.1109/tie.2015.2422112
Ra, A ., Aeh, B., and Song, D. Chaos-opposition-enhanced Slime Mould Algorithm for Minimizing the Cost of Energy for the Wind Turbines on High-Altitude Sites. ISA Trans. 160, 2021. doi:10.1016/j.isatra.2021.04.011
Song, D., Chang, Q., Zheng, S., Yang, S., Yang, J., and Hoon Joo, Y. (2021). Adaptive Model Predictive Control for Yaw System of Variable-Speed Wind Turbines. J. Mod. Power Syst. Clean Energ. 9 (1), 219–224. doi:10.35833/mpce.2019.000467
Stetco, A., Dinmohammadi, F., Zhao, X., Robu, V., Flynn, D., Barnes, M., et al. (2019). Machine Learning Methods for Wind Turbine Condition Monitoring: A Review. Renew. Energ. 133, 620–635. doi:10.1016/j.renene.2018.10.047
Tang, M., Ding, S. X., Yang, C., Cheng, F., Shardt, Y. A. W., Long, W., et al. (2019). Cost-sensitive Large Margin Distribution Machine for Fault Detection of Wind Turbines. Cluster Comput. 22, 7525–7537. doi:10.1007/s10586-018-1854-3
Tang, M., Zhao, Q., Ding, S. X., Wu, H., Li, L., Long, W., et al. (2020). An Improved LightGBM Algorithm for Online Fault Detection of Wind Turbine Gearboxes. Energies 13, 807. doi:10.3390/en13040807
Teng, W., Ding, X., Zhang, X., Liu, Y., and Ma, Z. (2016). Multi-fault Detection and Failure Analysis of Wind Turbine Gearbox Using Complex Wavelet Transform. Renew. Energ. 93, 591–598. doi:10.1016/j.renene.2016.03.025
Turney, P. D. J. (1994). Cost-sensitive Classification: Empirical Evaluation of a Hybrid Genetic Decision Tree Induction Algorithm. J. Artif. intelligence Res. 2, 369–409. doi:10.1613/jair.120
Wang, T., Han, Q., Chu, F., and Feng, Z. (2019). Vibration Based Condition Monitoring and Fault Diagnosis of Wind Turbine Planetary Gearbox: A Review. Mech. Syst. Signal Process. 126, 662–685. doi:10.1016/j.ymssp.2019.02.051
Yang, D., Pang, Y., Zhou, B., and Li, K. (2019). Fault Diagnosis for Energy Internet Using Correlation Processing-Based Convolutional Neural Networks. IEEE Trans. Syst. Man. Cybern, Syst. 49, 1739–1748. doi:10.1109/tsmc.2019.2919940
Yang, J., Fang, L., Song, D., Su, M., Yang, X., Huang, L., et al. (2021). Review of Control Strategy of Large Horizontal‐axis Wind Turbines Yaw System. Wind Energy 24 (2), 97–115. doi:10.1002/we.2564
Zhang, D., Qian, L., Mao, B., Huang, C., Huang, B., and Si, Y. (2018). A Data-Driven Design for Fault Detection of Wind Turbines Using Random Forests and XGboost. IEEE Access 6, 21020–21031. doi:10.1109/access.2018.2818678
Keywords: fault detection, Spearman rank correlation, cost-sensitive classification, lightGBM, wind turbine
Citation: Tang M, Zhao Q, Wu H and Wang Z (2021) Cost-Sensitive LightGBM-Based Online Fault Detection Method for Wind Turbine Gearboxes. Front. Energy Res. 9:701574. doi: 10.3389/fenrg.2021.701574
Received: 28 April 2021; Accepted: 30 June 2021;
Published: 06 August 2021.
Edited by:
Dongran Song, Central South University, ChinaReviewed by:
Rizk Masoud, University of Menoufia, EgyptYunsong Xu, Harbin Institute of Technology, China
Copyright © 2021 Tang, Zhao, Wu and Wang. This is an open-access article distributed under the terms of the Creative Commons Attribution License (CC BY). The use, distribution or reproduction in other forums is permitted, provided the original author(s) and the copyright owner(s) are credited and that the original publication in this journal is cited, in accordance with accepted academic practice. No use, distribution or reproduction is permitted which does not comply with these terms.
*Correspondence: Huawei Wu, whw_xy@hbuas.edu.cn
†These authors have contributed equally to this work