Research on Detection Technology of 235U Enrichment and Loading Uniformity for Nuclear Fuel Rods
 Mingfei Gu
 Dagui Huang1*
 - 1School of Mechanical and Electrical Engineering, University of Electronic Science and Technology of China, Chengdu, China
- 2China North Nuclear Fuel Co., Ltd., Baotou, China
To ensure that fuel rods operate in nuclear reactors safely and reliably, UO2 pellets with different enrichment levels of 235U in the same production line are manufactured in batches and divisionally managed to avoid confusion or the potential misloading of UO2 pellets with different enrichment levels. At the same time, nondestructive tests for their enrichment levels and loading uniformity and all UO2 pellets must be nondestructively tested during production. By studying the enrichment detection mechanism of the UO2 pellets of 235U, the design of an integral standard rod was carried out, and a single integral standard rod was used to achieve the calibration of the enrichment measurement curve, as well as the detection and calibration of abnormal pellets. This study undertook a comparison test of 235U enrichment between the neutron activation method and the array multi-probe passive method. The test results showed that the array multi-probe passive method had higher detection efficiency and equal accuracy.
Introduction
Nuclear fuel rods (hereinafter referred to as fuel rods) are the energy source and core of nuclear power plant reactors. The main function of fuel rods is to release heat and contain nuclear fission products. Since the nuclear power plants have different reactor types and different refueling batches, the 235U enrichment of the UO2 pellets in the fuel rods may vary. To ensure the safe and reliable operation of nuclear fuel rods in nuclear power plant reactors, the 235U enrichment and charging uniformity of the UO2 pellets inside the fuel rods must conform to relevant design and production requirements. On the production line of a nuclear fuel element production plant, fuel rods with different enrichments are manufactured in batches and undergo very strict differentiated management. It is forbidden to accidentally load UO2 pellets with different enrichments into fuel rods. If the UO2 pellets with different enrichment are misloaded in fuel rods, the axial power distribution of the fuel rods will be uneven, and local hot spots may be generated. In severe cases, the fuel rods may rupture, cause radioactive material leakage, contaminate the coolant, and affect the safety of the reactor operation (Zhang et al., 2013). Therefore, to prevent the potential misloading of UO2 pellets with different enrichment (hereinafter referred to as abnormal pellets) during the fuel rod manufacturing process, and to ensure the safe and reliable operation of fuel rods in nuclear power plant reactors, the UO2 pellets in the fuel rods must be subject to 100% non-destructive inspection of 235U enrichment and charging uniformity (hereinafter referred to as enrichment inspection). Generally, fuel rod enrichment detection methods include the neutron activation method and the passive method. The current fuel element production line mainly uses the neutron activation method. In the 1970s, the first 252Cf thermal neutron detection system, which was designed by the American Alamos Laboratory H.O. Menlove, was used to measure the total content of fissile material in the fuel rods of the light water power reactor. At the end of the 1990s, Chinese researchers also developed a fuel rod neutron activation detection device by using a252Cf neutron source, the source was surrounded by neutron moderators, and utilized a neutron protective material as the outer layer and lead as the gamma-ray shielding material. The transmission device allows the fuel rod to pass through the irradiator at a constant speed. The exit of the irradiator is equipped with a NaI(TI) gamma-ray detector. The gamma rays induced by the fuel rod after neutron irradiation are ten times higher than the spontaneous decay of 235U, which is convenient for checking 235U enrichment (Chen and Liu, 2007). Although the neutron activation method has high detection efficiency, it has disadvantages such as needing to replace neutron sources regularly, and the high cost of detection, maintenance, and management. Although the detection cost of the traditional single-probe passive method is low, the poor detection efficiency leads to difficulty in satisfying the needs of the fuel rod production line. In recent years, with the advancement of sensor technology, fuel rod enrichment inspection based on the array multi-probe passive method has been rapidly developed and attracted widespread attention. The United States NDA and the Zhengzhou branch of China Nuclear Power Engineering Co. Ltd., the Institute of High Energy Physics, the Chinese Academy of Sciences (Liu et al., 2019), and other units have carried out related research.
In this paper, through the analysis and research on the detection mechanism of UO2 pellet 235U enrichment, a comparative experiment of neutron activation method and array multi-probe passive method is carried out. The test results show that the array multi-probe passive method has higher detection accuracy. The high detection efficiency and recognition rate of abnormal pellets can replace the traditional method for fuel rod neutron activation enrichment detection and loading uniformity detection.
The Test Requirements of Fuel Rod Structure and Enrichment
Fuel Rod Structure
The fuel rod is composed of a cladding tube, UO2 pellets, spring, upper end plug, and lower end plug, as shown in Figure 1. The fuel rod has an outer diameter of 9.5 mm and a length of about 4 m. Each type of fuel rod generally only contains UO2 pellets with the same enrichment. During the fuel rod production process, UO2 pellets have various types of enrichment, such as 1.8, 2.4, 3.1, 4.45, 4.95%, etc. The incident of loading different enrichment UO2 pellets into fuel rods is prohibited during the production process. All fuel rods must be tested 100% for enrichment.
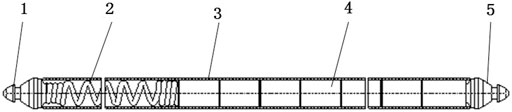
FIGURE 1. Schematic diagram of fuel rods.
Enrichment Test Requirements
1) It can detect the average enrichment value of UO2 pellet 235U in fuel rods.
2) Abnormal pellets in fuel rods can be detected. For fuel rods mixed with UO2 pellets with a relative enrichment of ± 15.6%, detection confidence can be 95%. For fuel rods mixed with UO2 pellets with relative enrichment of ± 8%, the detection confidence can be 2.5%.
3) The efficiency of enrichment detection should meet the needs of the fuel rod production line.
Enrichment Deviation
The enrichment deviation refers to the percentage difference between the matrix pellets and the abnormal pellets, which is defined as follows:
where:
E0-Nominal enrichment value of matrix pellets, %,
Ei-Abnormal pellet enrichment, %,
M0-Matrix pellet enrichment, %,
Mi-Abnormal pellet mass, g.
In general, considering that the diameter of matrix pellets and abnormal pellets are the same, and their density difference is small, the above formula can be rewritten as:
where L0 and Li are the height of matrix pellets and abnormal pellets, respectively. That is, when calculating the deviation of abnormal pellets, the height of pellets should be considered.
Principle of Fuel Rod Enrichment Detection
The spontaneous alpha decay of the 235U nuclide in the UO2 pellet is accompanied by 98 and 185.7 keV gamma-ray radiations. gamma rays of 185.7 keV are generally selected as fuel rod enrichment inspection signals. When the fuel rod passes through the γ probe at a constant speed, the signal is collected and processed by measuring the circuit to obtain the distribution γ spectrum of 235U enrichment in the direction of the horizontal axis of the fuel rod. The γ spectrum is analyzed and processed through data analysis and processing. By comparing calibration data of standard rods, the average enrichment value of fuel rods can be obtained and it can be judged whether there are abnormal fuel pellets with different enrichment levels in fuel rods.
Equipment Calibration of Standard Rod Design and Inspection
Enrichment inspection of the standard rod design is one of the key technologies for checking fuel rods. Usually, a set of reference fuel rods with the same structure and same geometric dimensions but different UO2 pellet enrichment are used to calibrate inspection equipment and make a 235U relationship curve between enrichment and γ-ray intensity. Then calibration curve, rejection limit, supervision limit, and control limit are established to realize the detection of fuel rod enrichment and abnormal pellets.
A standard rod is equipped with a series of UO2 pellets with different enrichments arranged along the axial length. The remaining structure and dimensions are the same as the fuel rod. That is, a certain enrichment (E0) is used as matrix pellets, and the pellets are placed in appropriate positions. Individual pellets are loaded with different enrichment (called abnormal pellets) and then assembled, welded, and the pellet gap is measured according to the fuel rod manufacturing process. Finally, through scanning inspection, the isolated abnormal pellets in these rods are obtained. The γ-ray intensity difference Δγ between abnormal and the matrix pellets is used to obtain the relationship between the relative deviation of pellet enrichment ΔE and γ-ray intensity difference Δγ through one-variable linear regression α. If the curve passes through the origin, the linear relationship between the two variables can be expressed as:
Design requirements are when the deviation of enrichment of abnormal pellets mixed in a fuel rod is ≥ 15.6%, inspection method and inspection equipment should be able to detect these abnormal pellets with a detection efficiency of 95% confidence. The rejection limit Rj exceeding this design requirement is:
where.
Rj-Abolishment limit, Count;
A-The slope of curve;
k-95% 95% confidence factor. When calculating positive deviation, k is -1.96. When calculating negative deviation, k is +1.96; σ-Standard deviation of the measured value.
Any measurement signal that exceeds the rejection limit may indicate that there is an abnormal pellet. In practice, it is allowed to be checked again. If a signal exceeding the rejection limit Rj is repeated, the fuel rod will be judged as a disqualified product (Mou et al., 2010) (He et al., 2008).
Two methods of enrichment standard rods can be used in fuel rod production, multiple standard rods and one-piece standard rods.
Multiple Standard Rods
Multiple standard rods include enrichment measurement standard rods (the same kind of 235U enriched UO2 pellets are packed into a fuel rod to manufacture fuel rods) and abnormal pellet standard rods (the other UO2 pellets with 235U enrichment different from matrix pellets). According to the technical conditions, the fuel rods are made of a mixture of these pellets and matrix pellets, which are used to calibrate the inspection equipment. Taking an 235U enrichment standard 4.45% rod as an example, there are two standard rods, of which one is an enrichment calibration standard rod, and the other one is an abnormal pellet calibration standard rod.
Integral Standard Rod
Integrated standard rod combines the measurement functions of the enrichment calibration standard rod and the abnormal pellet calibration standard rod into one standard rod. Integrated standard rod includes enrichment measurement section and abnormal pellet measurement section. The enrichment measurement section is used to fit and calibrate the enrichment measurement curve. Generally, it should not be less than three calibration points. The abnormal pellet measurement section is used to identify misloaded UO2 pellets. Generally, it should include possible production for pellets with different enrichment, take 235U enrichment 4.45% standard rod as an example, see Figure 2.
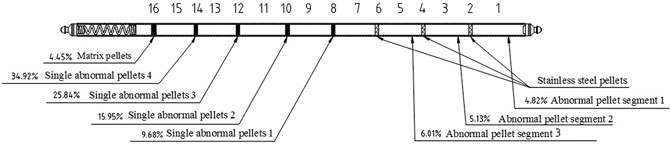
FIGURE 2. Integral enrichment standard rod.
Single Probe Passive Method Fuel Rod Enrichment Inspection
The single-probe passive method fuel rod enrichment inspection equipment is relatively simple and low cost. A set of gamma-ray intensity measurement systems only needs an NaI probe, amplifier, single-channel analyzer, and calibrator. First, the standard rod is used to calibrate the γ-ray intensity measurement system. After determining fuel rod enrichment and abnormal pellet rejection limit, fuel rod product enrichment can be checked.
The disadvantage of this equipment is that the inspection efficiency is relatively low and the fuel rod transmission speed is slow. So multi-channel measurement methods are often used, such as an eight-channel single-probe passive fuel rod enrichment inspection system, as shown in Figure 3. However, the inspection efficiency is still relatively low, and it is difficult to satisfy the demand for mass production of fuel rod products in general.
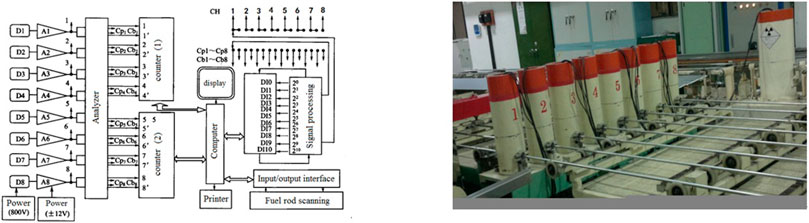
FIGURE 3. single probe inspection equipment.
The Enrichment Detection of Fuel Rods by Neutron Activation Method
Basic Principles of Neutron Activation Method
The neutron activation method by using the characteristic of 235U has a large neutron capture cross section for thermal neutrons. 252Cf neutron source irradiation device is attached to the inspection device. The half-life of 252Cf is 2.638 years. The most important nuclear property of 252Cf is that it can release a large number of neutrons in spontaneous fission, and the yield is 2.35 × 10¹²n/(s.g). Moreover, the average neutron energy of the neutrons is 2.348 MeV. The 235U in UO2 pellet induces nuclear fission reaction under activation of neutron irradiation, the produced fission products are accompanied by a series of beta decays, releasing a large amount of delayed gamma rays, which are ten times higher than gamma rays of 235U spontaneous decay. Several times, by measuring fissile prompt gamma rays and delayed gamma rays, the content of fissionable material in tested material can be determined. 252Cf neutron activation method is currently a commonly used method in fuel rod production lines.
Neutron Activation Inspection System
The fuel rod is irradiated by thermal neutrons to induce strong gamma rays. Delayed gamma intensity is recorded by NaI detector, and the 235U content of each pellet in the fuel rod can be distinguished. The maximum speed of fuel rod inspection can reach 9 m/min. The structure of the device is shown in Figure 4. It is not affected by the age of UO2 pellets. The resolution of abnormal pellets is equivalent to that of passive methods.
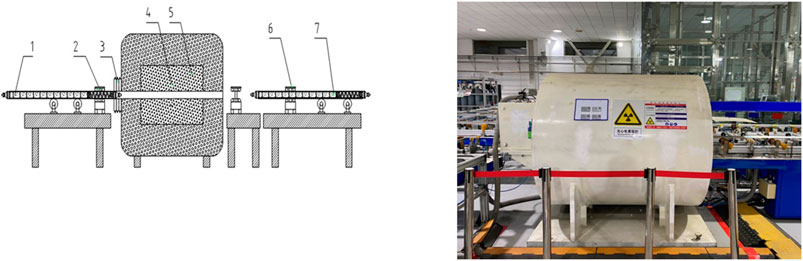
FIGURE 4. Schematic diagram of neutron activation equipment.
Advantages and Disadvantages of Neutron Activation
The advantages of neutron activation detection fuel rod enrichment are fast speed, good resolution, and suitability for pellets of any age. However, it is necessary to select measurement parameters reasonably to optimize detection efficiency. The intensity of the slow emission line released by activated pellets decreases exponentially with time (because the half-life of most fission products is very short). Therefore, the distance between detector and neutron source should be as small as possible. Inevitably, the distance will be limited by the irradiation shielding shell of the device. To obtain the best resolution, the window of the detector collimation hole is set in a range of 15–20 mm. The scanning speed of the fuel rod is closely related to the intensity of the neutron source. Generally, after a half-life (2.638 years), neutron yield decreases significantly. At this time, it is necessary to appropriately reduce the scanning speed of the fuel rod to achieve the detection resolution of abnormal fuel pellets. The main disadvantage of neutron activation is the high cost of equipment, and the need to replace the 252Cf neutron source regularly, high operating costs, and strict radiation protection requirements. Fuel rods that have undergone neutron activation inspections need to be stored for about 50 min before they can be manually transported.
Array Multi-Probe Passive Enrichment Inspection of Fuel Rod
The principle of the array multi-probe passive method for fuel rod enrichment inspection is the same as that of the single-probe passive method. It directly collects 185.7 keV gamma rays from the spontaneous alpha decay of 235U nuclide. The difference is that the array multi-probe passive method uses dozens or even hundreds of gamma probes arranged in the horizontal axis. When each UO2 pellet passes through these gamma probes, in turn, the gamma rays released by it will be affected by these gamma probes. The probe accepts, so it can get more γ-rays than single-probe passive method. Therefore, combining the corresponding data analysis algorithm, the array multi-probe passive method can obtain a higher inspection efficiency and recognition rate, as shown in Figure 5.
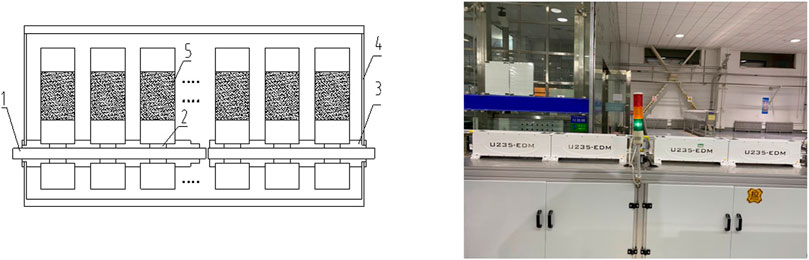
FIGURE 5. Array of multi-probe passive devices.
Contrast Test of Array Multi-Probe Passive Method and Neutron Activation Method
The 4.45 and 4.95% enrichment standard rods commonly used in production are selected for the test. Test parameters include standard rod transmission speed, collection interval, recognition rate, and other parameters, which are shown in Table 1.
TABLE 1. Comparative test parameters.
4.45% Enrichment Fuel Rod Inspection
4.45% Enrichment Standard Rod
The 4.45% enrichment standard bar information is shown in Table 2, and the structure diagram is shown in Figure 2.
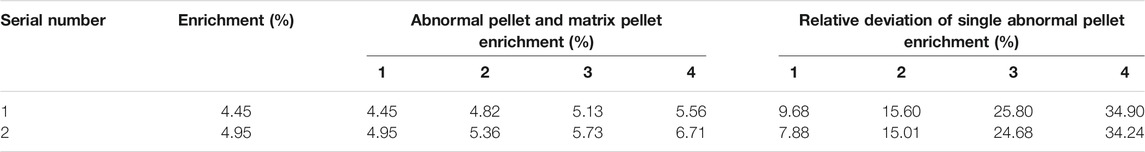
TABLE 2. 4.45% Enrichment standard rod information.
4.45% Enrichment Standard Rod Calibration Data
The array multi-probe passive fuel rod enrichment inspection system uses pellets with different enrichments in standard rods and corresponding average gamma counts to calibrate the inspection system.
The Calibration Curve of 4.45% Standard Pellet
The calibration curve of 4.45% standard pellet is shown in Figure 6
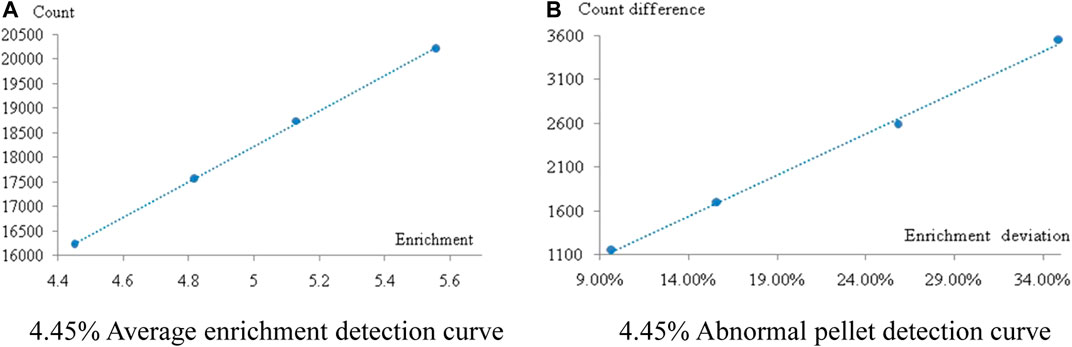
FIGURE 6. 4.45% Standard rod calibration curve. (A) 4.45% Average enrichment detection curve, (B) 4.45% Abnormal pellet detection curve.
Comparison of 4.45% Standard Rod Passive Enrichment Detection System and Active Enrichment Detection System
A comparison of 4.45% standard rod passive enrichment detection system and active enrichment detection system, the results are shown in Table 3.
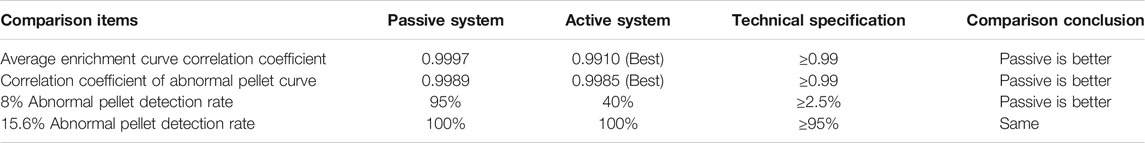
TABLE 3. 4.45% Standard rod calibration comparison.
4.95% Enrichment Fuel Rod Inspection
4.95% Enrichment Standard Rod
The 4.95% enrichment standard bar information is shown in Table 4.
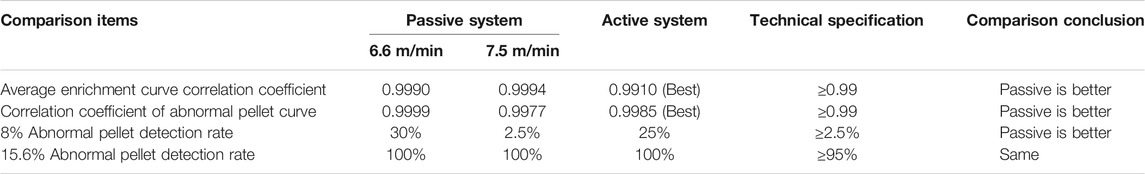
TABLE 4. 4.95% Standard rod calibration comparison.
Calibration Data of 4.95% Enrichment Standard Rod
The 4.95% standard rods were verified at speeds of 6.6 and 7.5 m/min, of which 7.5 m/min was used to verify the maximum detection speed of the passive enrichment detection system.
4.95% Standard Rod Calibration Curve
The calibration curve of 4.95% standard bar is shown in Figure 7.
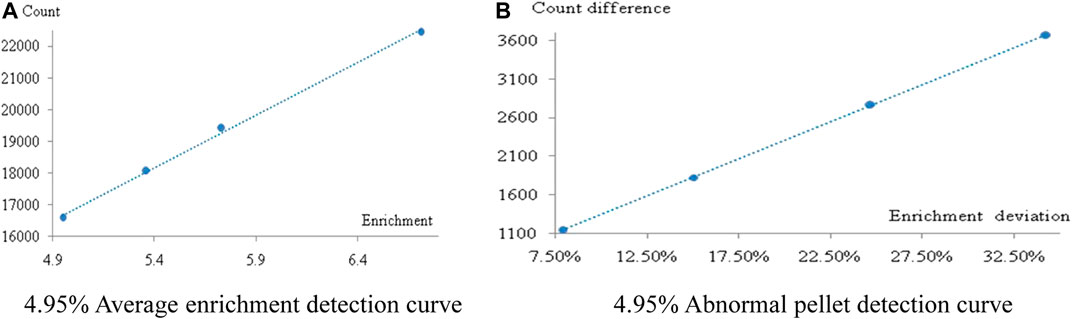
FIGURE 7. 4.95%Standard rod calibration curve. (A) 4.95% Average enrichment detection curve, (B) 4.95% Abnormal pellet detection curve.
Comparison of 4.95% Standard Rod Passive Enrichment Detection System and Active Enrichment Detection System
Comparison of 4.95% standard rod passive enrichment detection system and active enrichment detection system. The comparison results are shown in Table 4.
Conclusion of Calibration Data Comparison
From the comparison of passive and active calibration data in the above 4.45% Enrichment Fuel Rod Inspection to 4.95% Enrichment Fuel Rod Inspection sections, we can conclude:
1) The correlation coefficient of the average enrichment calibration curve and correlation coefficient of abnormal pellet calibration curve of the passive enrichment detection system are better than those of the active enrichment detection system, indicating that the data linearity of the passive enrichment detection system is better;
2) The detection rate of 8% abnormal pellets is the most critical sensitivity index of this detection system, which characterizes the most precise detection requirements. The passive enrichment detection system, no matter what enrichment standard bar, is 8%. The detection rate of abnormal pellets is far better than the active enrichment detection system, which shows that the passive enrichment detection system is more sensitive to the detection of abnormal pellets.
3) The collection interval of the passive enrichment detection system in Table 1 is 7 mm. The collection interval of the active enrichment detection system is 17 mm. It further proves the high sensitivity of the passive enrichment detection system for abnormal pellet detection.
System Repeatability Verification
The repeatability of the system characterizes the consistency of multiple measurement results of the detection system, and can also be regarded as the stability index of the detection system. Therefore, it is necessary to further verify the project. The repeatability of the system requires repeated measurement of a standard rod 20 times, and the following indicators are calculated for evaluation, shown in Table 5.
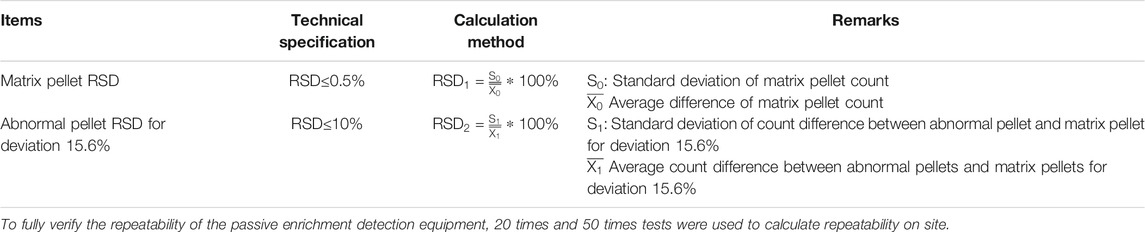
TABLE 5. System repeatability index.
Repeatability Verification (20 times Inspections)
The results of the count value of the standard rod (20 times) detected by the passive enrichment detection system are shown in Table 6.
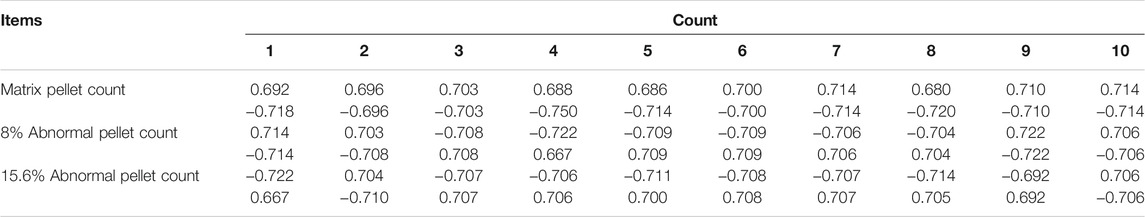
TABLE 6. 20 Times of repeatable validation data.
According to the above table, checking the repeatability of the detection system:
The verification results meet technical requirements.
Repeatability Verification (50 times Inspections)
The count result of the standard rod (50 times) detected by the passive enrichment detection system is shown in Table7.
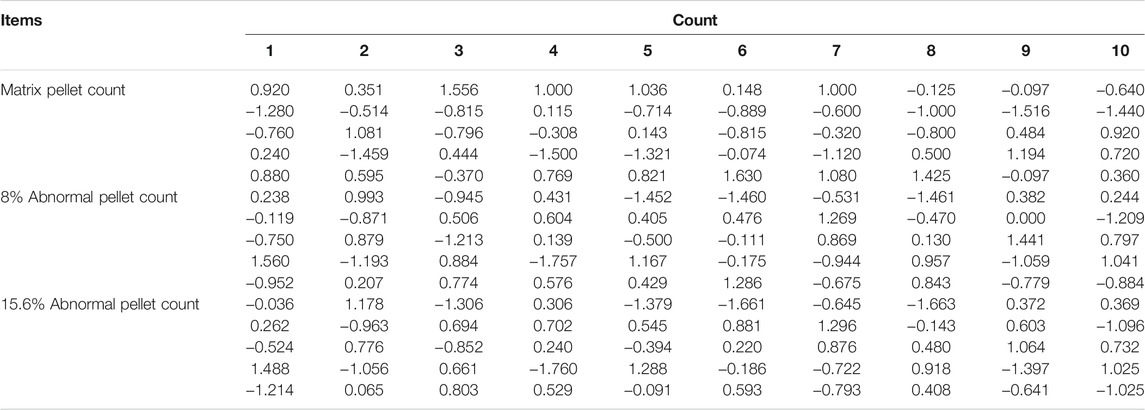
TABLE 7. Repeatable validation data of 50 times.
According to the above table, checking the repeatability of the detection system:
The verification results meet technical requirements.
Comparison of Repeatability Results
The repeatability of the passive enrichment detection system was compared with the active one, and the results are shown in Table 8.
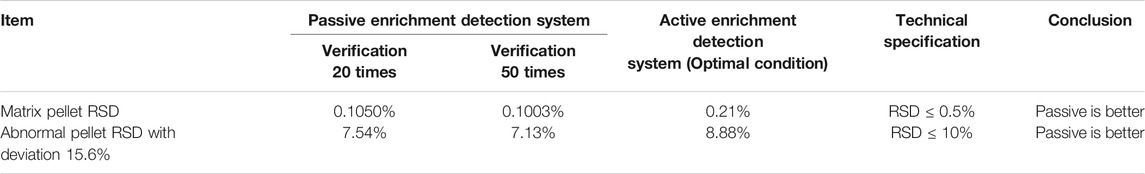
TABLE 8. Comparison of repeatability verification.
Conclusion
The comparison between array-type multi-probe passive enrichment detection system and the active enrichment detection system resulted in the following conclusions:
1) The detection speed of array type multi-probe passive enrichment detection system is not lower than that of the active enrichment detection system.
2) The linear correlation coefficient of the average enrichment detection curve meets technical specifications, and the linear correlation coefficient of the abnormal pellet detection curve meets technical specifications and is better than an active enrichment detection system.
3) The detection rate of 8% abnormal pellets meets technical specifications, and the detection rate of 15.6% abnormal pellets meets technical specifications and is not lower than the detection capability of the active enrichment detection system.
4) The repeatability of the system meets technical specifications and is better than an active enrichment detection system.
5) The array multi-probe passive method has high detection accuracy, detection efficiency, and recognition rate of abnormal pellets, which can replace traditional fuel rod neutron activation methods for enrichment and loading uniformity detection methods.
Data Availability Statement
The raw data supporting the conclusion of this article will be made available by the authors, without undue reservation.
Author Contributions
MG: writing, calculation, modeling DH: writing, review, guide DY: calculation.
Conflict of Interest
DY, HT, and YZ were employed by the China North Nuclear Fuel Co., Ltd.
The remaining authors declare that the research was conducted in the absence of any commercial or financial relationships that could be construed as a potential conflict of interest.
Publisher’s Note
All claims expressed in this article are solely those of the authors and do not necessarily represent those of their affiliated organizations, or those of the publisher, the editors and the reviewers. Any product that may be evaluated in this article, or claim that may be made by its manufacturer, is not guaranteed or endorsed by the publisher.
References
Chen, B., and Liu, C. (2007). Light Water Reactor Fuel Element[M]. Beijing, China: Chemical Industry Press, 198–204.
He, L., Meng, Y., Shao, J., and Gao, Q. (2008). Application of Gamma Spectroscopy in the Verification and Measurement of 235U Enrichment of Fast Reactor New Fuel[J]. Isotope Vol. 21, 61–64.
Liu, Y., Liu, S., and Wang, Y. (2019). Nuclear Fuel Rod Enrichment Passive Detection System[P]. China: Utility Model Patent.
Mou, W., Li, Y., Wang, X., and Liu, G. (2010). 235U Enrichment Detection[J]. At. Energ. Sci. Technol. 44 (No. 7), 782–784.
Keywords: nuclear fuel rods, UO2 pellets, enrichment, neutron activation method, passive method
Citation: Gu M, Huang D, Yu D, Tang H and Zhu Y (2021) Research on Detection Technology of 235U Enrichment and Loading Uniformity for Nuclear Fuel Rods. Front. Energy Res. 9:663937. doi: 10.3389/fenrg.2021.663937
Received: 04 February 2021; Accepted: 29 June 2021;
Published: 22 September 2021.
Edited by:
Yingwei Wu, Xi’an Jiaotong University, ChinaReviewed by:
Tengfei Zhang, Shanghai Jiao Tong University, ChinaZeyun Wu, Virginia Commonwealth University, United States
Copyright © 2021 Gu, Huang, Yu, Tang and Zhu. This is an open-access article distributed under the terms of the Creative Commons Attribution License (CC BY). The use, distribution or reproduction in other forums is permitted, provided the original author(s) and the copyright owner(s) are credited and that the original publication in this journal is cited, in accordance with accepted academic practice. No use, distribution or reproduction is permitted which does not comply with these terms.
*Correspondence: Dagui Huang, dg_huang@vip.163.com