Deep Dehydration as a Plausible Mechanism of the 2013 Mw 8.3 Sea of Okhotsk Deep-Focus Earthquake
 Hao Zhang
 Suzan van der Lee2
  Zengxi Ge
- 1University of Utah Seismograph Stations, University of Utah, Salt Lake City, UT, United States
- 2Department of Earth and Planetary Sciences, Northwestern University, Evanston, IL, United States
- 3School of Earth and Space Sciences, Peking University, Beijing, China
The rupture mechanisms of deep-focus (>300 km) earthquakes in subducting slabs of oceanic lithosphere are not well understood and different from brittle failure associated with shallow (<70 km) earthquakes. Here, we argue that dehydration embrittlement, often invoked as a mechanism for intermediate-depth earthquakes, is a plausible alternative model for this deep earthquake. Our argument is based upon the orientation and size of the plane that ruptured during the deep, 2013 Mw 8.3 Sea of Okhotsk earthquake, its rupture velocity and radiation efficiency, as well as diverse evidence of water subducting as deep as the transition zone and below. The rupture process of this earthquake has been inferred from back-projecting dual-band seismograms recorded at hundreds of seismic stations in North America and Europe, as well as by fitting P-wave trains recorded at dozens of globally distributed stations. If our inferences are correct, the entirety of the subducting Pacific lithosphere cannot be completely dry at deep, transition-zone depths, and other deep-focus earthquakes may also be associated with deep dehydration reactions.
Introduction
Deep-focus earthquakes occur in subducting slabs of lithosphere at depths greater than 300 km. The mechanisms of these earthquakes must be fundamentally different from the brittle failure associated with earthquakes on the shallow (<70 km) megathrust plate interface because of the vast differences in pressure, temperature, and composition (Frohlich, 2006; Green and Houston, 1995; Kirby et al., 1996). Three previously proposed rupture mechanisms for deep-focus earthquakes include a phase transformation in the olivine polymorphs (Green and Burnley, 1989; Kirby et al., 1991; Green et al., 2015), thermal shear instabilities (Kanamori et al., 1998; Wiens, 2001), and embrittlement resulting from devolatilization (e.g., dehydration) of volatile-bearing phases present over a suitable spatial extent (Jung et al., 2004). The last mechanism is widely invoked to explain intermediate-depth earthquakes between 70 and 300 km (Peacock, 2001; Hacker et al., 2003).
The May 24, 2013, Mw 8.3, 609 km deep, Sea of Okhotsk earthquake provides a new perspective in understanding the rupture mechanism of the deep-focus earthquakes on account of its unusually large magnitude and the rapidly increased density of seismic stations at the Earth’s surface. Previous studies of the rupture process of this earthquake revealed important aspects of the earthquake’s mechanics, but did not agree with each other in all important respects (Wei et al., 2013; Ye et al., 2013; Chen et al., 2014; Meng et al., 2014; Zhan et al., 2014). As found by Ruiz et al. (2017), it is of importance to identify the correct orientation of the causative faults of the deep earthquakes since incorrect assumption of the faults’ orientation could result in biased parameters, and thus may lead to misinterpretation to the mechanisms of the deep earthquakes. The 2013 Okhotsk earthquake was found to rupture sequentially on a subvertical plane by inverting teleseismic P, SH, and depth phases (pP and sSH) (Chen et al., 2014), but was discovered to rupture a subhorizontal fault plane using teleseismic P waves (Wei et al., 2013; Ye et al., 2013). Moreover, the subhorizontal fault as the causative fault is also supported by the P and pP-wave single-array back-projection (BP) imaging (Meng et al., 2014). In addition, the single-array back projection typically has the uncertainties of the subevents approximately 20 km (Zhang et al., 2015). In this study, the multi-array BP imaging is used to dramatically increase the resolution of the images as detailed in A Synthetic Test for the Causative Fault’s Orientation and BP Images’ Resolution.
To infer a comprehensive model for the rupture of the 2013 deep Okhotsk earthquake, we combined two different rupture-assessment methods: one is the multi-array BP method (Kiser and Ishii, 2012; Zhang et al., 2016), modified from the BP method (Ishii et al., 2005; Xu et al., 2009; Zhang and Ge, 2010; Zhang et al., 2011), and the other one is the multi-subevent inversion (Kikuchi and Kanamori, 1991). The back-projection analyses were carried out in two different frequency bands (Koper et al., 2011; Wang and Mori, 2011; Lay et al., 2012; Yao et al., 2013; Fan and Shearer, 2015) using data from USArray (TA) and European seismic network (EU) (Figure 1), while the multi-subevent inversion was performed using the data from the Global Seismic network (GSN) (Figure 2). Next, we integrated the back-projection and multi-subevent models with the local curved strike of the subducting Pacific slab. Additionally, to identify the orientation of the causative fault of the earthquake and resolution of the BP images, a synthetic test composed of two seismic point sources has been performed. Finally, we discuss the source properties of the earthquake and their implications for the mechanics of the earthquake on the basis of the resulting rupture models.
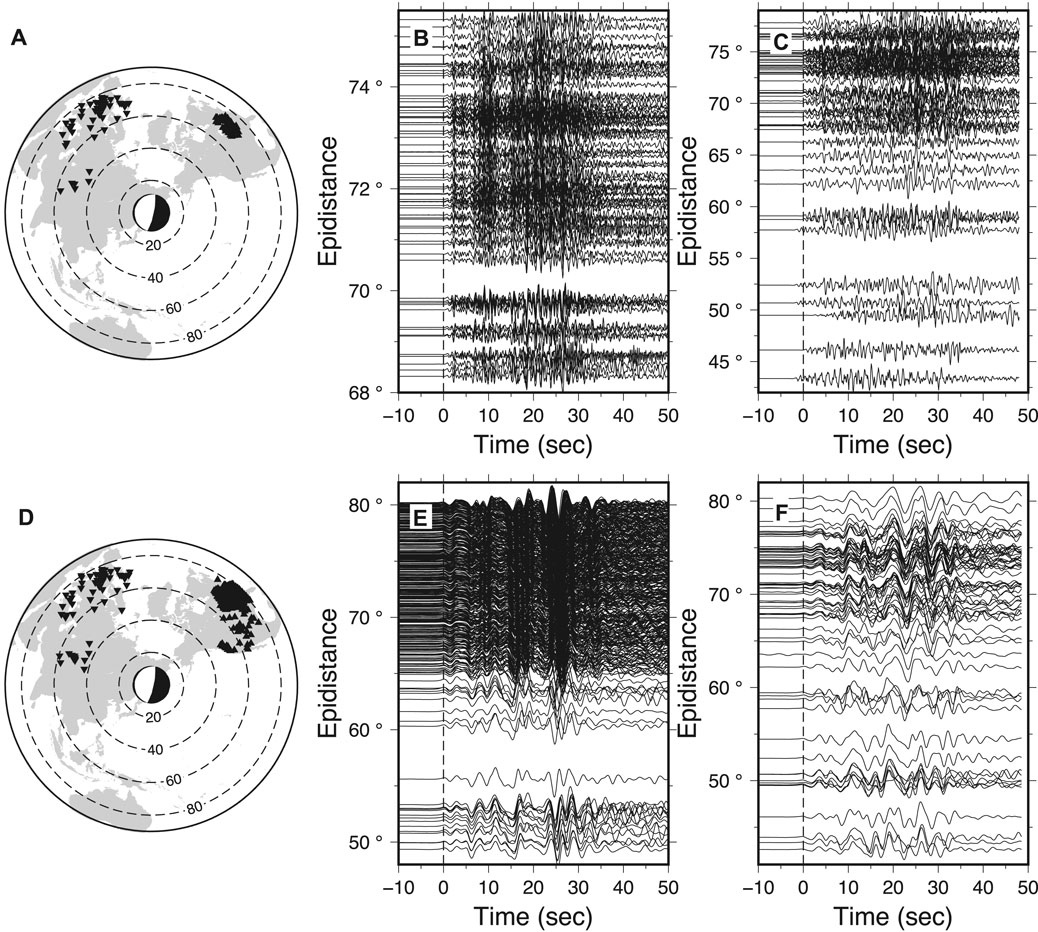
FIGURE 1. Station distribution of the TA (triangles) and the EU (inverse triangles) arrays for (A) the high- and (D) low-frequency bands. P-wave trains are aligned with the first arrival (dashed lines) at the TA filtered in (B) the high- (0.5–2 Hz) and (E) low- (0.1–0.5 Hz) frequency bands, and at the EU in (C) the high- and (F) low-frequency bands. The P waveform’s polarities are reversed at the TA. The GCMT focal mechanism is placed at the epicenter of the 2013 Sea of Okhotsk deep-focus earthquake.
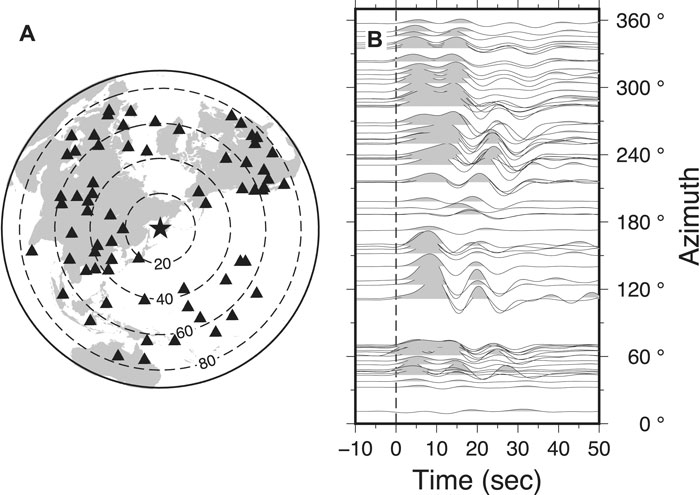
FIGURE 2. Station distribution and seismic waveforms using in the multi-subevent inversion. (A) GSN station distribution and (B)P-waves aligned with the first arrivals (vertical dashed line). Stations at the GSN in the epidistance range of 20o–80o are used in the inversion. Triangles represent the GSN stations and the star indicates the epicenter of the earthquake. Polarities of the waveforms with azimuths greater than 180o are reversed.
Data and Methodology
Multi-Array, Multi-Frequency-Band Back-Projection Analysis
P-wave trains from two seismic networks TA and EU were back-projected to the source region (Zhang et al., 2016; Zhang et al., 2017; Zhang and Ge, 2017) in two adjacent frequency bands (0.1–0.5 Hz and 0.5–2.0 Hz, Figure 1). We developed the final back-projection rupture model in the following three steps.
The first step was to separately generate single-array back-projection imaging for each frequency band and each array. Because signal coherence is a critical factor in successful back projection, we only retained traces having a cross-correlation coefficient greater than 0.6 with the trace of a reference station near the array’s center. This culling reduced the number of used traces to 74 high-frequency and 377 low-frequency traces for the TA array (Figures 1B,E). Likewise, for the EU array, we retained 57 high-frequency and 69 low-frequency traces (Figures 1C,F). The low-frequency data at the TA have better azimuthal coverage than the high-frequency data, whereas the azimuthal coverage for the EU is independent of the frequency band (Figures 1A,D).
The global Centroid Moment Tensor (GCMT) implies two possible fault planes: one (strike 189o, dip 11o, and rake −93o) is subhorizontal, and the other one (strike 12o, dip 79o, and rake −89o) is subvertical (Figures 1A,D). As elucidated by Meng et al. (2014), a subhorizontal plane agrees better with both the P and pP-waves back-projection imaging as well as our back-projection models. Moreover, the subhorizontal plane as the causative fault is evidently supported by a synthetic test done with two seismic point sources separating 20 km vertically as detailed in A Synthetic Test for the Causative Fault’s Orientation and BP Images’ Resolution. We approximated this subhorizontal fault plane by a horizontal plane centered around the USGS hypocenter (54.87oN, 153.28oE, and 609 km). The plane is larger than the area that contains the aftershocks (Supplementary Figure 1) and is gridded into 101 × 101 0.05o × 0.05o fault patches. A grid search was conducted to identify slip on those fault segments that correspond to stacking slownesses that maximize stacked P wave energy in 6-s-long time windows for the first 50 s of P arrivals (Figure 1).
In a second step, and for both frequency bands, the two sets of P-wave trains from the TA and EU arrays were jointly back-projected together. To equalize the contribution of the two arrays, stacked P amplitude distributions were normalized with their respective maxima. The multi-array back-projection imaging was then done by summing up the normalized single-array distributions and identifying the subevents for both frequency bands.
The third step back-projected the high-frequency and low-frequency data sets simultaneously. As before, the stacked P amplitude distributions for the two frequency bands were normalized with their respective maxima before stacking. Thus, the four sets of P-wave trains, from the TA and EU arrays and both frequency bands, were back-projected together to image slip evolution on the fault plane and in time (Figure 3). We eliminated the artifacts from the subevents at the same locations by retaining the subevents with the maximum energy. The rupture time of a subevent was obtained by averaging those derived from both arrays. Thus, the remaining subevents comprise the final back-projection rupture model as shown in Figure 4.
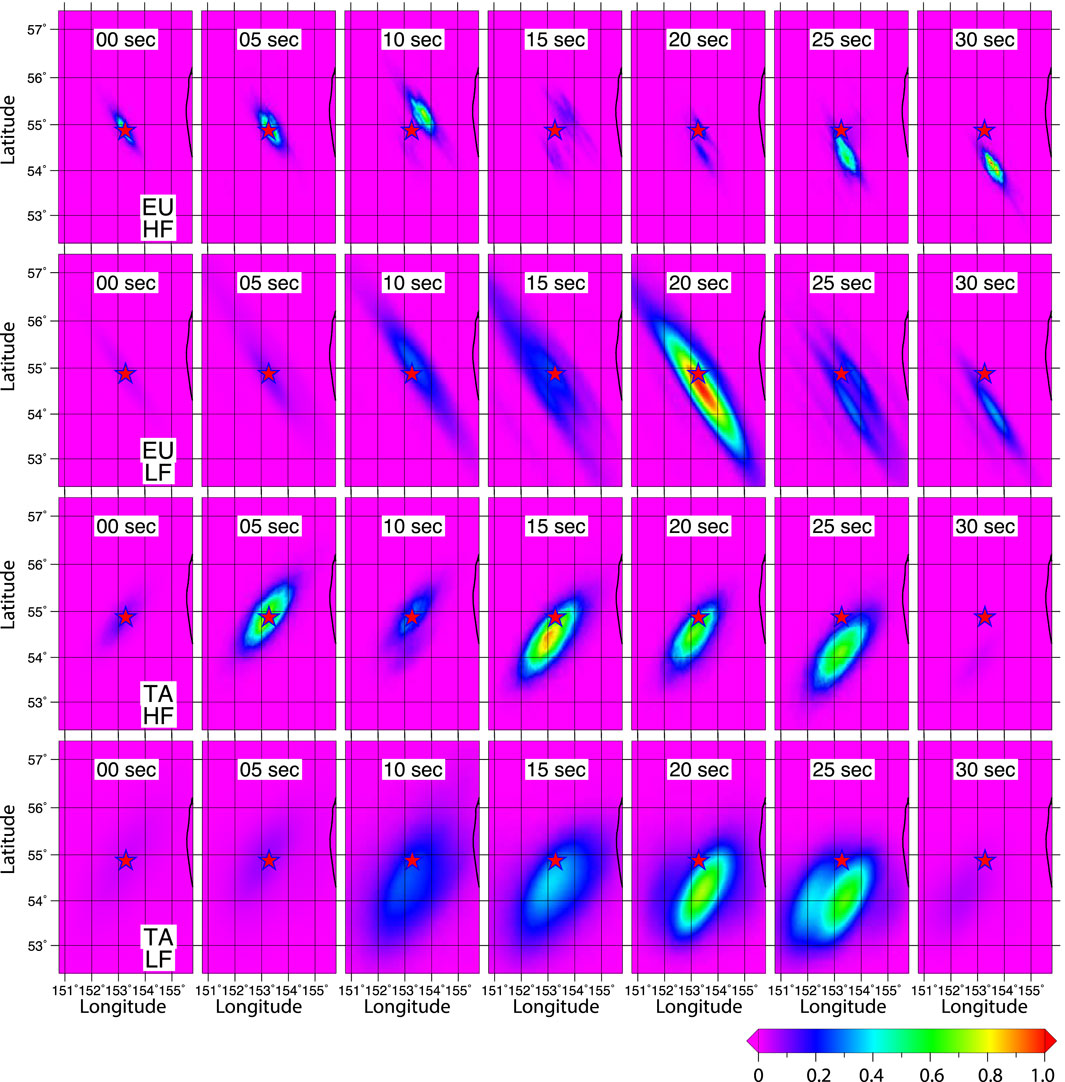
FIGURE 3. Rupture evolution of the earthquake by back-projecting P-waves from the arrays TA and EU in the high- (HF) and low-(LF) frequency bands. The color bar denotes the normalized power of potential subevents. The potential subevents with the maximum power at each time frame are viewed as the true subevents. Red star indicates the hypocenter.
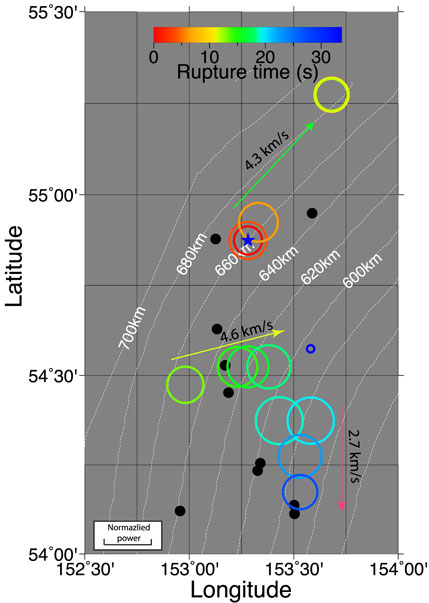
FIGURE 4. The final back-projection rupture model. The colored circles indicate the subevents. Their areas are proportional to the normalized power, which is indicated by the scale bar. The color bar represents the rupture times of the subevents. The black dots depict the aftershocks, while the blue star indicates the hypocenter. The white dashed lines are depth contours of the subducting Pacific slab (Hayes et al., 2012). The arrows indicate the rupture directions.
Global, Low-Frequency Waveform Inversion
Low-passed P-wave trains (2–100 mHz) from the Global Seismic Network (GSN) were inverted for seismic moments of the Okhotsk earthquake’s subevents, using the method of Kikuchi and Kanamori (1991). The P waves are from 69 GSN stations with epicentral distances in the teleseismic window for a deep source from 20o to 80o (Figure 2A), avoiding involvement of P wave triplications and P waves in shadow zone. P-wave peak values in traces along the strike do not vary significantly with time (Figure 2B), implying that all subevents may have similar nodal planes and thus focal mechanisms. In addition, the shortest duration of the P waveforms in the azimuthal range of 120o–180o represents rupture directivity associated with the southward rupture of the earthquake.
The subhorizontal fault plane as the causative fault, indicated by the BP synthetic test detailed in A Synthetic Test for the Causative Fault’s Orientation and BP Images’ Resolution, was gridded into 19 × 13 patches, each 10 km long along the strike and 5 km wide, respectively. Based on the subevents imaged in the final back-projection model, we chose to subdivide the rupture and slip evolution into a number of discrete subevents and found that a source model with 12 subevents (Supplementary Figure 1) produces well-fitting waveforms except for those with azimuths close to the strikes of nodal planes, such as station COLA (Supplementary Figure 2), and captures the complexity of the rupture pattern. Increasing the number of subevents improves the waveform fits but yields unrealistically high seismic moments (Supplementary Figure 3). To be consistent with the final back-projection rupture model, we removed subevents 40 s after the origin time, leading to a well correspondence of the remaining subevents to those in the multi-array, multi-frequency-band back-projection rupture model, except for three subevents northwest of the epicenter and the southernmost subevent (Figure 4 and Supplementary Figure 1). Because the contribution of these four subevents to the waveform fits is very small (Supplementary Figure 2, 4), we removed them from the final multi-subevent model (Figure 5A). The resulting model has a seismic moment of 2.3 × 10²¹ Nm (equivalent to a moment magnitude of Mw 8.2), providing a lower-bound for the seismic moment of the earthquake.
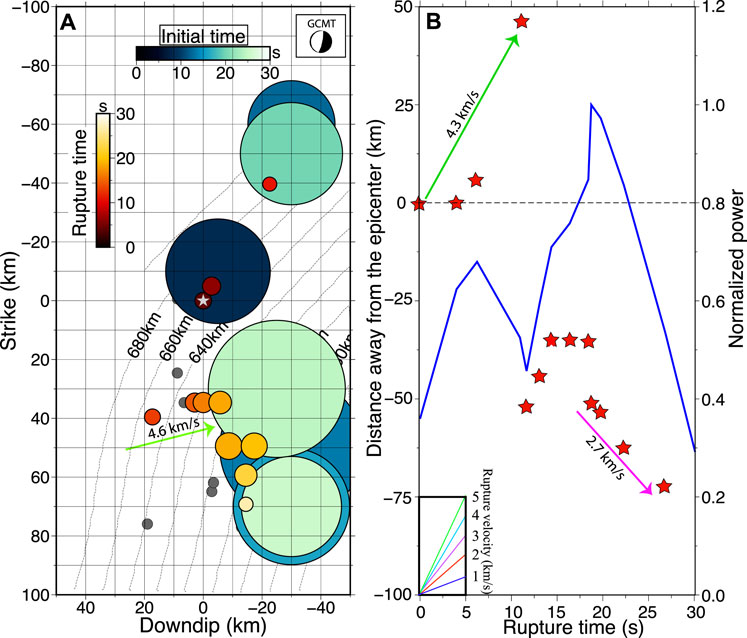
FIGURE 5. Multi-array, multiband back-projection and multi-subevent rupture models. (A) Integration of the two source models. The ocean color bar in the final inversion source model indicates initial times of the subevents, while the hot color bar in the back-projection model represents rupture times of the subevents. Circles indicate the subevents, whose areas are estimated in the Data and Methodology section and are proportional to the normalized power for the back-projection method. White star depicts the epicenter and gray dots denote aftershocks. Dashed curved lines indicate the depth contours of the subducting slab (Hayes et al., 2012). The inset shows the GCMT focal mechanisms of the earthquake. (B) Distances away from the epicenter varying with rupture time (red stars) and normalized power of subevents varying with rupture time (blue line). Moment releases peaks at 6 s and 18 s. Blue, red, purple, cyan, and green lines in the inset represent rupture velocities of 1–5 km/s.
This multi-subevent model estimates moment release of the earthquake’s subevents. Rupture areas of the subevents in the slip model can be inferred from their seismic moments. The seismic moment is defined as M0 = μ
The estimated rupture radii of the subevents range from 15.0 to 27.1 km (Figure 5A). Estimating the rupture radii is important for evaluating the fault dimensions and inferring the source mechanism of the earthquake.
A Synthetic Test for the Causative Fault’s Orientation and BP Images’ Resolution
To determine the orientation of the causative fault (subhorizontal or subvertical), a BP synthetic test was carried out for the arrays TA and EU. The P waves were synthesized from two seismic point sources separating 20 km vertically with a 5-s bursting difference using the orthonormal propagator method (Wang, 1999) and were filtered in the frequency band of 0.1–0.5 Hz as shown in Figure 6. We performed the single-array BP as above mentioned for both arrays and then combined them. The BP images of the two point sources were derived as shown in Figure 7. The second source is imaged right at the same location of the first one in the combined BP image. This indicates that the vertical resolvability of the multi-array BP imaging is too low to discriminate the depth differences of the subevents, but the depth differences of the subevents have no effect on the multi-array BP imaging on the horizontal plane. If the rupture of the earthquake is on the subvertical plane, the width of the causative plane could be much greater than 121 km, given the dip angle of approximately 80o from GCMT and the rupture width of ∼21 km projected to the horizontal plane during the second rupture stage (Figure 4). The shallow intraslab M > 8 earthquakes such as 1933 Mw 8.5 Sanriku earthquake (Okal et al., 2016) and 2017 Mw 8.2 Chiapas, Mexco earthquake (Zhang and Brudzinski, 2019) typically have rupture widths less than 100 km. Moreover, compared to the shallow earthquakes, the deep-focus earthquakes have faster rise times (Houston and Williams, 1991) and hence compacter rupture dimensions. The extremely wide rupture seems to be unlikely for the deep-focus earthquake. Therefore, the orientation of the causative fault of the 2013 Okhotsk earthquake is likely to be subhorizontal.
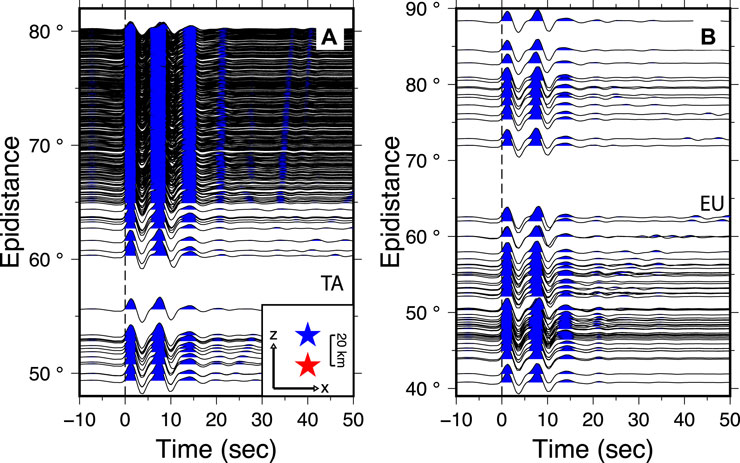
FIGURE 6. Synthetic waveforms for (A) TA and (B) EU arrays in a frequency band of 0.1–0.5 Hz. Inset of (A). The first seismic source (red star) initiates at 0 s and the second one (blue star) bursts at 5 s and 20 km above the first one.
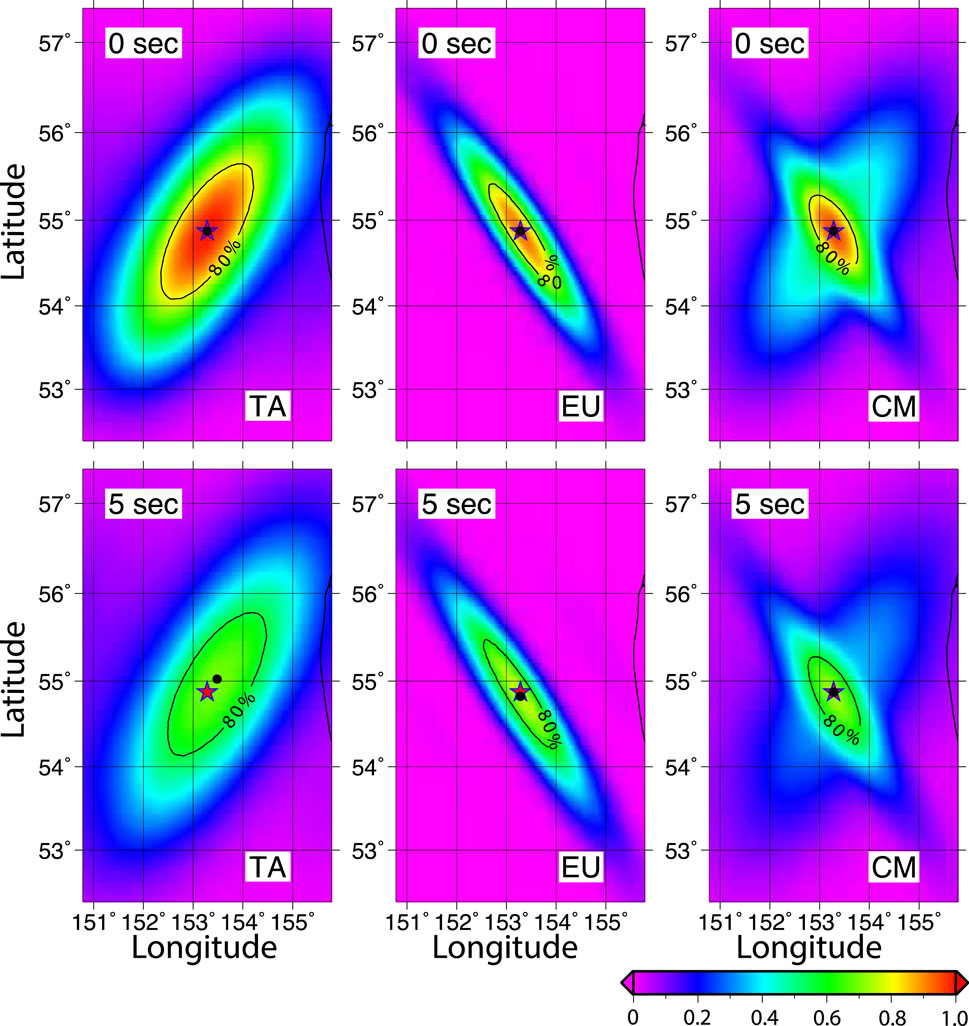
FIGURE 7. Rupture imaging of the two seismic sources by back-projecting synthesized P-waves from the TA (left panels) and the EU (middle panels) in the low-frequency band and the combined imaging (right panels). The color bar denotes the normalized power of potential subevents. Red stars indicate the epicenters. The contour shows the 80% of the maximum normalized power.
Besides confining the orientation of the causative fault, the synthetic test shows the resolution of the BP images. For the TA and EU, the second source is imaged ∼20 km northeast and ∼5 km south to the real location, respectively. However, for the combined image, the second source is imaged right to its real location. This indicates that the multi-array BP images have a high resolution less than 1 km, which is much better than those from the single-array BP. This is the reason why we take multi-array, multi-band, BP imaging in this study.
Results
Our multi-array, multi-frequency-band back-projected rupture imaging and the inverted multiple subevents show that the deep earthquake’s asymmetrical, bilateral rupture occurred within 30 s on a subhorizontal, curved fault plane (Figure 5A). The rupture could be separated into three principal segments at rupture velocities of 2.7–4.6 km/s, 47–84% of shear velocity (Fukao and Obayashi, 2013) at the focal depth (Figures 4, 5B). The rupture velocity is constrained from the multi-array, multi-frequency BP. The first segment ruptured northwards and somewhat down-dip on the subhorizontal fault plane at a high rupture velocity of 4.3 km/s, 78% of shear velocity at the focal depth. Unsurprisingly, this segment radiated strong high-frequency seismic energy. After a transitional second segment ruptured, the third segment started on the other (south) side of the nucleation point and ruptured in the reverse direction: southwards and somewhat up-dip at a velocity of 2.7 km/s, 47% of shear velocity at the focal depth, while radiating low-frequency seismic energy. For the first and third segments, the considerable slab-normal components of the rupture are 23 and 31 km wide, which are estimated from the multi-subevent inversion. The slab-normal component of the second segment is constrained to 19 km using the rupture length of the BP image. The wide slab-normal rupture has also been observed by Meng et al. (2014). Each of the rupture distances is wider than the thickness of the metastable olivine wedge (MOW) (less than 15 km estimated by Kirby et al. (1996) or approximately 15 km constrained by Marone and Liu (1997)) using numerical modeling unless the slab at the focal depth is contorted. Additionally, if there exists the MOW, the nucleation of the earthquake would occur near the bottom of the MOW as shown in the inset of Figure 8 since there stores more strain energy for the occurrence of large earthquakes. Besides the high resolution of the multi-array, multi-frequency BP images, the location of the MOW relative to the rupture of the earthquake has an uncertainty less than 5 km.
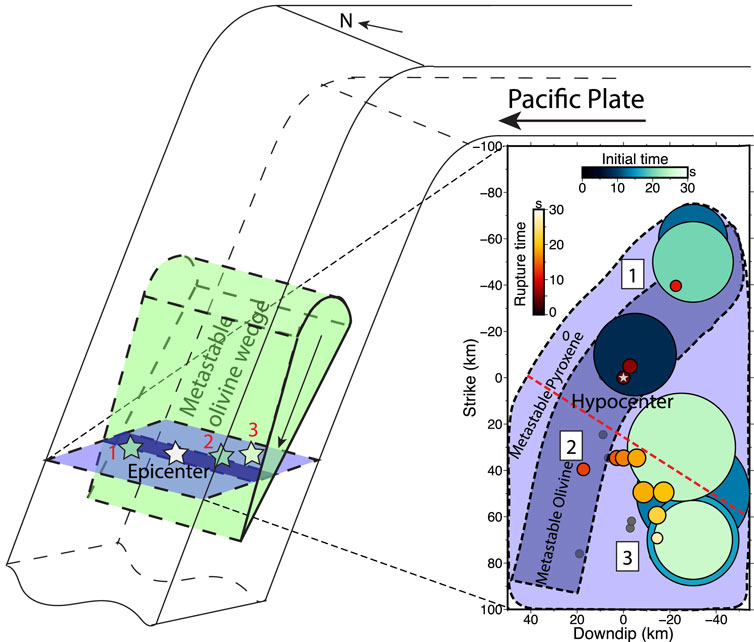
FIGURE 8. Schematic diagram illustrating the rupture of the 2013 Okhotsk earthquake outside the possible metastable olivine wedge (dark purple) but inside the metastable pyroxene wedge (light purple) (Bina, 2013). Three rupture segments are labeled 1, 2, and 3 respectively. (Inset) Overlap the final back-projection and inversion models with the possible MOW and metastable pyroxene wedge (MPW). Numbers one to three depict the first, second, and third rupture segments, respectively. Dark purple area denotes the MOW, and the light purple area indicates the MPW. The red dashed line just crosses the slab.
To confirm the rupture beyond the possible metastable olivine wedge, a source model with 12 subevents (Supplementary Figure 5B) is inverted on a curved plane with the method of Kikuchi and Kanamori (1991) using the data in Figure 2B. The curved plane is designed parallel to the strike of the subducting slab. The resulting misfit of the waveforms is 0.56, which is much larger than that derived from the final multi-subevent model in Figure 5A and Supplementary Figure 5A. The better fitting of waveforms for the final multi-subevent model can be seen in Supplementary Figure 4, 6. This emphasizes the necessity of the rupture beyond the possible MOW.
Intriguingly, the rupture in the first 13 s extends northwards of the hypocenter, followed by the fourth subevent that bursts 44 km southwest of the epicenter with an azimuth of approximately 200o, without subevents to spatially connect the two energy bursts (Figure 8A). The body wave incident on the location of the 13-secend subevent has a takeoff angle of approximately 90o. Given the subhorizontal fault (strike 189o, dip 11o, and rake −93o), the P-to-S amplitude ratio is only 0.082 according to radiation pattern (Aki and Richards, 2002), so triggering of the rupture by p waves is unlikely. The shear velocity at the depth of the hypocenter (609 km) is approximately 5.5 km/s in the velocity model AK135 (Kennett et al., 1995). The first S arrival at the 13-s subevent from the hypocenter is 8 s after the commence of the earthquake. The onset of the post-13-s subevent to the southwest is consistent with the arrival of S-waves from the preceding subevents. The appropriate timing and large amplitude of the S-waves thus indicate that the occurrence of the post-13-s subevent is dynamically triggered by the running S-waves. The coseismic dynamic triggering was also discovered in the 2012 Mw 8.6 Sumatra offshore earthquake (Zhang et al., 2012).
Comparison With Previous Studies
The rupture models in this study are basically consistent with those using single-array back-projection methods and/or inversion techniques (Wei et al., 2013; Ye et al., 2013; Meng et al., 2014; Zhan et al., 2014). For the fault plane, Wei et al. (2013) exclude the near-vertical fault plane based on the strong directivity effect along the azimuth of 165o, which significantly deviates from the strike (12o given by the GCMT) of this fault plane. The trending of subevents significantly off the strike of the subvertical fault plane leads Zhan et al. (2014) to choose the subhorizontal fault as the causative fault. Also, the subhorizontal fault plane is preferred by Ye et al. (2013) according to the single-array back-projection models and finite fault models. Additionally, the bilateral rupture in our rupture models agrees with another back-projection study by Meng et al. (2014).
The second largest subevent ruptures backward to the north relative to the largest subevent (Figure 5A). The rupture feature is confirmed by removing the two subevents in the new inversion model, respectively. The synthetic waveforms are significantly affected by the two subevents and show that the largest subevent radiates the first amplitude peak (Supplementary Figure 7), and the second largest one generates the second amplitude peak (Supplementary Figure 8). The locations and rupture times of the largest two energy-releasing peaks in our results agree reasonably well with other groups’ such as Zhan et al. (2014). This feature may be explained as a barrier, corresponding to the second largest subevent, is unbroken when the rupture first reaches it but eventually breaks down due to stress transferring. This intriguing rupture reversal has also been observed by prior studies (Wei et al., 2013; Zhan et al., 2014).
A profound difference between the models obtained in this study and by Ye et al. (2013) and Wei et al. (2013) is that the southernmost rupture is spatially shorter, resulting in this study’s more compact rupture area and lower rupture velocity. The compact rupture area in our model is the result of jointly back projecting seismic data from two arrays at different azimuths, reducing artifacts related to “smearing” of energy along the event-array azimuth (Zhang et al., 2016; Zhang et al., 2017; Zhang and Ge, 2017; Zhang and Brudzinski, 2019). The source model (Supplementary Figure 5C) by Zhan et al. (2014) lacks subevents in the northernmost, down-dip portion of our rupture models probably due to inversion of the displacement waveforms for a limited number of subevents.
Discussion
The estimated extent of Okhotsk rupture does not favor simple transformational faulting in metastable olivine as the primary instability mechanism, because the rupture extent exceeds the likely plausible thermo-spatial extent of metastable olivine in the slab. Likewise, both the large seismic efficiency of 0.6 determined by Ye et al. (2013) and fast rupture velocities in the first two rupture segments preclude (Tibi et al., 2003) a thermal shear instability (Ogawa, 1987; Hobbs and Ord, 1988) as the rupture mechanism. The simplest explanation of the earthquake would be that dehydration embrittlement, associated with intermediate-depth earthquakes, still operates at these great depths (Omori et al., 2004). Three more speculative seismogenic options include: 1) another form of transformational faulting, perhaps transformation of metastable pyroxene to metastable akimotoite; 2) nucleation by transformational faulting in the metastable olivine wedge that propagates into surrounding rock by shear melting (Green, 2017), perhaps aided by latent heat release (Bina, 1998); 3) unusual slab contortions that completely enclose the rupture plane within a flattened MOW (Stein, 1995).
Option 1) may seem plausible given its exothermicity (Green et al., 2015) and the broader thermal range of pyroxene metastability (Bina, 2013) as shown in Figure 8 due to slow rates of diffusion-controlled pyroxene-garnet transformation in the transition zone (Nishi et al., 2013; Van Mierlo et al., 2013). However, it has not been observed in the laboratory, and both the low abundance of pyroxene in the peridotitic bulk of the slab (<20% by volume (Ringwood, 1991) and the generally displacive nature of metastable pyroxene transitions (Dera et al., 2013) also disfavor this mechanism. The arguments that the earthquake has a high seismic efficiency and fast rupture velocity
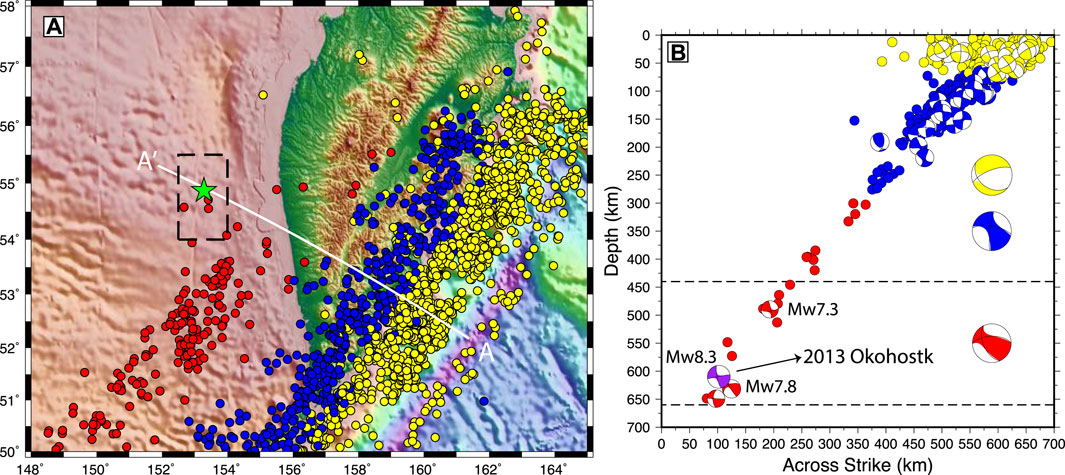
FIGURE 9. Seismicity in North Kamchatka subduction zone. (A) Seismicity distribution from the EHB Bulletin, ISC (1960–2008, http://www.isc.ac.uk/ehbbulletin/search/bulletin/). The shallow, intermediate, and deep-focus earthquakes are depicted by yellow, blue, and red dots, respectively. Green star indicates the epicenter of the 2013 Okhotsk earthquake. Black dashed frame represents the study region, while white line AA’ denotes the cross section in Figure 7B. (B) Seismicity of the subducting Pacific oceanic slab within 120 km around the cross-section AA’. The beach balls, in a side view from southwest to northeast, indicate the GCMT focal mechanisms of the earthquakes along the cross-section AA’ since 1976 (http://www.globalcmt.org/CMTsearch.html). They are colored with yellow, blue, and red for the shallow, intermediate, and deep-focus earthquakes, respectively. The focal mechanism of the 2013 Okhotsk earthquake is indicated by a purple beach ball, which has the same P axis as two other deep-focus earthquakes (Mw 7.3 and Mw 7.8). The three larger beach balls on the right-hand side from top to bottom indicate the normalized, summed focal mechanisms of the shallow, intermediate, and deep-focus earthquakes, respectively.
We consider the simplest plausible explanation to be that dehydration embrittlement (Green and Houston, 1995; Kirby, 1995; Houston, 2015) remains operable under conditions of deep-focus seismicity (Jung et al., 2004; Zhang et al., 2004). Jung et al. (2004) show that faulting due to dehydration can occur even at pressures so high that the volume change of reaction becomes negative and this mechanism can attain a near-critical state susceptible to stress change. This indicates that dehydration embrittlement does not require the evolution of a free fluid with a positive volume change to allow slip to occur. Ferrand et al. (2017) find that faults are experimentally produced by stress transfer driven by volume change of dehydration even under a partially hydrated condition (with only 5% volume of antigorite). Moreover, Green et al. (2015) and Green (2017) argue that it is nanometric crystallization of product phases, whether from hydration-dehydration reactions or from metastable transformations, which induce the formation of a fault zone. Deep dehydration has been invoked to interpret the rupture mechanism of the November 24, 2015 Mw 7.6 Peru deep-focus earthquake doublet (Zahradník et al., 2017).
Rüpke et al. (2006) demonstrate that at least 10% of water contained within the oceanic lithosphere upon subduction could survive passage through the mantle wedge en route to the mantle transition zone and lower mantle. While common hydrous minerals such as serpentine and chlorite would break down in the uppermost mantle, dense hydrous magnesium silicates can carry the water deeper and are stable in cool slabs down to at least as far as the top of the lower mantle (Komabayashi, 2006). Once these break down in/near the transition zone, the nominally anhydrous olivine polymorphs in the ambient mantle can absorb this water without melting (Smyth, 1994; Smyth and Jacobsen, 2006, studies in: Jacobsen and Van der Lee, 2006). Moreover, dehydration reactions in hydrated subducting slabs closely correlate with the depth-distribution of subduction-zone earthquakes, indicating dehydration embrittlement as a universal mechanism for intermediate and deep earthquakes (Omori et al., 2004; Barcheck et al., 2012; Shirey et al., 2019). In addition, there is evidence from deep diamond inclusions (Pearson et al., 2014) and indirect evidence from magneto-telluric studies, seismic tomography, and studies of seismic discontinuities (studies in Jacobsen and Van der Lee, 2006) that water indeed resides and cycles through the transition zone. Omori and Komabayashi (2007) propose one of several pathways by which subducting lithospheric slabs bring some of all subducted water to depth beyond the mantle wedge in dense hydrous magnesium silicates, which transform and dehydrate in the deep transition zone to help form less hydrous ringwoodite. Van der Lee et al. (2008) and Wang et al. (2018) show that hydrous ringwoodite is consistent with lowered rigidity imaged by seismic tomography in some places. The amounts by which the rigidity and density are lowered in ringwoodite are consistent with the volume of water supplied by a slab traversing the transition zone. Van der Lee et al. (2008) propose that a less-dense, hydrated transition zone provides a mechanism for water to return to the surface and that this deep water cycle may be responsible for many present and past plate-tectonic events. Shirey et al. (2019) invoke a similar deep water cycle to explain the deep diamond inclusions of Pearson et al. (2014). In other words, a deep upper-mantle water cycle is more consistent with diverse geophysical observations than a dry deep upper mantle.
Furthermore, Silver et al. (1995) suggested that the subhorizontal fault plane of the deep 1994 Mw 8.3 Bolivia earthquake could represent the reactivation of a fault that formed at the oceanic outer rise through bending of the subducting lithosphere, as is also argued for intermediate-depth seismicity (Jiao et al., 2000; Chen et al., 2004; Kiser et al., 2011). Warren et al. (2015) associated many such deep earthquakes with similar subhorizontal fault planes or their conjugate fault planes. Faulting at the oceanic outer rise has also been identified as an effective mechanism to hydrate the deep crust and mantle of the lithosphere before subduction (Rüpke et al., 2006). Moreover, due to the hydrated outer-rise normal fault, the amount of the subducted water is assessed to be one order of magnitude higher than previous estimation (Garth and Rietbrock, 2014; Cai et al., 2018), making these subhorizontal fault planes and their conjugates prime candidates for dehydration reactions and related embrittlement-induced and earthquake rupture.
If indeed dehydration played a role in the deep Okhotsk earthquake, the entirety of the subducting Pacific lithosphere cannot be completely dry even at these great depths in the mantle transition zone.
Conclusion
The 2013 Mw 8.6 Sea of Okhotsk deep-focus earthquake is found to rupture at different speeds to the north and the south, respectively, of the epicenter. This rupture model is constrained by a multi-array and multi-frequency combined back-projection method as well as a global P-wave train inversion technique for discrete subevents. The earthquake asymmetrically ruptures bilaterally a subhorizontal curved fault (150 km long, 70 km wide) in three stages. In the first 13 s, the rupture extends northwestwards on the downdip portion of the fault for approximately 55 km at a velocity of approximately 4.3 km/s. Afterward, a subevent at approximately 44 km southwest of the epicenter may be triggered by the passage of S-waves from previous faulting in the northwest and rupture continues eastward at a speed of 4.6 km/s. At the last stage, the rupture propagates up dip in a southeastward direction at a velocity of approximately 2.7 km/s until it ends at approximately 85 km SSE of the epicenter. The high rupture speeds indicate high seismic radiation efficiencies during the earthquake. Moreover, sizes of the subevents in the three rupture segments are beyond those of the possible MOW (Figure 8), which are not distorted as focal mechanisms of the nearby deep-focus earthquakes are subject to the similar down-dip compressional stress regime and seismicity is distributed regularly in the subducting slab. Thus, these findings together with diverse evidence of water subducting as deep as the transition zone and below suggest dehydration as the mechanism of the deep-focus earthquake.
Key Points
• The 2013 Mw 8.3 Sea of Okhotsk deep-focus Earthquake bilaterally ruptured over 160 km in 30 s in three stages.
• The deep earthquake ruptured fast and its rupture area extends beyond the inferred metastable olivine wedge.
• The deep earthquake’s rupture mechanism is consistent with it being the result of dehydration of deeply subducted oceanic lithosphere.
Data Availability Statement
The datasets generated for this study are available on request to the corresponding author.
Author Contributions
All authors listed have made a substantial, direct, and intellectual contribution to the work and approved it for publication.
Conflict of Interest
The authors declare that the research was conducted in the absence of any commercial or financial relationships that could be construed as a potential conflict of interest.
Publisher’s Note
All claims expressed in this article are solely those of the authors and do not necessarily represent those of their affiliated organizations, or those of the publisher, the editors and the reviewers. Any product that may be evaluated in this article, or claim that may be made by its manufacturer, is not guaranteed or endorsed by the publisher.
Acknowledgments
We thank Trevor Bollmann, Michael Witek, and Emily Wolin for polishing this manuscript as well as Harry Green II, Emile A. Okal, Anthony Sladen, Zhongwen Zhan, and Heidi Houston for constructive comments and helpful discussion. We also thank Wessel and Smith (1995), as all the figures in this manuscript were plotted using their Generic Mapping Tools (GMT). Waveform data at the European (doi:10.14470/TR560404), USArray Transportable Array Seismic Networks (https://doi.org/10.7914/SN/TA), and the Global Seismic Network (https://doi.org/10.7914/SN/IU) were downloaded from the IRIS-DMC (http://ds.iris.edu). Ge Z. is supported by National key research and development program (Grant No. 2018YFC1504203) and the National Science Foundation of China (Grant No. 41774047).
Supplementary Material
The Supplementary Material for this article can be found online at: https://www.frontiersin.org/articles/10.3389/feart.2021.521220/full#supplementary-material
References
Aki, K. (1966). Generation and Propagation of G Waves from the Niigata Earthquake of June 14, 1964. Part 2. Estimation of Earthquake Moment, Released Energy and Stress-Strain Drop from G Wave Spectrum. Bull. Earthq. Res. Inst. 44, 73–88.
Aki, K., and Richards, P. G. (2002). Quantitative Seismology, 2nd Edition, New York: University Science Books.
Barcheck, C. G., Wiens, D. A., Hacker, P. E., and van Keken, B. R. (2012). The Relationship of Intermediate- and Deep-Focus Seismicity to the Hydration and Dehydration of Subducting Slabs. Earth Planet. Sci. Lett. 349-350, 153–160. doi:10.1016/j.epsl.2012.06.055
Bina, C. R. (1998). A Note on Latent Heat Release from Disequilibrium Phase Transformations and Deep Seismogenesis. Earth Planet. Sp 50, 1029–1034. doi:10.1186/bf03352197
Cai, C., Wiens, D. A., Shen, W., and Eimer, M. (2018). Water Input into the Mariana Subduction Zone Estimated from Ocean-Bottom Seismic Data. Nature 563, 389–392. doi:10.1038/s41586-018-0655-4
Chen, P.-F., Bina, C. R., and Okal, E. A. (2004). A Global Survey of Stress Orientations in Subducting Slabs as Revealed by Intermediate-Depth Earthquakes. Geophys. J. Int. 159 (2), 721–733. doi:10.1111/j.1365-246x.2004.02450.x
Chen, Y., Wen, L., and Ji, C. (2014). A Cascading Failure during the 24 May 2013 Great Okhotsk Deep Earthquake. J. Geophys. Res. Solid Earth 119, 3035–3049. doi:10.1002/2013jb010926
Dera, P., Finkelstein, G. J., Duffy, T. S., Downs, R. T., Meng, Y., Prakapenka, V., et al. (2013). Metastable High-Pressure Transformations of Orthoferrosilite Fs82. Phys. Earth Planet. Interiors 221, 15–21. doi:10.1016/j.pepi.2013.06.006
Eshelby, J. D. (1957). The Determination of the Elastic Field of an Ellipsoidal Inclusion, and Related Problems. Proc. R. Soc. Lond. A. 241, 376–396. doi:10.1098/rspa.1957.0133
Fan, W., and Shearer, P. M. (2015). Detailed Rupture Imaging of the 25 April 2015 Nepal Earthquake Using Teleseismic P Waves. Geophys. Res. Lett. 42 (14), 5744–5752. doi:10.1002/2015GL064587
Ferrand, T. P., Hilairet, N., Incel, S., Deldicque, D., Labrousse, L., Gasc, J., et al. (2017). Dehydration-driven Stress Transfer Triggers Intermediate-Depth Earthquakes. Nat. Commun., 8(15247), 1–11. doi:10.1038/ncomms15247
Fukao, Y., and Obayashi, M. (2013). Subducted Slabs Stagnant above, Penetrating through, and Trapped below the 660 Km Discontinuity. J. Geophys. Res. Solid Earth 118 (11), 5920–5938. doi:10.1002/2013jb010466
Garth, T., and Rietbrock, A. (2014). Order of Magnitude Increase in Subducted H2O Due to Hydrated normal Faults within the Wadati-Benioff Zone. Geology 42 (3), 207–210. doi:10.1130/g34730.1
Green, H. W., and Burnley, P. C. (1989). A New Self-Organizing Mechanism for Deep-Focus Earthquakes. Nature 341, 733–737. doi:10.1038/341733a0
Green, H. W., and Houston, H. (1995). The Mechanics of Deep Earthquakes. Ann. Rev. Earth Planet. Sci. 23, 169–214. doi:10.1146/annurev.ea.23.050195.001125
Green, H. W. (2017). Phase-transformation-induced Lubrication of Earthquake Sliding. Phil. Trans. R. Soc. A. 375, 20160008. doi:10.1098/rsta.2016.0008
Green, H. W., Shi, F., Bozhilov, K., Xia, G., and Reches, Z. (2015). Phase Transformation and Nanometric Flow Cause Extreme Weakening during Fault Slip. Nat. Geosci. 8, 484–498. doi:10.1038/ngeo2436
Hacker, B. R., Peacock, S. M., Abers, G. A., and Holloway, S. D. (2003). Subduction Factory 2. Are Intermediate‐depth Earthquakes in Subducting Slabs Linked to Metamorphic Dehydration Reactions? J. Geophys. Res. Solid Earth 108 (B1). doi:10.1029/2001jb001129
Hayes, G. P., Wald, D. J., and Johnson, R. L. (2012). Slab1.0: A Three-Dimensional Model of Global Subduction Zone Geometries. J. Geophys. Res. 117, B01302. doi:10.1029/2011jb008524
Hobbs, B. E., and Ord, A. (1988). Plastic Instabilities: Implications for the Origin of Intermediate and Deep Focus Earthquakes. J. Geophys. Res. 93 (B9), 10521–11054. doi:10.1029/jb093ib09p10521
Houston, H. (2015). Deep Earthquakes, in Treatise on Geophysics 2nd Ed., editor-in-chief G. Schubert, Oxford, Elsevier, 4, 329–354. doi:10.1016/b978-0-444-53802-4.00079-8
Houston, H., and Williams, Q. (1991). Fast Rise Times and the Physical Mechanism of Deep Earthquakes. Nature 352, 520–522. doi:10.1038/352520a0
Ishii, M., Shearer, P. M., Houston, H., and Vidale, J. E. (2005). Extent, Duration and Speed of the 2004 Sumatra-Andaman Earthquake Imaged by the Hi-Net Array. Nature 435, 933–936. doi:10.1038/nature03675
Jacobsen, S. D., and Van der Lee, S. (2006). Earth’s Deep Water Cycle. Geophys. Monogr. Ser. 168. doi:10.1029/GM168
Jiao, W., Silver, P. G., Fei, Y., and Prewitt, C. T. (2000). Do intermediate- and Deep-Focus Earthquakes Occur on Pre-existing Weak Zones? an Examination of the Tonga Subduction Zone. J. Geophys. Res. 105, 28125–28138. doi:10.1029/2000jb900314
Jung, H., Green, H. W., and Dobrzhinetskaya, L. F. (2004). Intermediate-depth Earthquake Faulting by Dehydration Embrittlement with Negative Volume Change. Nature 428 (6982), 545–549. doi:10.1038/nature02412
Kanamori, H., Anderson, D. L., and Heaton, T. H. (1998). Frictional Melting during the Rupture of the 1994 Bolivian Earthquake. Science 279, 839–842. doi:10.1126/science.279.5352.839
Kennett, B. L. N., Engdahl, E. R., and Buland, R. (1995). Constraints on Seismic Velocities in the Earth from Traveltimes. Geophys. J. Int. 122 (1), 108–124. doi:10.1111/j.1365-246x.1995.tb03540.x
Kikuchi, M., and Kanamori, H. (1991). Inversion of Complex Body Waves--III. Bull. Seism. Soc. Am. 81 (6), 2335–2350.
Kirby, S. H., Durham, W. B., and Laura, A. S. (1991). Mantle Phase Changes and Deep-Earthquake. Science 252, 216–225. doi:10.1126/science.252.5003.216
Kirby, S. H., Stein, S., Okal, E. A., and Rubie, D. C. (1996). Metastable Mantle Phase Transformations and Deep Earthquakes in Subducting Oceanic Lithosphere. Rev. Geophys. 34, 261–306. doi:10.1029/96rg01050
Kiser, E., and Ishii, M. (2012). Combining Seismic Arrays to Image the High-Frequency Characteristics of Large Earthquakes. Geophys. J. Int. 188 (3), 1117–1128. doi:10.1111/j.1365-246x.2011.05299.x
Kiser, E., Ishii, M., Langmuir, C. H., Shearer, P. M., and Hirose, H. (2011). Insights into the Mechanism of Intermediate-Depth Earthquakes from Source Properties as Imaged by Back Projection of Multiple Seismic Phases. J. Geophys. Res. Solid Earth 116 (B6). doi:10.1029/2010jb007831
Komabayashi, T. (2006). Phase Relations of Hydrous Peridotite: Implications for Water Circulation in the Earth's Mantle. Earth's Deep Water Cycle, 29–43.
Koper, K. D., Hutko, A. R., Lay, T., Ammon, C. J., and Kanamori, H. (2011). Frequency-dependent Rupture Process of the 2011 M(w) 9.0 Tohoku Earthquake: Comparison of Short-Period P Wave Backprojection Images and Broadband Seismic Rupture Models. Earth Planets Space 63 (7), 599–602. doi:10.5047/eps.2011.05.026
Lay, T., Kanamori, H., Ammon, C. J., Koper, K. D., Hutko, A. R., Ye, L., et al. (2012). Depth-varying Rupture Properties of Subduction Zone Megathrust Faults. J. Geophys. Res. 117 (B4). doi:10.1029/2011jb009133
Marone, C., and Liu, M. (1997). Transformation Shear Instability and the Seismogenic Zone for Deep Earthquakes. Geophys. Res. Lett. 24 (15), 1887–1890. doi:10.1029/97GL01851
Meng, L., Ampuero, J.-P., and Burgmann, R. (2014). The 2013 Okhotsk Deep-Focus Earthquake: Rupture beyond the Metastable Olivine Wedge and Thermally Controlled Rise Time Near the Edge of a Slab. Geophys. Res. Lett. 41 (1), 3779–3785. doi:10.1002/2014gl059968
Nishi, M., Kubo, T., Ohfuji, H., Kato, T., Nishihara, Y., and Irifune, T. (2013). Slow Si-Al Interdiffusion in Garnet and Stagnation of Subducting Slabs. Earth Planet. Sci. Lett. 361, 44–49. doi:10.1016/j.epsl.2012.11.022
Ogawa, M. (1987). Shear Instability in a Viscoelastic Material as the Cause of Deep Focus Earthquakes. J. Geophys. Res. 92, 13801–13810. doi:10.1029/jb092ib13p13801
Okal, E. A., Kirby, S. H., and Kalligeris, N. (2016). The Showa Sanriku Earthquake of 1933 March 2: a Global Seismological Reassessment. Geophys. J. Inter. 206, 1492–1514. doi:10.1093/gji/ggw206
Omori, S., Komabayashi, T., and Maruyama, S. (2004). Dehydration and Earthquakes in the Subducting Slab: Empirical Link in Intermediate and Deep Seismic Zones. Phys. Earth Planet. Inter. 146 (1), 297–311. doi:10.1016/j.pepi.2003.08.014
Omori, S., and Komabayashi, T. (2007). “Subduction Zone: The Water Channel to the Mantle,” in Superplumes: Beyond Plate Tectonics. Editors D. A. Yuen, S. Maruyama, S. I. Karato, and B. F. Windley (Dordrecht: Springer), 113–138. doi:10.1007/978-1-4020-5750-2_5
Peacock, S. M. (2001). Are the Lower Planes of Double Seismic Zones Caused by Serpentine Dehydration in Subducting Oceanic Mantle? Geology 29 (4), 299–302. doi:10.1130/0091-7613(2001)029<0299:atlpod>2.0.co;2
Pearson, D. G., Brenker, F. E., Nestola, F., McNeill, J., Nasdala, L., Hutchison, M. T., et al. (2014). Hydrous Mantle Transition Zone Indicated by Ringwoodite Included within diamond. Nature 507 (7491), 221–224. doi:10.1038/nature13080
Prieto, G. A., Florez, M., Barrett, S. A., Beroza, G. C., Pedraza, P., Blanco, J. F., et al. (2013). Seismic Evidence for thermal Runaway during Intermediate‐depth Earthquake Rupture. Geophy. Res. Lett. 40, 6064–6068. doi:10.1002/2013GL058109
Ringwood, A. E. (1991). Phase Transformations and Their Bearing on the Constitution and Dynamics of the Mantle. Geochim. Cosmochim. Act 55, 2083–2110. doi:10.1016/0016-7037(91)90090-r
Ruiz, S., Tavera, H., Poli, P., Herrera, C., Flores, C., Rivera, E., et al. (2017). The Deep Peru 2015 Doublet Earthquakes. Earth Planet. Sci. Lett. 478, 102–109. doi:10.1016/j.epsl.2017.08.036
Rüpke, L., Morgan, J. P., and Dixon, J. E. (2006). Implications of Subduction Rehydration for Earth's Deep Water Cycle. Earth's Deep Water Cycle 168, 263–276. doi:10.1029/168gm20
Shirey, S. B., Wagner, L. S., Walter, M. J., Van Keken, P. E., and Pearson, G. (2019). Deep Focus Earthquakes, Deep Slab Fluids, and Superdeep Diamonds, 100. Washington, DC: Eos, Transactions of the American Geophysical Union. Fall Meeting supplement.
Silver, P. G., Beck, S. L., Wallace, T. C., Meade, C., Myers, S. C., James, D. E., et al. (1995). Rupture Characteristics of the Deep Bolivian Earthquake of 9 June 1994 and the Mechanism of Deep-Focus Earthquakes. Science 268, 69–73. doi:10.1126/science.268.5207.69
Smyth, J. R. (1994). A Crystallographic Model for Hydrous Wadsleyite (β-Mg2 SiO4): Ad Ocean in the Earth's interior? Am. Mineral. 79, 1021–1024.
Smyth, J. R., and Jacobsen, S. D. (2006). Nominally Anhydrous Minerals and Earth's Deep Water Cycle. Earth's Deep Water Cycle, 1–11. doi:10.1029/168gm02
Stein, S. (1995). Deep Earthquakes: a Fault Too Big? Science 268, 49–50. doi:10.1126/science.268.5207.49
Tibi, R., Bock, G., and Wiens, D. A. (2003). Source Characteristics of Large Deep Earthquakes: Constraint on the Faulting Mechanism at Great Depths. J. Geophys. Res. 108 (B2). doi:10.1029/2002jb001948
Van der Lee, S., Regenauer-Lieb, K., and Yuen, D. A. (2008). The Role of Water in Connecting Past and Future Episodes of Subduction. Earth Planet. Sci. Lett. 273 (1), 15–27. doi:10.1016/j.epsl.2008.04.041
Van Mierlo, W. L., Langenhorst, F., Frost, D. J., and Rubie, D. C. (2013). Stagnation of Subducting Slabs in the Transition Zone Due to Slow Diffusion in Majoritic Garnet. Nat. Geosci. 6 (5), 400–403. doi:10.1038/ngeo1772
Venkataraman, A., and Kanamori, H. (2004). Observational Constraints on the Fracture Energy of Subduction Zone Earthquakes. J. Geophy. Res. 109, B05302. doi:10.1029/2003JB002549
Wang, D., and Mori, J. (2011). Frequency-dependent Energy Radiation and Fault Coupling for the 2010 Mw 8.8 Maule, Chile, and 2011 Mw 9.0 Tohoku, Japan, Earthquakes. Geophys. Res. Lett. 38 (22), L22308. doi:10.1029/2011gl049652
Wang, F., Barklage, M., Lou, X., van der Lee, S., Bina, C. R., and Jacobsen, S. D. (2018). HyMaTZ: A Python Program for Modeling Seismic Velocities in Hydrous Regions of the Mantle Transition Zone. Geochem. Geophys. Geosystems 19, 2308–2324. doi:10.1029/2018gc007464
Wang, R. (1999). A Simple Orthonormalization Method for Stable and Efficient Computation of Green’s Functions. Bull. Seismol. Soc. Am. 89 (3), 733–741.
Warren, L. M., Baluyut, E. C., Osburg, T., Lisac, K., and Kokkinen, S. (2015). Fault Plane Orientations of Intermediate‐depth and Deep‐focus Earthquakes in the Japan‐Kuril‐Kamchatka Subduction Zone. J. Geophys.l Res. Solid Earth 120 (12), 8366–8382. doi:10.1002/2015jb012463
Wei, S., Helmberger, D., Zhan, Z., and Graves, R. (2013). Rupture Complexity of the Mw 8.3 Sea of Okhotsk Earthquake: Rapid Triggering of Complementary Earthquakes? Geophys. Res. Lett. 40 (19), 5034–5039. doi:10.1002/grl.50977
Wessel, P., and Smith, W. H. F. (1995). New Version of Generic Mapping Tools Released. EOS Trans. AGU 76, 329. doi:10.1029/95eo00198
Wiens, D. A. (2001). Seismological Constraints on the Mechanism of Deep Earthquakes: Temperature Dependence of Deep Earthquake Source Properties, Phy. Earth Planet. Inter. 127 (1), 145–163. doi:10.1016/s0031-9201(01)00225-4
Xu, Y., Koper, K. D., Sufri, O., Zhu, L., and Hutko, A. R. (2009). Rupture Imaging of the Mw 7.9 12 May 2008 Wenchuan Earthquake from Back Projection of Teleseismic P Waves. Geochem. Geophys. Geosyst. 10 (4), Q04006. doi:10.1029/2008gc002335
Yao, H., Shearer, P. M., and Gerstoft, P. (2013). Compressive Sensing of Frequency-dependent Seismic Radiation from Subduction Zone Megathrust Ruptures. Proc. Natl. Acad. Sci. U.S.A 110 (12), 4512–4517. doi:10.1073/pnas.1212790110
Ye, L., Lay, T., Kanamori, H., and Koper, K. D. (2013). Energy Release of the 2013 Mw 8.3 Sea of Okhotsk Earthquake and Deep Slab Stress Heterogeneity. Science 341, 1380–1384. doi:10.1126/science.1242032
Zahradník, J., Čížková, H., Bina, C. R., Sokos, E., Janský, J., Tavera, H., et al. (2017). A Recent Deep Earthquake Doublet in Light of Long-Term Evolution of Nazca Subduction. Scientific Rep. 7, 45153. doi:10.1038/srep45153
Zhan, Z., Kanamori, H., Tsai, V. C., Helmberger, D. V., and Wei, S. (2014). Rupture Complexity of the 1994 Bolivia and 2013 Sea of Okhotsk Deep Earthquakes. Earth Planet. Sci. Lett. 385, 89–96. doi:10.1016/j.epsl.2013.10.028
Zhang, H., and Brudzinski, M. (2019). Evidence for Rupture through a Double Benioff Zone during the 2017 Mw 8.2 Chiapas, Mexico Earthquake. Geophys. Res. Lett. 46 (2), 652–660. doi:10.1029/2018gl080009
Zhang, H., Chen, J., and Ge, Z. (2012). Multi-fault Rupture and Successive Triggering during the 2012 Mw 8.6 Sumatra Offshore Earthquake. Geophys. Res. Lett. 39 (22). doi:10.1029/2012gl053805
Zhang, H., Ge, Z., and Ding, L. (2011). Three Sub-events Composing the 2011 off the Pacific Coast of Tohoku Earthquake (Mw 9.0) Inferred from Rupture Imaging by Back-Projecting Teleseismic P Waves. Earth, planets and space 63 (7), 595–598. doi:10.5047/eps.2011.06.021
Zhang, H., and Ge, Z. (2017). Stepover Rupture of the 2014 Mw7.0 Yutian, Xinjiang Earthquake. Bull. Seismol. Soc. Am. 107 (2), 581–591. doi:10.1785/0120160099
Zhang, H., and Ge, Z. (2010). Tracking the Rupture of the 2008 Wenchuan Earthquake by Using the Relative Back-Projection Method. Bull. Seism. Soc. Am. 100 (5B), 2551–2560. doi:10.1785/0120090243
Zhang, H., Koper, K. D., Pankow, K., and Ge, Z. (2017). Imaging the 2016 Mw 7.8 Kaikoura, New Zealand, Earthquake with Teleseismic P Waves: A Cascading Rupture across Multiple Faults. Geophys. Res. Lett. 44, 4790–4798. doi:10.1002/2017gl073461
Zhang, H., van der Lee, S., and Ge, Z. (2016). Multiarray Rupture Imaging of the Devastating 2015 Gorkha, Nepal Earthquake Sequence. Geophys. Res. Lett. 43. doi:10.1002/2015GL066657
Keywords: deep dehydration, multi-array, multiband back projection, multi-subevent model, rupture velocity, P wave, 2013 okhotsk deep-focus earthquake
Citation: Zhang H, van der Lee S, Bina CR and Ge Z (2021) Deep Dehydration as a Plausible Mechanism of the 2013 Mw 8.3 Sea of Okhotsk Deep-Focus Earthquake. Front. Earth Sci. 9:521220. doi: 10.3389/feart.2021.521220
Received: 18 December 2019; Accepted: 29 June 2021;
Published: 04 August 2021.
Edited by:
Sebastiano D’Amico, University of Malta, MaltaReviewed by:
Piero Poli, Université Grenoble Alpes, FranceDaniela Farrugia, University of Malta, Malta
Copyright © 2021 Zhang, van der Lee, Bina and Ge. This is an open-access article distributed under the terms of the Creative Commons Attribution License (CC BY). The use, distribution or reproduction in other forums is permitted, provided the original author(s) and the copyright owner(s) are credited and that the original publication in this journal is cited, in accordance with accepted academic practice. No use, distribution or reproduction is permitted which does not comply with these terms.
*Correspondence: Hao Zhang, zhang@seis.utah.edu