


Introduction
The impacts of recent climate-related extreme events, such as heat waves, droughts, wildfires and floods caused by heavy rains, reveal significant vulnerability for certain ecosystems. Intensive agriculture, being a sensitive ecosystem and highly specialized, is severely threatened by climate change and variability (Wheeler and Reynolds, Reference Wheeler and Reynolds2013). Although intensive agriculture may be adapted to certain seasonal weather fluctuations, recent abrupt changes in average weather conditions including summer droughts and erratic distribution of precipitation have resulted in a range of management problems, with farm-scale implications for animal welfare, manure storage and application, forage production, among others. As supported by the red list of the International Union for Conservation of Nature and Natural Resources (IUCN, 2012), Thuiller et al. (Reference Thuiller, Lavorel, Araujo, Sykes and Prentice2005) stated that many European plant species may be threatened by future climate change, as most plant species are not able to shift their geographical ranges sufficiently fast as weather changes. With a lack of migration, it is assumed that more than half of the species become vulnerable, or face extinction, by the year 2080. In the light of impending climate change, forage plants need to optimize the utilization of resources, like nutrients and water. Therefore, grassland research must consider impacts like changes in botanical composition of plant communities, morphological and phenological differentiation of single forage species and hence consequences for the nutritive value of harvested above-ground biomass for feeding purposes. However, besides variations in the plant community, less is known about the alteration in individual species growing within permanent pastures. Species like orchard grass (cocksfoot; Dactylis glomerata L.) are more tolerant to water scarcity than Lolium species (Humphreys et al., Reference Humphreys, Yadav, Cairns, Turner, Humphreys and Skot2006). Therefore, orchard grass serves as reference C3 plant in the present study of how climate change will affect the nutritive value of herbage in permanent grassland for more drought-tolerant forage species.
Discussion of changes in plant communities or of single species due to future climate scenarios should include changes in nutritive value for the efficient use of nutrients and energy by livestock. Information on the nutritive value of single forage plant species in response to climate variation is necessary to understand the effects of climate change, and thereby allow this information to be used to develop adaptation strategies in grassland management, animal feeding and plant breeding. One important measurement that characterizes the nutritive value of forages is the protein content. To specify the protein quality of forages for the purpose of ruminant feeding, the crude protein (CP) content is divided into fractions, each detectable via analyses or calculation, and differing in protein structure, location in the plant cell and ruminal degradability (Licitra et al., Reference Licitra, Hernandez and Van Soest1996). All this information can be used to estimate the utilizable crude protein at the duodenum (uCP). The uCP is defined as the estimation of microbial protein synthesis in the rumen plus the content of undegradable dietary protein, serving as sources of amino acids for the host (GfE, 2001).
Since crude protein in forage is not built up homogeneously, the value of crude protein can vary among plant species, harvesting time and development stage. In addition, in most forage plants, a large proportion of the N is present as non-protein N (NPN) at harvest (Gierus et al., Reference Gierus, Kleen, Loges and Taube2012; Krawutschke et al., Reference Krawutschke, Kleen, Weiher, Loges, Taube and Gierus2013a). After harvesting, NPN is extensively generated by plant-related proteases (Gierus et al., Reference Gierus, Loesche, Salama, Herrmann and Taube2016) or during the fermentation phase of forage conservation (Krawutschke et al., Reference Krawutschke, Weiher, Thaysen, Loges, Taube and Gierus2013b). After ingestion, high amounts of NPN are counteracted by rapidly fermentable sugars, like water-soluble carbohydrates (WSC), as available energy, resulting in efficient ruminal microbial growth and N utilization (Miller et al., Reference Miller, Neville, Baker, Evans, Theodorou and MacRae1999), contributing to uCP. An asynchrony between degradation of carbohydrates and N in the rumen in forage-based diets leads to energy limitation and accordingly inefficient ruminal N conversion. The challenge is to optimize N conversion into animal products, further reducing N excretion and thus environmental pollution.
Although the WSC are inherently variable in forage plants due to weather fluctuations (Humphreys, Reference Humphreys1989; Cairns, Reference Cairns2003), the influence of weather on NPN content in forage plants is less well understood. Whereas the NPN is representative of low protein quality for animal nutritionists, in plants, NPN is a group of N-containing substances like non-amino acid bases, basic amino acids, aminobutyric acid and nitrate (Van Soest, Reference Van Soest1994), representing the N fraction rapidly translocated in plants. Therefore, using NPN is also of interest, as both plant and animal nutritionists may use NPN to describe metabolic pathways in plants and in animal digestion, respectively.
The main objective of this study was to investigate the impact of increased temperature and enhanced atmospheric CO2 concentration on functional traits and on the nutritive value of orchard grass under a 3-cut system. It is hypothesized that functional traits and forage quality of orchard grass are altered by the combination of increased temperature and enhanced CO2 concentration in comparison with ambient conditions. Predicting the response of forage crops to increased temperature and enhanced CO2 concentration will help to achieve the highest nutritive value in terms of synchronized WSC and NPN contents in harvested forage. More important, the results will help farmers, plant breeders and livestock production to meet the challenges of climate change and ensure productivity.
Material and methods
The study took place within the framework of the worldwide unique ClimGrass-project at AREC Raumberg-Gumpenstein in Styria, Austria (Pötsch et al., Reference Pötsch, Herndl, Bahn, Schaumberger, Schweiger, Kandolf, Reinthaler, Schink and Adelwöhrer2019a; climgrass.at/experimental-site.html). The ClimGrass-experiment was put into full operation in 2014 after several years of intensive preparation. The experimental site (47°29′38″N, 14°06′3″E) represents typical vegetation of permanent mountainous grassland (Pötsch et al., Reference Pötsch, Herndl, Bahn, Schaumberger, Schweiger, Kandolf, Reinthaler, Schink and Adelwöhrer2019a). It was divided into 54 plots of 16 m2 (4 × 4 m) each, of which six plots were used in this study. The soil is classified as a cambisol with loam texture (WRB, 2015). It contains 44.2% sand, 47.6% silt and 8.3% clay and has a C:N ratio of 12.6:1. Deltedesco et al. (Reference Deltedesco, Keiblinger, Naynar, Piepho, Gorfer, Herndl, Bahn, Pötsch and Zechmeister-Boltenstern2019) provide a detailed description of the special equipment that simulates future climate conditions. This comprises six infrared heaters for increasing air temperature, and a central fumigation ring for enhancing CO2 on each plot (see also Supplemental Material). The untreated ambient plots (C0T0) were also equipped with infrared heaters and a central fumigation ring to equalize a possible influence of these facilities on all plots. Temperature and CO2 concentration were measured in the centre of the reference plots (C0T0) in very high temporal resolution, thus providing the basis of warming and fumigation for the future climate treatments (C2T2). Therefore, in C2T2, temperature was 3°C higher all year round (except when snow cover in winter exceeded a depth of 10 cm) and the CO2 concentration was 300 ppm higher during the vegetation period (April to November), when solar radiation energy was above 50 W/m2. There were no alterations of precipitation considered in this study, and all plots were exposed equally to the naturally occurring precipitation. However, further studies in the ClimGrass-project also dealt with the effects of simulated drought on growth (Küsters et al., Reference Küsters, Pötsch, Resch and Gierus2021), as well as on soil chemical and soil ecological processes (Seneca et al., Reference Seneca, Pjevac, Canarini, Herbold, Zioutis, Dietrich, Simon, Prommer, Bahn, Pötsch, Wanek and Richter2020; Meeran et al., Reference Meeran, Ingrisch, Reinthaler, Canarini, Müller, Pötsch, Richter, Wanek and Bahn2021).
Apart from the different climatic treatments, all plots were subject to identical management in terms of fertilization (90 kg N, 65 kg P2O5 and 170 kg K2O/ha/year) and utilization frequency (three cuts per year). Nitrogen was applied as calcium ammonium nitrate, phosphorus as superphosphate and potassium as potassium chloride in several partial applications.
During the experimental years, the global annual mean value of CO2 was 403 ppm (2016), 405 ppm (2017) and 407 ppm (2018), respectively (Dlugokencky and Tans, Reference Dlugokencky and Tans2020). According to the Köppen-Geiger system (Beck et al., Reference Beck, Zimmermann, McVicar, Vergopolan, Berg and Wood2018), the climate at the experimental site is currently classified as Dfb (continental, no dry season, warm summer). The long-term (1981–2010) mean annual air temperature at the experimental site was 8.2°C and the mean annual rainfall was 1056 mm. The temperature and precipitation pattern during the experimental period is illustrated in Fig. S1 in the Supplementary Material (based on data from the Central Institute for Meteorology and Geodynamics (ZAMG), processed and visualized by Pötsch et al. (Reference Pötsch, Herndl, Schaumberger, Schweiger, Resch and Adelwöhrer2019b) according to Walter and Lieth (Reference Walter and Lieth1967)).
The entire experimental field was sown with a grassland seed mixture in 2007. This mixture contained tall oat-grass (Arrhenatherum elatius L.), Kentucky bluegrass (Poa pratensis L.), meadow fescue (Festuca pratensis L.), orchard grass (Dactylis glomerata L., Austrian cultivar ‘Tandem’), meadow foxtail (Alopecurus pratensis L.), red fescue (Festuca rubra L.), perennial ryegrass (Lolium perenne L.), timothy (Phleum pratense L.), golden oat grass (Trisetum flavescens L.), white clover (Trifolium repens L.) and birdsfoot trefoil (Lotus corniculatus L.) and was sown in a seed density of 27 kg/ha. Orchard grass, a widespread and relatively drought-tolerant grass species in mountainous grasslands, was selected as the C3 reference plant for the studies.
The sampling of orchard grass was carried out in three consecutive years (2016–2018). The sampling took place three times a year, following the 3-cut management system in the ClimGrass experiment. The sampling dates were end of May, end of July and end of September. These are times at which mowing is usually done in this region under ambient climate conditions, and this allows regrowth of the tillers within 2 months between first and second cut, and second and third cut, respectively.
The sampling of orchard grass was done directly before harvesting the total biomass in each plot and was carried out in two steps: (a) sampling of 30 randomly picked tillers from each plot cut immediately above ground surface, and (b) sampling of 400 g randomly picked tillers from each plot cut at 5 cm above ground surface.
All 180 tillers (6 plots × 30 tillers) per sampling date were processed separately right after harvesting. The assessments included the identification of the stage of development and measurements of height in cm, weight in g of fresh sample, leaf weight ratio (LWR, weight of the leaves as proportion of the total tiller weight in g of fresh sample) in % and the weight ratio of necrotic leaves (NLWR, weight of the necrotic leaves as proportion of the total tiller weight in g of fresh sample) in %. The mean stage by count (MSC) and the mean stage by weight (MSW) were calculated plot-wise according to Salama et al. (Reference Salama, Loesche, Herrmann, Taube and Gierus2017), as follows:

where Si is the stage category, N is the number of tillers in Si, C is the total number of tillers, W is the weight of tillers in Si and Wt is the total weight of tillers.
The 6 × 400 g of each sampling was pre-dried at 50°C for 48 h, ground through a 1 mm sieve, and a sample aliquot was end-dried at 105°C (determination of residual water). The pre-dried samples were then analysed according to the proximal analysis methods (Naumann and Bassler, Reference Naumann and Bassler2012). All pertinent results are expressed based on the end-dried samples at 105°C. Additionally, the protein fractionation, the carbohydrate fractionation, as well as the in vitro digestibility (DOM) were analysed and the metabolizable energy (ME), uCP and the ruminal N balance (RNB) were estimated.
The crude protein fractionation consists of fractions A, B and C. Whereas fraction A represents the NPN, fraction B is the true protein potentially degradable in the rumen and fraction C is the insoluble and indigestible protein, termed acid detergent-insoluble protein (ADIP). Furthermore, fraction B is divided into B1, B2 and B3. Fraction B1 is buffer soluble protein (BSP) and B3 is neutral detergent-insoluble protein (NDIP). Fraction B2 is buffer insoluble protein (BIP) and was calculated by subtraction of crude protein of the sample with fraction A, B1, B3 and C (B2 = CP − (A + B1 + B3 + C)). The analyses of crude protein fractionation occurred according to the procedure suggested by Licitra et al. (Reference Licitra, Hernandez and Van Soest1996), whereas N was detected by a rapid combustion using DuMaster D-480 device (Büchi, Switzerland).
The carbohydrates are also divided into fractions: WSC, starch, NDForg and ADForg. WSC is composed of glucose, fructose and sucrose. To analyse WSC, part of the fresh sample was lyophilized at −40°C for 48 h, decomposed with a Sucrose/D-Fructose/D-Glucose assay kit (Megazyme, Ireland) and then photometrically detected. As starch was not expected, samples were randomly analysed polarimetrically (according to Naumann and Bassler, Reference Naumann and Bassler2012) and photometrically by determination of glucose with the assay kit from Megazyme before and after addition of α-amylase and calculating the starch content by difference of glucose. Both NDForg and ADForg were analysed with a Fibre Analyser (Ankom Technology, USA) and according to the procedure of Van Soest (Reference Van Soest1963). Furthermore, the DOM and the ME content were determined according to the pepsin cellulase method of De Boever et al. (Reference De Boever, Cottyn, Buysse, Wainman and Vanacker1986), where the enzymatically soluble organic matter (ESOM) is measured. The DOM is calculated as follows:
where CA is crude ash and EISOM is the enzymatically insoluble organic matter according to Weißbach et al. (Reference Weißbach, Kuhla, Schmidt and Henkels1999), with

To estimate the ME content (GfE, 2008) the equation applies:

where CA is crude ash, ESOM is enzymatically soluble organic matter, CL is crude fat and ADForg is ash-free ADF content. All variables are expressed as g/kg DM.
The content of uCP and the RNB were calculated as follows (GfE, 2001):


where ME is energy in MJ/kg DM, CP is crude protein and UDP is rumen undegradable dietary protein, both expressed in g/kg DM. The UDP in g/kg is calculated by

with UDP assumed to be 15% in grass.
Data about the biomass yield are reported in Pötsch et al. (Reference Pötsch, Herndl, Schaumberger, Schweiger, Resch and Adelwöhrer2019b).
The data were submitted to the analyses of variance using SAS (SAS Enterprise Guide 6.1), where a mixed linear model was used. Treatment (T), cut (C), year (A) and plot (P) are fixed effects. Plots served as repetition and values were statistically averaged. This means that each value shown per growth/cut represents an average of three plots and 3 years.

where Yijkl is the characteristic value (measurements and nutrients) under the influence of i, j, k and l, μ is the common constant of Y-values, Ti is the effect of treatment with i = 1, 2, Cj is the effect of cut with j = 1, 2, 3, Ak is the effect of year with k = 1, 2, 3, Pl is the effect of plot with l = 1, 2, 3, T × C is the interaction between treatment and cut and ɛijkl is the random error of Xijkl.
The MSC and the MSW are non-parametric variables and were therefore evaluated with a Wilcoxon signed-rank test. Furthermore, a correlation analysis was conducted to determine correlations between ADIP and ADForg, NDIP and NDForg as well as between ME, DOM and WSC, NDForg and ADForg, respectively:
with ρ = correlation coefficient, σxy = correlation between x and y, σx = standard deviation of x, σy = standard deviation of y. The level of significance was P < 0.05.
Results
Development stage and plant functional traits
Both MSC and MSW showed similar mean stages of development between treatments (Table 1), without significant differences. In the first cut, tillers had a development stage of 10 using the MSC, indicating that half of the inflorescence was visible. Based on MSW, tillers had a development stage of 11 and 12 indicating that the base of the grass seed head was visible, and the top of the culm was visible, respectively. In the second and third cut, tillers reached an overall development stage of 4 (both MSC and MSW) which is indicative of three or more extended leaf sheaths. An exception was C2T2 in the third cut (MSC and MSW), which had a development stage of 5, indicating that the first culm knot was palpable (Salama et al., Reference Salama, Loesche, Herrmann, Taube and Gierus2017).
Table 1. Mean stage by count and mean stage by weight of orchard grass between C0T0 and C2T2 in cuts 1, 2 and 3
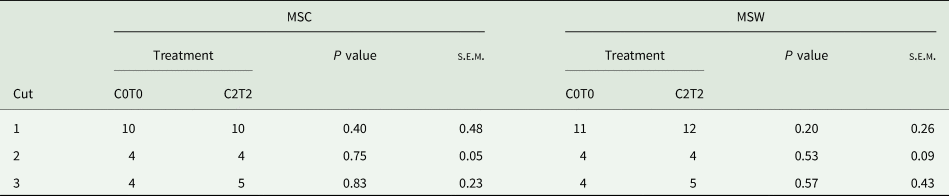
MSC, mean stage by count; MSW, mean stage by weight; C0T0, ambient climate condition; C2T2, simulated climate condition; s.e.m., standard error of means.
Values are average from the three replications and 3 years.
The results for LWR of the recorded plant functional traits are shown in Table 2 for main effects. There was a substantial effect of cut for LWR, whereas LWR did not show any differences between the treatments, just a trend was observed (P < 0.10). The NLWR showed an interaction treatment × cut. The difference was between treatments in the first cut, where C2T2 had higher amounts of necrotic leaves (10.1%) than C0T0 (5.1%) (Table 2).
Table 2. Leaf weight and necrotic leaf weight ratio, height and weight of tillers of orchard grass for C0T0 and C2T2 in cuts 1, 2 and 3
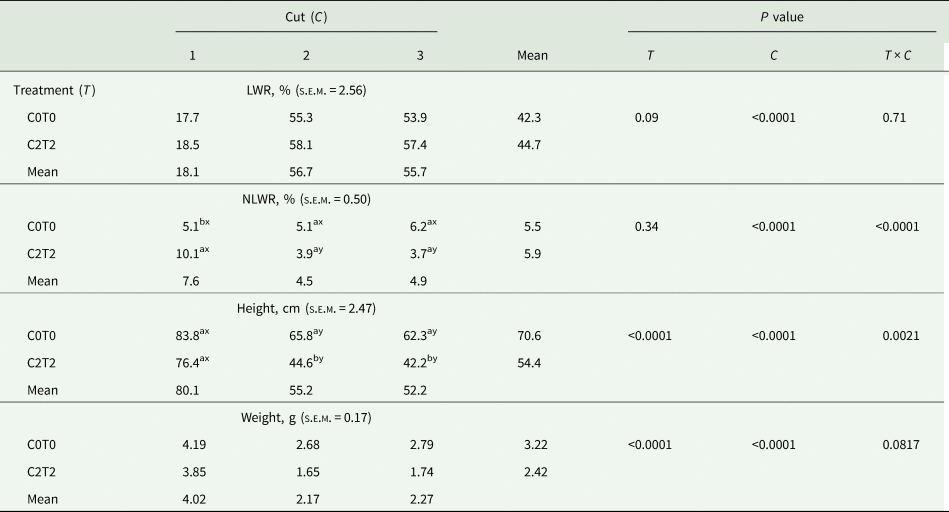
LWR, leaf weight ratio; NLWR, necrotic leaf weight ratio; DM, dry matter; FM, fresh matter; C0T0, ambient climate condition; C2T2, simulated climate condition; s.e.m., standard error of means.
abcValues with different superscripts differ between treatments.
xyzValues with different superscripts differ between cuts.
Values are averages from three replications and 3 years.
Plant height and plant weight showed an interaction of treatment × cut (Table 2). Treatments showed an influence on the height and weight of tillers in the second and third cut compared to the first cut. The tillers of C2T2 had a lower height (44.6 cm in the second and 42.2 cm in the third cut) compared to the tillers of C0T0 (65.8 and 62.3 cm), respectively. Concerning the weight, tillers in C2T2 were lighter (1.65 g in the second and 1.74 g in the third cut) than tillers of C0T0 (2.68 and 2.79 g, respectively).
Nutrients and calculated nutritive values
Table 3 shows the results of the main effects of the analysed nutrients as well as the calculated nutritive values. Significant interactions, as for DM and CP contents, and RNB values, are shown in Table 4.
Table 3. Nutritive value of orchard grass for C0T0 and C2T2 in cuts 1, 2 and 3
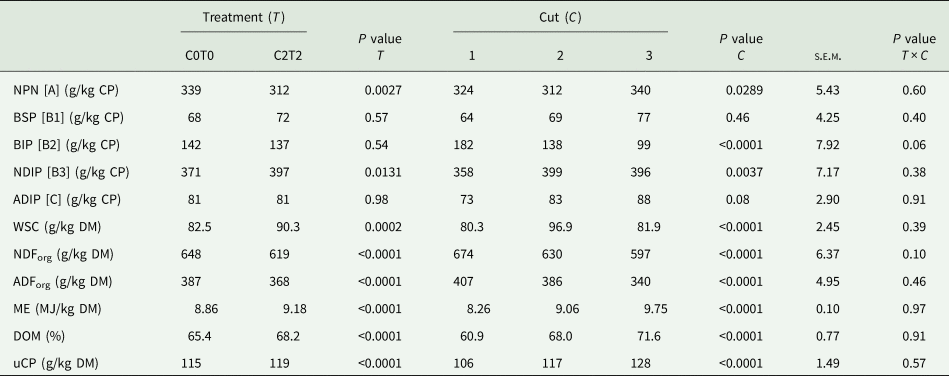
NPN, non-protein N; BSP, buffer soluble protein; BIP, buffer insoluble protein; NDIP, neutral detergent-insoluble protein; ADIP, acid detergent-insoluble protein; WSC, water-soluble carbohydrates; NDForg, neutral-detergent fibre; ADForg, acid-detergent fibre; ME, metabolizable energy; DOM, digestibility of organic matter; uCP, utilizable crude protein at the duodenum; C0T0, ambient climate condition; C2T2, simulated climate condition; s.e.m., standard error of means.
Values are averages from three replications and 3 years.
Table 4. Dry matter and crude protein content as well as ruminal nitrogen balance (RNB, no unit) of orchard grass for C0T0 and C2T2 in cuts 1, 2 and 3
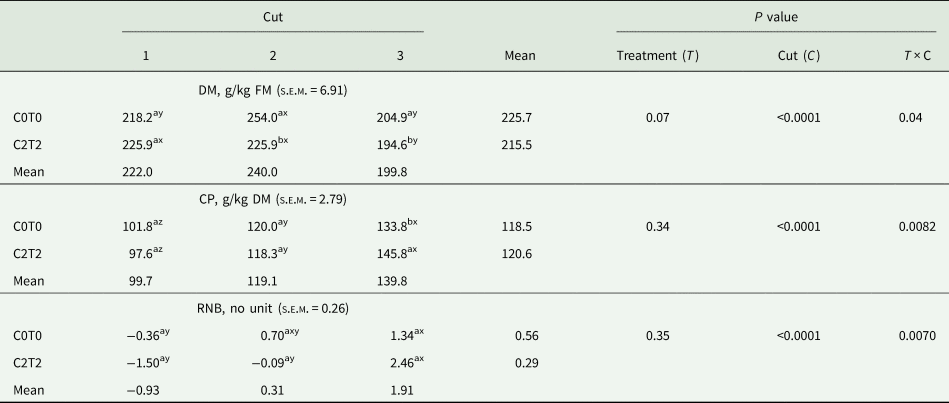
DM, dry matter; CP, crude protein; RNB, ruminal nitrogen balance; C0T0, ambient climate condition; C2T2, simulated climate condition.
abcValues with different superscripts differ between treatments.
xyzValues with different superscripts differ between cuts.
Values are averages from three replications and 3 years.
The DM content only differed in the second and third cut, where C2T2 was lower than C0T0 in the second cut with 225.9 v. 254.0 g, respectively, and 194.6 g v. 204.9 g/kg fresh sample in the third cut. Among cuts, the second cut in C0T0 was highest in DM content, and in C2T2 the third cut was highest.
The determination of CP showed an interaction treatments × cuts. Between treatments, only in the third cut C2T2 showed a higher content (146 g/kg DM) than C0T0 (134 g/kg DM) (Table 4). Among cuts, the third cut showed the highest values. The calculated RNB only differed between cuts, whereas in both treatments, the RNB was lower in the first cut (−0.36 and −1.50) than in the third cut (1.34 and 2.46).
Crude protein fractionation
The crude protein fractionation revealed differences for treatments in fraction A (NPN) and B3 (NDIP), as shown in Table 3. C2T2 with 312 g NPN/kg CP was lower than C0T0 with 339 g/kg CP. In contrast, fraction B3 was higher in C2T2 with 397 g NDIP/kg CP than C0T0 with 371 g/kg CP.
Considering the different cuts, protein fraction A (NPN) was lowest in the second cut (312 g/kg CP) and highest in the third cut (340 g/kg CP). For protein fraction B3, the lowest content occurred in the first cut (358 g/kg CP) and the highest content was found in the second and third cuts (399 and 396 g/kg CP, respectively). For fraction B1, B2 and C, no differences occurred between treatments. Fraction B2 was decreasing from cut 1 to cut 3 (Table 3).
Carbohydrate fractionation
WSC was different between treatments (Table 3). The content of WSC was higher in C2T2 (90.3 g/kg DM) than C0T0 (82.5 g/kg DM). The WSC content also differed among cuts, as the first and third cut showed lower WSC contents (80.3 and 81.9 g/kg DM) than the second cut (96.9 g/kg DM). Regarding both NDForg and ADForg, the treatment C2T2 showed lower values with 619 g and 368 g/kg DM compared to C0T0 with 648 g and 387 g/kg DM, respectively. Both NDForg and ADForg contents decreased from the first to the third cut from approximately 674 to 597 g and 407 to 340 g/kg DM, respectively (Table 3).
Calculated nutritive values
Overall, the ME content was higher in C2T2 with 9.18 MJ than under ambient climate conditions (C0T0) with 8.86 MJ/kg DM (Table 3). For both treatments, there was a rising ME content from the first cut with 8.26 MJ ME to the third cut with 9.75 MJ ME/kg DM. The same holds true for DOM with 68.2 and 65.4% for C2T2 and C0T0, respectively. Likewise, DOM enhanced from 60.9% in the first cut to 71.6% in the third cut. Also, uCP was higher in C2T2 with 119 g than C0T0 with 115 g/kg DM. Regarding cuts, uCP increased from 106 g to 128 g/kg DM from the first to the third cut.
Discussion
Development stage and plant functional traits
There were no differences in either MSC or MSW between the two treatments. This was unexpected. We had assumed it likely that the plots with higher temperature and enhanced CO2 would have advantageous conditions for growth and development compared to ambient climate situation, and this would be reflected in greater herbage accumulation (Olesen and Bindi, Reference Olesen and Bindi2002; Hopkins and Del Prado, Reference Hopkins and Del Prado2007). Pötsch et al. (Reference Pötsch, Herndl, Schaumberger, Schweiger, Resch and Adelwöhrer2019b) reported a faster phenological growth of certain species in the plots with increased temperature and CO2, especially in the first cut. Likewise, a visual difference of the inflorescence was observed in the first cuts, but the scale for determining MSC and MSW did not allow us to differentiate between these phenological variations. Therefore, we conclude that the scale used for the determination of MSC and MSW may be insufficiently sensitive to differentiate the characteristics of tillers between C0T0 and C2T2, resulting in a lack of precision for this comparison of orchard grass among treatment plots. In this case, a higher differentiation among rates of MSC and MSW would have been useful.
Even though the development stage based on MSC or MSW did not differ between treatments, the height and weight of the tillers did. Again, plants in C2T2 were subjected to the combination of increased temperature and CO2 enhancement. Although increased CO2 alone has been shown to be advantageous (Olesen and Bindi, Reference Olesen and Bindi2002; Hopkins and Del Prado, Reference Hopkins and Del Prado2007; Wheeler and Reynolds, Reference Wheeler and Reynolds2013) for grassland and crop productivity, or not (Bunce, Reference Bunce1995), in the case of C2T2 there was lower height and weight of tillers than for C0T0. In this regard, more factors may have influenced plant growth. As pointed out by Winslow et al. (Reference Winslow, Hunt and Piper2003), temperature and precipitation patterns can interfere with the photosynthetic effects of increased CO2. In addition, the lower height and weight of tillers in C2T2 may be caused by decreased soil moisture (Slawitsch et al., Reference Slawitsch, Birk, Herndl, Pötsch and Schaumberger2018). Increased temperatures can cease to be beneficial for vegetative growth when water supply is limited. Next to the water deficit, the infrequent precipitation, and thus decreased soil moisture, may consequently decrease the weight and height of tillers. In this regard, it seems that the ambient C0T0 had an advantage over C2T2. In C0T0, temperature was 3°C lower than in C2T2, and plants under such conditions may have experienced lower heat stress (and water deficit) than plants in C2T2. Recent years have already shown increased global mean temperatures, and further increases are predicted; therefore, future climate change is expected to result in more hot summers with less precipitation for the study region (IPCC, Reference Pachauri and Meyer2014). Under these projected future climate conditions, the Köppen-Geiger climate classification is likely to change from Dfb (continental, no dry season, warm summer) to Cfb (temperate, no dry season, warm summer) in the period from 2071 to 2100 (Beck et al., Reference Beck, Zimmermann, McVicar, Vergopolan, Berg and Wood2018). Consequently, in the future, both the height and weight of grass tillers may be affected, with probable decreases, and not only for orchard grass. However, it must be considered that the effects of climate variation are highly site-specific, contributing to more variation and less precise predictions among sites (Thornley and Cannell, Reference Thornley and Cannell1997; Gobiet et al., Reference Gobiet, Kotlarski, Beniston, Heinrich, Rajczak and Stoffel2014).
Regarding the main effect of cuts, the differences of tiller height and weight reflected the normal variance between the first cut and the following cuts. Cell wall content increases with maturity and in stems there is a higher ratio of cell wall than is found in leaves (Jung and Allen, Reference Jung and Allen1995). At the first cut, the plants had already reached a reproductive stage, being further developed and fully grown, which was indicative of higher height and weight of the tillers. On the other hand, the tillers in the subsequent cuts were smaller and consequently lighter. Orchard grass achieves flowering mainly in the first growth, and it mostly shows a vegetative development in the subsequent growths with an increased share of leaves. This was confirmed in our study by means of the indicated LWR. Although LWR was not affected by C2T2, the cuts showed an expected variation. In the second and third cut, plants were physiologically younger with less stem and a higher proportion of leaves. This was also reflected by significantly lower values of MSC and MSW in the second and third cuts. In the first cut, the stems were fully developed and superior in terms of weight, which may also explain the lower LWR. Consequently, C2T2 led to a higher share of necrotic leaves (NLWR) in the first cut. In addition, increased temperature and elevated CO2 may have supported higher NLWR in the first cut caused by leaf damage in C2T2 due to temperature-related stress in later development stages.
Nutrients and calculated nutritive values
Temperature and CO2 variation did not affect the dry matter content in the first cut. Increased CO2 reduces stomatal transpiration and thus reduces DM content (Drake et al., Reference Drake, Gonzàlez-Meler and Long1997). Stomatal transpiration was not measured in this study, although this may have been a factor related to the values observed for C2T2 in the second and third cuts compared to C0T0 (Table 2).
Crude protein fractionation
The crude protein fractionation allows a more detailed identification of the protein quality of forages and reveals its current nutritive value. Since the crude protein is not completely digestible by the animal, it is necessary to identify the digestible and indigestible fractions, which could be obtained with crude protein fractionation. Treatment C2T2 had no severe effect on the CP content, although CP was higher in this treatment in the third cut. In the present examination, the CP of orchard grass showed similar values to those found by Peri et al. (Reference Peri, Lucas and Moot2007). In addition, the CP content increased as expected from first to third cut, confirming the negative correlation between protein content and development stage of plants, since plants in the first growth are in a mature stage compared to the following cuts (Resch, Reference Resch2007). Nevertheless, since increased temperature and CO2 did not affect CP content substantially, it is even more necessary to consider crude protein fractionation, as the fractionation contributes more to elucidate CP contribution for ruminant feeding, than the CP alone.
Among CP fractions, NPN seems to be most likely to depend on increased temperature and CO2. Since C2T2 had a lower NPN content than C0T0, this may indicate that elevated temperature and CO2 increase N-use efficiency, as observed by Stitt and Krapp (Reference Stitt and Krapp1999). Since plants use a large proportion of N for protein synthesis (Nunes-Nesi et al., Reference Nunes-Nesi, Fernie and Stitt2010), it is likely that higher temperature and elevated CO2, as in C2T2, enhanced the N metabolism, accelerating the conversion of single N compounds into complex protein compounds. In contrast to CP, NPN had its lowest values in the second cut which may indicate that in midsummer there was a higher conversion rate of N into protein compounds. This again reflects the linkage between higher temperature and elevated CO2 with N conversion.
However, the dependence of N conversion on temperature and CO2 did not seem to affect the fractions of true protein. Between the cuts, there was a difference in BIP with a decreasing content from the first to the third cut. There was no difference in either BSP or BIP between treatments. Both BSP and BIP are defined as true protein, located within plant cells, but they vary in their ruminal degradation rate. BSP is completely and rapidly degradable, whereas BIP has an average degradation rate (Licitra et al., Reference Licitra, Hernandez and Van Soest1996). The rapid N conversion under increased temperature is likely to have affected NDIP. However, NDIP is slowly and not completely degradable because proteins in this fraction are bonded within the cell walls of the plant (NDForg), which are more difficult to be accessed for microbial fermentation (Clissold et al., Reference Clissold, Sanson and Read2004). The results showed that C2T2 caused a higher content of NDIP. This reflects the results in NPN and NDForg, where C2T2 was inferior to C0T0 (Table 3). Higher temperature and elevated CO2 seem to result in fast conversion of NPN into protein compounds, especially NDIP, as suggested by the results in Table 3. Concerning ADIP, BSP and BIP, simultaneous increase of temperature and CO2 did not make a difference to these fractions. ADIP is plant cell wall-bonded and is a non-degradable protein (Licitra et al., Reference Licitra, Hernandez and Van Soest1996). Even though C0T0 was superior in NDForg and ADForg, it was neither superior in NDIP nor in ADIP, suggesting no causal relationship between cell wall carbohydrates and inclusion of cell wall-bonded protein in plant tissue. This is supported by the correlations in Table 3. Since the content of cell wall-bonded protein did not correlate with the content of NDForg and ADForg, the amounts of NDIP and ADIP in C0T0 and C2T2 cannot be connected to the variation in the content of NDForg and ADForg. However, compared to the other fractions, ADIP was relatively low in orchard grass, which is favourable, because the protein which is bonded to ADForg has no feed value for ruminal protein supply, as ADForg is barely digestible (Van Soest, Reference Van Soest1994). When the differences among cuts are considered, the first cut had a lower NDIP content than the second and third cut, even though the plant had reached a mature growth stage at the first cut, and thus advanced lignification in the plant cell walls and hence higher content of NDIP is presumable. But this did not occur in our study. There was a tendency for the first cut to have the lowest ADIP content even though maturity and hence lignification was advanced.
Carbohydrate fractionation
The increased temperature and elevated CO2 in C2T2 resulted in higher WSC contents of the plant. As CO2 is converted into carbohydrates by photosynthesis of the plant (Humphreys et al., Reference Humphreys, Yadav, Cairns, Turner, Humphreys and Skot2006; Hopkins and Del Prado, Reference Hopkins and Del Prado2007), the increased temperature and atmospheric CO2 content probably allow an increased photosynthesis rate and carbon uptake in the plant (Drake et al., Reference Drake, Gonzàlez-Meler and Long1997). This is supported also by Hopkins and Del Prado (Reference Hopkins and Del Prado2007), who referred to higher WSC contents under a combination of increased temperature and elevated CO2. In our study, plants seemed to store carbon in the form of WSC rather than investing in growth, which was reflected in lower height of the tillers, lower NDForg and ADForg content, as well as lack of advantage in development stage in C0T0. It seems that in C0T0 higher tillers probably were generated to optimize the total exposure surface, which would have helped achieve a high photosynthesis rate under the lower CO2 concentration. With higher temperature and elevated atmospheric CO2 in C2T2, it is assumed that the photosynthesis rate is already optimized with smaller plants, assuming also there is no water or nutrient limitation at the same time.
In this study, both WSC and NPN, among other carbohydrate and protein fractions, were sensitive to the enhancement of temperature and CO2. However, it was noticeable that WSC and NPN were affected contrarily. Radojevic et al. (Reference Radojevic, Simpson, St. John and Humphreys1994) found a negative correlation between total N content and WSC in ryegrass cultivars in response to seasonal variation. Similarly, in the present experiment, increased temperature and elevated CO2 in combination were favourable for the accumulation of carbon stored as WSC and for improving protein synthesis. This was demonstrated by a lower NPN content and higher amounts of WSC in C2T2 (Table 3).
The higher content of NDForg in C0T0 could be related to the lower WSC content and the predominant height of the plants in this treatment. The NDForg is commonly high in grasses (Humphreys et al., Reference Humphreys, Yadav, Cairns, Turner, Humphreys and Skot2006) and lignification increases with the maturity of the plant (Jung and Allen, Reference Jung and Allen1995). Under the ambient climate conditions in C0T0, orchard grass had higher tillers, which means longer stems and thus higher proportions of structural carbohydrates (NDForg and ADForg; Table 3) required for stability of the tillers. A study by Dumont et al. (Reference Dumont, Andueza, Niderkorn, Lüscher, Porqueddu and Picon-Cochard2015) found that increased CO2 had no effect on structural carbohydrates. In our study, the lower content of NDForg and ADForg in C2T2 can be attributed to the difference in the WSC content as well as in the lower height of the tillers.
There were differences between cuts, and both NDForg and ADForg decreased from the first to the third cut, reflecting the reduced development stages of the plants in the second and third cut compared to the first cut. The second and third cuts, with more vegetative tillers and higher LWR, show lower contents of NDForg and ADForg (Resch, Reference Resch2007). Starch was not detectable, neither by polarimetric nor photometric methods. As most C3 grasses have very low contents of starch (Bailey, Reference Bailey1958), it is no surprise that there was no starch found in orchard grass in the present study.
Calculated nutritive values
In the treatment C2T2, the RNB was unaffected, even though uCP, which was higher in this treatment, was part of the calculation of RNB. The increased temperature and elevated CO2 enhanced the ME content in C2T2, which may be linked to the improved WSC storage, as mentioned earlier (Drake et al., Reference Drake, Gonzàlez-Meler and Long1997). As the lower values for tiller height and weight have shown, there is no growth advantage if the (higher) energy content occurs mainly because of increased WSC content. This is reflected in the positive correlation between ME and WSC in C2T2 (Table 5). In addition, the ME differences observed for cuts reflected the development stage among cuts. The first cut with mature tillers had lower ME contents (Resch, Reference Resch2007) due to increased lignification of the plant cells, and likewise there was a higher ME content in the second and third cut because of younger tillers, higher LWR and less fibre content.
Table 5. Correlation between NDIP and NDForg, ADIP and ADForg as well as between ME, DOM and WSC, NDForg and ADForg of orchard grass for C0T0 and C2T2
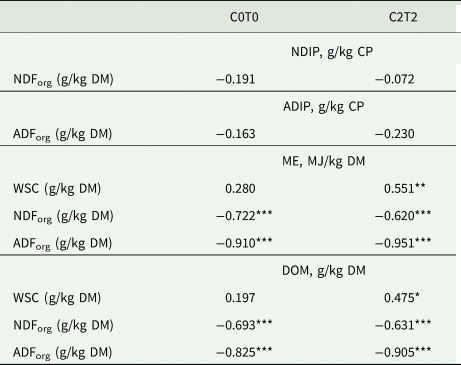
NDForg, neutral-detergent fibre; ADForg, acid-detergent fibre; NDIP, neutral detergent-insoluble protein; ADIP, acid detergent-insoluble protein; WSC, water-soluble carbohydrates; ME, metabolizable energy; DOM, digestibility of organic matter; C0T0, ambient climate condition; C2T2, simulated climate condition.
Values are averages of three replications and 3 years, *P < 0.05, **P < 0.01, ***P < 0.001.
The calculated DOM was higher in C2T2, which can partly be related to the lower content of NDForg and ADForg. Fibrous feed is essential for gut health and metabolic function in ruminants, but it also can have a negative influence on digestibility (Jung and Allen, Reference Jung and Allen1995). Both NDForg and especially ADForg contain high fractions of indigestible fibrous substances like lignin and insoluble parts of hemicellulose and cellulose, which lowers the total digestibility. This was reflected in the negative correlation between DOM and NDForg and ADForg, respectively (Table 5). The lower ADForg and increased DOM of C2T2 are in contrast with observations reported by Augustine et al. (Reference Augustine, Blumenthal, Springer, LeCain, Gunter and Derner2018), where warming and elevated CO2 decreased digestibility and increased ADForg contents. However, that study was conducted on mixed prairie grass in North America. Once again, this highlights the need to consider climate variation being highly site-specific, exacerbating predictions among sites (Thornley and Cannell, Reference Thornley and Cannell1997; Gobiet et al., Reference Gobiet, Kotlarski, Beniston, Heinrich, Rajczak and Stoffel2014).
The higher content of uCP is probably related to the higher ME content of C2T2 (Eqn (6)). The ME content is relevant for microbial growth and activity in the rumen (Miller et al., Reference Miller, Neville, Baker, Evans, Theodorou and MacRae1999). As uCP is composed of UDP and microbial protein, it is likely that the higher ME content in C2T2 may contribute to increased microbial protein synthesis in the rumen, even though there was no difference in CP between treatments. In contrast, C0T0 had a higher amount of NPN, which would also have served as a basis for microbial protein synthesis. But with a lower ME content of C0T0, there seemed to be no positive effect of increased NPN on the calculated uCP amount.
Conclusion
The combination of increased temperature and elevated CO2 lead to an increased and accelerated conversion of NPN into complex protein compounds. Simultaneously, it accounts for increased proportions of WSC, and higher WSC is connected to increased digestibility and ME contents. Height and weight of plants decreased under elevated temperature and CO2 in the second and third cuts. The outcome of this study reveals how the type of ambient conditions of temperature and CO2, which are considered likely to become normal in the near decades, will impact grass growth and its nutritive value of a grass species of high agronomic value for livestock production. Under increased temperature and CO2, orchard grass accumulates certain nutrients while a decline in tiller growth in the second and third growth is likely.
Supplementary material
The supplementary material for this article can be found at https://doi.org/10.1017/S0021859621000460
Acknowledgements
We want to thank the team of the Austrian Research and Education Centre Raumberg-Gumpenstein (AREC) for their support during the sampling campaigns and for the provision of the experimental site, which was supported by the DaFNE project ‘ClimGrassEco’ (101067).
Financial support
This project was financially supported by the H. Wilhelm Schaumann Stiftung, Germany.
Conflict of interest
None.
Ethical standards
Not applicable.


