Article Text

Abstract
Introduction As white matter hyperintensities (WMHs) of the brain are associated with an increased risk of stroke, cognitive decline, and depression, elucidating the associated risk factors is important. In addition to age and hypertension, pre-diabetes and diabetes may play important roles in the development of WMHs. Previous studies have, however, shown conflicting results. We aimed to investigate the effect of diabetes status and quantitative markers of glucose metabolism on WMH volume in a population-based cohort without prior cardiovascular disease.
Research design and methods 400 participants underwent 3 T MRI. WMHs were manually segmented on 3D fluid-attenuated inversion recovery images. An oral glucose tolerance test (OGTT) was administered to all participants not previously diagnosed with diabetes to assess 2-hour serum glucose concentrations. Fasting glucose concentrations and glycated hemoglobin (HbA1c) levels were measured. Zero-inflated negative binomial regression analyses of WMH volume and measures of glycemic status were performed while controlling for cardiovascular risk factors and multiple testing.
Results The final study population comprised 388 participants (57% male; age 56.3±9.2 years; n=98 with pre-diabetes, n=51 with diabetes). Higher WMH volume was associated with pre-diabetes (p=0.001) and diabetes (p=0.026) compared with normoglycemic control participants after adjustment for cardiovascular risk factors. 2-hour serum glucose (p<0.001), but not fasting glucose (p=0.389) or HbA1c (p=0.050), showed a significant positive association with WMH volume after adjustment for cardiovascular risk factors.
Conclusion Our results indicate that high 2-hour serum glucose concentration in OGTT, but not fasting glucose levels, may be an independent risk factor for the development of WMHs, with the potential to inform intensified prevention strategies in individuals at risk of WMH-associated morbidity.
- pre-diabetic state
- MRI
- brain diseases
- metabolic
- diabetes complications
Data availability statement
Data are available upon reasonable request. The informed consent given by KORA study participants does not cover data posting in public databases. However, data are available upon request from KORA/KORA-gen (https://epi.helmholtz-muenchen.de/) by means of a project agreement. Requests should be sent to kora.passt@helmholtz-muenchen.de and are subject to approval by the KORA Board.
This is an open access article distributed in accordance with the Creative Commons Attribution Non Commercial (CC BY-NC 4.0) license, which permits others to distribute, remix, adapt, build upon this work non-commercially, and license their derivative works on different terms, provided the original work is properly cited, appropriate credit is given, any changes made indicated, and the use is non-commercial. See: http://creativecommons.org/licenses/by-nc/4.0/.
Statistics from Altmetric.com
Significance of this study
What is already known about this subject?
Diabetes contributes to the development of white matter hyperintensities (WMHs) of the brain.
What are the new findings?
The effect of diabetes and particularly pre-diabetes on WMH volume may be driven by 2-hour serum glucose concentration determined by oral glucose tolerance test but not by fasting glucose levels.
How might these results change the focus of research or clinical practice?
These results have the potential to inform intensified prevention strategies in individuals at risk of WMH-associated morbidity, explain conflicting results of studies assessing the effect of pre-diabetes on WMHs and show that future studies investigating the association between diabetes status and WMHs should differentiate between impaired glucose tolerance and impaired fasting glucose.
Introduction
In the past, white matter hyperintensities (WMHs) of the brain were considered incidental findings with unclear clinical significance. However, over the last decade, several studies have shown that WMHs are associated with multiple severe morbidities such as cognitive decline,1–3 increased stroke risk1 4 5 and worse outcome after stroke,6 decreased mobility due to gait disturbance7 as well as an increased risk of depression.8
Hypoperfusion due to altered cerebrovascular autoregulation, hypoxic–ischemic axonal loss and demyelination, as well as blood–brain barrier dysfunction have been established as leading pathophysiological causes of WMHs.9 10 A plethora of potential risk factors for WMHs have been described, including high age,11 12 hypertension,13–15 dyslipoproteinemia,16 as well as socioeconomic and lifestyle parameters.17–19 Also, diabetes and pre-diabetes might play a major role in the development of WMHs as diabetes-related atherosclerosis appears to be an essential driving factor.20–22 However, previous studies assessing the association between WMHs and diabetes status show conflicting results, with a large-scale study demonstrating an association of WMH burden with diabetes, but not pre-diabetes,23 while another recent study did find an association with pre-diabetes.24 These discrepancies might partially arise from the heterogeneous definition of diabetes status, which can be diagnosed based on 2-hour serum glucose concentrations in oral glucose tolerance tests (OGTTs) and/or fasting glucose concentrations, or glycated hemoglobin (HbA1c) levels.25 26
We therefore aimed to analyse the association of diabetes, pre-diabetes and WMHs more precisely, by detangling the effects of 2-hour glucose levels, fasting glucose concentrations, and HbA1c levels on WMH volume. In detail, the aims of this study were (1) to investigate the effect of diabetes status on WMH volume and (2) to assess the associations of 2-hour serum glucose concentration measured by OGTT, fasting glucose, as well as HbA1c with WMH volume, in order to inform intensified prevention strategies and to monitor early treatment strategies in individuals at risk of WMH-associated morbidity.
Materials and methods
Study design
This study comprises a sample from the population-based Cooperative Health Research in the Region of Augsburg (KORA) FF4 study (2013–2014, 2279 participants). The FF4 study is the second follow-up of the baseline study KORA S4 (1999–2001, 4261 participants, response 67%), which represents a large sample from the general population in the region of Augsburg, Germany. Recruitment and data collection have been described in detail previously.27
Sample selection
The KORA MRI study nested in KORA FF4 included 400 participants facilitating an enriched case–control design of 54 participants with established diabetes, 103 participants with pre-diabetes and 243 with normal glucose metabolism. All 400 participants underwent a dedicated whole-body MRI protocol, as described in detail previously.28
The KORA MRI study was designed with a focus on MRI-based analysis of subclinical disease burden before clinical symptoms become apparent. Consequently, participants with overt cardiovascular disease were not included in this study.28 Exclusion criteria of the KORA MRI study were age >74 years, validated/self-reported stroke, myocardial infarction, peripheral artery disease, type 1 diabetes, missing OGTT in participants without type 2 diabetes diagnosed by a physician before entering the KORA study, poor overall health condition, unwillingness to undergo MRI, and contraindication to MRI (implanted stents, cardiac pacemaker or implantable defibrillator, cerebral aneurysm clip, neural stimulator, any type of ear implant, metal parts inside the body, larger tattoos, inability of supine position or breath-holding, known allergy to gadolinium compounds, serum creatinine level≥1.3 mg/dL, claustrophobia, pregnancy or breast feeding).28
In the present study, 12 participants had to be excluded due to insufficient MRI image quality (see online supplemental figure 1).
Supplemental material
MRI
Image acquisition was performed on a single 3 T MRI system (Magnetom Skyra; Siemens Healthineers, Erlangen, Germany). T2-weighted 3D fluid-attenuated inversion recovery (FLAIR) images (slice thickness: 0.9 mm, 0.5 mm×0.5 mm in-plane spatial resolution, repetition time: 5000 ms, echo time: 389 ms, inversion time: 1800 ms, flip angle: 120°) of the brain were acquired for WMH assessment, in accordance with the standards for reporting vascular changes on neuroimaging (STRIVE) recommendations.29
WMH volume
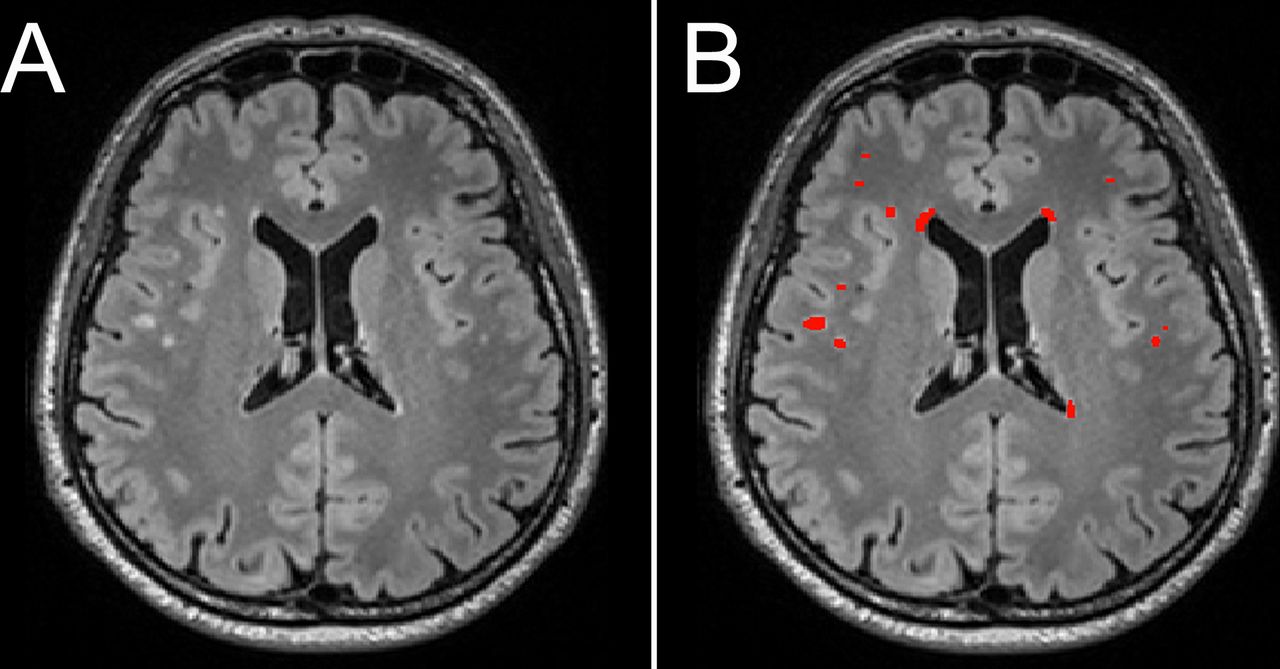
ITK-SNAP V.3.6.0 was used for segmentation.30 Cerebral WMHs were manually segmented by a radiology resident (SG, 2 years of experience in neuroimaging and radiology) and edited and modified where necessary by a board-certified radiologist (SSt, 7 years of experience in neuroimaging and radiology) on sagittal acquired FLAIR images reconstructed in axial plane with a slice thickness of 0.5 mm (see figure 1). For homogeneous image intensity, the ITK-SNAP tool ‘autoadjust contrast’ was used. WMHs were defined as signal abnormalities of variable sizes in the white matter of the brain that show a hyperintense signal on FLAIR images.29 WMH in the brainstem and cerebellum were not included. Image analyses were performed blinded to all clinical data as well as other measurements.

Example of manual WMH segmentation (total WMH volume: 1835 mm3). (A) Axial T2-weighted fluid attenuated inversion recovery image of a participant in his 50s. (B) Manual segmentation of WMH volume displayed in red. ITK-SNAP V.3.6.0 was used for segmentation. WMH, white matter hyperintensity.
Pre-diabetes and diabetes assessment
Measures of pre-diabetes and diabetes were collected in a standardized method as part of the KORA study design and have been described in detail previously.27 For the definition of pre-diabetes and diabetes, the WHO/International Diabetes Federation criteria were applied.25 Diabetes was determined as either established type 2 diabetes validated by a physician or a 2-hour serum glucose concentration determined by OGTT≥200 mg/dL and/or a fasting glucose level >125 mg/dL. Pre-diabetes was determined as impaired glucose tolerance (IGT) and/or impaired fasting glucose (IFG) concentration. IGT was defined by a 2-hour serum glucose concentration ranging between 140 and 199 mg/dL in OGTT. IFG was defined by fasting glucose levels ranging between 110 and 125 mg/dL.
Fasting glucose concentration and the HbA1c value of each study participant were assessed. In addition, an OGTT was administered to all participants without previously diagnosed type 2 diabetes (n=354). Participants with type 2 diabetes diagnosed by a physician before entering the KORA study did not receive an OGTT (n=34). In 17 participants, type 2 diabetes was newly diagnosed by OGTT within the KORA study.
Statistical analysis
Characteristics of the study population were summarized by arithmetic means with SD for continuous variables or counts and percentages for categorical variables, stratified by diabetes status. Differences according to diabetes status were assessed by one-way analysis of variance or χ2 test, where appropriate.
The associations between WMH volume (dependent variable) and diabetes status as well as 2-hour serum glucose concentration in OGTT, fasting glucose and HbA1c (independent variables) were evaluated separately by zero-inflated negative binomial regression analysis. Models were unadjusted (model A), adjusted for age and gender (model B) and adjusted for age, gender, hypertension, low-density lipoprotein cholesterol (LDL-C), Body Mass Index (BMI), smoking and alcohol consumption (model C), providing incidence rate ratios (IRRs) with 95% CIs. The IRR estimated the ratio of the predicted WMH volume for a one-unit increase in the risk factor variable. In sensitivity analyses, the associations between WMH volume and glycemic parameters were examined only in individuals with WMH by negative binomial regression models according to models A, B and C, separately. P values of <0.05 were considered to denote statistical significance. To account for multiple testing of the five independent variables (pre-diabetes, diabetes, 2-hour glucose in OGTT, fasting glucose, and HbA1c), we additionally evaluated the results based on a significance level of p<0.01 (0.05/5). All analyses were conducted with Stata V.16.1.
Results
Study population
The final study population consisted of 388 participants (57% male, age: 56.3±9.2 years), including 98 (25%) participants with pre-diabetes and 51 (13%) participants with diabetes. WMHs were found in 70% of participants with pre-diabetes, 80% of participants with diabetes and 58% of control participants without pre-diabetes or diabetes. In total 249 (64.2%) participants had detectable WMH. Mean WMH volume was 2603 mm3 in participants with pre-diabetes, 3684 mm3 in participants with diabetes and 996 mm3 in control participants without pre-diabetes or diabetes. Mean WMH volume across all participants was 1755 mm3. Further covariates such as age, gender, hypertension, LDL-C, BMI, smoking and alcohol consumption are presented in table 1.
Characteristics of the study population stratified by diabetes status
An additional analysis applying of the definition of pre-diabetes and diabetes of the American Diabetes Association26 instead of the definition of the WHO/International Diabetes Federation25 (ie, IFG was defined by fasting glucose levels ranging between 100 and 125 mg/dL instead of 110 and 125 mg/dL) has been performed. Applying this lower cut-off, 160 (41%) instead of 98 (25%) participants were diagnosed with pre-diabetes. WMHs were found in 68% instead of 70% of the participants with pre-diabetes. Mean WMH volume was 1893 mm3 instead of 2603 mm3 in participants with pre-diabetes.
Differences in WMH volume between participants with diabetes, participants with pre-diabetes and normoglycemic control participants
WMH volume was significantly higher in participants with pre-diabetes and diabetes as compared with normoglycemic control participants (p<0.001, respectively). These effects were confirmed after adjustment for age and gender (p=0.002 and p=0.005, respectively), and after adjustment for age, gender, hypertension, LDL-C, BMI, smoking and alcohol consumption (p=0.001 and p=0.026, respectively) (see figure 2). There was no significant difference in WMH volume between pre-diabetic participants and participants with diabetes (p=0.406). Further details are presented in table 2.
Association of diabetes status with WMH volume

Predicted WMH volume (x-axis: diabetes status, y-axis: WMH volume) in normoglycemic controls (mean: 996 mm3), persons with pre-diabetes (mean: 2603 mm3) and diabetes (mean: 3684 mm3). WMH volume was significantly higher in persons with pre-diabetes (p=0.001) and diabetes (p=0.026) compared with normoglycemic controls after adjustment for age, gender, hypertension, low-density lipoprotein cholesterol, Body Mass Index, smoking, and alcohol consumption. WMH, white matter hyperintensity.
These results were verified in a subgroup analysis based merely on participants with WMHs: compared with normoglycemic controls, WMH volume was significantly higher in individuals with pre-diabetes and diabetes (p<0.001, respectively). The association of WMH volume with pre-diabetes remained significant after adjustment for age, gender and cardiovascular risk factors (p=0.004). The association of WMH volume with diabetes was attenuated after adjustment for age, gender and cardiovascular risk factors (p=0.077). Further details are presented in online supplemental table 1.
In an additional analysis under application of the definition for pre-diabetes and diabetes of the American Diabetes Association26 instead of the definition of the WHO/International Diabetes Federation25 (ie, IFG was defined by fasting glucose levels ranging between 100 and 125 mg/dL instead of 110 and 125 mg/dL), WMH volume was still significantly higher in participants with pre-diabetes and diabetes as compared with normoglycemic control participants (p=0.047 and p<0.001, respectively). However, these effects became insignificant after adjustment for age and gender (p=0.351 and p=0.075, respectively), and after adjustment for age, gender, hypertension, LDL-C, BMI, smoking and alcohol consumption (p=0.379 and p=0.242, respectively). WMH volume was significantly higher in participants with diabetes as compared with participants with pre-diabetes (p=0.041). However, these effects became insignificant after adjustment for age and gender (p=0.215), and after adjustment for age, gender, hypertension, LDL-C, BMI, smoking and alcohol consumption (p=0.529). Further details are presented in online supplemental table 2.
Associations of 2-hour serum glucose concentration determined by OGTT, fasting glucose concentration, and HbA1c with WMH volume
Two-hour serum glucose concentration determined by OGTT showed a significant association with WMH volume (p<0.001), which remained significant after adjustment for age, gender, hypertension, LDL-C, BMI, smoking and alcohol consumption (p<0.001). An increase of 1 mg/dL in serum glucose was associated with a WMH volume increase of 1%. Fasting glucose was not significantly associated with WMH volume before (p=0.710) and after adjustment for age, gender and cardiovascular risk factors (p=0.389). HbA1c showed a significant association with WMH volume (p<0.001), which was attenuated after adjustment for age, gender and cardiovascular risk factors (p=0.050). Further details are presented in table 3.
Association of 2-hour glucose of the oral glucose tolerance test, fasting glucose and HbA1c with WMH volume. IRRs are from zero-inflated negative binomial regression models
In a subgroup analysis restricted to participants with WMHs (n=249), these results could be replicated: 2-hour serum glucose concentration determined by OGTT showed a significant association with WMH volume, which remained significant after adjustment for age, gender and cardiovascular risk factors (p<0.001). Fasting glucose concentration was not significantly associated with WMH volume (p=0.590). HbA1c was significantly associated with WMH volume before (p<0.001) but not after adjustment (p=0.074) (see figure 3). Further details are shown in online supplemental table 3.

Visualization of predicted WMH volume (y-axis) according to 2-hour glucose (A, x-axis), fasting glucose (B, x-axis) and HbA1c (C, x-axis). Dashed line: unadjusted linear prediction. Solid line: prediction adjusted for age, gender, hypertension, low-density lipoprotein cholesterol, Body Mass Index, smoking, and alcohol consumption. HbA1c, glycated hemoglobin; WMH, white matter hyperintensity.
In a subgroup analysis comprising only participants who received an OGTT (n=354), fasting glucose concentration was again not significantly associated with WMH volume (p=0.886). HbA1c showed a significant association with WMH volume (p<0.001), which remained significant after adjustment for age, gender and cardiovascular risk factors (p=0.005). Further details are presented in online supplemental table 4.
A subgroup analysis of participants with isolated IGT (n=44), isolated IFG (n=37) and combined IGT/IFG (n=17) confirmed these results: IGT, but not IFG, showed a significant association with WMH volume, which remained significant after adjustment for age, gender and cardiovascular risk factors (p<0.001). Combined IGT/IFG was significantly associated with WMH volume before (p=0.007) but not after adjustment for age and gender (p=0.188). However, the number of participants with combined IGT/IFG was low. Further details are shown in online supplemental tables 5 and 6.
Discussion
In this enriched, population-based study, we investigated the effect of diabetes status, as well as quantitative markers of glucose metabolism, on WMH volume. Confounder adjusted analysis showed a significant association between WMH volume and diabetes status. In addition, WMH volume was strongly associated with 2-hour glucose after OGTT but not with fasting glucose. HbA1c showed a significant association with WMH volume, which was attenuated after adjustment for age, gender and cardiovascular risk factors, depending on the underlying study sample.
WMH volume was significantly higher in individuals with pre-diabetes or diabetes compared with normoglycemic controls. The association between WMHs and diabetes status was confirmed after adjustment for age and gender. In the current literature, the effect of pre-diabetes on WMH volume is under debate: a recent large-scale study that defined diabetes status based on fasting glucose concentration and HbA1c levels demonstrated that severe diabetes, but not less-severe diabetes or pre-diabetes, was associated with increased WMH burden.23 On the other hand, another large-scale study that defined diabetes status based on fasting glucose concentration and 2-hour glucose concentration in OGTT reported that pre-diabetes was associated with higher WMH burden, with further deterioration in type 2 diabetes.24
We found that high 2-hour serum glucose concentration determined by OGTT, but not fasting glucose, was strongly associated with increased WMH volume. This association remained highly significant after adjustment for traditional cardiovascular risk factors. This finding might indicate that IGT, defined by OGTT, and IFG, defined by fasting glucose levels, have different effects on the development of WMHs, especially since IGT and IFG have a heterogeneous pathogenesis representing different entities in impaired glucose regulation and do not necessarily include the same group of participants.31 32 IGT is related to insulin resistance, whereas IFG is associated with impaired insulin secretion.32 Consequently, IGT and IFG may induce partially distinct pathological mechanisms with differential impact on the development of WMHs. Since pre-diabetes comprises both IGT and IFG, conflicting results of studies evaluating the association between pre-diabetes and WMHs could be partially caused by a different distribution of IGT and IFG in the underlying study samples of participants with pre-diabetes.
The stronger association of 2-hour glucose levels than fasting glucose levels or HbA1c with WMH burden might be partially explained by the known adverse cardiovascular effects of high glucose level variance and amplitude. It was demonstrated that glucose variability in OGTT was associated with greater arterial stiffness and maladaptive arterial remodeling independent of HbA1c.33 Glucose variability in continuous glucose monitoring showed an HbA1c independent association with diabetic retinopathy.34 These findings could indicate that glucose dynamics not detected by HbA1c may contribute to cardiovascular complications, potentially causing increased WMH burden.35 However, further studies are needed to assess the independent impact of glucose variability in OGTT on WMH volume.
We found no significant association between WMH burden and fasting plasma glucose across groups. In participants with established type 2 diabetes, however, a significant association between fasting glucose levels and WMHs has been reported previously.36 37 In a population-based cohort-study oversampled with type 2 diabetes, fasting glucose levels were significantly associated with WMH volume.24 In pre-diabetes however, results are more ambiguous: a recent cohort study of participants with high–normal fasting glucose levels or impaired mean fasting glucose levels (ie, pre-diabetes) found no significant difference in WMH volume between the two groups—at least when including subjects over 40 years in the model. When the analysis was restricted to participants aged 40 years and younger, the effect of mean fasting glucose levels on WMH volume was significant.38
In our study, we found a significant association of HbA1c with WMH volume, which was attenuated after adjustment for age, gender and cardiovascular risk factors, depending on the underlying study sample. This result is in keeping with the current literature: several studies have reported that elevated levels of HbA1c are associated with high WMH burden.23 39–41 Schneider et al showed in a large-scale study that severe diabetes defined by high HbA1c and long disease duration but not pre-diabetes or less-severe diabetes defined by elevated HbA1c were associated with an increased burden of WMHs.23 Tamura et al found no association of HbA1c and WMH volume in elderly patients with diabetes.35
The results of this study need to be interpreted in light of its limitations. Compared with previously published studies on WMH volume in pre-diabetes and diabetes,23 24 our sample size of 388 participants was rather small. Our results are not applicable to persons with overt cardiovascular disease, as participants with overt cardiovascular disease were excluded by study design, which was focused on MRI-based analysis of subclinical disease burden. Although traditional cardiovascular risk factors such as hypertension, obesity, dyslipidaemia, smoking and alcohol consumption were included in the analysis model, the existence of unmeasured confounding variables cannot be fully ruled out. Our results, however, indicate that high 2-hour serum glucose concentration in OGTT may be an independent risk factor for the development of WMHs, especially in pre-diabetes.
In conclusion, in this population without prior cardiovascular disease, our results suggest that the effect of diabetes and particularly pre-diabetes on WMH volume may be driven by 2-hour serum glucose concentration determined by OGTT but not by fasting glucose levels. Conflicting results of studies evaluating the association between WMHs and pre-diabetes could be partially caused by the determination of diabetes status by 2-hour glucose and fasting glucose levels plus different distribution patterns of IGT and IFG in the underlying study samples. Considering the stable association of 2-hour glucose with WMH volume, this marker could serve as a readily available parameter to inform intensified prevention strategies and to monitor early treatment strategies in individuals at risk of WMH-associated morbidity such as stroke, cognitive decline and increased risk of depression.
Data availability statement
Data are available upon reasonable request. The informed consent given by KORA study participants does not cover data posting in public databases. However, data are available upon request from KORA/KORA-gen (https://epi.helmholtz-muenchen.de/) by means of a project agreement. Requests should be sent to kora.passt@helmholtz-muenchen.de and are subject to approval by the KORA Board.
Ethics statements
Ethics approval
This study was performed according to the Declaration of Helsinki. All study methods were approved by the ethics committee of the Bavarian Chamber of Physicians, Munich (S4: EC No. 99186 and for genetic epidemiological questions 05004, F4 and FF4: EC No. 06068). The MRI examination protocol was approved by the ethics committee of the Faculty of Medicine at LMU Munich.
Acknowledgments
Part of the data presented in this work are part of the doctoral thesis of Felix Hartmann.
References
Supplementary materials
Supplementary Data
This web only file has been produced by the BMJ Publishing Group from an electronic file supplied by the author(s) and has not been edited for content.
Footnotes
Contributors SG, RL and SSt wrote the main manuscript text and prepared the figures and tables. SG, FH and SSt performed the analyses of the imaging data. RL and SR performed the statistical analyses. SG, RL, SR and SSt analyzed and interpreted the findings. SG, RL, SR, FB, CLS, SSe, SA, MH, WR, KM-P, K-HL, AP, BBE-W and SSt were involved in the design and supervision of the research. All authors contributed to the interpretation of the results and reviewed the manuscript.
Funding The KORA study was initiated and financed by the Helmholtz Zentrum München - German Research Center for Environmental Health, which is funded by the German Federal Ministry of Education and Research (BMBF) and by the State of Bavaria. Furthermore, KORA research was supported within the Munich Center of Health Sciences, Ludwig-Maximilians-Universität, as part of LMUinnovativ. The KORA MRI substudy received funding by the German Research Foundation (Deutsche Forschungsgemeinschaft). The KORA MRI substudy was supported by an unrestricted research grant from Siemens Healthcare.
Competing interests None declared.
Provenance and peer review Not commissioned; externally peer reviewed.
Supplemental material This content has been supplied by the author(s). It has not been vetted by BMJ Publishing Group Limited (BMJ) and may not have been peer-reviewed. Any opinions or recommendations discussed are solely those of the author(s) and are not endorsed by BMJ. BMJ disclaims all liability and responsibility arising from any reliance placed on the content. Where the content includes any translated material, BMJ does not warrant the accuracy and reliability of the translations (including but not limited to local regulations, clinical guidelines, terminology, drug names and drug dosages), and is not responsible for any error and/or omissions arising from translation and adaptation or otherwise.