Social Vulnerability and Human Development of Brazilian Coastal Populations
 Rodrigo Luis Comini Curi
 Maria A. Gasalla
- Fisheries Ecosystems Laboratory (LabPesq), Oceanographic Institute, University of São Paulo, São Paulo, Brazil
There is a considerable gap linking human dimensions and marine ecosystem services with Sustainable Development Goals, and one of these issues relate to differing perspectives and ideas around concepts of human development. There is also a lack of contemporary evaluations of coastal communities from developing nations under the lens of wellbeing and social vulnerability indexes. This study contributes to that discussion by presenting an analysis of Brazilian coastal municipalities, based on two indexes: The Social Vulnerability Index (SVI) and the Municipal Human Development Index (MHDI). These indicators intend to map some aspects of social well-being and development in the Brazilian territory under different perspectives. MHDI illustrates the average population conditions in a certain territory for humans to thrive, while the SVI points more specifically to the lack of assets necessary for wellbeing in a territory. The main aims are to map inequalities between coastal municipalities based on these two indexes and to provide a critical view reinforcing the importance of also considering natural capital as a key issue for wellbeing. Both indexes were developed with data from the Brazilian Institute of Geography and Statistics Census of 2010, the most recent one available for municipalities. Overall, 65.9 and 78% of a total of 387 Brazilian coastal municipalities assessed were ranked below SVI and MHDI country average values, respectively. Both indexes indicated higher human development conditions in Southern municipalities than in Northern ones, especially for income and education conditions, also showing large heterogeneity of discrepancies among and within regions. The importance of combined approaches for local socioeconomic wellbeing improvements, as measured by the MHDI and the SVI, and natural capital optimization seems essential for improvements in coastal communities’ quality-of-life conditions.
Introduction
Coastal regions are expected to degrade in the coming decades due to pollution, overexploitation, climate change, industrial and infrastructure development, and other human interventions, leading to a loss of biodiversity and ecosystem services and requiring integrated actions to deal with associated social impact (Turner et al., 1996; Lam et al., 2020). The pursuit of economic growth as a representation of national development and wellbeing plays a central role in that degradation, also putting at risk the livelihoods of traditional coastal communities, raising concern on the need for a sustainable “blue economy” in the coming decades (Patil et al., 2016; Hoof et al., 2019; Rudolph et al., 2020). The broad goals of global and national development in the coming years are to increase population wellbeing (Sen, 2001; Furtado, 2002; United Nations, 2020), yet natural resources loss due to current economic growth patterns based on fossil fuels, plastic production, air, and water pollution, and forest degradation especially in developing countries puts into question the historical links between economic growth and developmental policies (D’Alisa et al., 2015; D’Alessandro et al., 2020).
There is a considerable gap in linking human dimensions and marine ecosystem services with Sustainable Development Goals, and different perspectives and ideas around human development are a significant issue. There is also a lack of contemporary evaluations of coastal communities under the lens of the wellbeing and social vulnerability of developing nations.
Classical economic theory is based on the core thesis that free markets and individual desire to maximize material wellbeing through consumption will lead to greater collective wellbeing (Spiegal, 1955; Smith, 1996). The dynamics of production, consumption, innovations, and free markets has led to the Gross Domestic Product (GDP) as a proxy for development in national macroeconomic policy. The socioeconomic and income inequalities observed in some countries and between them emerge as one central outcome in the liberal capitalist system (Piketty, 2017, 2020). Together with the global financial and environmental crisis, socioeconomic inequalities opened spaces for alternative development theories, where the State plays an essential role in regulating the economic system, directing investments, GDP growth, and income distribution, and providing essential services to the population, to promote a more equal and sustainable level of wellbeing across the population (Minsky, 1975; Keynes, 2018). Still, the core of the system in this theory is that GDP growth is the ultimate goal of economic development.
Modern socioeconomic inequalities and systemic financial crises put in check the sustainability in the contemporary system along with environmental degradation, particularly due to climate disruption, biodiversity, and biomass loss, to name a few (Victor, 2008, 2011; Ramanathan et al., 2019). These consequences cannot only deteriorate wellbeing but also put the survival of several communities dependent on natural resources at risk.
Alternative development models are progressively emerging, such as the circular economy, political ecology of development, and the Economy of Francesco (Stahel, 1981; Porto-Gonçalves and Leff, 2015; Ellen MacArthur Foundation, 2020; Francesco Economy, 2020). However, key data analysis is required to guide policymakers to evaluate trade-offs and to guide regional development improvements. In parallel with the analytical debate, new ways to measure individual and social wellbeing as a reflection of national and global development are continually emerging, representing alternatives to the index of per capita GDP growth. Among them are the Human Development Index, promoted by the United Nations Development Program (UNDP) in the 1990s (Anand and Sen, 1994), the New Global Multidimensional Poverty Index, launched in 2018 (OPHI, 2018) more aligned with the Sustainable Development Goals, the Social Progress Index, released in 2014 by the Social Progress Imperative (Porter et al., 2014), including intangible variables such as political participation and social diversity inclusion, and the Sustainable Development Index (Hickel, 2020). More recently, the Human Development Report 2020 (UNDP, 2020) proposes an adjustment for the Human Development Index, accounting for planetary pressures (PHDI) recognizing the links between human development and planetary biophysical boundaries.
In the Brazilian context, research institutions are developing alternatives to investigate societal needs and to guide and evaluate public policies. A few examples are the Social Vulnerability Index (SVI) (IPEA, 2020a), the Index of Multidimensional Poverty in Brazil (Barros et al., 2006; Silva et al., 2020), the Sustainable Development Indicators (IBGE, 2015), the Atlas of Violence (IPEA, 2020b), and the Municipal Human Development Index (MHDI) (PNUD et al., 2020). Despite plural purposes, all of these indexes represent different ways to face social problems, enriching the debate on policy roles, and bringing light to the importance of social indicators with other tangible and subjective goods beyond income as their final objective for increasing societal wellbeing.
Brazil has a coast that is 8,500 km long (MMA, 2020) and is one of the most uneven countries in terms of income (Alvaredo et al., 2017) while being the richest in biodiversity (MMA, 2020). It ranked ninth in GDP in 2019 and is also one of the 10 countries in the world with the highest Gini Index (World Bank, 2020). This contradiction suggests that national and regional development policies may be far from ideal, raising concern on the needs of income redistribution, conservation of the natural capital and traditional cultures, and the expansion of social services, especially for vulnerable populations in large cities or located in remote territories.
In this study, we present for the first time the MHDI and the SVI for the whole set of Brazilian coastal municipalities. The study aims to map coastal communities based on their human development and social vulnerability conditions, as a representation of the wellbeing across municipalities.
Human development and social vulnerability are subjective ideas. The MHDI and SVI indexes are proxies of these dynamics conditions, with the following advantages: (i) being available at a municipal level for all Brazilian municipalities, allowing comparative purposes; (ii) both of them were developed to guide local and national policies; (iii) the MHDI considers broad aspects of human development aligned with the international Human Development Index, which makes it easier for future comparative studies with other countries using the same metrics; and (iv) they are well established in Brazil to measure wellbeing conditions. Based on these advantages, both indicators applied to Brazilian coastal municipalities suggest suitability for contrasting regions displaying inequalities as well as to investigate the limits and potentialities in measuring wellbeing as guidance to coastal development policies. We highlight the importance of applying these indexes to the local (municipality) level particularly in the case of long and heterogeneous national coasts like the Brazilian one.
In several countries, studies that develop quantitative social vulnerability assessments at a municipal level have been carried out for different purposes, such as in Portugal (Mendes et al., 2009; Tavares et al., 2018), South Africa (Apotsos, 2019), and Norway (Holand et al., 2011). However, few of them consider the whole national coastal municipalities, such as in France (Mavromatidi et al., 2018) for climate-induced coastal hazards and in Mexico (Seingier et al., 2011a, b) to guide priorities toward sustainable development. Here, the consideration of all the cities of the Brazilian coast in a non-purely economic approach may also be useful as a baseline for international comparison, e.g., under the Organization for Economic Co-operation and Development (OECD) and the Economic Commission for Latin America and Caribbean (ECLAC), since similar methods are reported (OECD and ECLAC, 2019; ECLAC, 2020). The focus of such organizations is to shape policies that foster prosperity and wellbeing, and a critical view of the two prominent social indexes considered in this study can contribute to the debate of innovative ways to measure and guide coastal development.
Materials and Methods
Firstly, we divided the coastal States of Brazil into three different territorial regions based on latitude and longitude (Figure 1): North (more exposed to Equatorial waters, from lat. 3°N to 4°S), East (mostly facing the African continent, from lat. 4°N to 22°), and South/Southeast (from 22° to 34°S). Under these criteria, only the State of Rio Grande do Norte remained ambiguously placed into two zones, which was remedied by placing it into the East group following the Brazilian National Institute of Geography and Statistics (IBGE) classification (IBGE, 2020a) as Northeast.
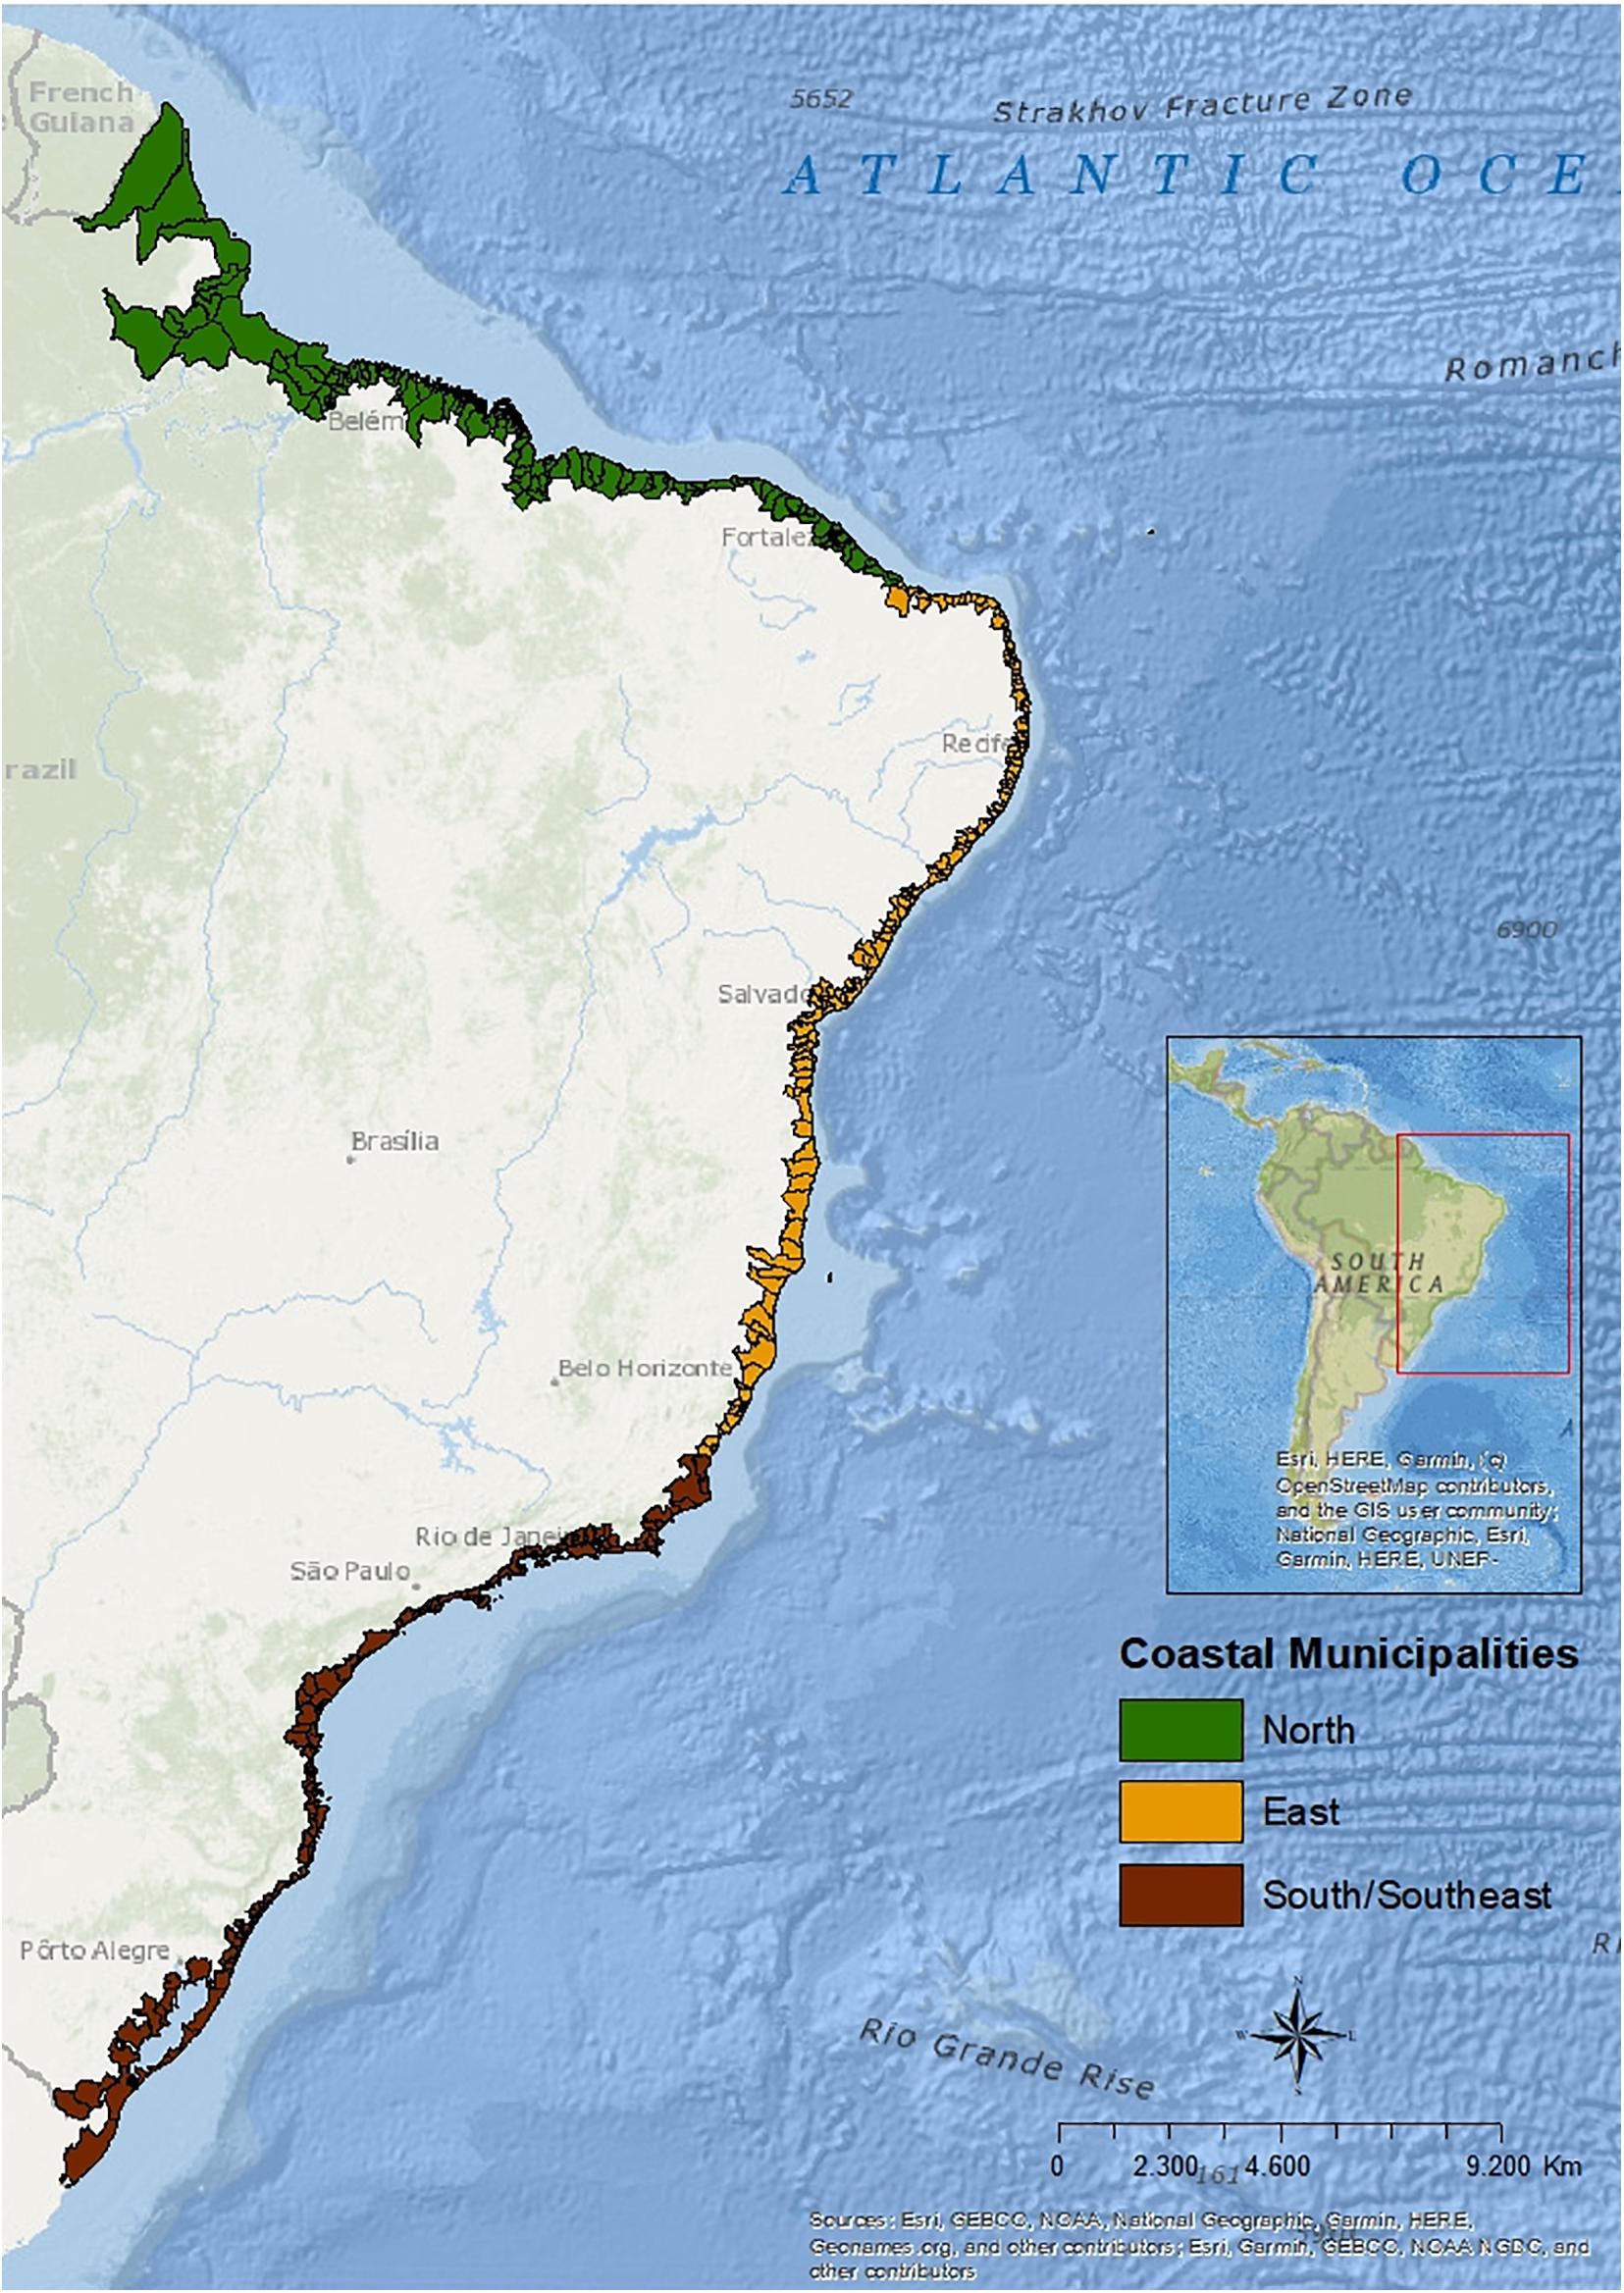
Figure 1. Map of Brazil with the three coastal regions defined by this study. Elaborated by the authors.
All coastal municipalities of Brazil were considered in the analysis, totaling 387 units distributed across the three coastal territorial regions defined above. Thus, coastal municipalities from the Brazilian states of Amapá, Pará, Maranhão, Piauí, and Ceará were here considered as Northern region (N). The Eastern region (E) was composed of the coastal municipalities located in the states of Rio Grande do Norte, Paraíba, Pernambuco, Alagoas, Sergipe, Bahia, and Espírito Santo. Finally, the Southeast/South (SES) region represented the coastal municipalities located in the states of Rio de Janeiro, São Paulo, Paraná, Santa Catarina, and Rio Grande do Sul. Data were plotted by coastal municipalities and by States.
To describe the municipalities’ socioeconomic conditions, both the MHDI and the SVI (PNUD et al., 2013; IPEA, 2015, respectively) were applied. Both indexes are based on data from the Brazilian Institute of Geography and Statistics (IBGE, 2020b) demographic census, given its advantages of being one of the most developed sources for socioeconomic data for Brazilian municipalities, with rigorous methodology and comparability through time (Costa et al., 2018). Due to the geographic range, level of detail, cost, and complexity, the Brazilian census is taken every 10 years, most recently in 2010. Given this limitation, the SVI and MHDI presented here refer to the census results of 2010. The IBGE demographic census is the most accessible and rigorous source of the country, and 2010 represents the best and most recent available statistics that will shape the analysis. It also should be noted that in the decade from 2010 to 2020, the country suffered from many political, economic, and social crises, which may have been aggravated by the COVID-19 pandemic. In that sense, these datasets may be dated to reflect the present state.
The MHDI was created similarly to the international Human Developing Index but adapted for the Brazilian socioeconomic realities and data availability (PNUD et al., 2013). The index is calculated by the geometric mean of three dimensions: Longevity (MHDI-L), education (MHDI-E), and income (MHDI-I), all with the same weight. Before the dimension calculations, all variables are normalized to be in the same metrics, from 0 to 1. The dimensions of longevity and income are composed by one variable each, life expectancy at birth and per capita income, respectively. The education dimension is composed of five variables, divided into two sub-dimensions: The level of education and the frequency attend school (Table 1). The calculation of the education dimension is divided into two steps: The arithmetic mean of the frequency attend school variables, all with the same weight, and then the geometric mean of the two sub-dimensions, the level of education with a weight of one and the frequency attend school with a weight of two.
Table 1. The indicators and dimensions of MHDI.
The SVI is an index to map conditions of social vulnerability in the Brazilian territory (IPEA, 2015). Social vulnerability is here understood as the population’s lack of accessibility to assets or conditions necessary to sustain the population’s wellbeing. It is important to note that the population’s wellbeing is a subjective concept and is variable across diverse cultures and social behaviors, and the SVI is a proxy for the vulnerability to poverty or social marginalization, linked to basic material conditions, such as income levels and access to urban infrastructure (Costa et al., 2018).
The SVI is calculated by the arithmetic mean of three dimensions: Urban infrastructure (SVI-IU), human capital (SVI-HC), and income and labor (SVI-IL), all of them with the same weight. The three dimensions are composed of a total of 16 variables: 3 representing the urban infrastructure, 8 for the human capital dimension, and 5 for income and labor. All the variables were normalized for the dimension construction, to align them into the same metric pattern. So, both the SVI and its three dimensions vary from 0 to 1. After the normalization process, each variable receives a weight for the calculation of its respective dimension. The dimensions are calculated by the arithmetic mean of its variables, considering its weights (Table 2).
Table 2. The indicators and dimensions of SVI.
Therefore, both indexes range from 0 to 1, but in an opposite metric in terms of wellbeing classification. While values closer to 1 illustrate metrically higher human development for the MHDI, it represents a higher social vulnerability for the SVI. Similarly, values close to 0 represent lower social vulnerability conditions for the SVI and lower human development for the MHDI.
MHDI is divided into five levels: Very low human development (values from 0 to 0.499), low human development (0.500–0.599), medium human development (0.600–0.699), high human development (0.700–0.799), and very high human development (0.800–1). SVI is also divided into five levels: Very low social vulnerability (0–0.200), low social vulnerability (0.201–0.300), medium social vulnerability (0.301–0.400), high social vulnerability (0.401–0.500), and very high social vulnerability (0.501–1).
After mapping both indexes, we tested the statistical significance of the differences in the SVI and MHDI between regions. Since within each region, not all data are normally distributed, the Wilcoxon test was applied to check differences between regions’ distributions by using the R software, function wilcox.test.
Finally, the relationship between the levels of SVI and MHDI and the presence of natural reserve areas in the municipalities was tested by the correlation between the indexes’ results and the presence of national extractive reserves. This was intended in order to consider the importance of natural capital when defining development and wellbeing policy measurements. The Brazilian national extractive reserves are protected areas defined by law that are granted to traditional communities, mainly sustained by resources extraction and complemented by subsistence farming. Their goal is to maintain the livelihood needs and culture of traditional communities, as well as ensuring the sustainable use of natural resources. Here, it gives an idea of natural resources located in the municipalities along the coast. Data for extractive reserve areas were obtained from the Brazilian Conservation Units Panel, from the National Ministry of the Environment. For the correlation test, we considered only coastal municipalities where extractive reserve areas data were available.
Results
The Municipal Human Development Index
Figures 2–4 present the MHDI for the three analytical regions defined in this paper. From 107 municipalities classified in the Northern region, 41.1% of them presented low or very low level of MHDI, being the only region with very low levels of MHDI (Figure 2). In the Eastern region, from 160 municipalities, 34.4% presented low or very low level of MHDI (Figure 3). Finally, in the SES region, from 120 municipalities, only one presented low MHDI. These differences between regions are substantial (Figure 4).
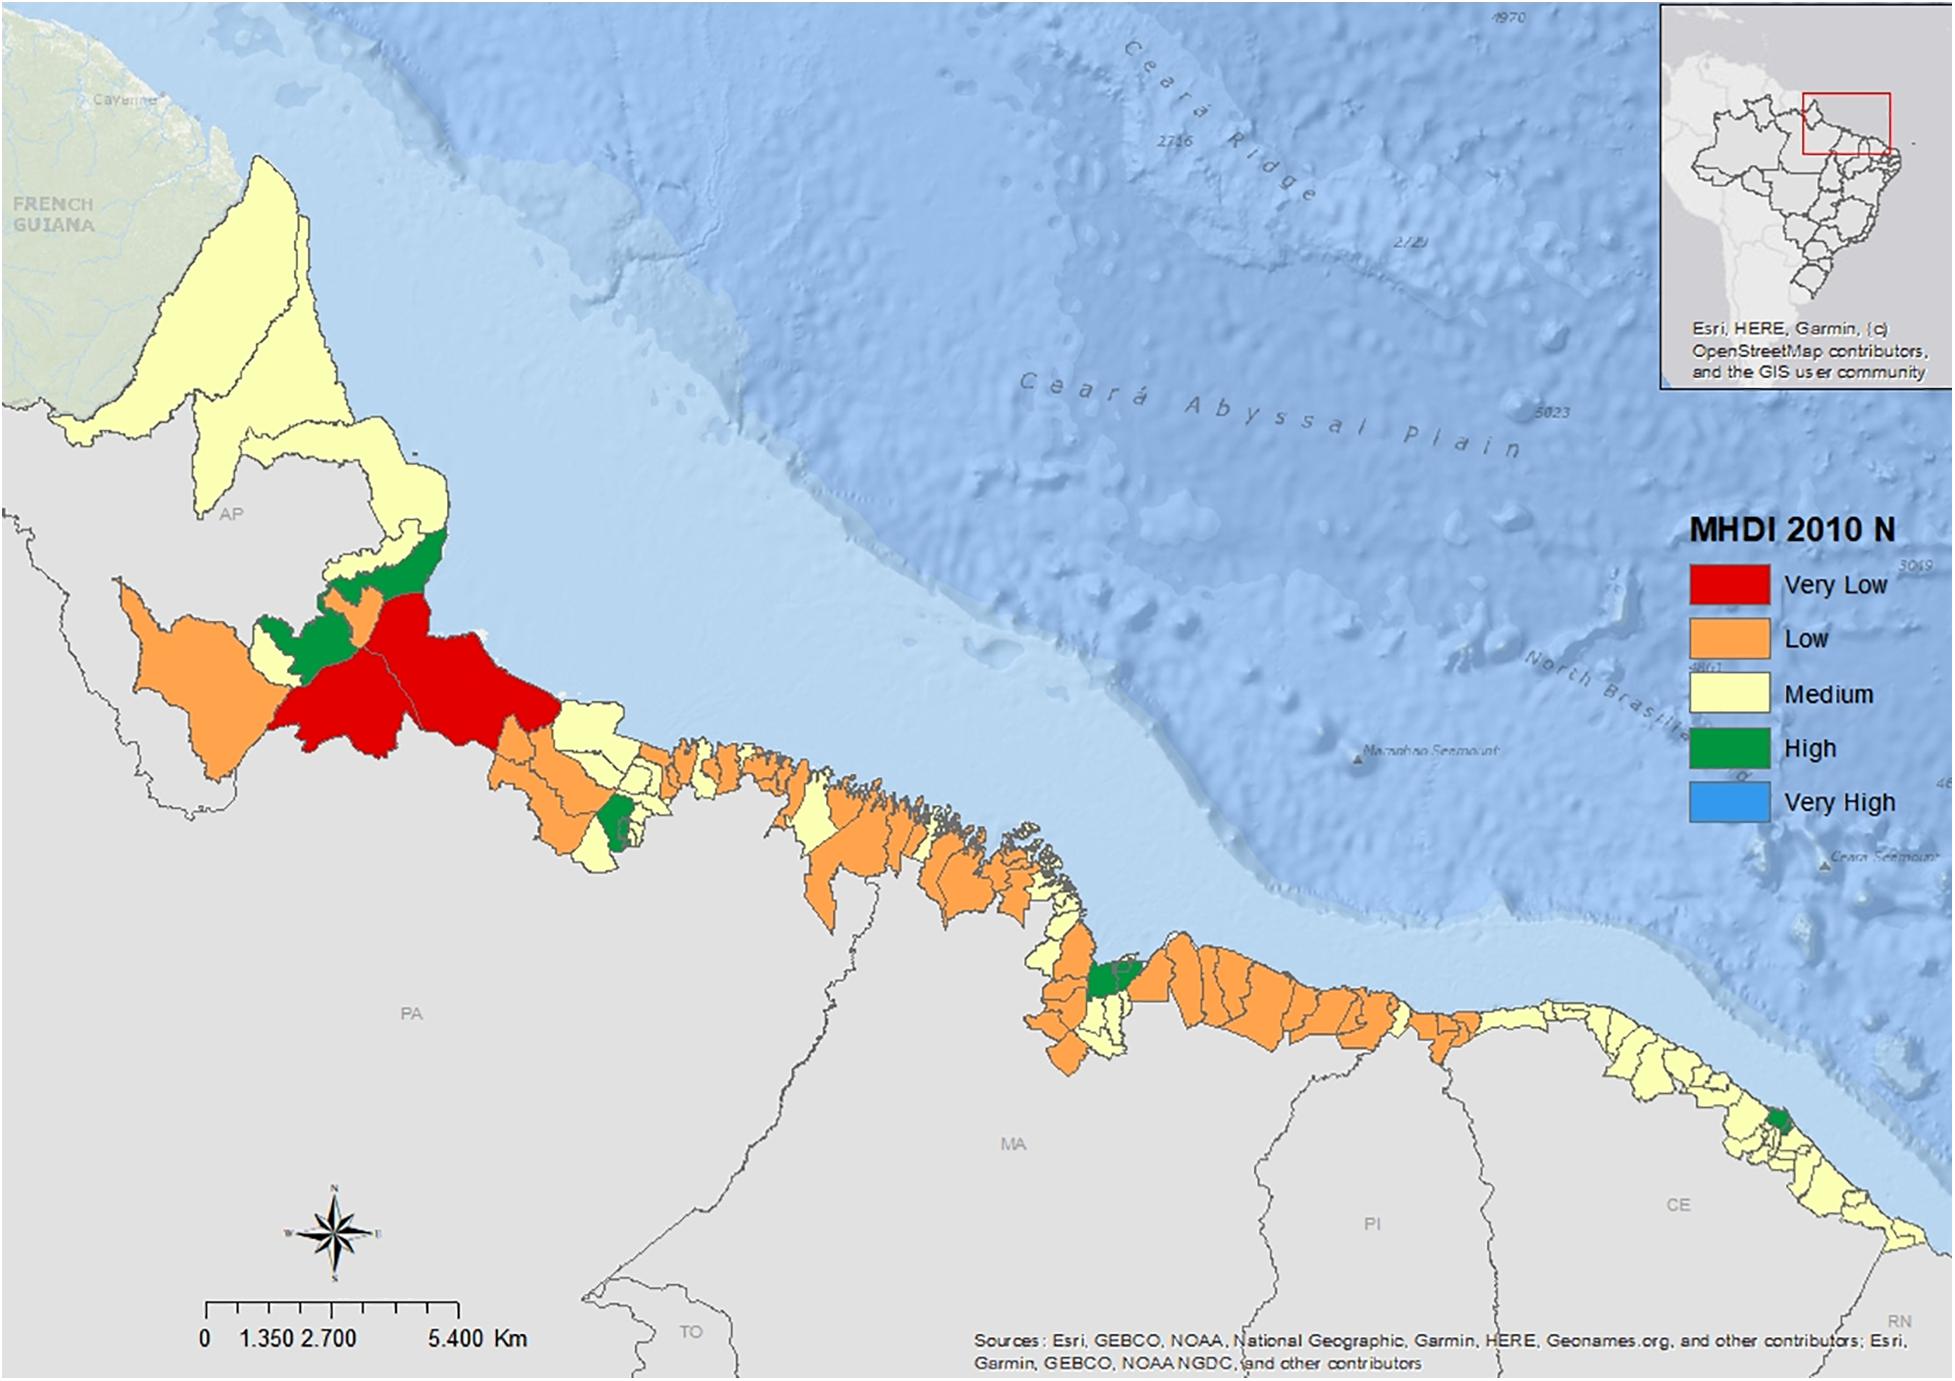
Figure 2. MHDI for the North coast municipalities. Elaborated by the authors with data from PNUD et al. (2020).
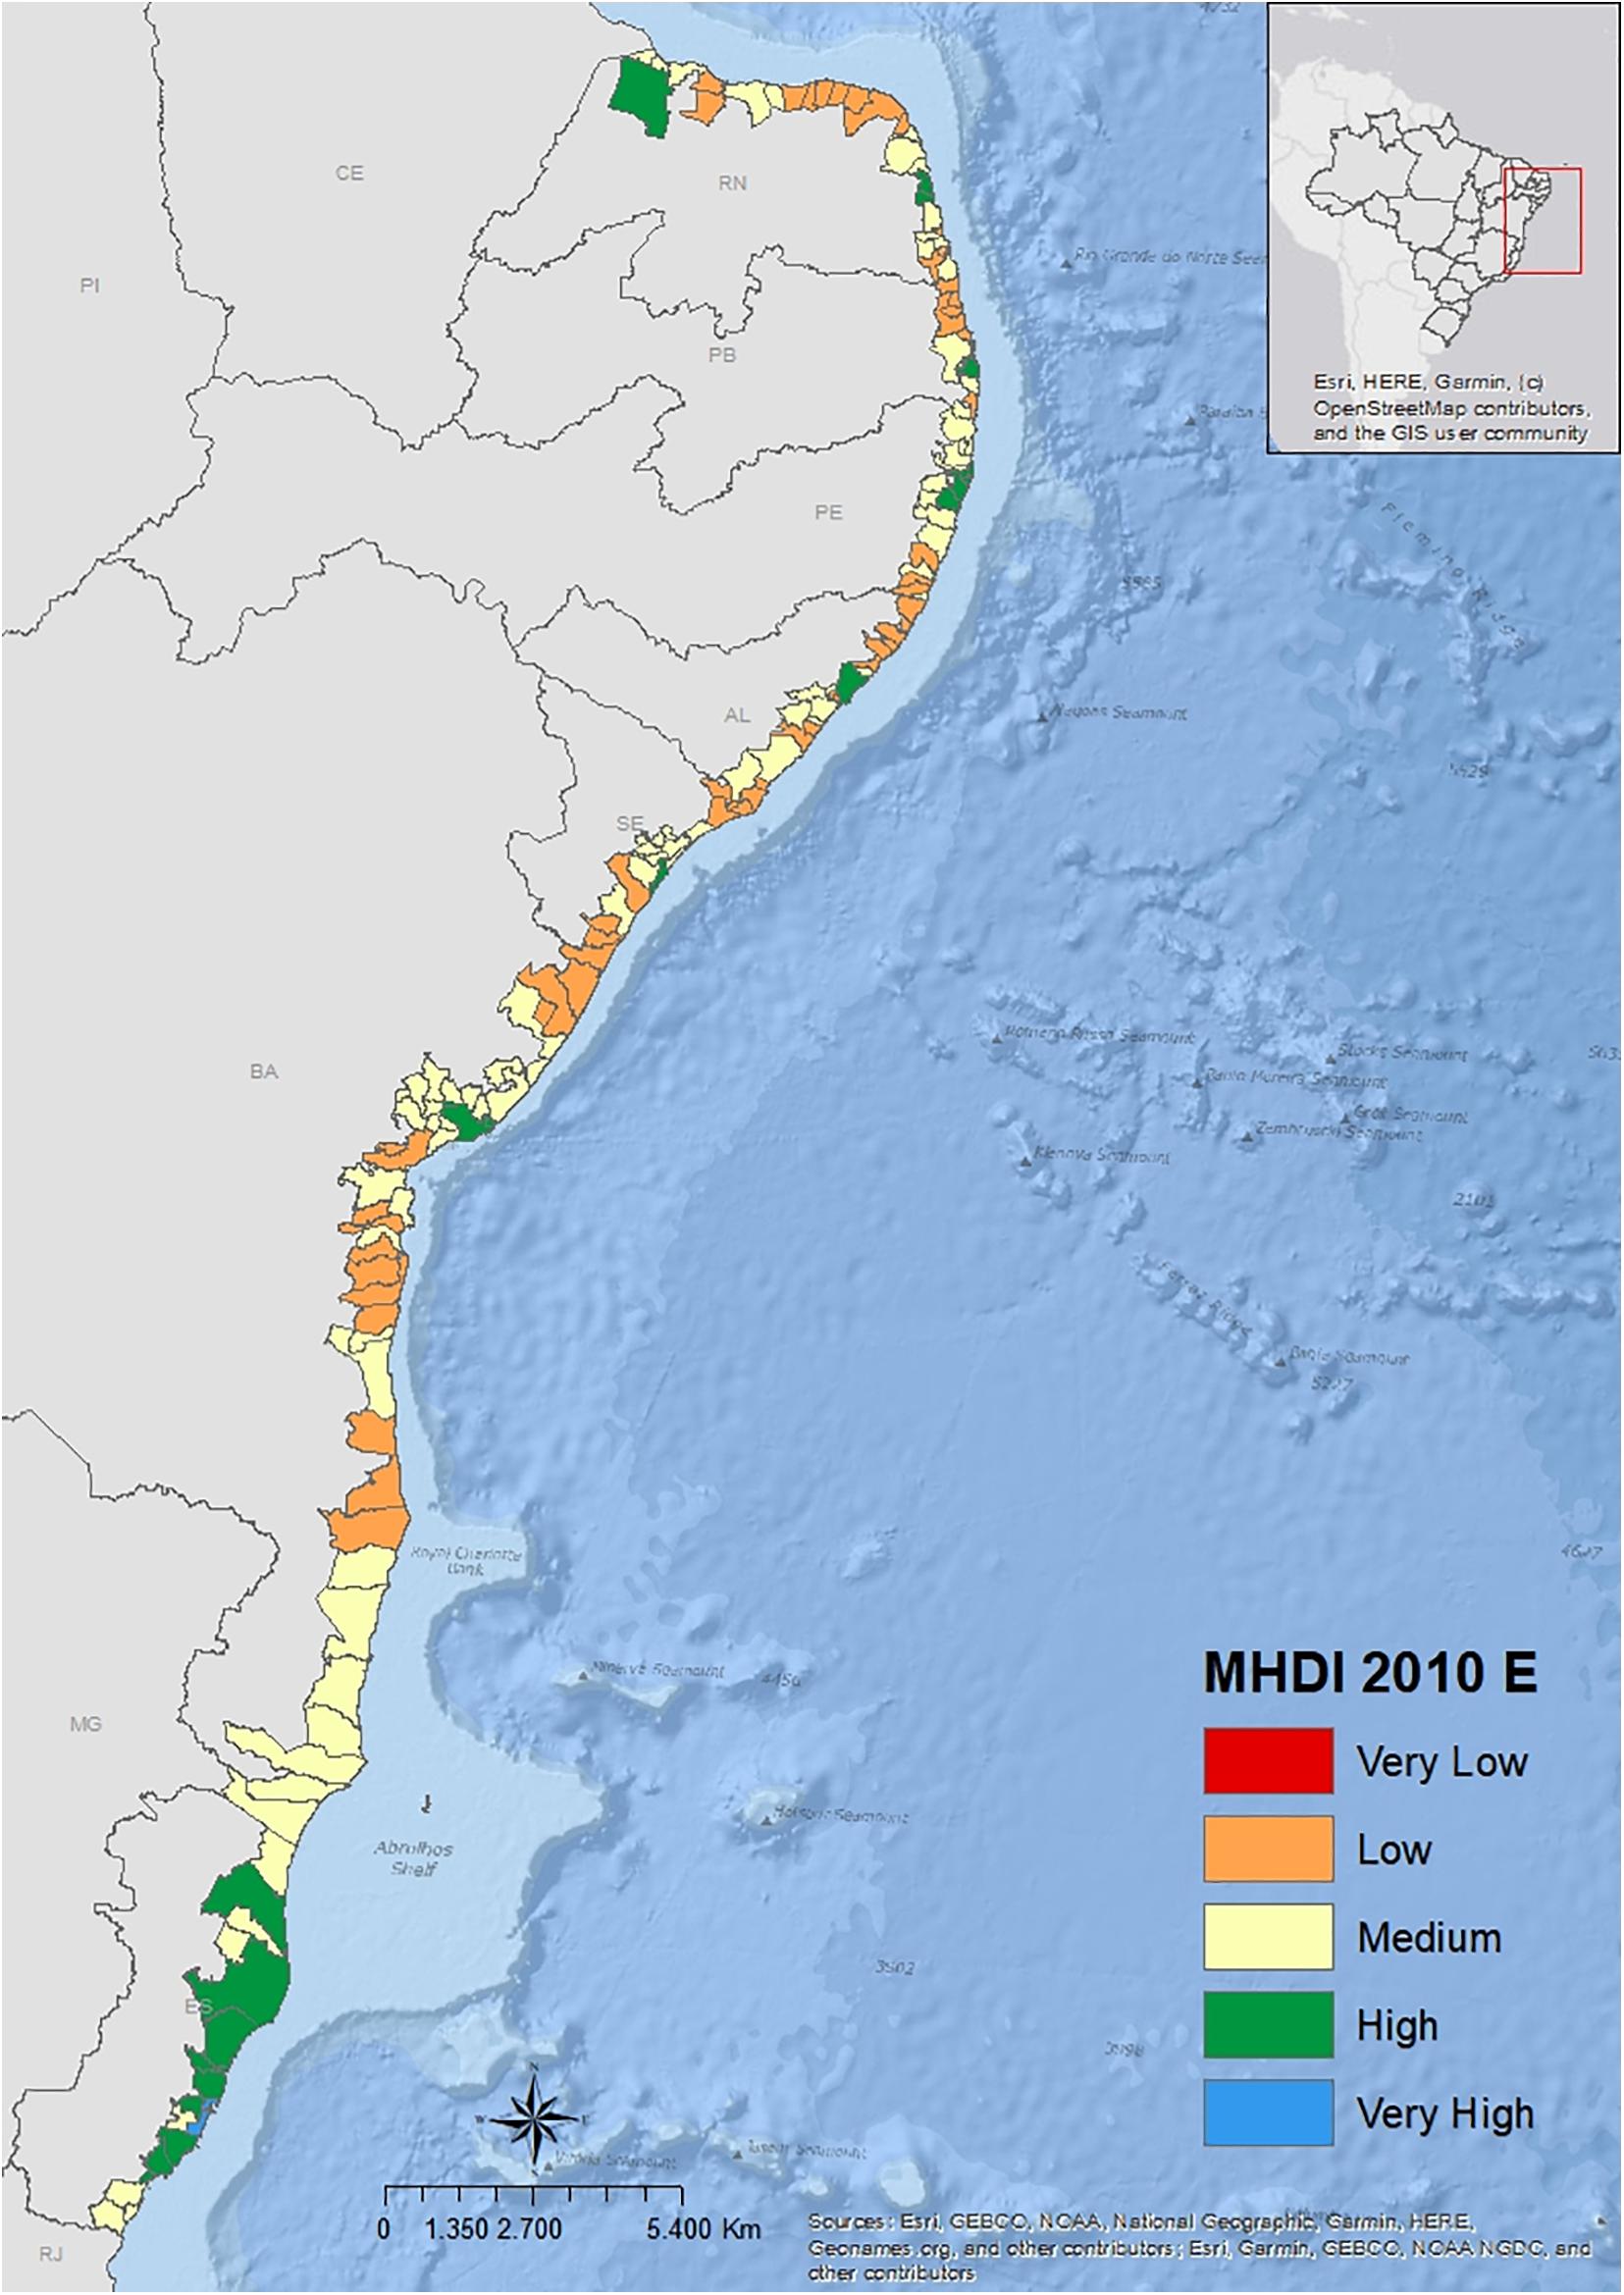
Figure 3. MDHI for the East coast municipalities. Elaborated by the authors with data from PNUD et al. (2020).
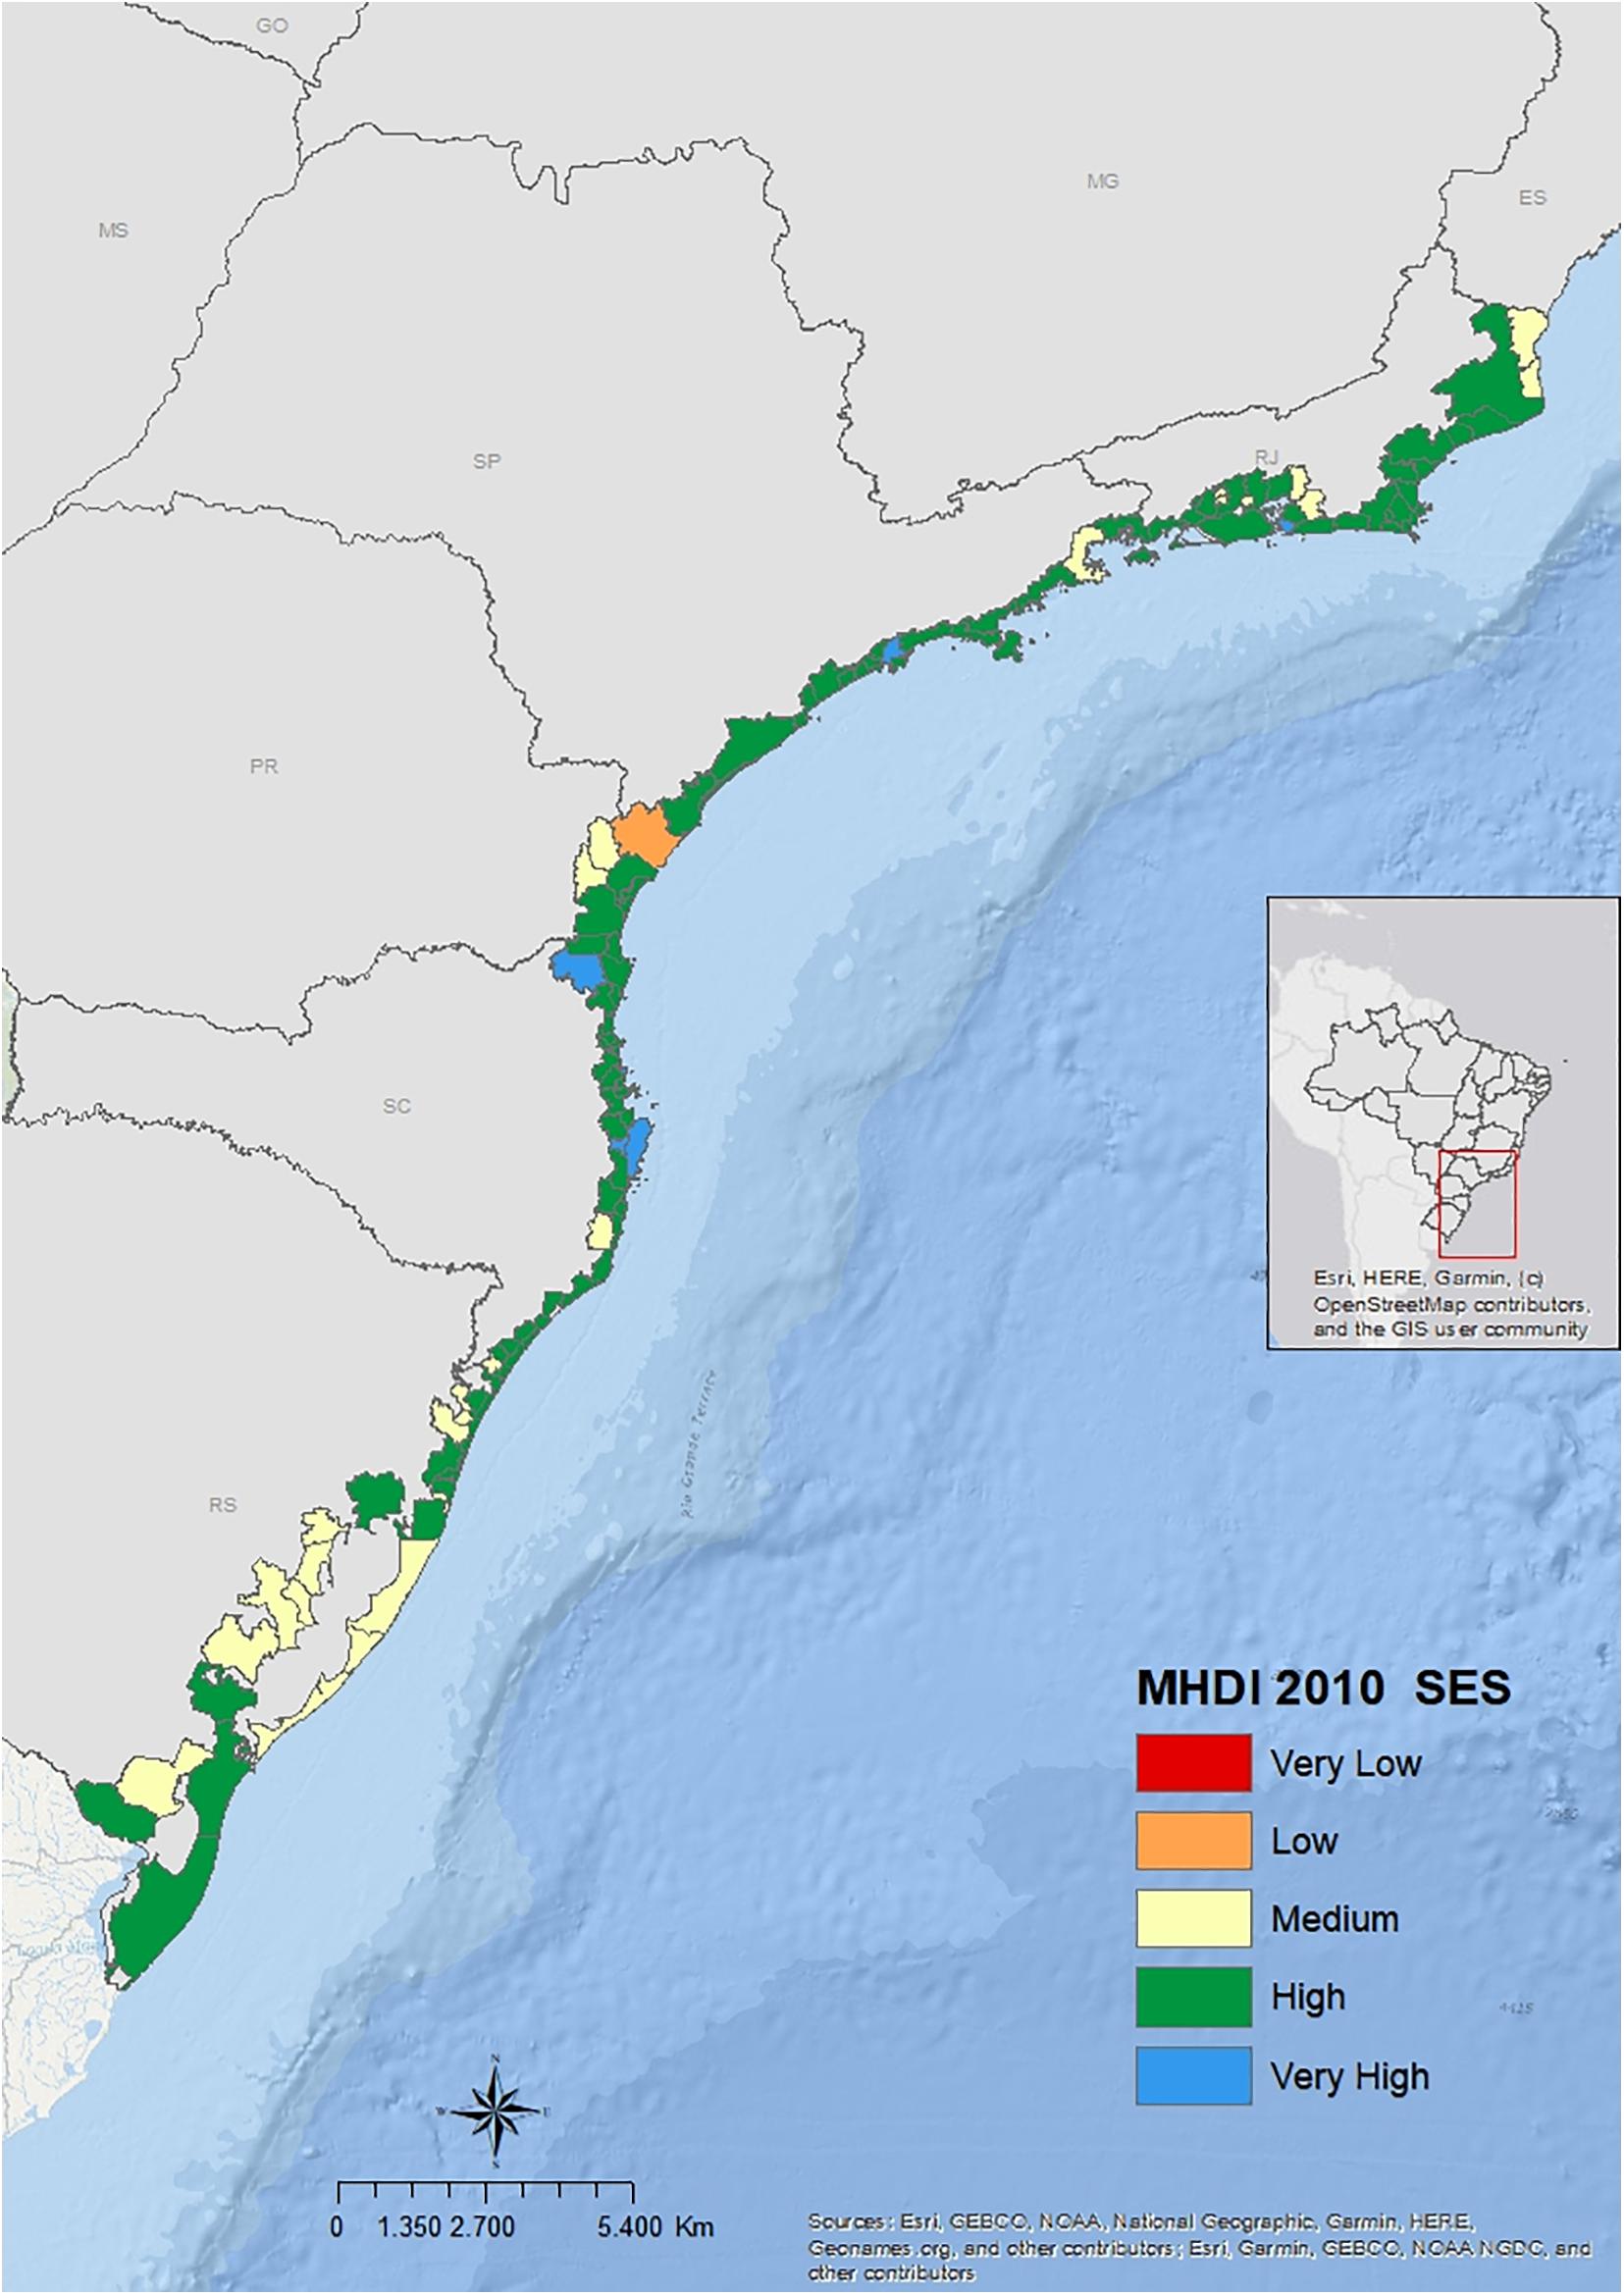
Figure 4. MDHI for the South coast municipalities. Elaborated by the authors with data from PNUD et al. (2020).
Most Eastern region cities illustrated in Figure 3 were classified as having low or medium MHDI, but with more incidences of high MHDI as well, especially in the Espírito Santo state, the frontier with SES municipalities. The South/Southeast municipalities presented an opposite direction, where most of the cities were classified with a high level MHDI. It was the only region with a couple of municipalities with very high MHDI.
Therefore, based on that index and the results shown on the maps, unequal conditions of human development were observed in the Brazilian coastline municipalities, where the SES cities presented higher levels of this indicator. Statistically, the difference between regions are significant (Wilcoxon test, p-value = 0.005 comparing North and East distributions; p-value < 2.2e-16 comparing North and SES; p-value < 2.2e-16 comparing East and SES distribution).
Because MHDI is a synthetic index formed by several other variables, we consider it important to investigate the results of each one of these indicators to identify in what measure MHDI could reflect the wellbeing of the Brazilian coastal communities and what variables made the inequalities of MHDI between municipalities more prominent. Figure 5 shows the municipalities’ distribution based on its MHDI dimensions values for 2010, for each region. When comparing the three dimensions, we observed higher inequalities between regions for the income dimension (MHDI-I), composed of per capita income. The education dimension (MHDI-E) illustrated higher variability for each region in terms of municipal results, but lower differences between regions, with the North results slightly higher than the East one, and the SES cities with lower variability and part of municipalities with higher educational levels. Finally, for the longevity dimension, the results were more concise for the three regions, with better results for the SES.
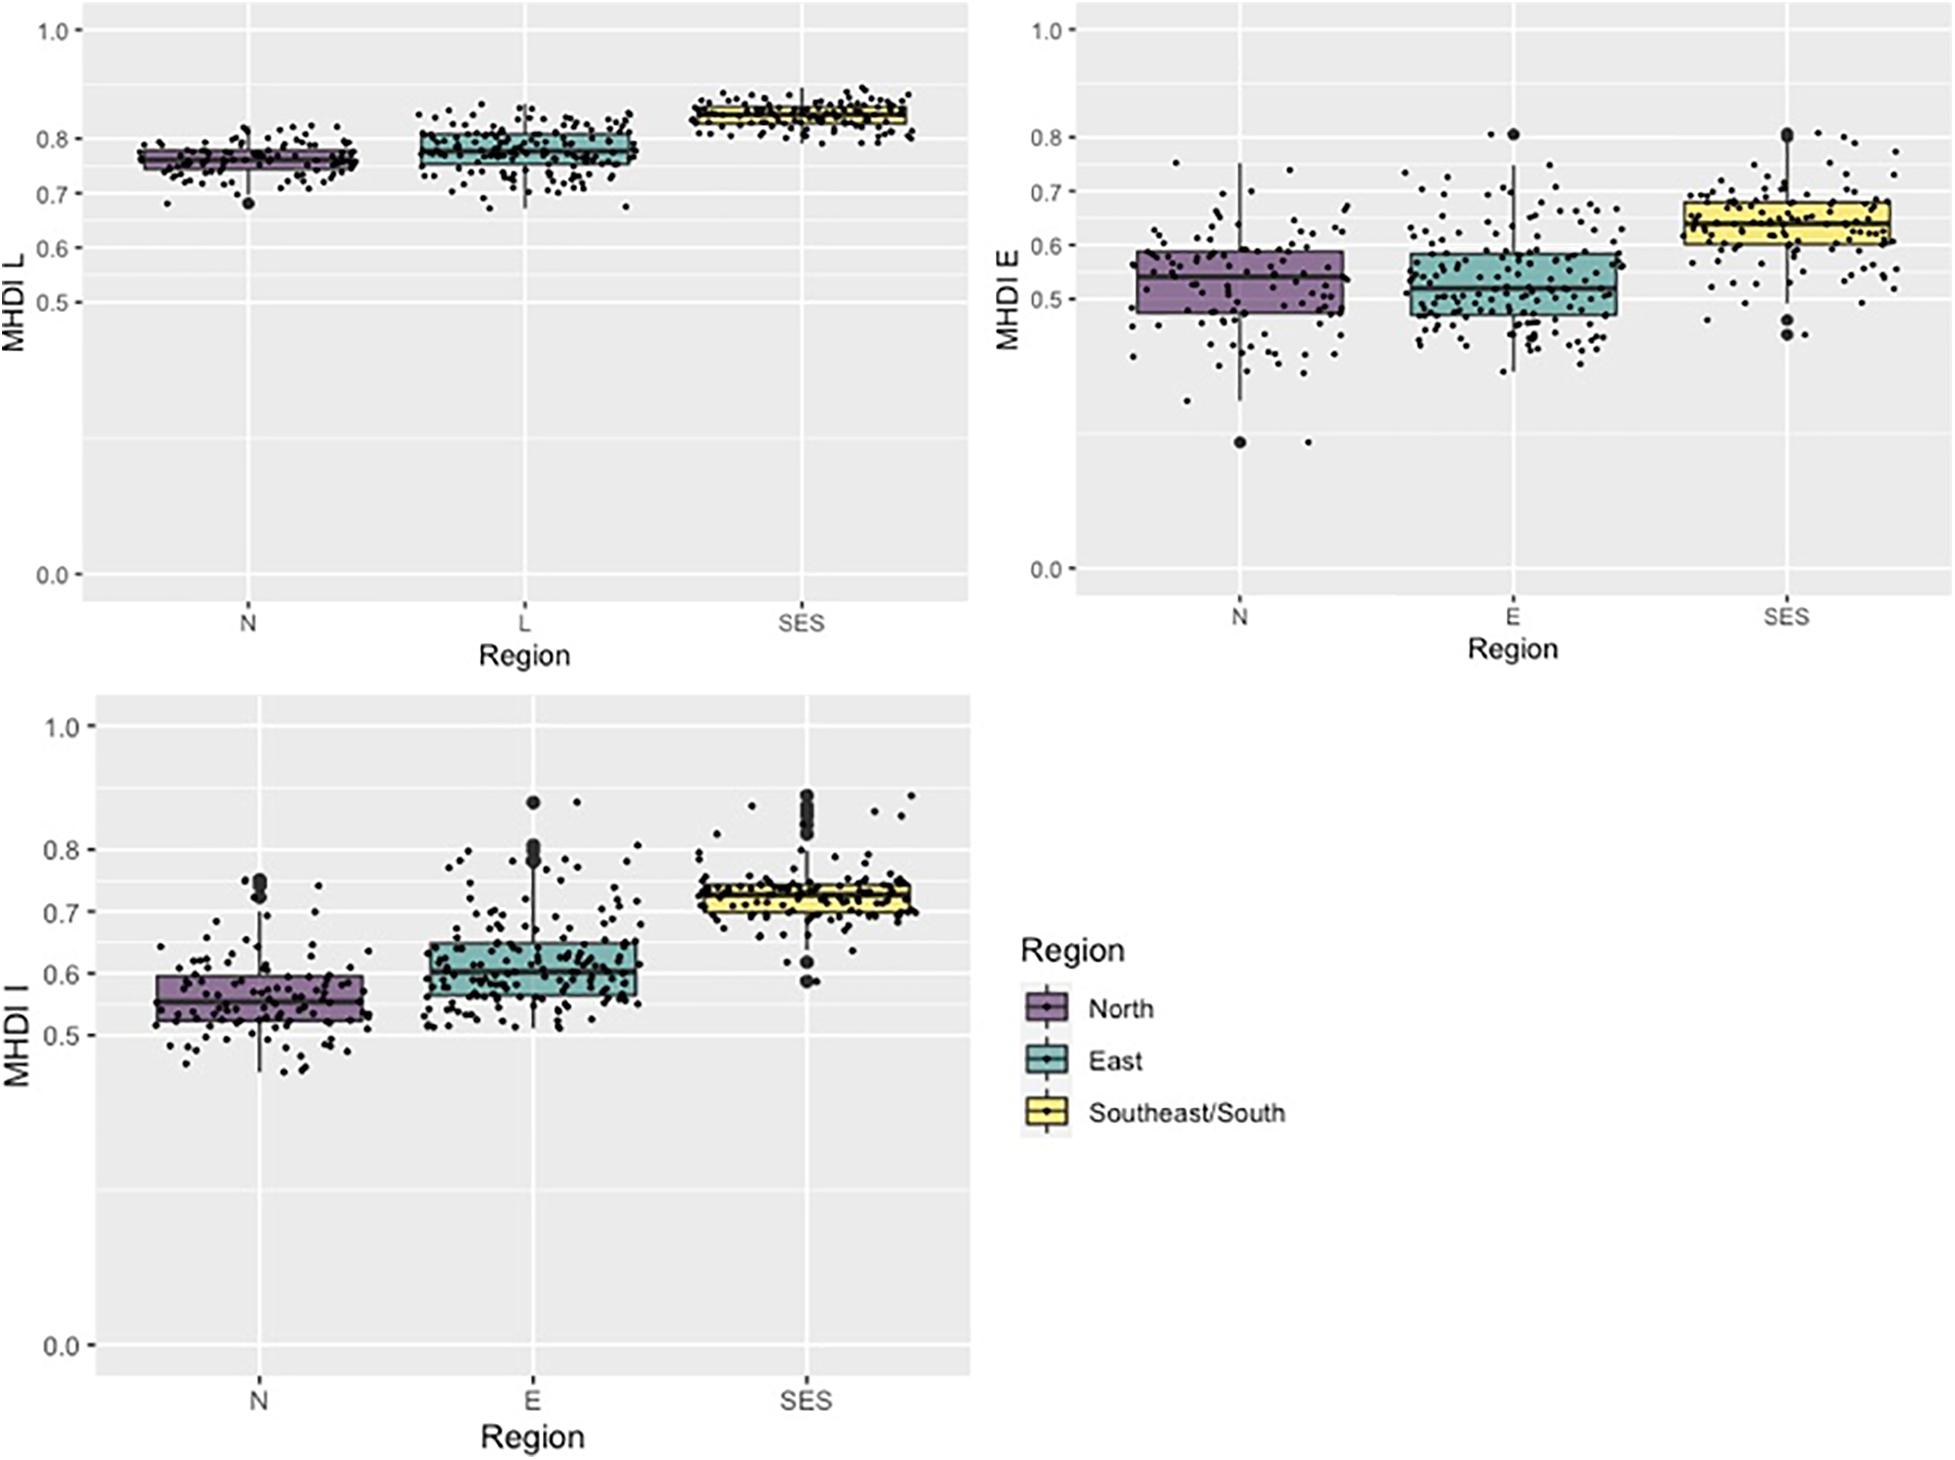
Figure 5. Distribution of the coastal municipalities for their MDHI dimensions. Elaborated by the authors with data from PNUD et al. (2020).
Finally, Figures 6, 7 present the distribution of the municipalities for each region based on MHDI indicators values for 2010. The SES region presented more municipalities with higher per capita income values (Figure 6B), relative to the other two regions. In terms of education (Figure 7), the North and East regions illustrated a higher frequency of children aged 5–6 years attending school. The East presented also slightly better results when considering the proportion of the population aged 11–13 years attending the final years or that conclude primary school (FUND11A13) and for the proportion of the population aged 15–17 years that concluded primary school (FUND15A17). In the East, and especially in the North, the educational levels start to get lower for the older population, probably a reflection of the necessities to start working earlier to fill livelihood demands. In terms of longevity, represented by the life expectancy at birth (Figure 6A), for the East and North regions, the majority of municipalities presented an average result between 70 and 80 years, while for the SES, the concentration was not so different, from 75 to 80 years.
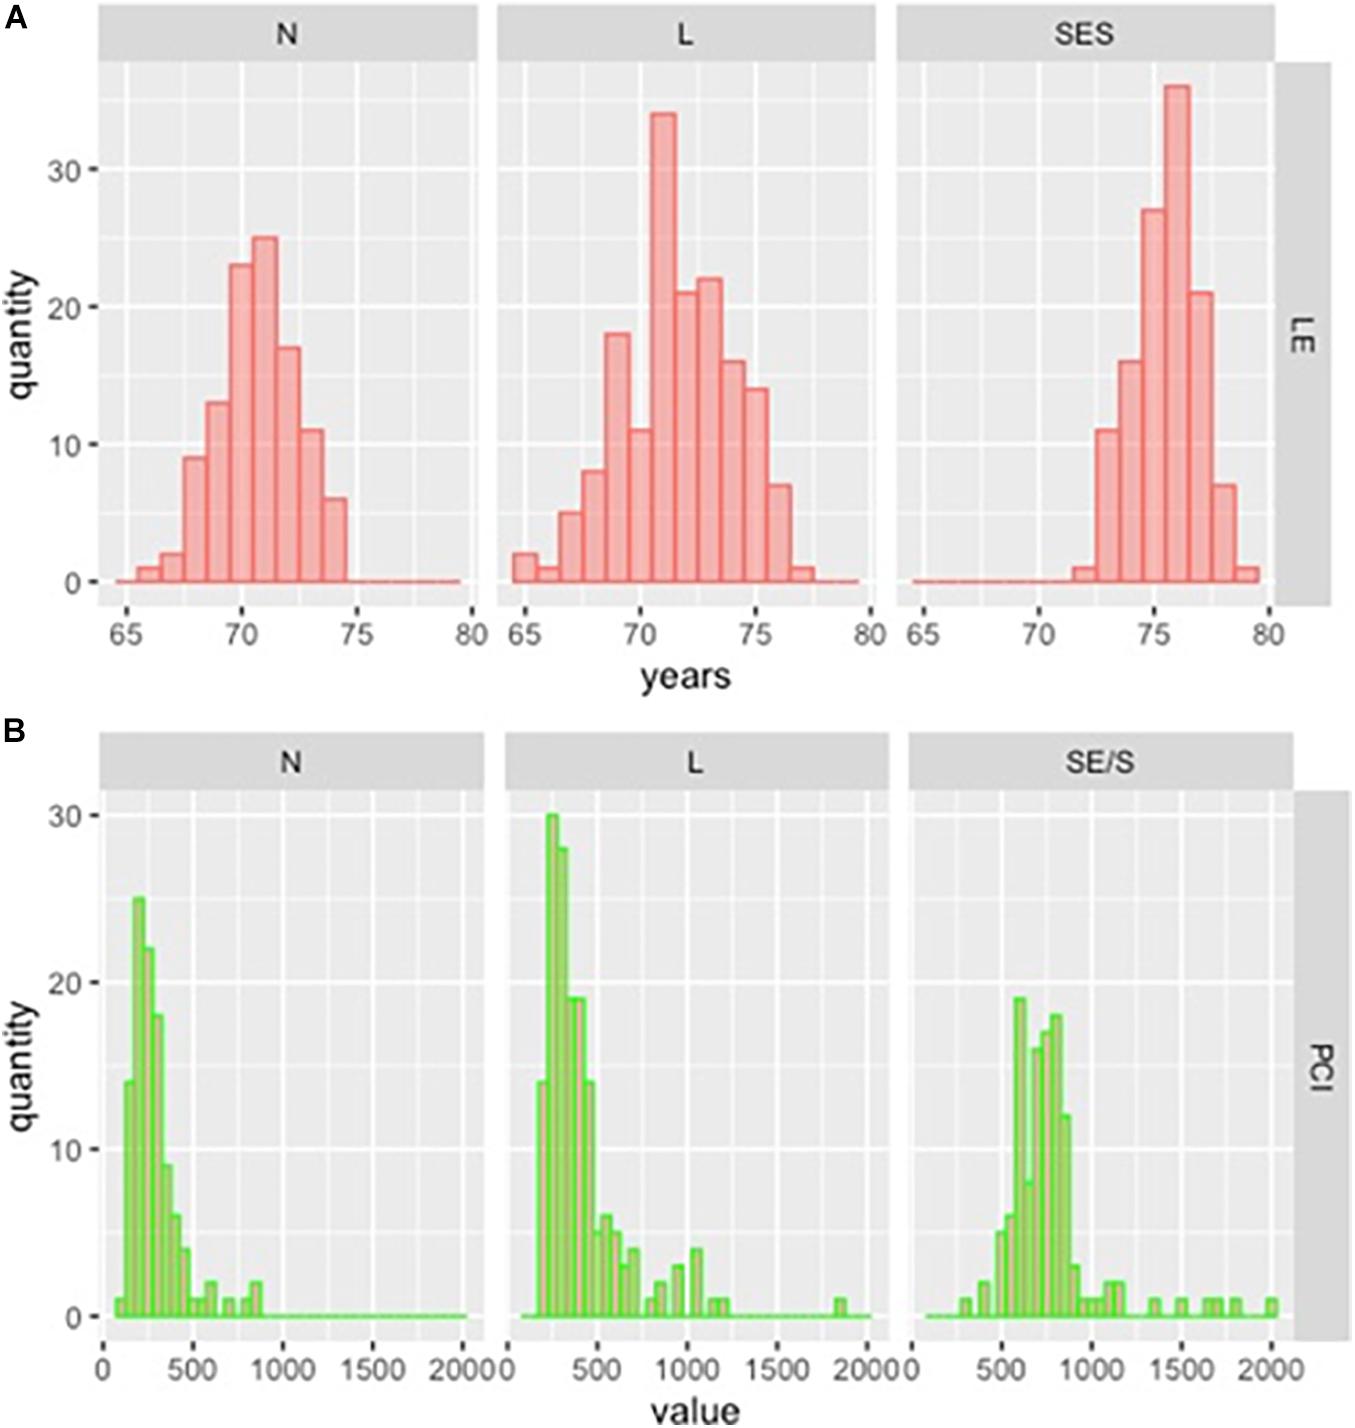
Figure 6. Histogram of the municipal distribution based on the HDMI indicators of (A) life expectancy at birth and (B) per capita income. Elaborated by the authors with data from PNUD et al. (2020).
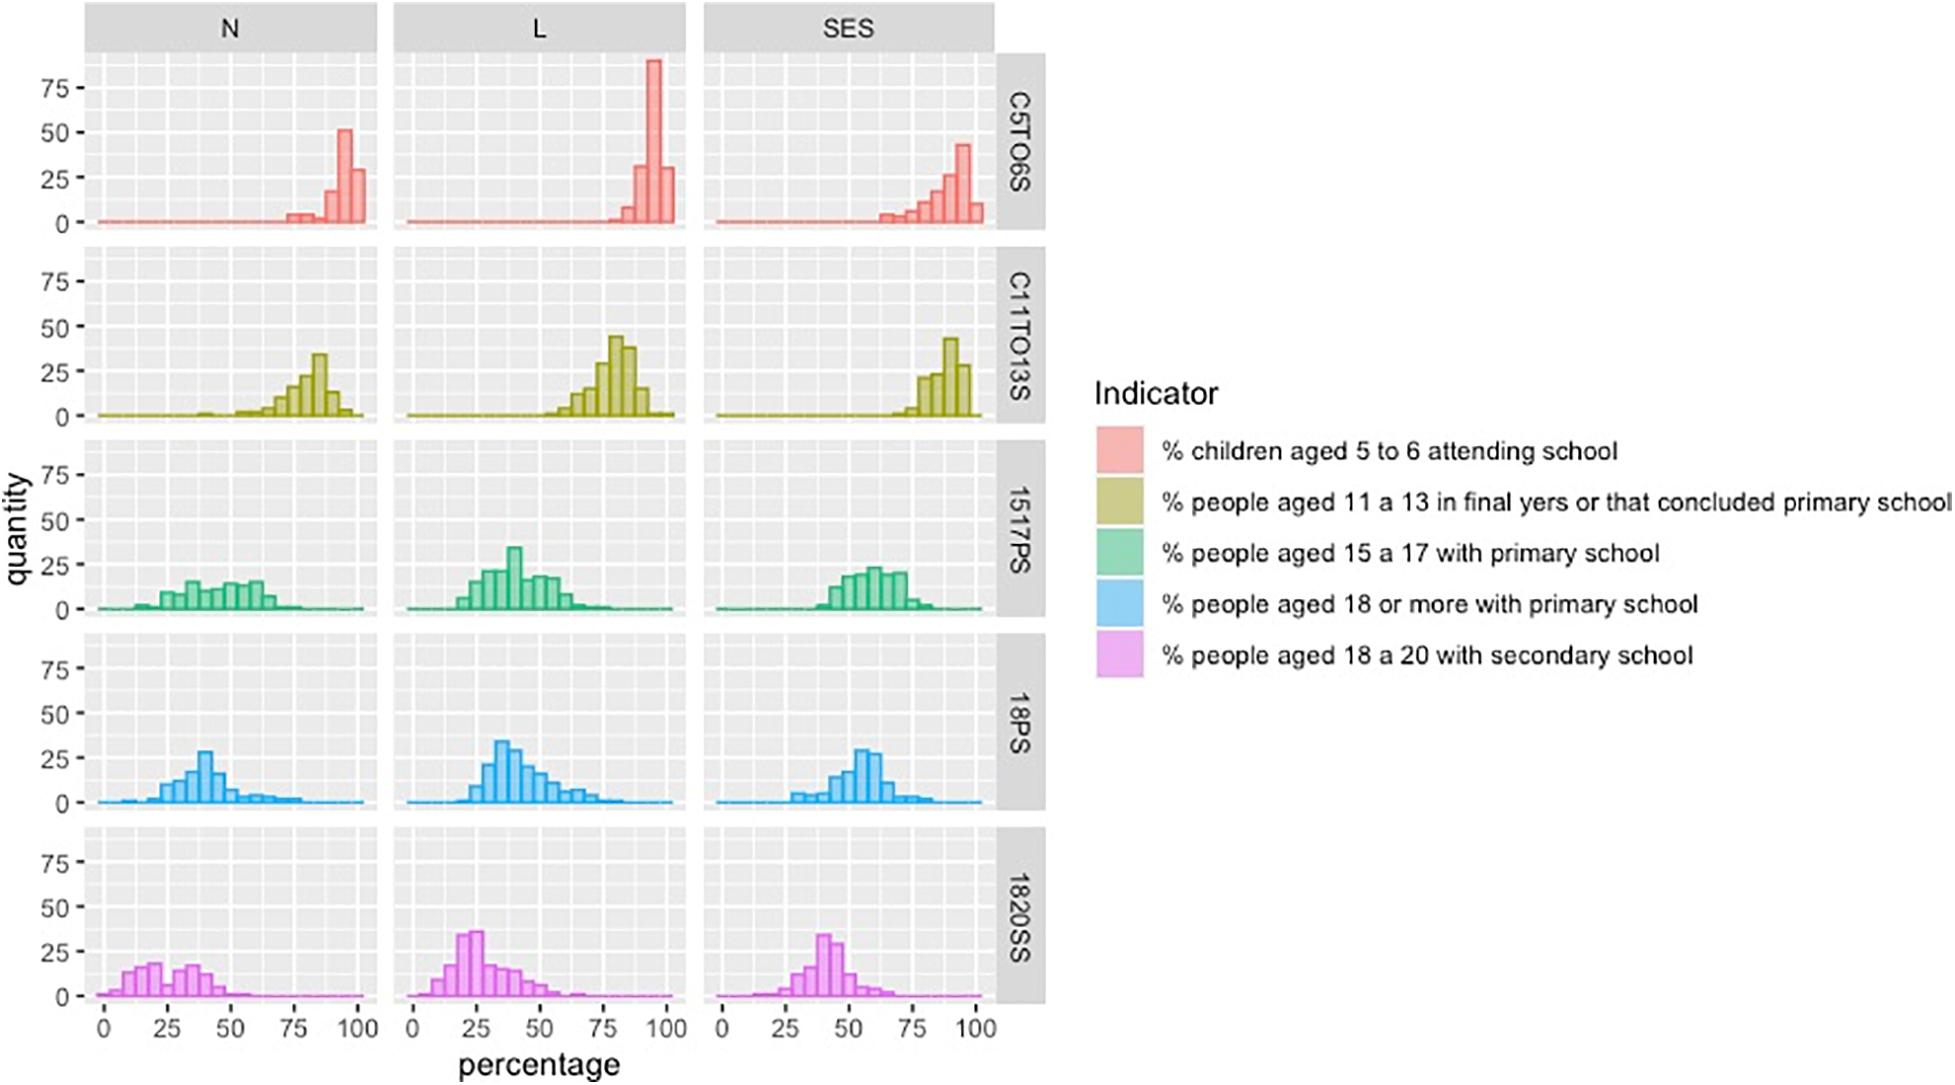
Figure 7. Histogram of the municipal distribution based on the HDMI indicators of the Educational Dimension. Elaborated by the authors with data from PNUD et al. (2020).
The Social Vulnerability Index
Figures 8–10 illustrate the levels of the SVI for coastal line municipalities. SVI offers a different perspective to investigate the wellbeing for this territory, once the focus now is more specific, the social vulnerability to poverty and social exclusion, understood as the insufficiency or inaccessibility of certain goods and services necessary for the livelihood, that are not easily accessed by individuals and request the attention of public policies (IPEA, 2015).
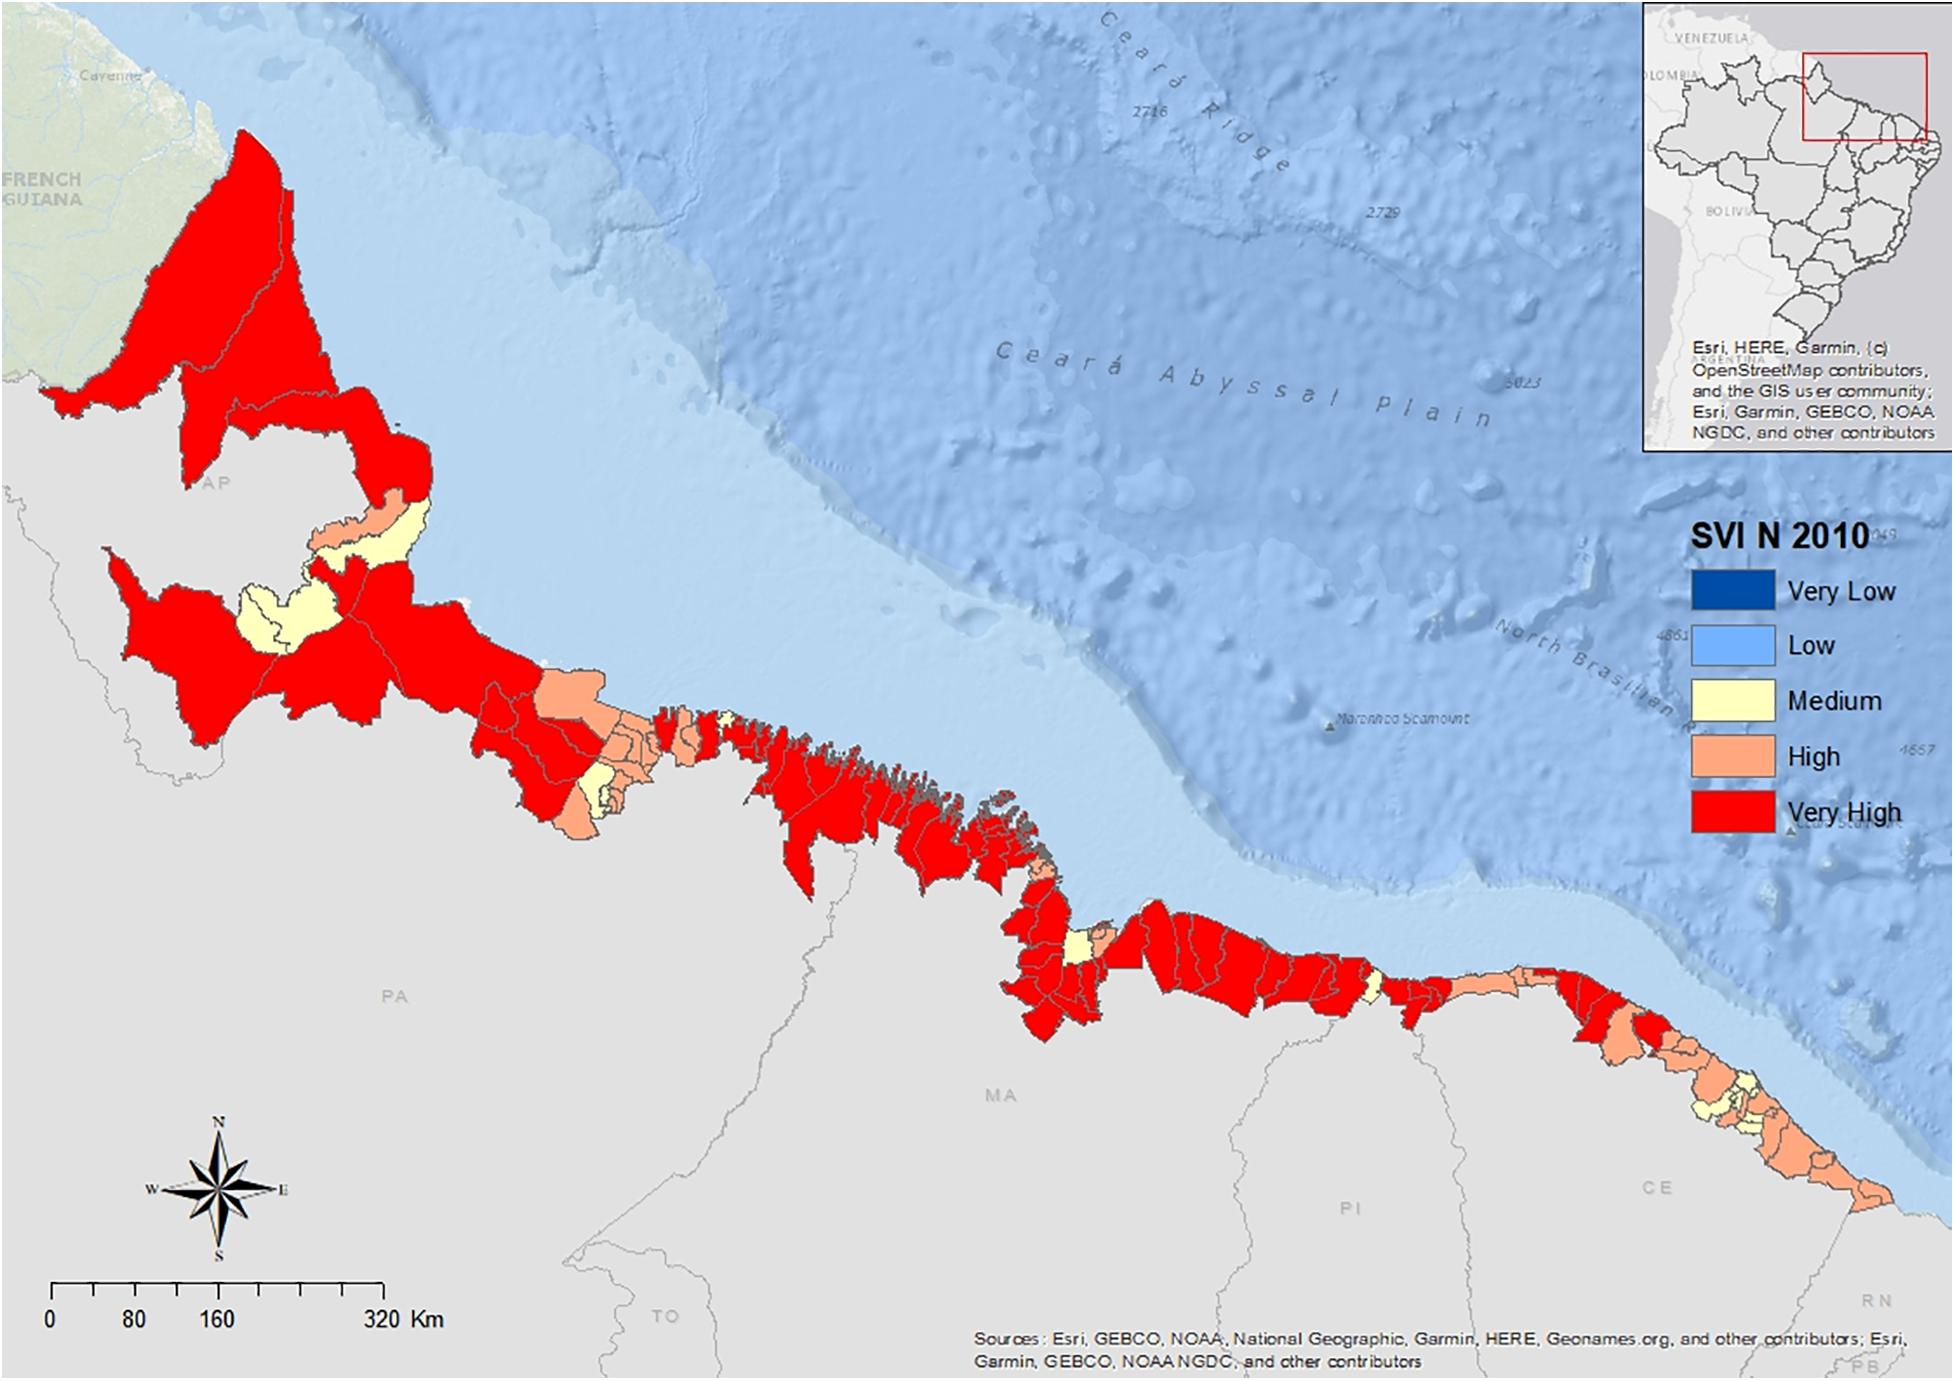
Figure 8. SVI for the North coast municipalities. Elaborated by the authors with data from IPEA (2020a).
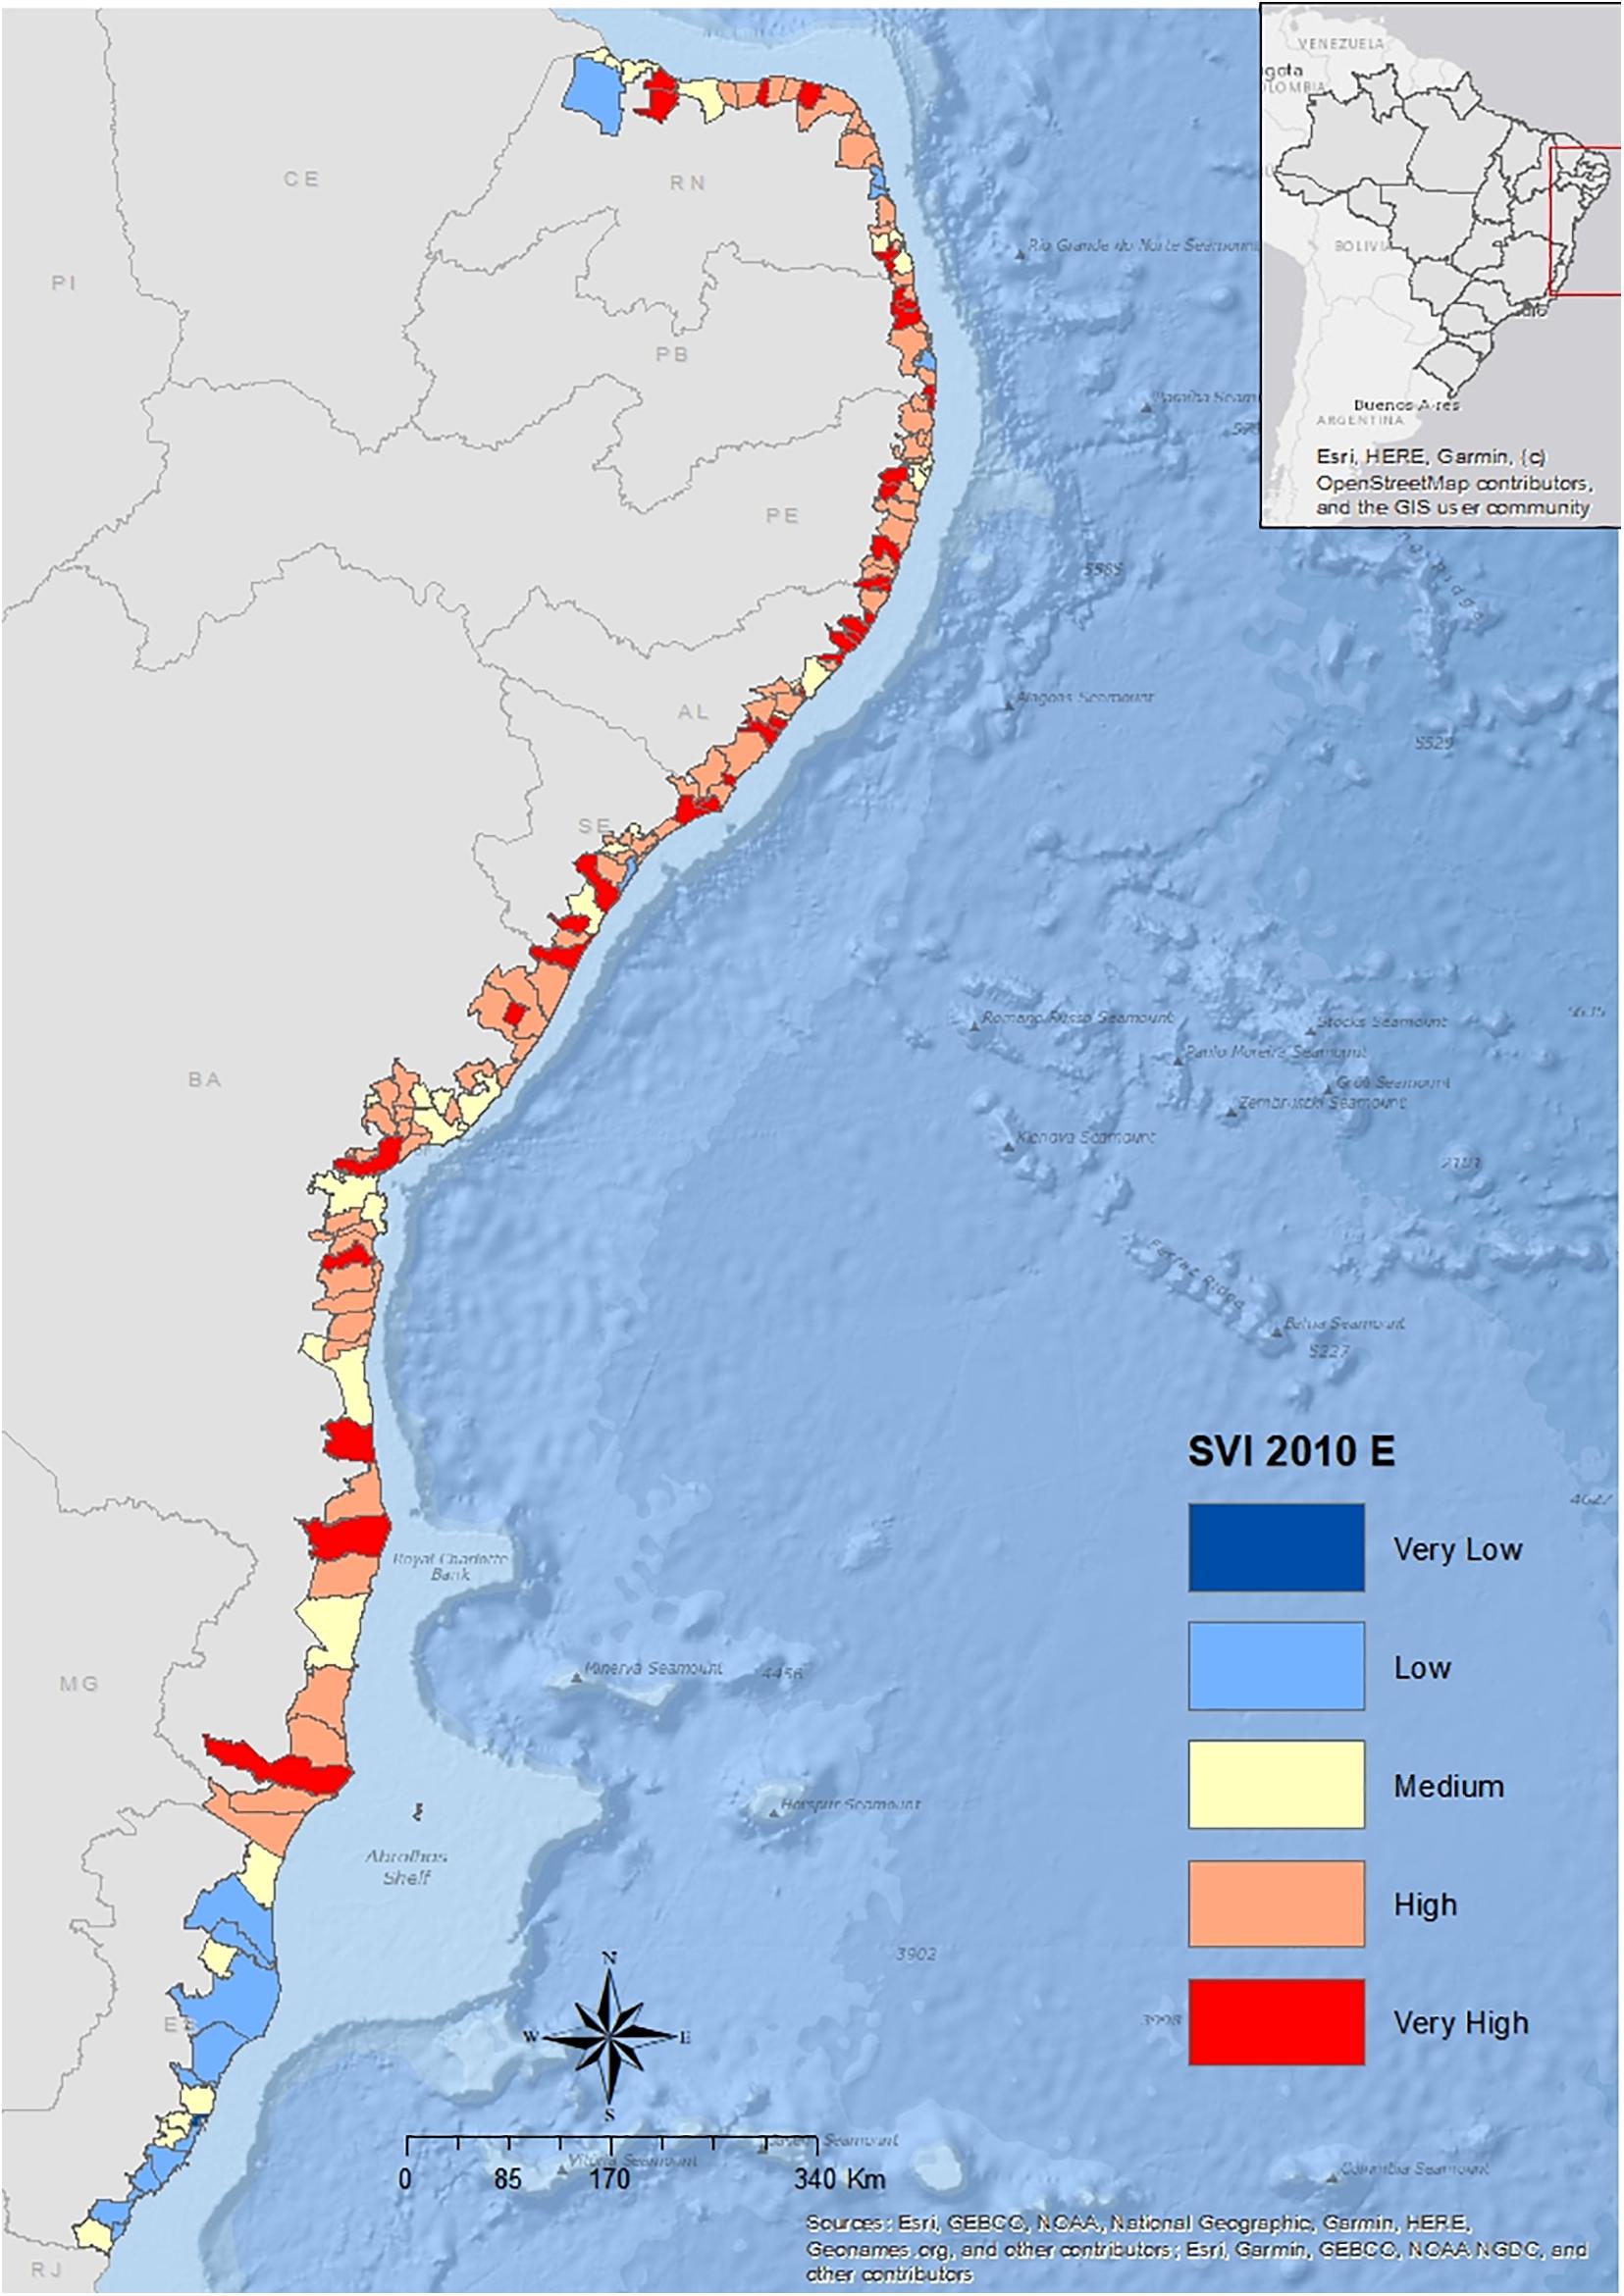
Figure 9. SVI for the East coast municipalities. Elaborated by the authors with data from IPEA (2020a).
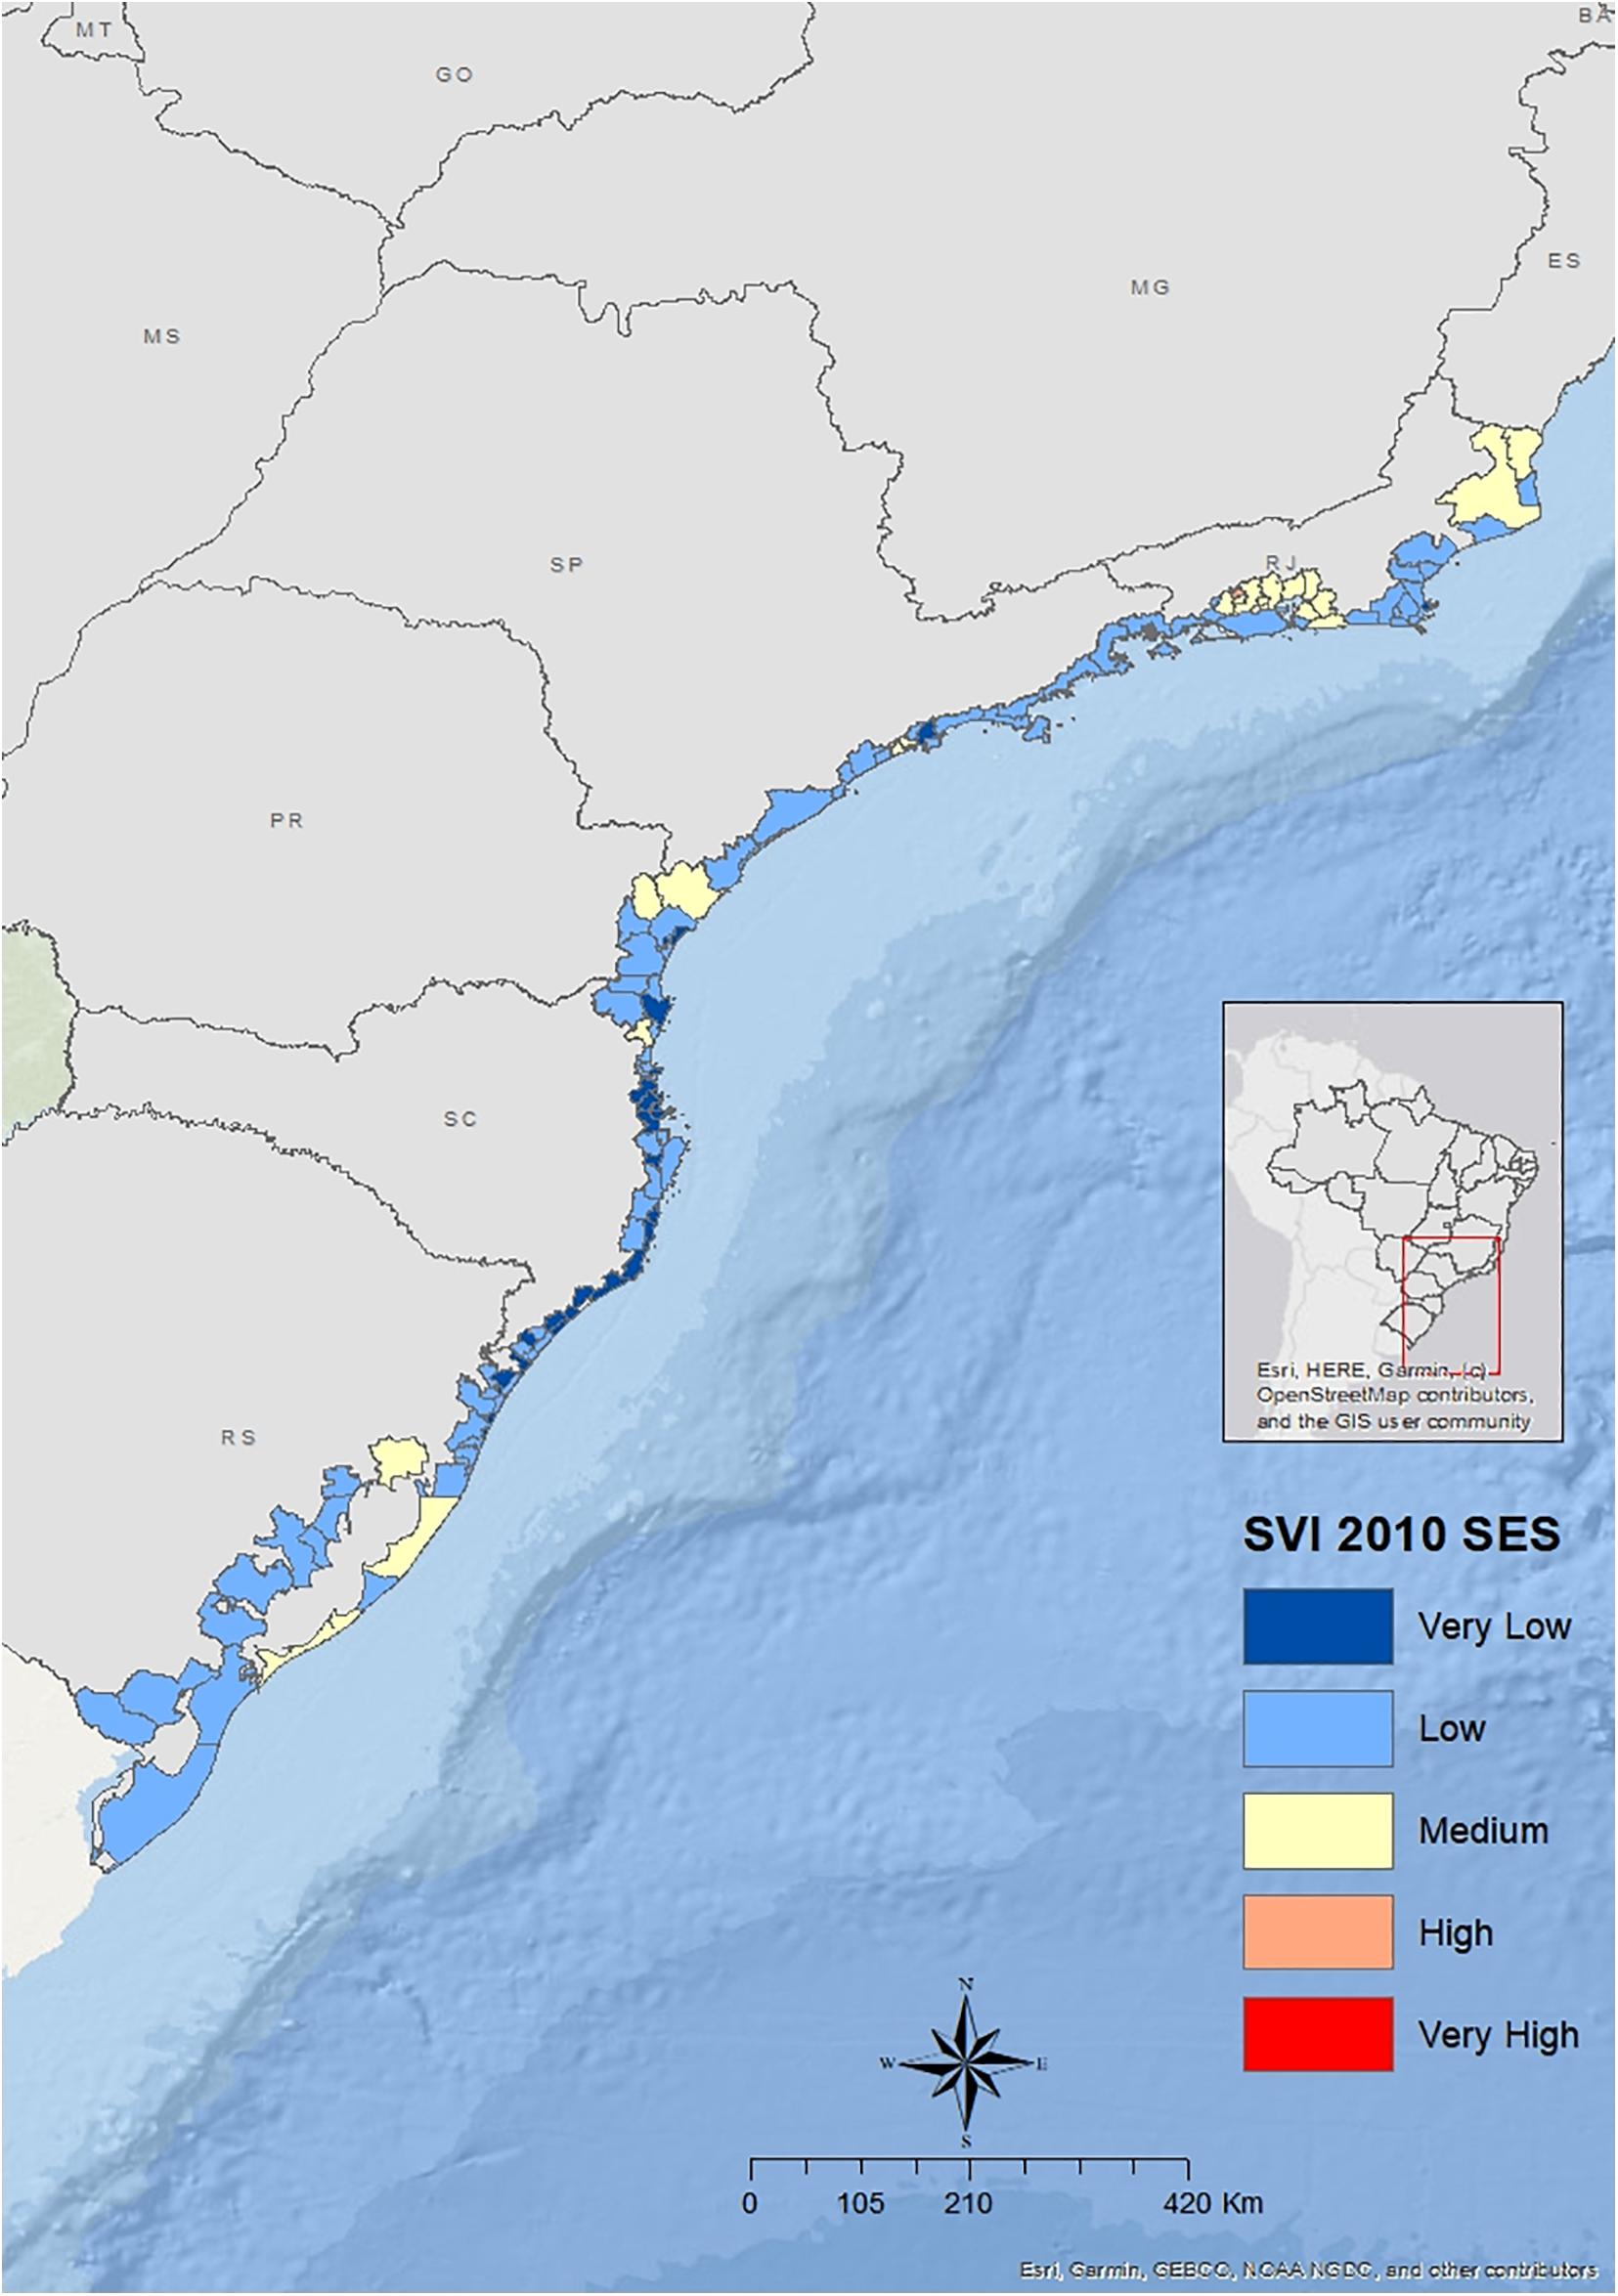
Figure 10. SVI for the South coast municipalities. Elaborated by the authors with data from IPEA (2020a).
Just like for MHDI, the North and East municipalities presented higher values of the SVI, indicating more incidence of vulnerability conditions for inhabitants of these cities in 2010. Of 107 cities in the North region, 86.9% presented high or very high levels of SVI. In the East, from 160 cities, 67.5% presented high or very high SVI. For the SES region, only 1 out of 120 cities presented this level, Japeri city, with high SVI.
In Figure 8, it is possible to see that most Northern municipalities presented very high levels of SVI, some with high levels, and just a few cities with medium levels.
For the East region, despite the fact that the majority of municipalities indicated high or very high levels of SVI, there were some occurrences of municipalities with low SVI, especially in Rio Grande do Norte and Paraiba states, located in the north part of the region, and at Espírito Santo, in the frontier with the SES region (Figure 9).
Finally, Figure 10 illustrates a predominance of lower levels of SVI in the SES municipalities. We observe some cities with medium SVI, especially in the state of Rio de Janeiro, the border of the East region. On the other hand, there was a concentration of cities with very low SVI in Santa Catarina state, with some other cities with this level spread throughout the region.
In general, SVI results presented even higher inequalities among the coastal municipalities, especially when comparing the North and South/Southeast regions. These differences are also statistically significant (Wilcoxon test, p-value = 3.566e-12 for the comparison between North and East distributions; p-value < 2.2e-16 for the North and SES comparison; and p-value < 2.2e-16 for the East and SES distribution comparison).
As for the MHDI, this is a synthetic index composed of 16 indicators of urban infrastructure, human capital, and income and labor. In order to investigate more clearly the conditions of social vulnerability in these municipalities, we also analyze the dimensions and indicators of the SVI.
Figure 11 illustrates the distribution of the coastal municipalities’ values for the SVI dimensions, SVI Urban Infrastructure (SVI-UI), SVI Human Capital (SVI-HC), and SVI Income and Labor (SVI-IL). Starting with the SVI-UI, when comparing the three regions, the North presents a more accentuated vulnerability. While half of the municipalities in the North presented an SVI UI above 0.500 (very high SVI), some of them with the maximum value of 1.000, the median line for the East and SES indicated that half of its municipalities had low or very low SVI-UI. Particularly for the SES region, most of its municipalities presented values below 0.200 (very low SVI).
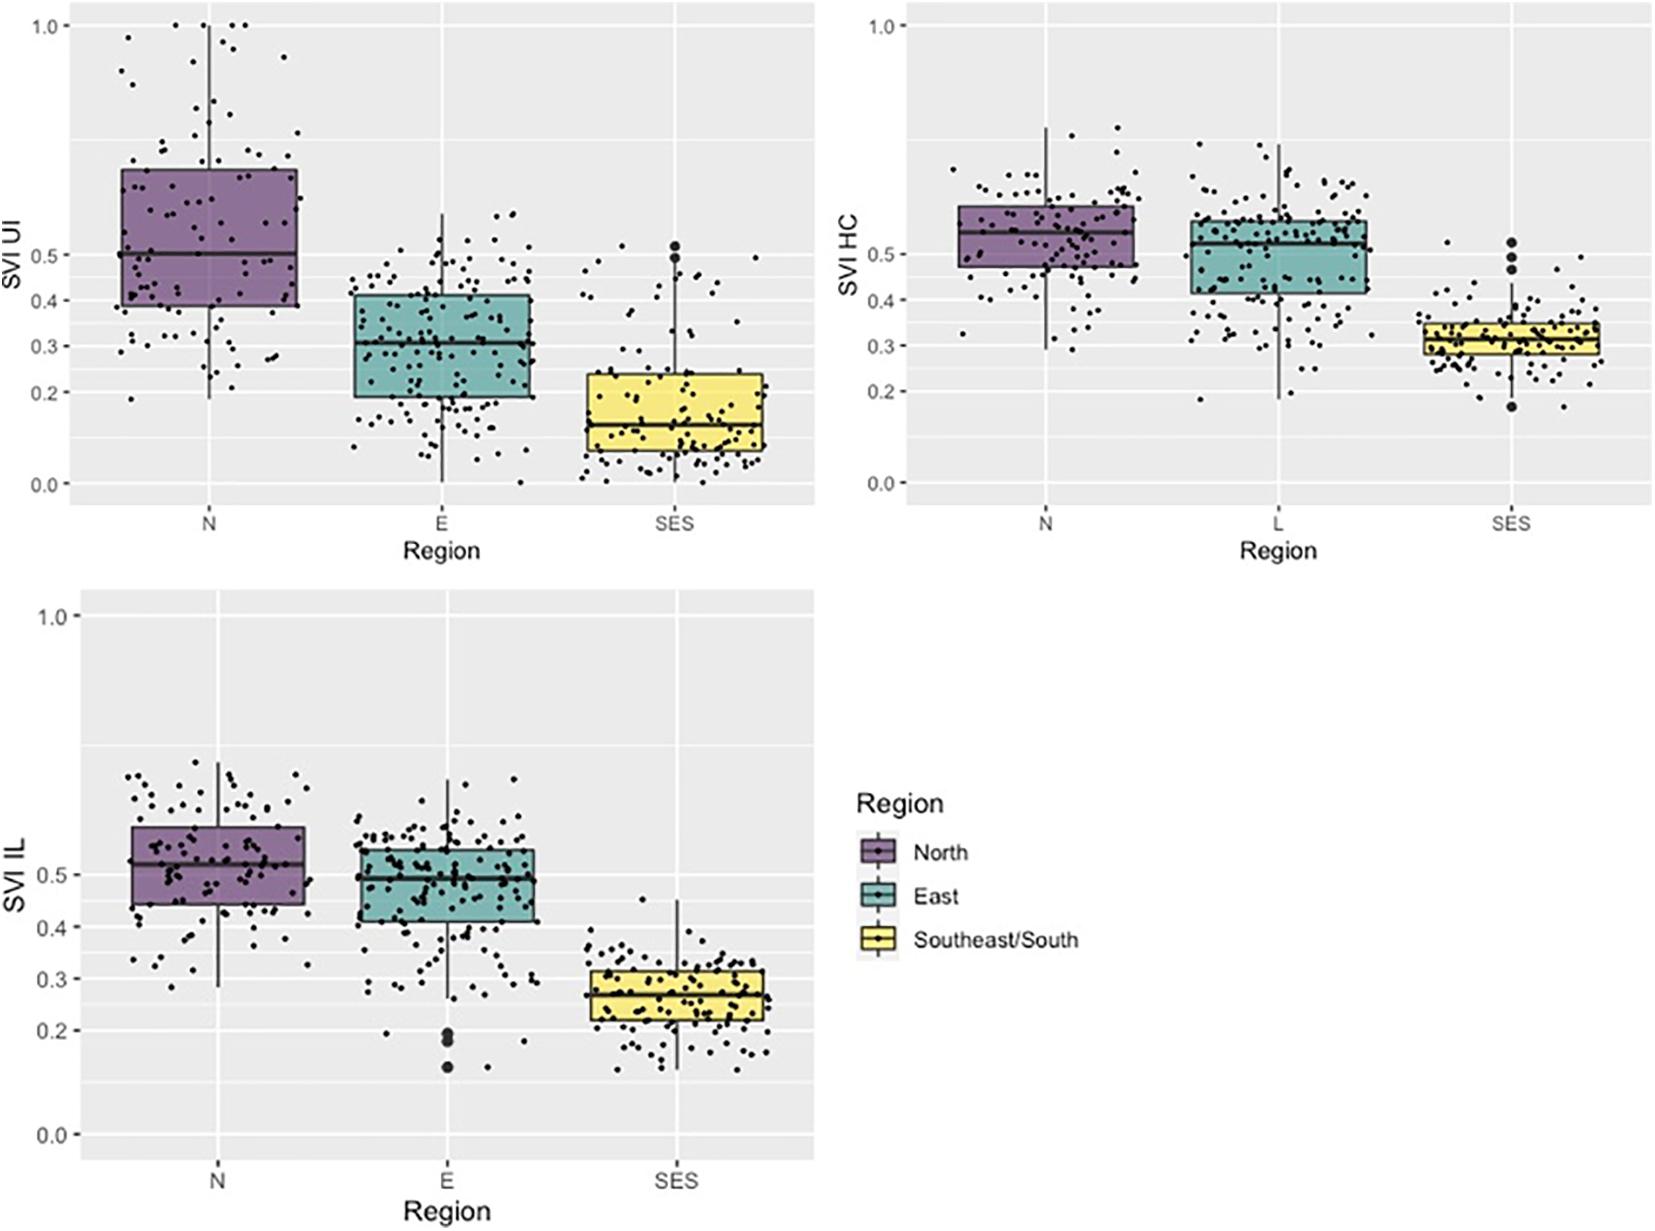
Figure 11. Distribution of the coastal municipalities for their SVI dimensions. Elaborated by the authors with data from IPEA (2020a).
When considering the other two dimensions of the SVI, despite the fact that the North presented a general picture of higher social vulnerability, the municipality values in this area were not so different from the East. In turn, the SES municipalities had less dispersed values and were mostly lower than the other two regions.
For the SVI-HC, in both North and East, most of its municipalities presented conditions of very high SVI-HC. This indicates a higher proportion of the population with lower formal education and in conditions of dependence on family fragile income. On the other hand, in the SES region, the municipalities with high or very high levels of SVI-HC were outliers, the majority presenting medium or low values. A similar picture is observed for the SVI-IL, although the SES municipalities’ values for this dimension were more dispersed than for the SVI-HC.
The distribution of municipalities by its SVI’s dimension values also illustrates a relevant picture of social vulnerability uneven levels between regions in 2010, especially for the SVI-IU. Figures 12–14 present the distribution of municipal values but now for SVI’s 16 indicators, divided by its dimensions, SVI-UI (Figure 12), SVI-IL (Figure 13), and SVI-HC (Figure 14), in order to investigate if the uneven vulnerable conditions between regions are concentrated in some specific factors or more disperse between all variables.
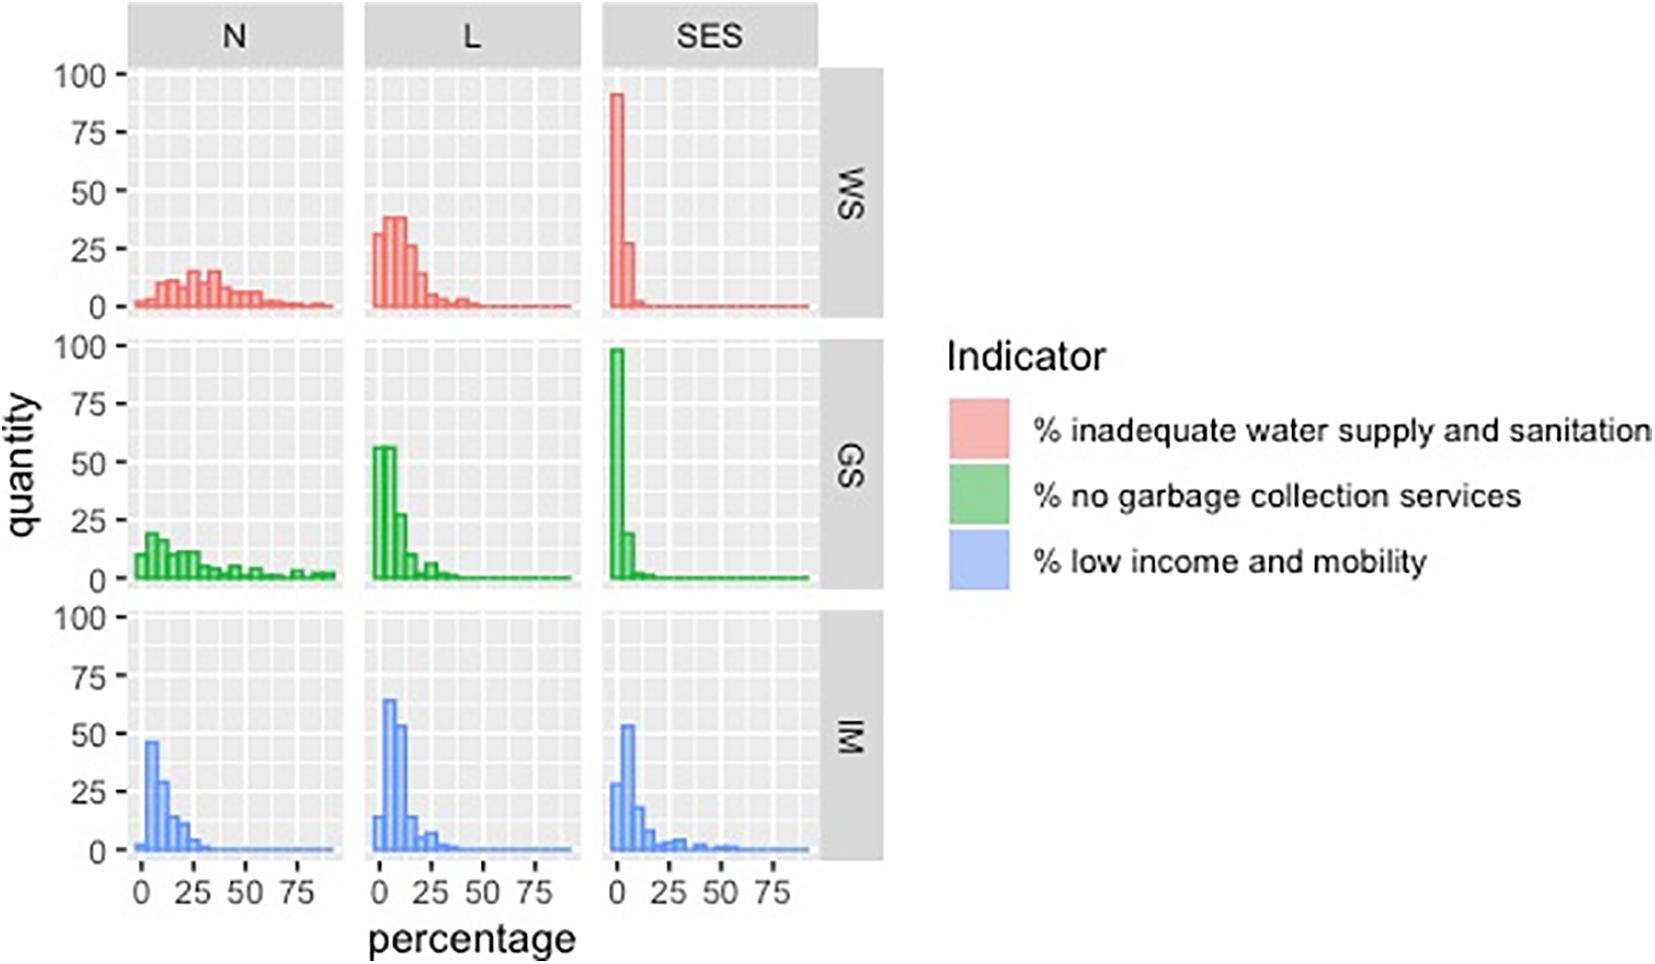
Figure 12. Histogram of the municipal distribution based on the SVI Urban Infrastructure indicators. Elaborated by the authors with data from IPEA (2020a).
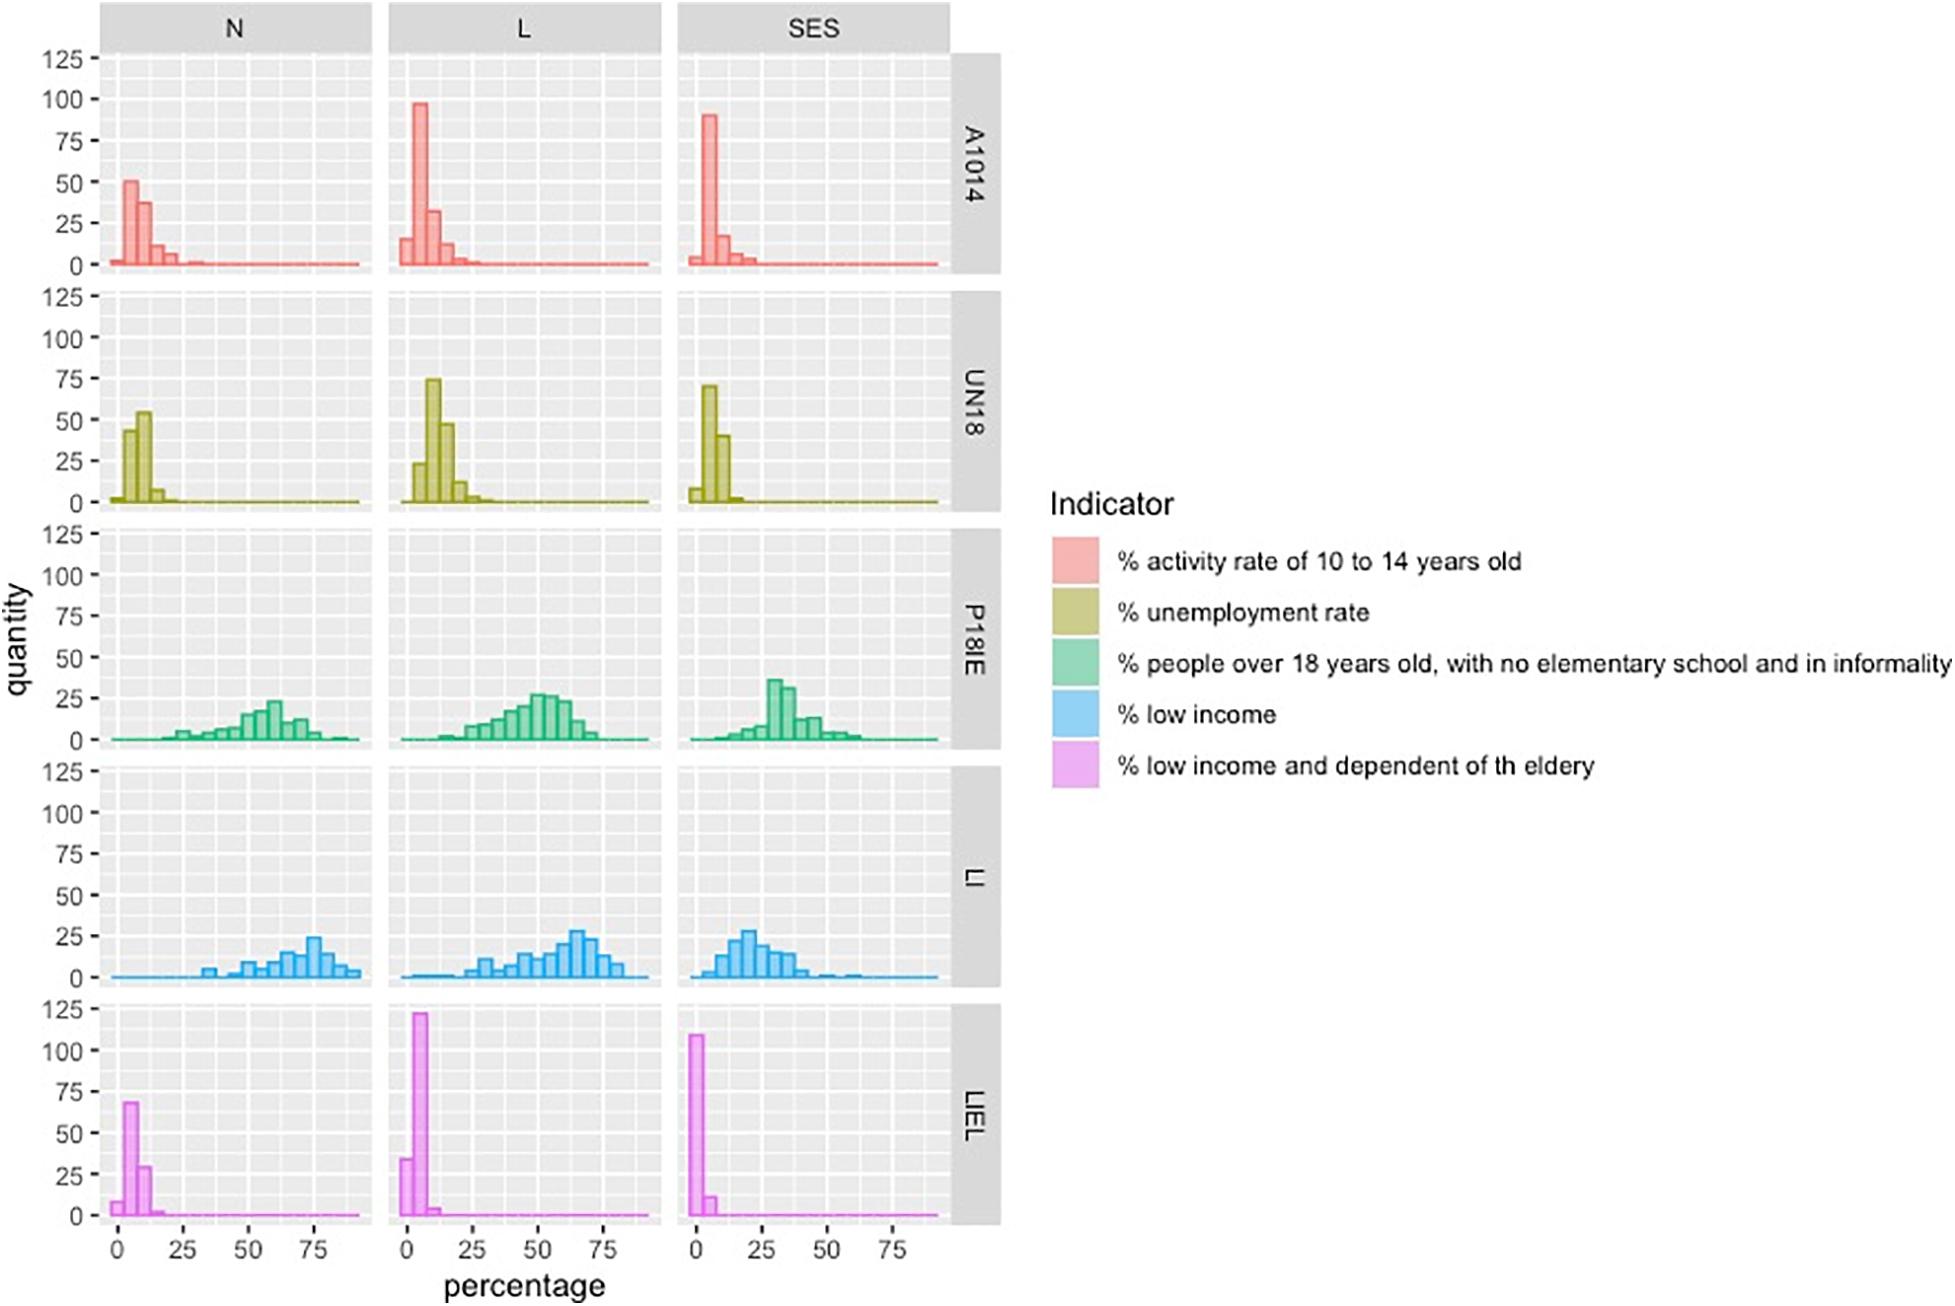
Figure 13. Histogram of the municipal distribution based on the SVI Income and Labor dimension indicators. Elaborated by the authors with data from IPEA (2020a).
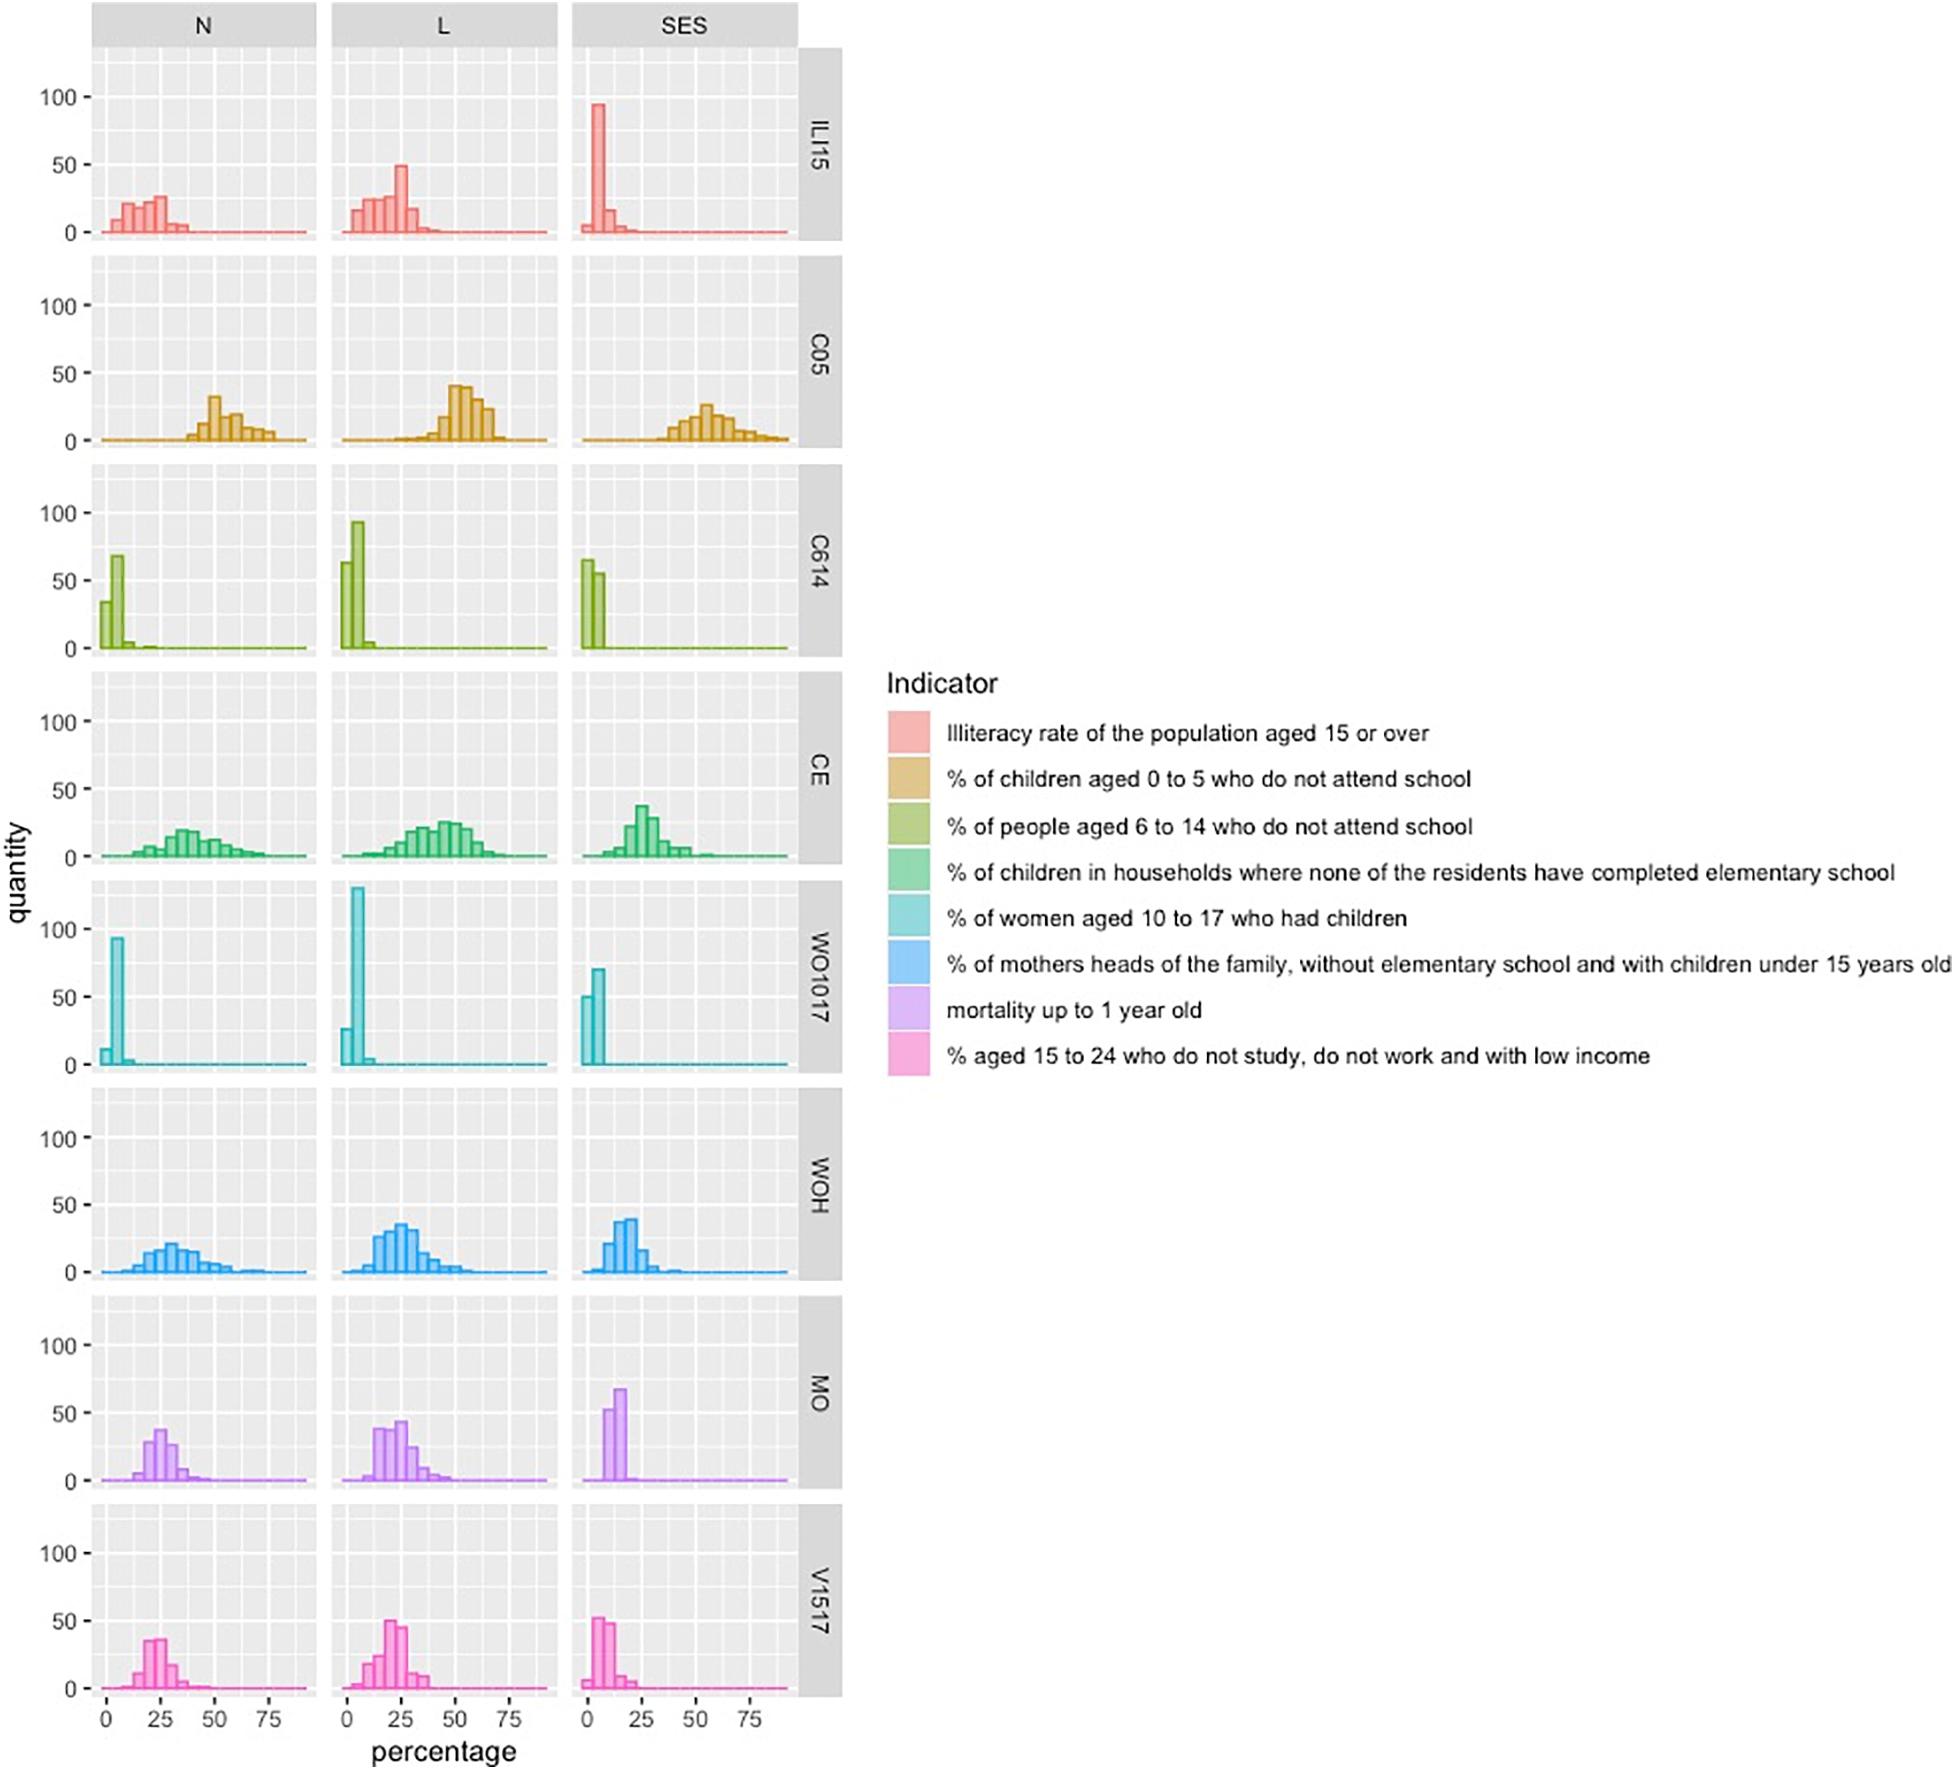
Figure 14. Histogram of the municipal distribution based on the SVI Human Capital dimension indicators. Elaborated by the authors with data from IPEA (2020a).
For the SVI-IU variables, the most uneven values between municipalities were found in the insufficiency of water and sewage proper treatments variable, which illustrates territories that lack water sources from the general supply chain and septic tank or sewage collection systems. A higher proportion of municipalities in the North presented 25% of the people living under these conditions, few cities were above this percentage in the East, and the SES cities had even lower values for this variable. Similar circumstances were observed in the North for the lack of garbage collection systems, but with slightly lower percentages for the North and East compared to the water and sewage indicator. For the last indicator of this dimension, the proportion of people with low income that takes more than 1 h in transportation from home to work, the conditions were similar in the three regions, with higher percentages for some of the SES municipalities.
When considering the SVI-LI, the proportion of people aged 10–14 years employed or looking for jobs was slightly similar between the three regions, with most municipalities below 25% of the population under this condition for all three regions. Similar distributions were presented for unemployment rates, with slightly higher percentages for the North, and for the proportion of the population aged 18 years or more without completion of primary school and working in informal jobs, where the North and East presented similar distribution and the South municipalities had slightly lower percentages.
The most uneven conditions for this dimension were observed in the proportion of people with a domiciliary income equal to or below half of the minimum salary for Brazil in 2010, considering the price levels of 2010. While most of the South cities presented less than 50% of the population under this condition, the municipalities from the North and East regions had a higher level, with a higher proportion of their cities where this condition represented 50% or more of the population. Just like in the MHDI indicators, the inequalities were more accentuated for income indicators.
Finally, for the SVI-HC dimension, most uneven conditions between South municipalities and the other two regions were found on four variables: Mortality rates; the proportion of children aged 14 years or less living in domiciles where none of its residents completed primary school; the proportion of the population aged from 15 to 24 years that were not formally attending school, not employed, and with an income equal to or lower than half of the minimum salary for Brazil in 2010 (a condition more accentuated of vulnerability); and the illiteracy rates of people aged 15 years or more. For this last variable, North and East municipalities presented between 20 and 30% of illiteracy rate for populations, while in most SES cities, the rate was between 0 and 20%.
Thus, the focus of uneven social vulnerability conditions between the South, East, and North municipalities in 2010 was found on income levels, urban infrastructure conditions, especially water and sewage treatment, and some educational indicators. Based on its variables, this index considered more diverse conditions than income-led indicators to detect the Brazilian social vulnerability scenario, i.e., beyond income focus measurements.
The Extractive Reserves Areas
Figure 15 shows that approximately 93.8% of the extractive reserves areas in coastal states are concentrated in the North, 5.2% in the East, and approximately only 1% in the SES region (Figure 15). These proportions illustrate the importance of natural capital and traditional communities for North municipalities.
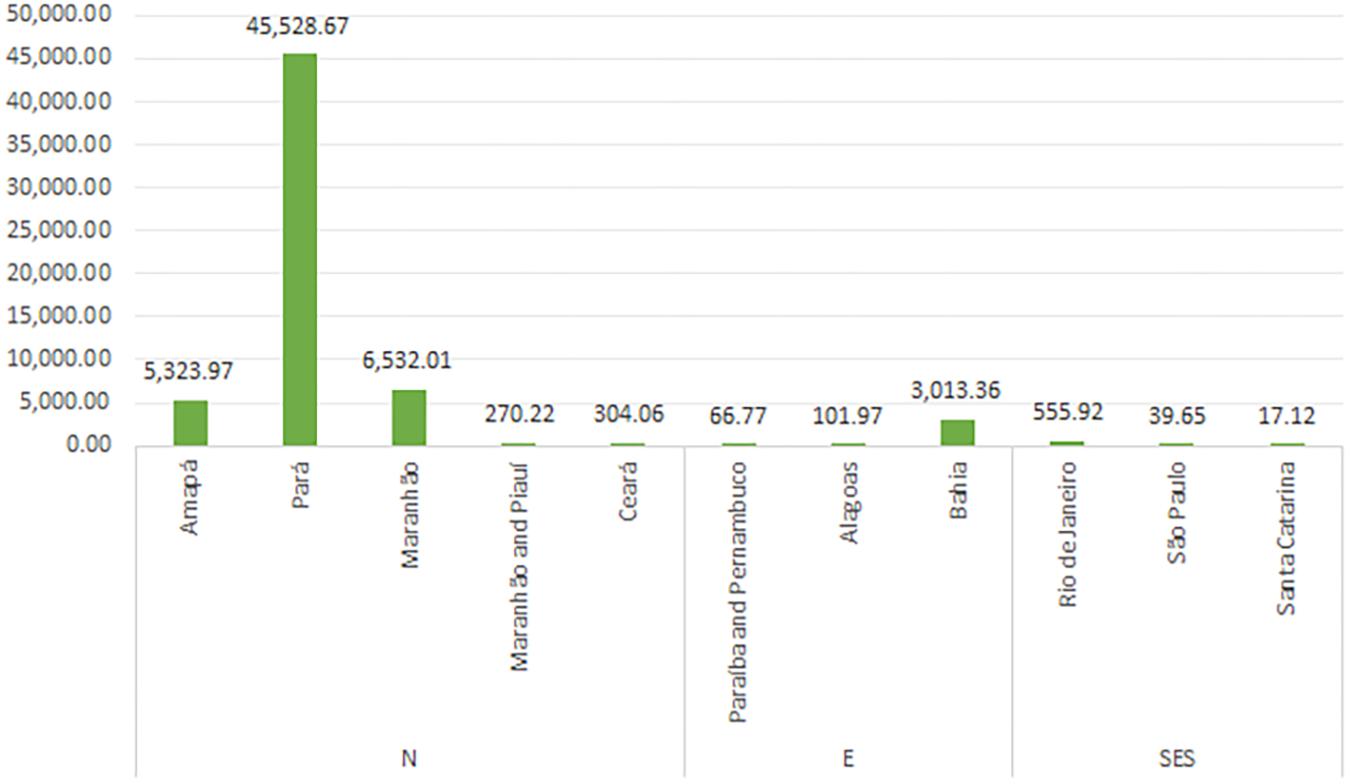
Figure 15. Total biome extractive reserves areas for Brazilian coastal states (km2). Elaborated by the authors with data from the Painel Unidade de Conservação Brasileiras—Ministério do Meio Ambiente.
The marine extractive reserves, an extension of the extractive reserves concept for the ocean space and coastal fishing communities, also show higher concentration in the North and East, having 61.1% of its total area located in the Northern states, 32% in the Eastern states, and 6.9% in the South/Southeast region (Figure 16).
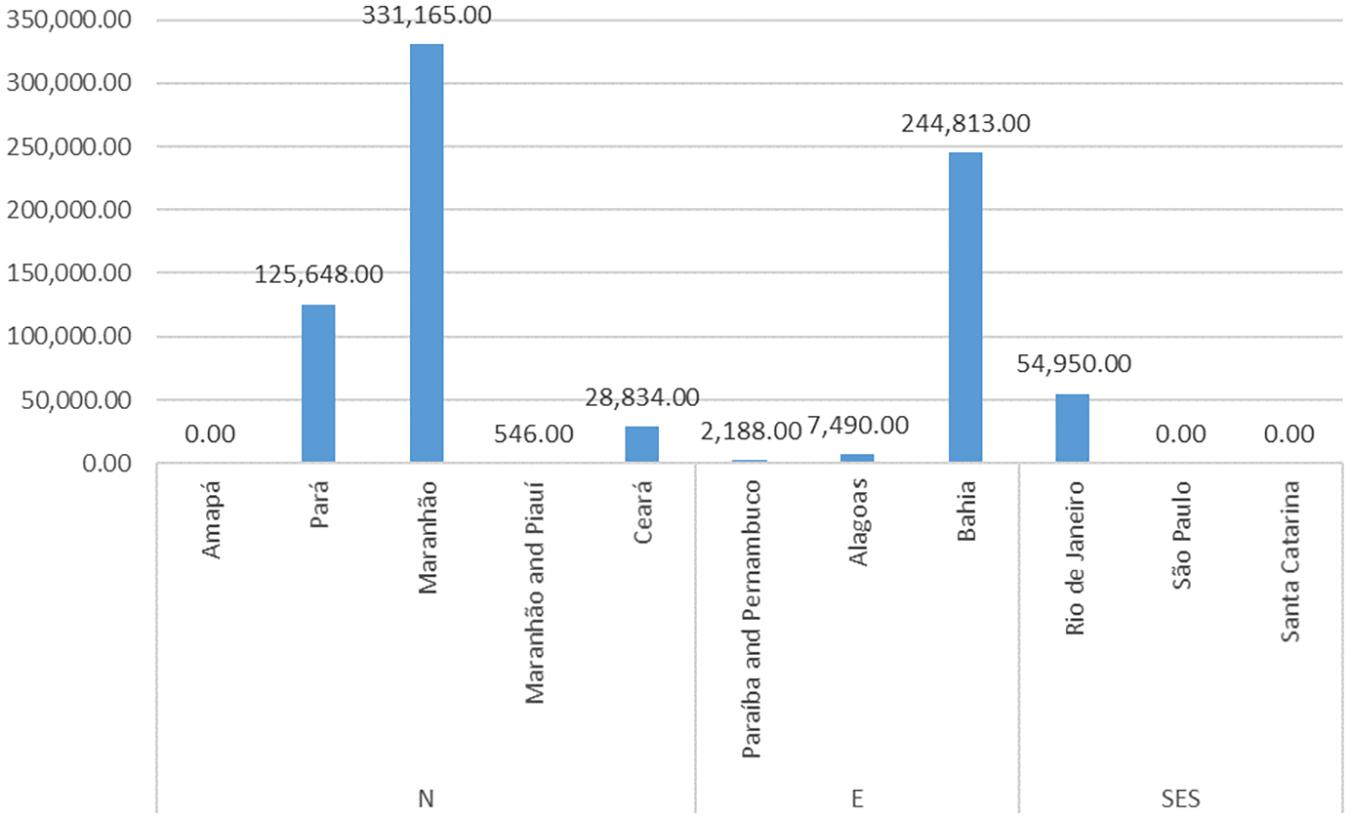
Figure 16. Total marine extractive reserves areas for Brazilian coastal states (ha). Elaborated by the authors with data from the Painel Unidade de Conservação Brasileiras—Ministério do Meio Ambiente.
The higher extractive reserves occurrence, especially in the Northern states, suggests the importance of natural capital, also for livelihood maintenance of several social groups. It reinforces the idea that nature’s contribution to people should play an important role in development models and could be better explored in a renewable and sustainable way. We found a significant and positive correlation between extractive reserve areas and the SVI (0.434), indicating that cities with high social vulnerability represented by the SVI also have larger extractive reserve areas. The opposite was observed for the MHDI (-0.257), closer than zero and with no statistical significance, though (Figure 17).
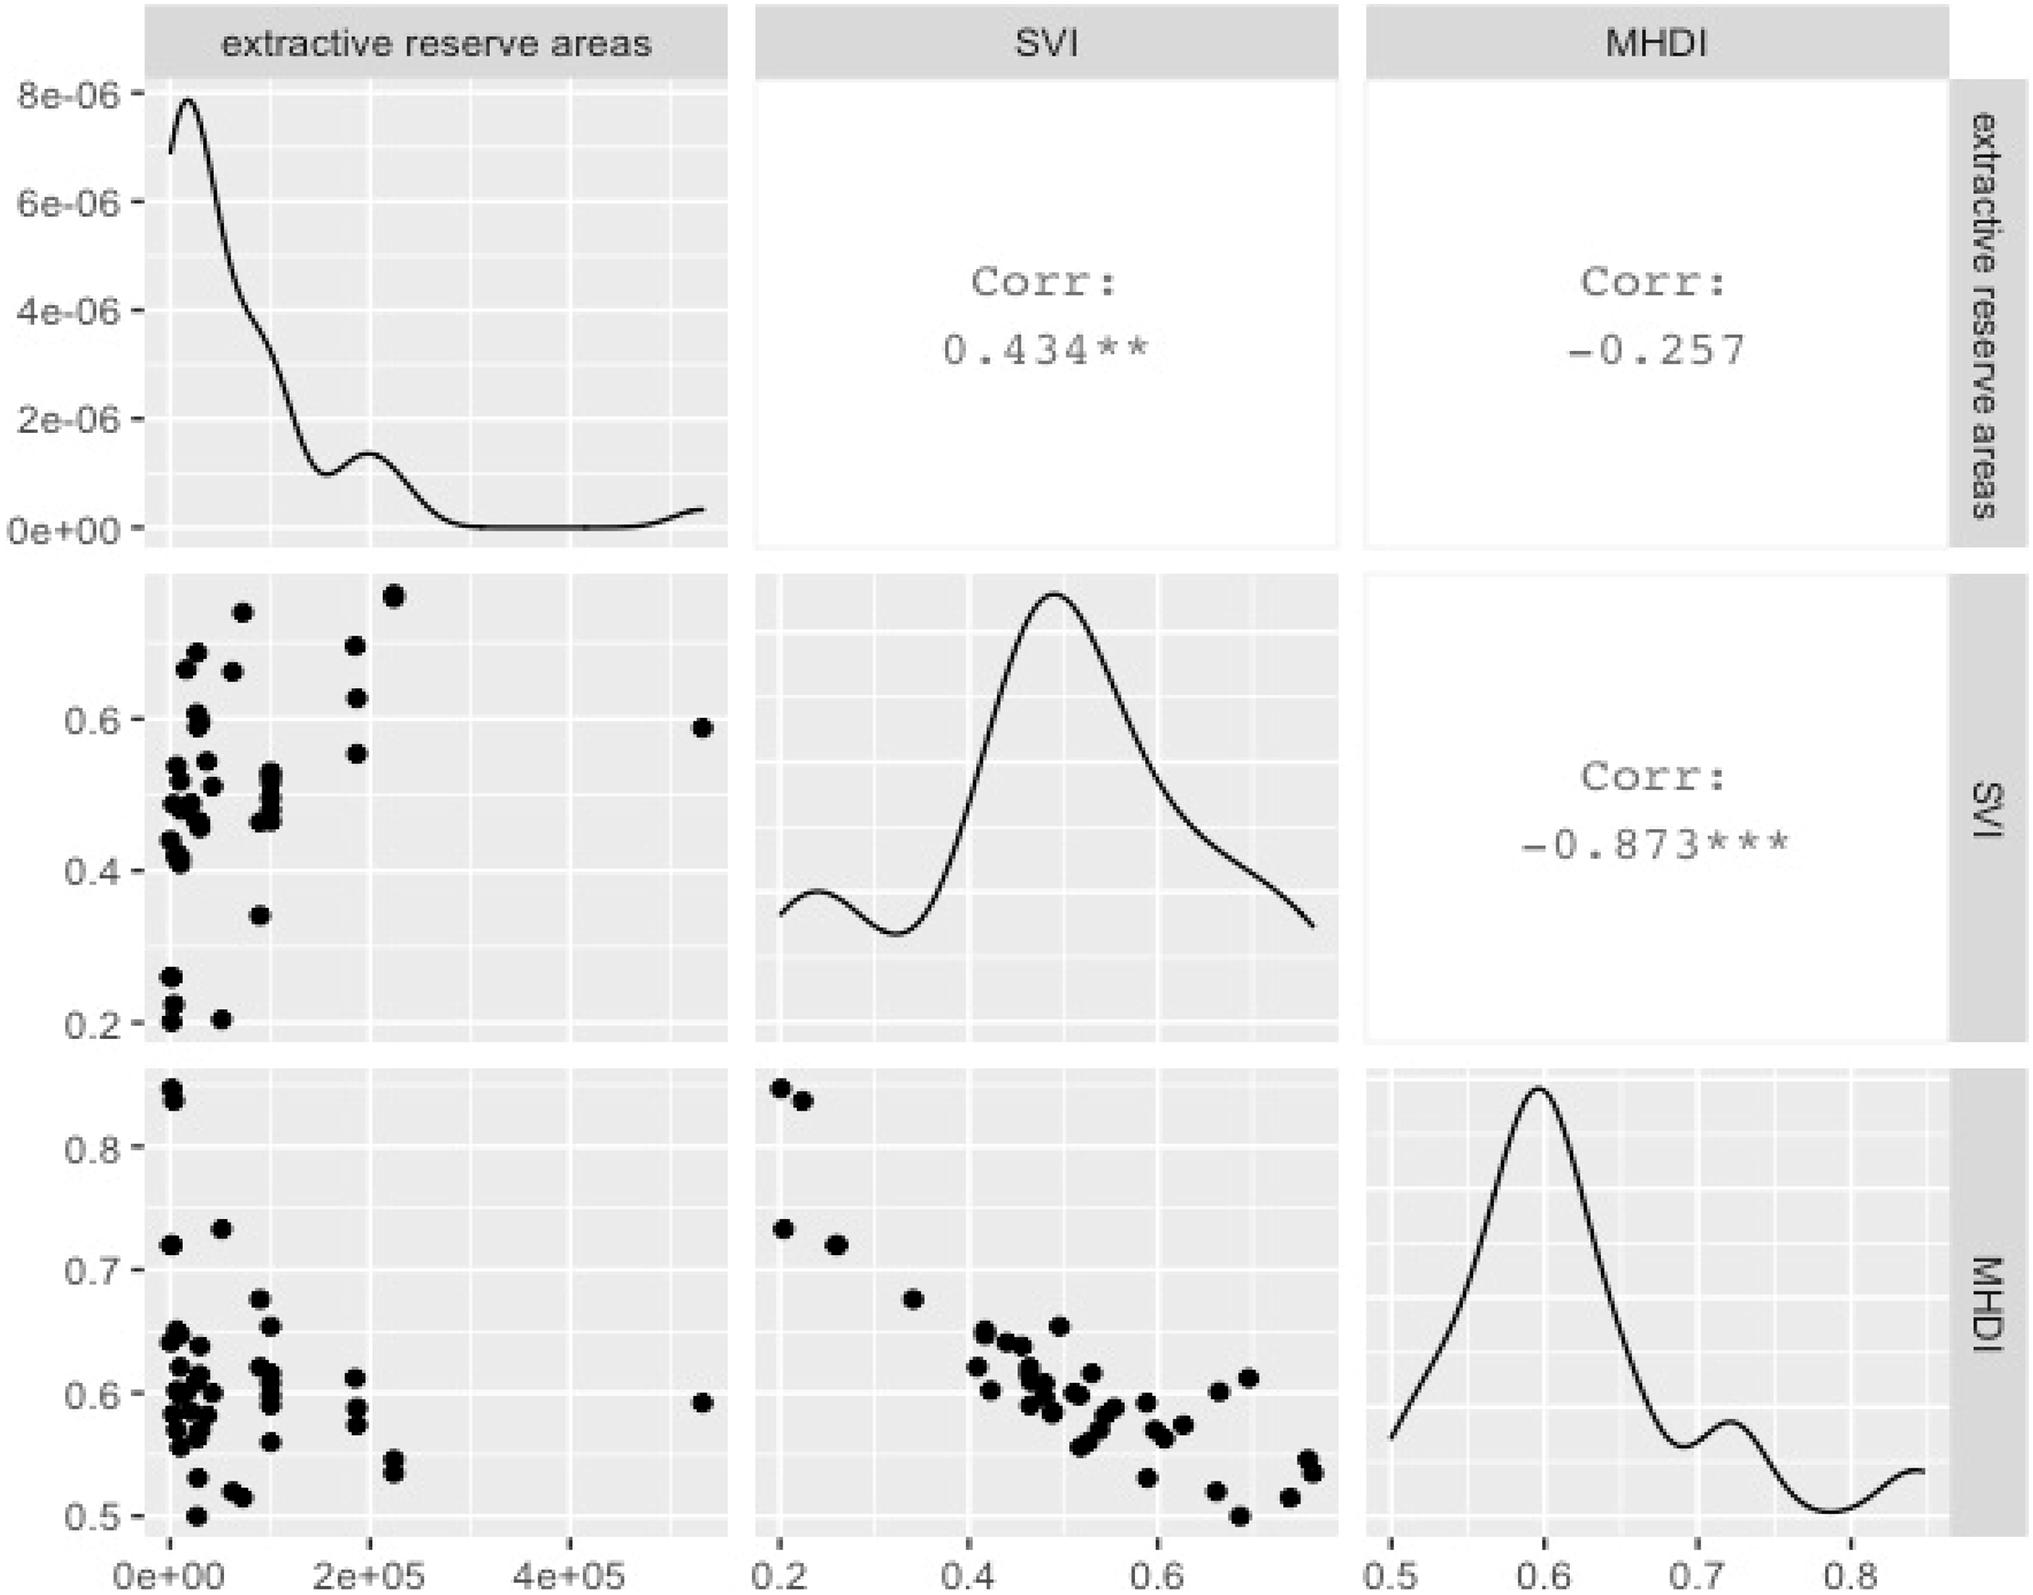
Figure 17. Correlation between municipal extractive reserves areas, SVI, and MHDI. Elaborated by the authors with data from the Painel Unidade de Conservação Brasileiras—Ministério do Meio Ambiente, Atlas of Human Development in Brazil (IPEA, PNUD, and FJP), and Atlas of Social Vulnerability in Brazil (IPEA).
Discussion
The importance of interpreting social vulnerability results together with an understanding of wellbeing seems crucial. Based on the results of the aggregated levels of both indexes, if policymakers decide to consider SVI and MHDI as references for coastal municipalities’ socioeconomic development, it is likely that income increase actions and economic infrastructure investments should be central policies. However, policy-driven research outcomes indicate that these indexes are important references, but some other key factors should be taken into consideration with respect to the improvement of societal wellbeing. Only SVI and MHDI are insufficient to guide development and wellbeing policies.
Overall, 65.9 and 78% of a total of 387 Brazilian coastal municipalities assessed were ranked below SVI and MHDI country average values, respectively. For both indexes, income plays a central role in these differences between coastal municipalities and the Brazilian average. When considering the MHDI-I dimension, 85.8% of coastal municipalities presented values below the country average. For the SVI-IL dimension, 70.8% of coastal municipalities had worse results than the national mean.
Per Capita Income and Inequalities
As presented briefly in the Introduction, income is a central resource for livelihood in capitalism, but when it comes to development and wellbeing measurements, income represents one aspect of many conditions that could reflect life quality, especially for traditional communities, more tied to the natural environment and regional costumes. Per capita income represents one of the three MHDI dimensions, and it was the main driver of human development differences represented by the MHDI between the three regions.
Income increasing by itself is a fragile measure of individual and especially social wellbeing on a territory. It is important to consider the costs for reaching higher levels of income for wellbeing evaluation, such as natural capital losses due to industrialization, air and water pollution, the consequences for global warming trends, the effects on ocean biomass that could force fishermen to look for industrial jobs, higher levels of labor force immigration and competition increases, the rise of tourism, and the consequent necessities of fishing and local communities to adapt to a different lifestyle, to name a few.
The discussion becomes more complex when we consider a tendency of uneven distribution of income generation (World Economic Forum, 2019), especially in the Brazilian context of historic and structural inequalities. Even if we consider per capita income as a good measure for wellbeing in a specific Brazilian coastal municipality as put by the MHDI, the index computes the average income in its calculations, but not considering income uneven distributions in the city. In that sense, two municipalities could have the same level of per capita income but completely different scenarios of income concentration, marginalization, and, consequently, different levels of social wellbeing. Despite higher income levels in the SES municipalities, we can observe multiple cities in that region with a Gini Index above 0.500 in 2010, which reflects income differences. The other two regions presented even higher values for the cities (Supplementary Figure 1).
Services Accessibility
The SVI clips its analysis into a more specific topic, social vulnerability represented by the lack of or insufficient accessibility to important assets for livelihood. Despite points in its aggregated results and the importance of income variables for inequalities between regions and coastal municipalities, we could see SVI’s infrastructure dimension (SVI-UI) as the one with higher differences between regions.
The SVI-UI is composed of indicators of urban mobility, sanitation, and water availability, and for the 2020 scenario, it is especially important for wellbeing due to COVID-19 spread and contamination dynamics. The lack of water access, sewage treatment, and absence of garbage collection could indicate areas with higher vulnerability to the virus contamination, while low social mobility conditions indicate lower possibilities for treatment, social isolation, and prevention (Costa et al., 2020).
Urban development policies could consider this indicator as a reference for coastal municipal development, to guide investments in infrastructure, roads, vehicle subsidies, sewage systems, housing, etc. Access to these basic goods is essential for wellbeing in an urban environment, but, depending on what type of technologies and services are chosen for implementation, such investments could also bring natural degradation, to a lower degree than only just income-increasing policies.
Thus, even though both indexes shed light on essential factors that guide actions and policies for reducing inequalities and for a better quality of life in Brazilian coastline cities, they do not provide indirect solutions or discuss the importance of sustainable development or natural capital conservation. This fact is especially important for the Northern and Eastern regions.
The Importance of Natural Capital
Considering the Brazilian coastal municipalities, economic growth by itself can improve quality of life but not necessarily lead to a general improvement of wellbeing. For example, fossil fuel extraction could substantially increase the income of municipalities where the oil deposits are legally located, but it could be prejudicial to the local population and other nearby cities in terms of pollution, marine biodiversity change, marginalization and labor competition, violence, unequal distribution of extraction profits, etc. (Ribeiro, 2012; Gobetti et al., 2020). Industrialization and increase in economic infrastructure can also compromise green areas such as forests and mangroves, a trade-off that could deteriorate the quality of life under climate change scenarios, especially for traditional communities.
On the other hand, Brazilian coastal municipalities with low MHDI or high SVI have valuable natural capital. Bioeconomy should be better explored as a key contribution of nature to people (Abramovay, 2018). Also, development policies to increase wellbeing levels should take into consideration the importance of coastal and ocean biodiversity to traditional fishing communities and coastal livelihoods. Natural capital is an important asset, and natural resource management should be prioritized.
The Brazilian Exclusive Economic Zone (EEZ), commonly known as Blue Amazon, rich in biodiversity and resources at the national level, covers a total area of 3,642,070 km2. Currently, several human-driven threats are impacting the EEZ biodiversity aspects—benthic and pelagic habitats, distribution of threatened species, and ecological connectivity patterns, such as industrial fishing, climate change, coastal development, port-derived pollution, shipping lanes, land-based pollution, ocean mining, oil/gas extraction activities, and invasive species. These threats warn of the need for priority actions for marine conservation strategies, while industrialization reduces the potential of natural capital. For example, higher occurrences of threatened species along the coast of São Paulo State and the SES region contrast with the better values of SVI and MHDI in these territories. Also, an important core of reef-based habitat connectivity is located in the North region, close to the Amazon eco-region, and another core of reef-based connectivity is located in the East. Moreover, the ecological functions of nearshore habitats are being rapidly damaged due to human interventions (Magris et al., 2020).
Nearly the entire EEZ is facing some level of threat. However, more intense cumulative threats in the SES region and the extreme North were observed, indicating top priority areas for conservation (Magris et al., 2020). Most of these areas are in the SES region, where coastal municipalities showed higher levels of MHDI and/or lower values of SVI. In that sense, human activities and socioeconomic development, including ones that aggravate climate change scenarios, could deteriorate marine biodiversity and the rich resources of the Brazilian EEZ. A careless coastal development plan that focuses only on increasing income, industrialization, and economic infrastructure may cause more harm to these strategic and rich natural environments.
Finally, both climate change and biodiversity losses are two of the most important challenges and risks for human society in the Anthropocene era, and they are linked and interconnected to each other (Pörtner et al., 2021). Increasing emissions of greenhouse gases could escalate ocean acidification, leading to harm to ocean biodiversity. Reciprocally, changes in ocean biodiversity can affect the water cycle and climate. An integrated action to cope with both challenges that bring the perception that the economic structures and social needs are also linked to environmental trends is imperative.
Social Vulnerability Indexes
Therefore, we highlight the importance of indicator development combining different dimensions. Our findings reveal a novel overview of the Brazilian social dimension of the coast at the municipal level and low-resolution discrepancies within the country level.
However, no index should be interpreted alone, and no index covers multiple aspects at the same time. Silva et al. (2019) brought dimensions of social adaptive capacity, species vulnerability, and ecosystem vulnerability at the state level. Martins and Gasalla (2020) explored social vulnerability indexes to climate change at the community level. It also seems important to incorporate intangible values in the vulnerability index, such as the attachment to a place, the cultural importance of fishing, local ecological knowledge, and attitude and perception of people to change, to enrich the notion of the coastal community’s vulnerabilities (Martins et al., 2019). All these innovative processes of index formulation help guide the policy and the society toward prosperity, sustainability, and wellbeing.
Conclusion
This study investigated the levels of socioeconomic development in the Brazilian coastline municipalities based on two indexes, the MHDI and the SVI, for the first time, aiming to evaluate their application to measure Brazilian coastal municipalities’ wellbeing. We defend that this could be an orientation to guide public policy and investments in more socioeconomic deprecated cities, but wellbeing measurements are plural and multidimensional tasks, not exclusive to income growth and infrastructure investments.
The results revealed SVI and MHDI inequalities on North and East municipalities relative to Southeast and South municipalities. Income, formal education, and urban infrastructure differences played an important role in the uneven social conditions. Moreover, we exposed some disadvantages of using income and infrastructure as the reference for coastal society wellbeing measurements, especially the possible damage to the natural environment, particularly in the North and East regions.
It is important to note that both the MHDI and SVI are indexes that go further the mainstream of economic growth for measurements of individual and social wellbeing, at the Brazilian municipal scale. In that sense, they are extremely important for policy orientation and monitoring in the Brazilian scenario of historical social inequalities. However, when we focus on coastal communities, especially traditional fishing or extractive ones, other factors such as the coexistence with a rich natural environment should also lead decision makers in the search for sustainable development and preservation of livelihoods and cultures. The natural capital and the presence of traditional populations with strong cultural heritage are key aspects that suggest that the type of socio-economic development needed in Brazilian coastal zones is far from the current economic growth model and should be taken with caution in policies that improve social vulnerability indicators.
The construction of proper and careful measurements of wellbeing is a complex task, given its multidimensional aspects and socio-spatial subjectivities. There are subjective factors in our daily life that matter and determine wellbeing, which are not easily measured by economic growth, income, and infrastructure. The Social Progress Index1 is one methodology that includes factors beyond the economic structure, such as outdoor air pollution and biome protection; discrimination and violence against minorities; equality of political power by gender, socioeconomic position, and social group; corruption levels; freedom of expression and religion; property rights for women; and access to mobile phones and the internet. We aim to contribute to the discussion by investigating the advantages and disadvantages of two indexes in the context of a Brazilian coastal population. Further research in this field could help guide the government and communities for actions in favor of wellbeing maintenance, biodiversity conservation, and improvement in the conditions of the coastal population.
Data Availability Statement
The original contributions presented in the study are included in the article/Supplementary Material, further inquiries can be directed to the corresponding author/s.
Author Contributions
MG designed the research, science ideas and supervised the project. RC compiled the data and analyzed indicators. First draft was prepared by RC with all plots. Both authors worked together in the analytical process and editing. MG was the P.I. of the CNPq-funded project which this study is part of.
Funding
This study was funded by the CNPq (Brazilian Scientific and Technological Council, Grant No. 445809/2015-9).
Conflict of Interest
The authors declare that the research was conducted in the absence of any commercial or financial relationships that could be construed as a potential conflict of interest.
Publisher’s Note
All claims expressed in this article are solely those of the authors and do not necessarily represent those of their affiliated organizations, or those of the publisher, the editors and the reviewers. Any product that may be evaluated in this article, or claim that may be made by its manufacturer, is not guaranteed or endorsed by the publisher.
Acknowledgments
First, we would like to thank the Brazilian National Council for Scientific and Technological Development (CNPq) for funding the project number 445809/2015-9. We express our recognition to the Institute for Applied Economic Research (IPEA), which developed the Social Vulnerability Index (SVI) and participated of the Municipal Human Development Index (MHDI) team, in partnership with the United Nations Development Program (UNDP) and the João Pinheiro Foundation (FJP). The role of IPEA and the indexes used for this research are essential for the development of public policies and knowledge in the pursuit of improving people’s lives. We thank the support of James Fumo for English revision, Sara Rebello for ArcGIS assistance, and Rodrigo Marques dos Santos for statistical advice. MA acknowledges the productivity grant from the CNPq, and the Institute of Advanced Studies of the University of São Paulo for the sabbatical program.
Supplementary Material
The Supplementary Material for this article can be found online at: https://www.frontiersin.org/articles/10.3389/fevo.2021.664272/full#supplementary-material
Footnotes
- ^ For more information, see https://www.socialprogress.org/.
References
Abramovay, R. (2018). The Amazon Needs a Nature-Based Knowledge Economy. São Paulo: Alana, APIB, 33.
Alvaredo, F., Chancel, L., Piketty, T., Saez, E., and Zucman, G. (2017). World Inequality Report 2018. Paris: World Inequality Lab.
Anand, S., and Sen, A. K. (1994). Human Development Index: Methodology and Measurement. New York: UN Human Development Report Office.
Apotsos, A. (2019). Mapping relative social vulnerability in six mostly urban municipalities in South Africa. Appl. Geogr. 105, 86–101. doi: 10.1016/j.apgeog.2019.02.012
Barros, R. P., Carvalho, M., and Franco, S. (2006). Pobreza multidimensional no Brasil. Texto Para Dis. Ipea 1227, 1–40.
Costa, M. A., Lui, L., Santos, R. M., Curi, R. L. C., Albuquerque, C. G., Tavares, S. R., et al. (2020). Apontamentos sobre a dimensão territorial da pandemiada COVID-19 e os fatores que contribuem para aumentar a vulnerabilidade socioespacial nas unidades de desenvolvimento humano de áreas metropolitanas Brasileiras. Nota Técnica IPEA 15, 1–66.
Costa, M. A., Santos, M. P. G., Marguti, B. O., Pirani, N., Pinto, C. V. S., Curi, R. L. C., et al. (2018). Vulnerabilidade social no Brasil: conceitos, métodos e primeiros resultados para municípios e regiões metropolitanas brasileiras. Texto Para Dis. IPEA 2364, 1–84.
D’Alessandro, S., Cieplinski, A., Distefano, T., and Dittmer, K. (2020). Feasible alternatives to green growth. Nat. Sustain. 3, 329–335. doi: 10.1038/s41893-020-0484-y
D’Alisa, G., Demaria, F., and Kallis, G. (2015). Degrowth: A Vocabulary for A New Era. London: Routledge.
Ellen MacArthur Foundation (2020). Circular Economy. https://www.ellenmacarthurfoundation.org/circular-economy/what-is-the-circular-economy (accessed December 07, 2020).
Francesco Economy (2020). The Economy of Francesco. https://francescoeconomy.org/ (accessed December 07, 2020).
Furtado, C. (2002). Em Busca de um Novo Modelo: Reflexões Sobre a Crise Contemporânea. São Paulo: Paz e Terra.
Gobetti, S. W., Orair, R. O., Serra, R. V., and Silveira, F. G. (2020). A polêmica mudança na partilha das receitas petrolíferas. Texto Para Dis. IPEA 2566, 1–80.
Hickel, J. (2020). The sustainable development index: measuring the ecological efficiency of human development in the anthropocene. Ecol. Econ. 167. doi: 10.1016/j.ecolecon.2019.05.011
Holand, V. D., Lujala, I., and Rød, J. K. (2011). Social vulnerability assessment for Norway: a quantitative approach. Norwegian J. Geogr. 65, 1–17. doi: 10.1080/00291951.2010.550167
Hoof, L. V., Fabi, G., Johansen, V., Steenbergen, J., Irigoien, X., Smith, S., et al. (2019). Food from the ocean; towards a research agenda for sustainable use of ur oceans’ natural resources. Marine Pol. 105, 44–51.
IBGE (2015). Indicadores de Desenvolvimento Sustentável Brasil 2015. Brasília: IBGE, doi: 10.1007/s13398-014-0173-7.2
IBGE (2020a). Instituto Brasileiro de Geografia e Estatística: Divisão Regional do Brasil. Available online at: https://www.ibge.gov.br/geociencias/organizacao-do-territorio/divisao-regional/15778-divisoes-regionais-do-brasil.html?=&t=o-que-e (accessed December 07, 2020).
IBGE (2020b). Instituto Brasileiro de Geografia e Estatística: Censo Demográfico. Available online at: https://www.ibge.gov.br/estatisticas/sociais/populacao/22827-censo-2020-censo4.html?=&t=o-que-e (accessed December 07, 2020).
IPEA (2020a). Atlas da Vulnerabilidade Social. Available online at: http://ivs.ipea.gov.br/index.php/pt/ (accessed November 26, 2020).
IPEA (2020b). Atlas da Violência. Available online at: https://www.ipea.gov.br/atlasviolencia/ (accessed December 07, 2020).
Keynes, J. M. (2018). The General Theory of Employment, Interest, and Money. London: Palgrave Macmillan.
Lam, V. W. Y., Alisson, E. H., Bell, J. D., Blythe, J., Cheung, W. W. L., Frölicher, T. L., et al. (2020). Climate change, tropical fisheries and prospects for sustainable development. Nat. Rev. Earth Environ. 1, 440–454. doi: 10.1038/s43017-020-0071-9
Magris, R. A., Costa, M. D. P., Ferreira, C. E. L., Vilar, C. C., Joyeux, J., Creed, J. C., et al. (2020). A blueprint for securing Brazil’s marine biodiversity and supporting the achievement of global conservation goals. Div. Dis. 27, 1–18. doi: 10.1111/ddi.13183
Martins, I. M., and Gasalla, M. A. (2020). Adaptive capacity level shapes social vulnerability to climate change of fishing communities in the South Brazil Bight. Front. Mari. Sci. 7:481.
Martins, I. M., Gammage, L. C., Jarre, A., and Gasalla, M. A. (2019). Different but similar? Exploring vulnerability to climate change in Brazilian and South African small-scale fishing communities. Hum. Ecol. 47, 515–526. doi: 10.1007/s10745-019-00098-4
Mavromatidi, A., Briche, E., and Claeys, C. (2018). Mapping and analyzing socio-environmental vulnerability to coastal hazards induced by climate change: an application to coastal Mediterranean cities in France. Cities 72, 189–200. doi: 10.1016/j.cities.2017.08.007
Mendes, J. M., Tavares, A. O., Freira, S., and Cunha, L. (2009). Social Vulnerability to Natural and Technological Hazards: The Relevance of Scale. Florida: CRC Press.
MMA (2020). Ministry of the Environment. Available online at: https://www.mma.gov.br/biodiversidade/biodiversidade-aquatica/zona-costeira-e-marinha#:~:text=A%20Zona%20Costeira%20do%20Brasil,ao%20Sul%20temperado%20do%20pa%C3%ADs (accessed November 15, 2020).
OECD, C. A. F., and ECLAC, E. U. (2019). Latin American Economic Outlook 2020: Digital Transformation for Building Back Better. Paris: OECD Publishing.
OPHI (2018). Global Multidimensional Poverty Index 2018: the Most Detailed Picture to Date of The World’s Poorest People. Oxford Poverty and Human Development Initiative (OPHI). Availble online at: https://ophi.org.uk/global-multidimensional-poverty-index-2018-the-most-detailed-picture-to-date-of-the-worlds-poorest-people/ (accessed December 7, 2020).
Patil, P. G., Virdin, J., Diez, S. M., Roberts, J., and Singh, A. (2016). Toward A Blue Economy: A Promise for Sustainable Growth in the Caribbean; An Overview. Washington D.C: The World Bank.
PNUD, IPEA, and FJP. (2013). O Índice de Desenvolvimento Humano Municipal Brasileiro. Brasília: PNUD. Auther name.
PNUD, IPEA, and FJP. (2020). Atlas do Desenvolvimento Humano no Brasil. Available online at: http://www.atlasbrasil.org.br/ (accessed December 07, 2020).
Porter, M. E., Stern, S., and Green, M. (2014). Social Progress Index 2014. Social Progress Imperative. Available online at: https://www2.deloitte.com/content/dam/Deloitte/cr/Documents/public-sector/2014-Social-Progress-IndexRepIMP.pdf. (accessed December 7, 2020).
Pörtner, H. O., Scholes, R. J., Agard, J., Archer, E., Arneth, A., Bai, X., et al. (2021). IPBES-IPCC Co-Sponsored Workshop Report on Biodiversity and Climate Change. Germany: IPBES and IPCC. doi: 10.5281/zenodo.4782538
Porto-Gonçalves, C. W., and Leff, E. (2015). Political ecology: a Latin American perspective: the social re-apropriattion of nature, the reinvention of territories and the construction of an environmental rationality. Desenv. Meio Ambiente 35, 29–64. doi: 10.5380/dma.v35i0.44381
Ramanathan, V., Aines, R., Auffhammer, M., Barth, M., Cole, J., Forman, F., et al. (2019). Bending the Curve: Climate Change Solutions. Location: Regents of the University of California. Available online at: https://escholarship.org/uc/item/6kr8p5rq
Ribeiro, H. (2012). Impactos de exploração do petróleo na saúde humana. Revista USP 95, 61–71. doi: 10.11606/issn.2316-9036.v0i95p61-71
Rudolph, T. B., Ruckelshaus, M., Swilling, M., Allison, E. H., Österblom, H., Gelcich, S., et al. (2020). A transition to sustainable ocean governance. Nat. Commun. 11:3600. doi: 10.1038/s41467-020-17410-2
Seingier, G., Espejel, I., Fermán-Almada, J. L., González, O. D., Montaño-Moctezuma, G., Azuz-Adeath, I., et al. (2011a). Designing an integrated coastal orientation index: a cross-comparison of Mexican municipalities. Ecol. Indicators 11, 633–642. doi: 10.1016/j.ecolind.2010.08.009
Seingier, G., Espejel, I., Fermán-Almada, J. L., Montaño-Moctezuma, G., Azuz-Adeath, I., and Aramburo-Vizcarra, G. (2011b). Mexico’s coasts: Half-way to sustainability. Ocean Coastal Manage. 54, 123–128. doi: 10.1016/j.ocecoaman.2010.10.034
Silva, J. J., Bruno, M. A. P., and Silva, D. B. N. (2020). Pobreza multidimensional no Brasil: uma análise do período 2004-2015. Revista de Econo. Política 40:1, 138–160. doi: 10.1590/0101-31572020-2924
Silva, M. R. O., Pennino, M. G., and Lopes, P. F. M. (2019). Social-ecological trends: managing the vulnerability of coastal fishing communities. Ecol. Soc. 24:4. doi: 10.5751/ES-11185-240404
Smith, A. (1996). An Inquiry into the Nature and Causes of the Wealth of Nations. London: Routledge.
Spiegal, H. W. (1955). Theories of economic development: history and classification. J. History Ideas 16, 518–539. doi: 10.2307/2707508
Stahel, W. R. (1981). Jobs for Tomorrow: The Potential for Substituting Manpower for Energy. New York: Vantage Press.
Tavares, A. O., Barros, J. L., Mendes, J. M., Santos, P. P., and Pereira, S. (2018). Decennial comparison of changes in social vulnerability: a municipal analysis in support of risk management. Int. J. Dis. Risk Reduct. 31, 679–690. doi: 10.1016/j.ijdrr.2018.07.009
Turner, R. K., Subak, S., and Adger, W. N. (1996). Pressures, trends, and impacts in coastal zones: Interactions between socioeconomic and natural systems. Environ. Manag. 20, 159–173. doi: 10.1007/BF01204001
UNDP (2020). Human Development Report 2020: the Next Frontier, Human Development and the Anthropocene. New York: United Nations Development Program.
United Nations (2020). UN Documentation: Development. Available online at: https://research.un.org/en/docs/dev#:~:text=%22Development%20is%20one%20of%20the,reinforcing%20components%20of%20sustainable%20development (accessed December 7, 2020).
Victor, D. G. (2011). Global Warming Gridlock: Creating More Effective Strategies for Protecting the Planet. England, CA: Cambridge University Press.
Victor, P. A. (2008). Managing Without Growth: Slower by Design, Not Disaster. Cheltenham: Edward Elgar Publishing.
World Bank (2020). World Bank Data. Available online at: https://data.worldbank.org/indicator/NY.GDP.MKTP.CD?locations=BR&most_recent_value_desc=true (accessed September 15, 2020).
Keywords: well-being, coastal municipalities, Brazil, socioeconomic indicators, human development, social vulnerability, coastal communities
Citation: Curi RLC and Gasalla MA (2021) Social Vulnerability and Human Development of Brazilian Coastal Populations. Front. Ecol. Evol. 9:664272. doi: 10.3389/fevo.2021.664272
Received: 04 February 2021; Accepted: 28 June 2021;
Published: 29 July 2021.
Edited by:
Sebastian Villasante, University of Santiago de Compostela, SpainReviewed by:
Ileana Espejel, Universidad Autónoma de Baja California, MexicoJanice Ser Huay Lee, Nanyang Technological University, Singapore
Copyright © 2021 Curi and Gasalla. This is an open-access article distributed under the terms of the Creative Commons Attribution License (CC BY). The use, distribution or reproduction in other forums is permitted, provided the original author(s) and the copyright owner(s) are credited and that the original publication in this journal is cited, in accordance with accepted academic practice. No use, distribution or reproduction is permitted which does not comply with these terms.
*Correspondence: Maria A. Gasalla, mgasalla@usp.br