


1. Introduction
Glaciers are not only recognized as one of the best indicators of climate variabilities, but also feed many rivers in High-Mountain Asia (Immerzeel and others, Reference Immerzeel, Van Beek and Bierkens2010). Under a recent warming climate, mountain glaciers are losing mass. They are thinning and shrinking, and their tongues are receding. Such glacier loss has a direct impact on water resources and ecological environment (Wang and others, Reference Wang, Wu, Wu and Chen2015). Receding glaciers are also associated with increased risks from ice avalanches (Shen and others, Reference Shen2013), glacial lake outburst floods (Simon and others, Reference Simon, Zhang, Wang, Yao and Bolch2019), icefalls (Shen and others, Reference Shen2013) and glacial debris flows (Hock and others, Reference Hock2019). The annual shrinkage rate of area and ice volume in the Tien Shan were 0.7 and 0.83% a−1, respectively, and the mass loss increased by 27% with the increasing temperature over the past five decades (Farinotti and others, Reference Farinotti2015). By comparison between the first and second Chinese Glacier Inventory datasets, from the 1960s to 2000s, glacier area shrunk 19% on average in the Chinese Tien Shan (Wang and others, Reference Wang2020). The mass loss of monitored glaciers in the Tien Shan has accelerated since the late 1990s, with a slight slowing down after 2010 (Wang and others, Reference Wang2020). Remote-sensing-based geodetic mass-balance estimates revealed a mean rate of surface elevation change was −0.58 ± 0.21 m a−1 during 2003–09 in the Tien Shan (Gardner and others, Reference Gardner2013). The corresponding changes in western and eastern Tien Shan regions were −0.40 ± 0.05 and −0.75 ± 0.05 m a−1, respectively (Wang and others, Reference Wang, Wu, Wu and Chen2015). Glaciers in the Tien Shan have experienced continuous mass loss and area shrinkage during the past few decades. These changes can increase runoff in the short term, but may reduce the total runoff on long-term scales (Huss and Hock, Reference Huss and Hock2018). For example, glacier changes in the Tien Shan have been contributing to a reduced runoff since the mid-1990s (Deng and others, Reference Deng and Chen2018), which reflects the regulate mechanism of glaciers on water resources in the basin.
Studies of glacier mass balance as well as glacier area and terminus (length) change are used to assess climate variabilities (Andreassen and others, Reference Andreassen, Elvehøy and Kjøllmoen2005; Zemp and others, Reference Zemp2013), and allow us to improve models for glacier ablation and glacier hydrology. Although many studies have focused on spatio-temporal changes of glaciers in the Tien Shan and their contribution to sea-level change (Yao and others, Reference Yao2012; Shangguan and others, Reference Shangguan2015; Sun and others, Reference Sun, Liu, Yao, Guo and Xu2015; Brun and others, Reference Brun, Berthier, Wagnon, Kääb and Treichler2017; Liu and others, Reference Liu, Wang and Bai2017; Wang and others, Reference Wang, Yao, Xu, Chen and Wang2019; Yang and others, Reference Yang, Zhao and Han2019), since long-term monitoring of glaciers remains scarce, limiting studies used to verify the accuracy of these results, except for Urumqi Glacier No. 1 (UG1). UG1 located in the eastern Tien Shan is one of the reference glaciers in the World Glacier Monitoring Service network and provides one of the longest time series and most detailed mass-balance measurement in China (Li and others, Reference Li, Li and Chen2011; Zemp and others, Reference Zemp2013). Several studies have focused on the mass balance, area and terminus measurements on UG1 (Li and others, Reference Li, Han, Jing, Yang and Qiao2003, Reference Li, Li and Chen2011; Jing and others, Reference Jing, Jiao, Yao, Wang and Li2006; Wang and others, Reference Wang, Li, Li, Wang and Yao2014, Reference Wang2016; Xu and others, Reference Xu2018, Reference Xu, Li, Li, Wang and Zhou2019). However, the accuracy of glacier change results has been greatly improved with the application of various field observation methods in recent years. For example, the Real Time Kinematic-Global Navigation Satellite System (RTK-GNSS) is currently the most accurate positioning method in GNSS measurement. RTK-GNSS can achieve dense points coverage and is suitable for glacier surface elevation measurement (Ding and others, Reference Ding, Ai, Wang, Hao and Tan2019). The terrestrial laser scanner (TLS) has accurately monitored summer and annual surface elevation and geodetic mass balance as well as delineated accurate glacier boundary (Xu and others, Reference Xu2017). TLS systems have been successfully monitoring the surface changes of a temperate Alpine glacier in Switzerland as well as the mass balance of five small glaciers in the European Alps at hourly and seasonal scales (Gabbud and others, Reference Gabbud, Micheletti and Lane2015; Fischer and others, Reference Fischer, Huss, Kummert and Hoelzle2016). Therefore, TLS has not only the potential to monitor remote and inaccessible glacier area where no glaciological measurements are available (Xu and others, Reference Xu, Li, Li, Wang and Zhou2019), but also has become a tool for monitoring seasonal changes of individual glaciers due to its wavelengths in the near-infrared, allowing long-range scanning of glacier surfaces (Gabbud and others, Reference Gabbud, Micheletti and Lane2015). Unmanned aerial vehicle (UAV) photogrammetry is widely applied in monitoring glacier changes during recent years. UAVs have been used on polar glaciers (Whitehead and others, Reference Whitehead and Hugenholtz2014a, Reference Whitehead2014b; Bhardwaj and others, Reference Bhardwaj, Sam, Akanksha and Kumar2016) as well as mountain glaciers in the Himalaya (Immerzeel and others, Reference Immerzeel2014) and the Andes (Wigmore and Mark, Reference Wigmore and Mark2017). Relatively inexpensive UAVs with advantages of small size, flexibility and centimeter-level resolution, can extract glacier surface elevation and ice velocity (Kraaijenbrink and others, Reference Kraaijenbrink2016; Che and others, Reference Che, Wang and Liu2019).
In this study, RTK-GNSS, TLS and UAV surveys conducted in 2012, 2015 and 2018 were used to obtain the DEMs of the glacier surface, respectively. The three high-resolution DEMs available allowed us to study the glaciological and geodetic methods to determine the mass balance. Therefore, the main objectives of this study include two aspects: (1) to quantify the mass loss of UG1 during the period 2012–18, and (2) to assess the feasibility of applying the three technologies.
2. Study area
Chinese Tien Shan lies in the arid region of central Asia, extending 2400 km from east to west and accounting for more than 34.5% of the total area of the Xinjiang Uygur Autonomous Region (Hu and others, Reference Hu2004). The topography is dominated by high mountains ranging from ~4000 to 6000 m a.s.l. (Fig. 1a). The Tien Shan was influenced by the Siberian anticyclonic circulation, the westerly jet stream in the upper troposphere, and the cyclonic disturbances of the west wind circulation (Farinotti and others, Reference Farinotti2015). There are 7934 glaciers in the Chinese Tien Shan with a total area of 7179.77 km2 and ice volume of 756.48 km3 according to Second Glacier Inventory of China (Liu and others, Reference Liu2015).

Fig. 1. Overview of the study area. (a) Location map of UG1 in the eastern Tien Shan. (b) The topographic map of UG1 with glacier boundary in different periods. The spatial distributions of TLS positions and RTK-GNSS base station are shown in red and blue circles. (c) Flight coverage area on 24 April 2018. Photographs of RTK-GNSS survey base station, TLS survey and UAV survey are shown in (d), (e) and (f), respectively.
UG1 (43°06′ N, 86°49′ E), a northeast-orientated valley glacier at the headwaters of Urumqi River situated on the Tianger Summit II in the eastern Tien Shan, has the longest continuous datasets among the glaciers in China (Fig. 1b). It has two branches. The east branch (EB) and west branch (WB) of the glacier separated completely in 1993 (Li and others, Reference Li, Li and Chen2011). It ranges from 4450 to 3743 m a.s.l. at the terminus. UG1 thinned at the rate of 0.34 m a−1 during 1980–2012, and the mean ice thickness was 44.5 m in 2012. The average annual mass balance was −0.46 m w.e. a−1 during the period 1980–2012, the average terminus retreat rate was 4.4 m a−1 in the same period with significant differences between the EB and WB caused by topographic differences (Wang and others, Reference Wang2016).
3. Data and methods
3.1 Glacier surface elevation, area and terminus
Glacier surface elevation and terminus location of UG1 were obtained using RTK-GNSS (Unistrong E650) on 1 September 2012. The GNSS base station was placed at the S2 near the glacier terminus (Fig. 1b). The other receiver was used in kinematic mode as a rover to survey the area on and around the glacier with a sampling interval of 20 m. The accuracy of the GNSS survey points has been reported to be within ±1 cm horizontally and ±2 cm vertically. The intercoordinate system conversion was performed using Unistrong Landtop (Wang and others, Reference Wang2016). All GNSS point data were re-projected to the Universal Transverse Mercator (UTM 45N) coordinate system, and referenced to the World Geodetic System 1984 (WGS84, EPSG: 4326). The point data were interpolated by the Kriging interpolation method to produce the RTK-GNSS_DEM, with a grid resolution of 5 m (Table 1).
Table 1. Data information for UG1 used in this study
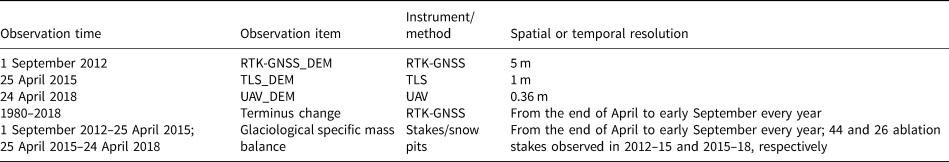
Glacier surface elevation was measured again by Riegl VZ®-6000 TLS on 25 April 2015. TLS surveys of UG1 were performed from four scan positions (S1, S2, S3 and S4) (Fig. 1b). To avoid ground motion and to obtain accurate coordinates of point clouds, each scan position was fixed using reinforced concrete. The four scan positions were surveyed using the RTK-GNSS to obtain accurate direct georeferencing and registration. In order to obtain the maximum scanning range of the glacier surface, coarse scanning was first implemented with vertical and horizontal angles range of 60–120° from zenith and 0–360°, respectively, and the laser pulse repetition rate was set to 50 kHz. A fine scan is a rectangular field-of-view scan, and the selected field should always cover the entire glacier to guarantee the overlap percentage of four scans was at least 30%. The overlap percentage of each pair of scans was not <30% to meet the requirements of multi-station adjustment, which was used for the data registration of each scan position according to the iterative closest point algorithm (Besl and McKay, Reference Besl and Mckay1992). RiSCAN PRO® v 1.81 software was applied to process original point cloud data of UG1, including direct georeferencing, point cloud registration, point cloud data compression (Perroy and others, Reference Perroy, Bookhagen, Asner and Chadwick2010) and a terrain filtering (RIEGL Laser Measurement Systems, 2014). Finally, the TLS_DEM was generated with a spatial resolution of 1 m from TLS measurement (Table 1).
The glacier surface of UG1 was surveyed on 24 April 2018 by using a UAV (MATRICE 200) made by DJI Technology Co., Ltd. Two flights were carried out with a flying height of 120 m for each flight. The overlap between the two flights was 80%, and the camera pitch angle was 70°. The flight parameters were set in Pix4D Mapper software. However, because of the lack of battery power caused by the low temperature in the high-altitude mountainous area, the UAV survey could be only conducted over the glacier tongue as shown in Figure 1c. The total coverage area of UAV survey was 1.39 km2. The takeoff point and survey range of UAV is also shown in Figure 1. Twenty-one ground control points (GCPs) marked by 1.5 m × 1.5 m red waterproof cloths with a yellow cross in the center evenly distributed on the off-glacier regions, were surveyed by RTK-GNSS simultaneously. The coordinates of GCPs are adopted in the WGS84 datum (EPSG: 4326) and UTM 45N projection. The photographs and GCPs were imported into Pix4D Mapper for automatic processing, and finally UAV_DEM was generated (Table 1).
In order to compare DEMs from different periods, this paper resampled DEMs to a spatial resolution of 5 m, and carried out coordinate normalization using WGS84 datum (EPSG: 4326) and UTM 45N projection.
3.2 Accurate glacier outline extraction
An accurate and updated glacier area was important for both geodetic and glaciological mass-balance calculations (Zemp and others, Reference Zemp2013). Fresh snow cover probably led to an overestimate of glacier extent at the beginning of the ablation season. To reduce the influence of snow cover and extract accurate glacier outlines, we mainly considered glacier extents at the end of the ablation season. Glacier boundary was derived from a high-resolution image data in August 2012 as shown in Figure 1b (Yao and others, Reference Yao, Li, Wang, Huai and Zhang2015). Glacier boundary in 2015 was extracted from shaded relief based on TLS_DEM. The UAV_DEM has only covered the glacier tongue (Fig. 1c). Due to the incomplete boundary in 2018 extracted from shaded relief, missing upper boundary in 2018 was filled with the upper boundary in 2015 considering the upper glacier boundary generally remains in steady state (Xu and others, Reference Xu, Li, Li, Wang and Zhou2019). The manually delineating glacier boundaries are shown in the shaded relief (Fig. 2).
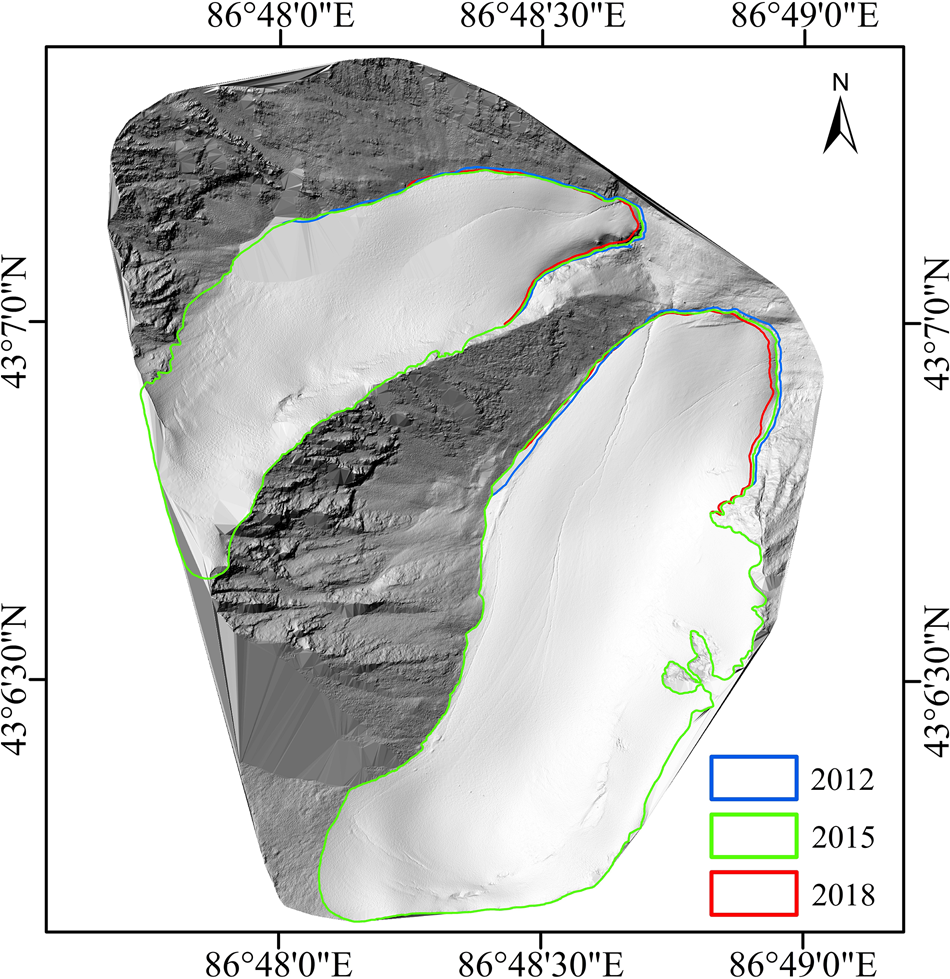
Fig. 2. Shaded relief of UG1 calculated based on the TLS_DEM (on 25 April 2015) with the glacier boundary in 2012 (blue), 2015 (green) and 2018 (red). The shaded relief calculated through Arcmap 10.3 software with the solar azimuth angle and elevation angle set to 315° and 60°, respectively.
3.3 Mass-balance measurement
The mass-balance year of UG1 is defined from 1 September in the previous year to 31 August (Li and other, Reference Li2020). The single-point specific mass balance has been measured by stake/snow pit method from the end of April to early September each year. Forty-four ablation stakes were drilled into the glacier surface in 2012 using a steam drill and arranged in seven or eight rows at different altitudes of the two branches (Fig. 1b). The measurements include the stake vertical height above the glacier surface, superimposed ice thickness and the density and thickness of each snow/firn layer at individual ablation stakes. Snow and ice density presumably use field measurement values when the vertical height of snow/firn layer >5 cm. Glaciological specific mass balance can be calculated as follows (Wang and others, Reference Wang2017):

where b s, b ice and b si are mass balance of snow, glacier ice and superimposed ice, respectively. Measured stake and snow pit heights combined with snow, firn and ice density were converted into mass (w.e.) to calculate glacier-wide mass balance. The detailed information of mass-balance datasets used in this study is shown in Table 1.
3.4 Accuracy analysis
3.4.1 Glacier surface elevation change co-registration
The RTK-GNSS_DEM and UAV_DEM were adjusted based on the TLS_DEM. The uncertainty of the DEMs (σ DEM) is estimated by comparing the DEM values with an independent set of GCPs on off-glacier regions. Ten independent GCPs on off-glacier regions were selected to perform the uncertainty of the DEMs using the following equation (Paul and others, Reference Paul2015):

where n is the number of off-glacier regions DEM grid cells. The results are shown in Table 2.
Table 2. Statistics of accuracy of DEMs and vertical errors between 2012 (RTK-GNSS_DEM), 2015 (TLS_DEM) and 2018 (UAV_DEM)
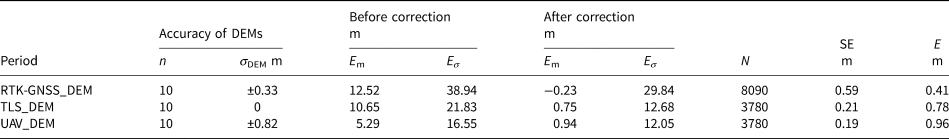
N is the number of GCPs on off-glacier regions, σ DEM is the uncertainty of the DEMs, E m is the mean elevation changes on off-glacier regions, Eσ is the std dev., SE is the standard error, E is the overall error of the derived surface elevation change and N is the number of considered pixels.
In order to make the differencing of the DEMs in different periods, a co-registration of the DEMs was necessary before extracting glacier surface elevation changes (Nuth and others, Reference Nuth and Kaab2011). Based on the cosinusoidal relationship between elevation difference and topographical parameters (slope and aspect), the horizontal displacements and vertical biases were rectified simultaneously (Figs 3a, c, e). The biases, caused by different spatial resolutions between the two datasets, were refined using the relationship between elevation differences and maximum curvatures for both on- and off-glacier regions (Gardelle and others, Reference Gardelle, Berthier and Arnaud2012) as shown in Figures 3b, d and f. The overall errors of the derived surface elevation changes (E) can then be estimated using E m and Eσ from off-glacier regions as following and the estimated results is as shown in Table 2. After co-registration, mean elevation differences (E m) in off-glacier regions ranged from −0.23 to 0.94 m. This indicated elevation differences in the off-glacier regions had stabilized after these adjustments, making the processed DEMs suitable for estimating glacier surface elevation and mass balance:


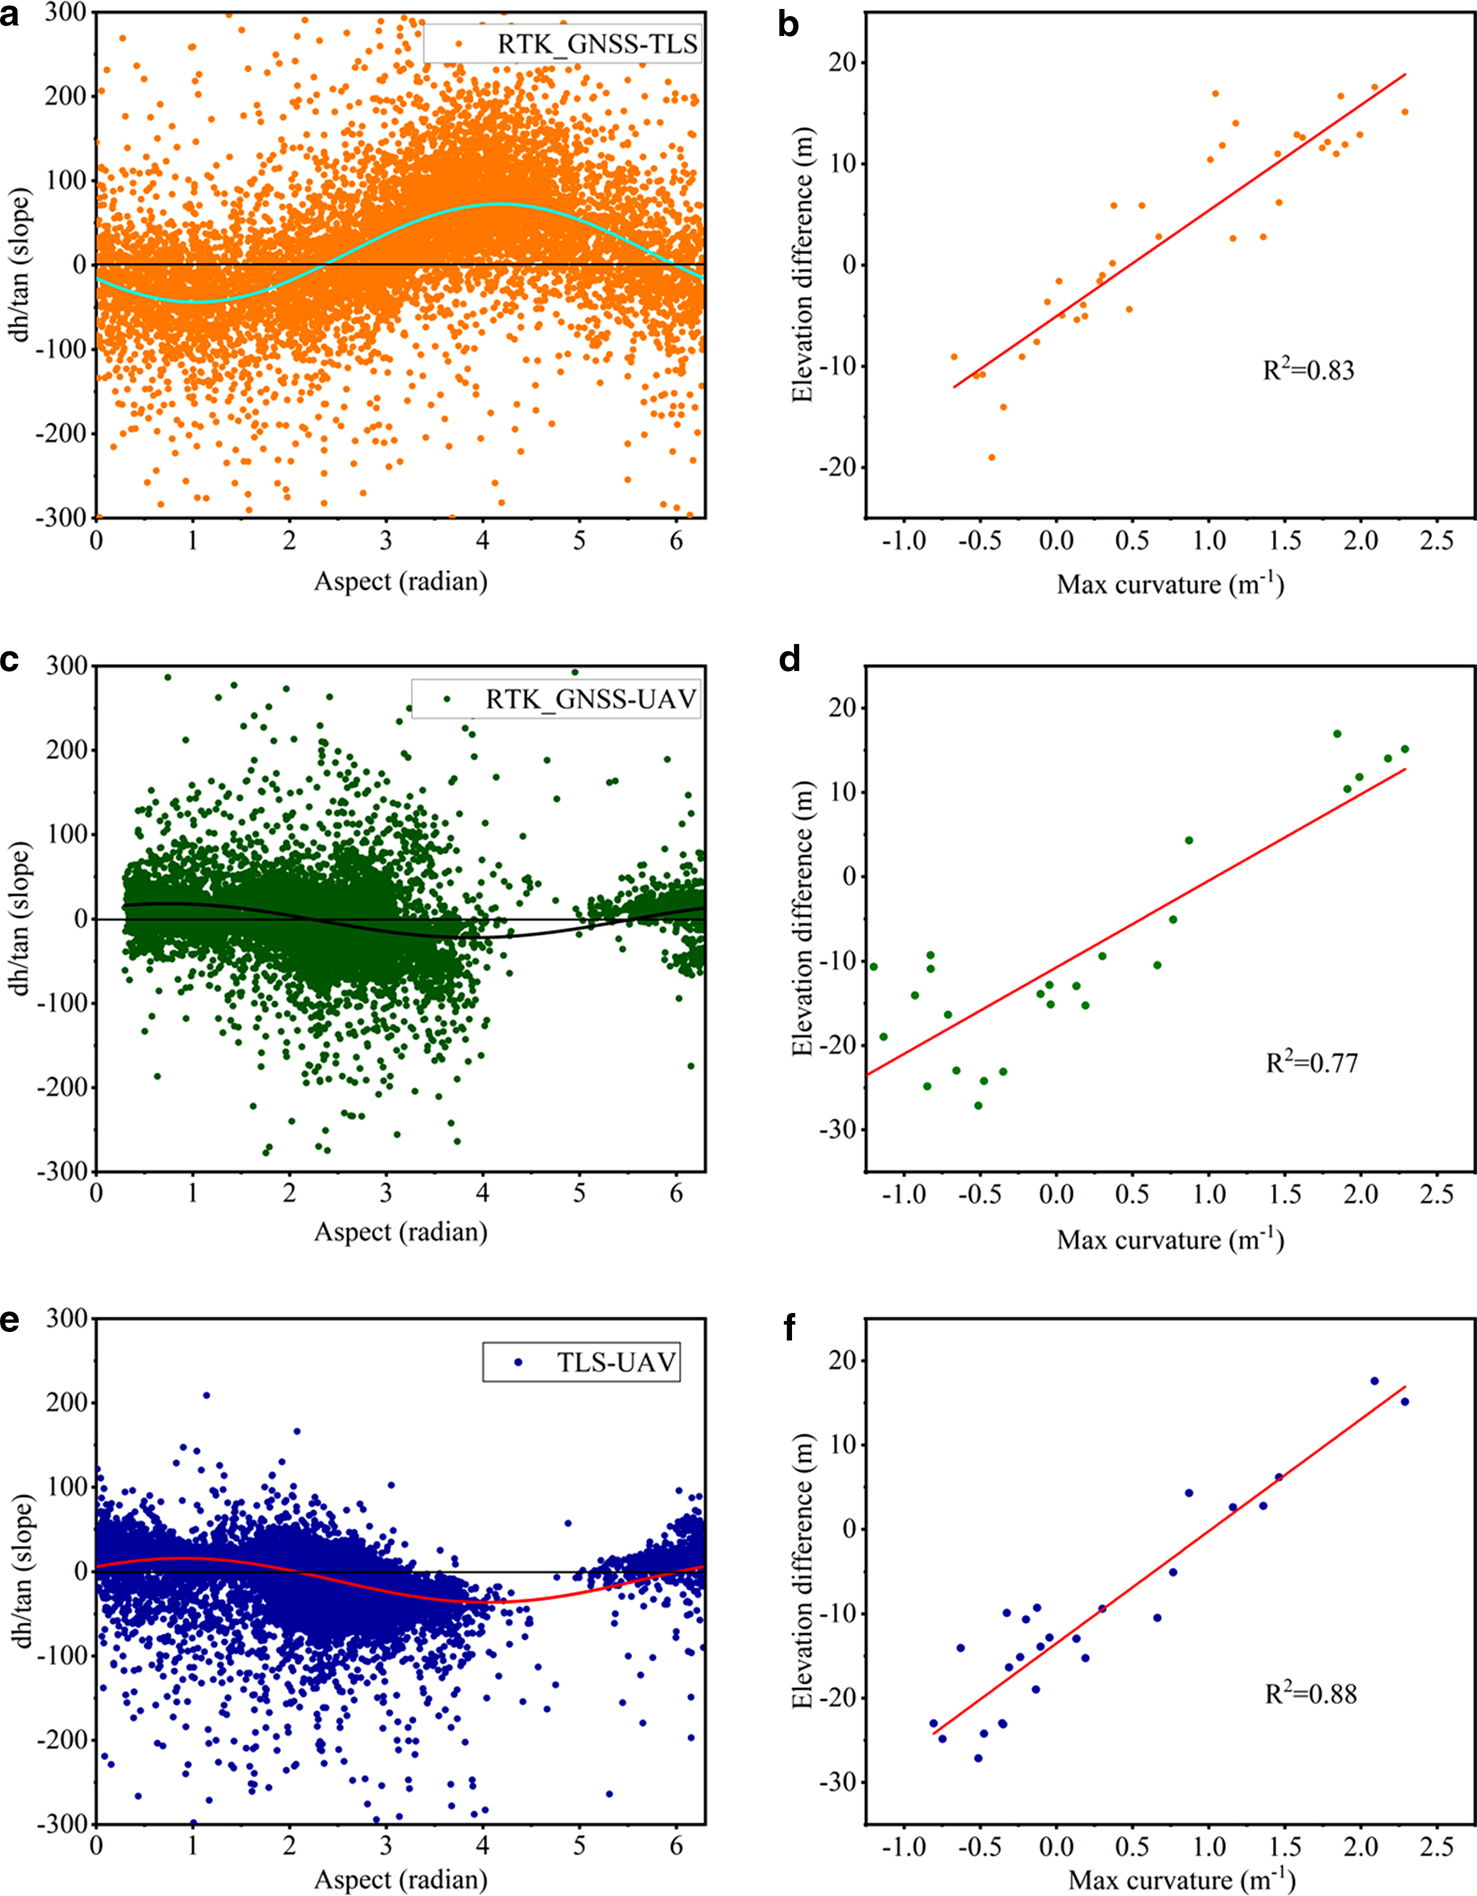
Fig. 3. Scatterplots of (a, c, e) aspect vs slope standardized elevation differences and (b, d, f) maximum curvature vs elevation difference.
3.4.2 Glacier area and terminus
The uncertainty in the glacier area and terminus changes for an individual glacier during 2012–18 can be estimated according to Williams and others (Reference Williams, Hall, Siguresson and Chien1997), Hall and others (Reference Hall, Bayr, Schöner, Bindschadler and Chien2003) and Silverio and Jaquet (Reference Silverio and Jaquet2005):


where U T and U A are the uncertainty of the glacier terminus and area, respectively. λ is the resolution of each individual image, and ɛ is the registration error of each image. Especially, the registration error keeps within one pixel. The overall evaluation indicated that the uncertainties of glacier terminus and area change are 5 m and 0.07 × 10⁻³ km2 in 2012–15, 1 m and 0.01 × 10⁻³ km2 in 2015–18 and 5 m and 0.07 × 10⁻³ km2 in 2012–18, respectively.
3.4.3 Glacier mass balance
The geodetic mass balance is calculated by multiplying the volume change with the mean density, and then dividing by the area which refers to the larger glacier area of the two periods (Zemp and others, Reference Zemp2013). The uncertainty of glacier-wide elevation changes (σ 2Δh) for individual glacier was quantified using the geostatistical analysis methods of Rolstad and others (Reference Rolstad, Haug and Denby2009). In order to convert volume change to w.e. for the entire glacier, a density of 850 kg m−3 (ρ), with its uncertainty of ±60 kg m−3 (σρ), is used. According to Huss and others (Reference Huss, Bauder and Funk2009), the uncertainties of the geodetic mass balance (σ geod) can be estimated using the following equation:


where S is the glacier area, $\overline {\Delta h}$ is the average of glacier-wide elevation changes, S cor is spatially correlated area and we conservatively estimate S cor is equal to S (Fischer and others, Reference Fischer, Huss, Kummert and Hoelzle2016).
The uncertainties of glaciological mass balance are classified into two parts: random errors and systematic errors in our study and were quantified by std dev. (σ) (Thibert and others, Reference Thibert, Blanc, Vincent and Eckert2008). The random errors consist of the accumulation and ablation errors caused by ice and firn as follows.
The accumulation error (σ accu). Mass-balance processes of UG1 primarily occur in the ablation season. Density is mainly affected by the liquid water at the same time and therefore overestimated. We obtained the firn density (762 kg m−3) according to the snow pits observation data from 2012 to 2018. Kelley and others (Reference Kelley, Stanford, Koci, Wumkes and Zagorodnov1994) suggest that density uncertainty is within 5% resulting in an absolute of 0.03 in our case. The accuracy of accumulation depends on glacier surface roughness and physical properties of the underlying material (Thibert and others, Reference Thibert, Blanc, Vincent and Eckert2008). The difference in underlying material means accumulation will be overestimated when firn is present, and not affected when the underlying material is ice. Considering the temporal and spatial variations of snow depth on glaciers, the final snow depth value (I = 0.78 m) was obtained by averaging the interpolation results over the period 2012–18 in our study. σ accu can be expressed as follows:

where firn snow density (d) is 762 kg m−3, firn snow density error (σ d2) is 0.03 and 0.35 m was adopted as the error on surface roughness (σ rgh2) (Rees and Arnold, Reference Rees and Arnold2006). Finally, the accuracy of accumulation is given as ±0.27 m w.e. a−1.
The ablation error measured in ice (σ ice). The error due to the creep of ice was negligible because the observed decrease in ice velocity along the centerline was 3.6 m a−1 from 1981 to 2012 (Wang and others, Reference Wang2018). Thus, the inaccurate surface at the bottom of stakes was only directly linked to the uncertainty of ablation measured in ice. Therefore, ±0.14 m w.e. a−1 was adopted as the uncertainty of ablation measured in ice (Thibert and others, Reference Thibert, Blanc, Vincent and Eckert2008).
The ablation error measured in firn (σ firn). The error involves stakes being inserted in the underlying ice but emerging from the residual firn of previous year(s) and digging snow pits for mass-balance measurements when the snow buried the stakes, respectively. However, the drops of the ablation stakes are limited during the mass-balance measurement and can be difficultly evaluated. The ablation stake is missing when the ablation stake is buried by snow, so there is no digging in the mass-balance measurements. Therefore, uncertainty for ablation measured in firn cannot be determined.
Sampling error (σ samp). The sampling error σ samp can be expressed as the ratio between the overall spatial variability of mass balance (σ sp) and the numbers of ablation stakes (n) as shown in Eqn (10). The σ sp is the ratio of the area occupied by the ablation stakes to the total area of UG1, which was ~80% according to the mass-balance measurement of UG1. The n was chosen as 44 representing the average number of ablation stakes from 2012 to 2018. This gives a sampling error of ±0.12 m w.e. a−1:

Internal accumulation and ablation. With the traditional stake/snow pits method, the surface mass balance is measured and measurements of the internal accumulation and internal ablation are always excluded (Østrem and Brugman, Reference Østrem and Brugman1991). This can lead to annual small but significant systematic cumulative errors. Internal accumulation happens due to re-freezing of water trapped by capillary action in snow and firn by the winter cold (Schneider and Jansson, Reference Schneider and Jansson2004). Internal ablation is due to ice motion, geothermal heat and water flow. However, systematic errors related to internal accumulation and ablation cannot be quantified due to the lack of corresponding information.
Taking into account the factors mentioned above, the annual uncertainty of glaciological mass balance (σ glac) is therefore ±0.32 m w.e. a−1 without considering the systematic uncertainties. The cumulative uncertainty of glaciological mass balance is ±1.92 m w.e. for the period from 2012 to 2018:

3.5 Differencing DEM quality
The survey accuracy about RTK-GNSS can reach the resolution in centimeters, and glacier surface elevation was obtained through dense points coverage. Zhang and others (Reference Zhang, Kang and Wang2017) extracted the surface elevation of DinSAR_DEM and RTK-GNSS_DEM at individual ablation stakes. The results show that the correlation coefficient between them is 0.6 and the RTK-GNSS_DEM surface elevation is greater than the DinSAR_DEM surface elevation (Zhang and others, Reference Zhang, Kang and Wang2017). Moreover, RTK-GNSS_DEM may be affected by its survey points' density. The survey points are sparse at the upper area and lower tongue of the glacier because of the steep terrain causing the difficulty in arriving.
For TLS scanning, the visual angles of scanning location and atmospheric conditions are important factors to obtain high-quality point cloud data. Dry and windless weather conditions are a prerequisite for high-quality data collection. There was no precipitation and little wind speed before noon at UG1. In the cloudy sky around the glacier, in order to obtain high-quality point cloud data, we have to set up multiple scanning positions to scan the surface area of the glacier as much as possible. In our fieldwork, the overlap percentage of point clouds in the four scanning positions exceeds 30% covering the entire glacier. Although the scanning positions are limited in this study, we can find the best visual angles to get the maximum scanning range. Ideally, in order to obtain better visual angles, the distribution of scanning positions should be located in different elevation bands and directions. However, it is not always easy to access the higher parts to set up the instruments. Overall, the point cloud data and TLS_DEM obtained by TLS scanning in this study can meet the requirement for monitoring UG1.
The uncertainty of DEM differencing was derived from systematic shifts of DEMs in the horizontal and vertical directions (Nuth and others, Reference Nuth and Kaab2011). The mean uncertainty of glacier surface elevation changes was ±0.71 m (Table 2), indicating that elevation differences in the off-glacier regions had stabilized after these adjustments and the DEM differencing is encouraging.
4. Results
The RTK-GNSS survey in 2012 and the TLS survey in 2015 were conducted for the whole UG1, whereas the UAV survey in 2018 was concentrated in the glacier tongue covering the elevation from 4150 to 4300 m a.s.l. for the WB and from 3743 to 4000 m a.s.l. for the EB, respectively. Therefore, the glacier elevation changes are studied in this elevation range for the periods 2015–18 and 2012–18.
4.1 Area change
The area of UG1 was 1.59 km2 in 2012, 1.55 km2 in 2015 and 1.52 km2 in 2018, respectively. The glacier area has shrunk by 0.07 ± 0.07 × 10⁻³ km2 between 2012 and 2018 (Table 3). Combined with the area of 1962–2012, it was found that the area of UG1 reduced by 3.87% from 1962 to 2018 (Fig. 4a). The area reduced by ~0.32% in 1962–73, 0.23% in 1973–86, 0.78% in 1986–2000, 1.21% in 2000–12 and 1.33% in 2012–18, respectively. Overall area reduction demonstrated an increasing and then decreasing trend before 1986 and afterward kept increasing continuously. One possible reason is that the annual temperature played a most important role in this period (Wang and others, Reference Wang2016). Although the period between 2012 and 2018 was less than a decade, the area loss was markedly higher than during the earlier periods of 1962–73 and 1973–86. In the future, the glacier area shrinkage will probably be continued under the current climate change by analyzing the previous change trend.
Table 3. Mean elevation change, mass balance, area and terminus changes during the three periods for UG1
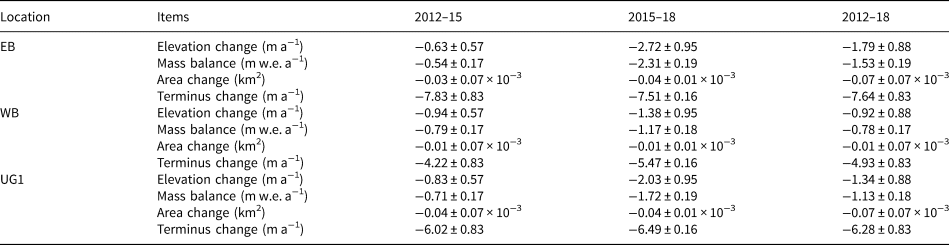
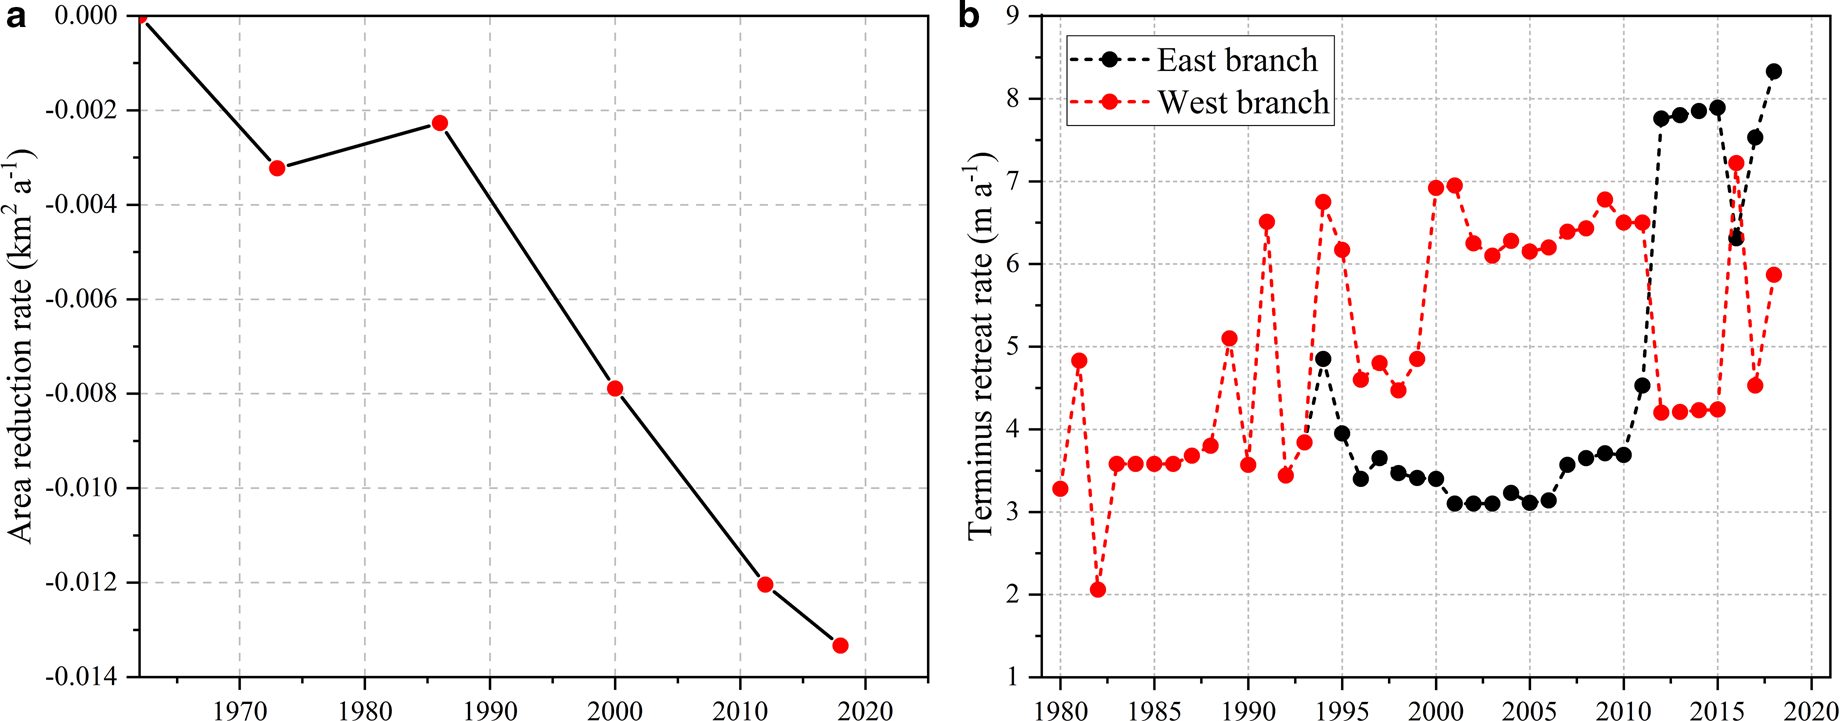
Fig. 4. Glacier area reduction rate for different periods between 1962 and 2018 (a). Terminus retreat rate of EB and WB during 1980–2018 (b).
4.2 Terminus change
As shown in Table 3 and Figure 4b, the terminus retreat rate of UG1 was 6.28 ± 0.83 m a−1 during 2012–18. The retreat rate was 7.64 ± 0.83 and 4.93 ± 0.83 m a−1 for the EB and WB, respectively. Compared with the rate during 2012–15 (6.02 ± 0.83 m a−1), the terminus retreat accelerated during 2015–18 (6.49 ± 0.16 m a−1). The terminus retreat rate of EB for the period 2012–18 was greater than that of WB. Comparing with the previous studies about glacier terminus change (Wang and others, Reference Wang2016), it is found that the terminus retreat rate was 3.89 m a−1 during 1980–93 before the glacier separated and then continued to retreat during 1994–2018. There are two obvious terminus retreat stages: during 1994–2011, the overall terminus retreat rate was 4.81 m a−1, with the WB terminus retreat rate (6.06 m a−1) larger than that of EB (3.56 m a−1). The terminus retreat rate during 2012–18 (6.28 ± 0.83 m a−1) was significantly larger than the former (4.81 m a−1).
The difference in glacier terminus changes for the EB and WB was determined not only by mass balance but also glacier dynamics (Li and others, Reference Li, Li and Chen2011). For example, the terminus retreat rate coincided with the thinning rate during 2012–18 (see Section 4.3). Second, the glacier tongue of WB has a slope orientation of southeast, and the EB is sheltered by a mountain headwall. The inter-annual variation of the ice velocity is known to act on the terminus. It is shown that the ice velocity of the EB after 2012 is significantly lower than that of WB (Wang and others, Reference Wang2018). The combination of these factors may lead to that the WB retreat rate is greater than that of the EB only under the scenario of the same climate condition.
4.3 Surface elevation and mass balance
Figure 5 shows the glacier surface elevation changes for UG1 during 2012–18. Distributed elevation change patterns are generally similar for three periods characterized by thinning in the glacier tongues. Comparing to the glacier tongue during 2012–15, surface lowering was greater during 2015–18. EB mass loss was smaller during 2012–15, and afterward greater during 2015–18, this may be related to the slope and direction and the accumulation area of EB. The EB mass loss in glacier tongue was greater than that of WB during 2015–18. Table 3 shows mean glacier surface elevation changes and specific mass change rates for three periods, the mass change rate of EB generally was about twice as much as the WB.
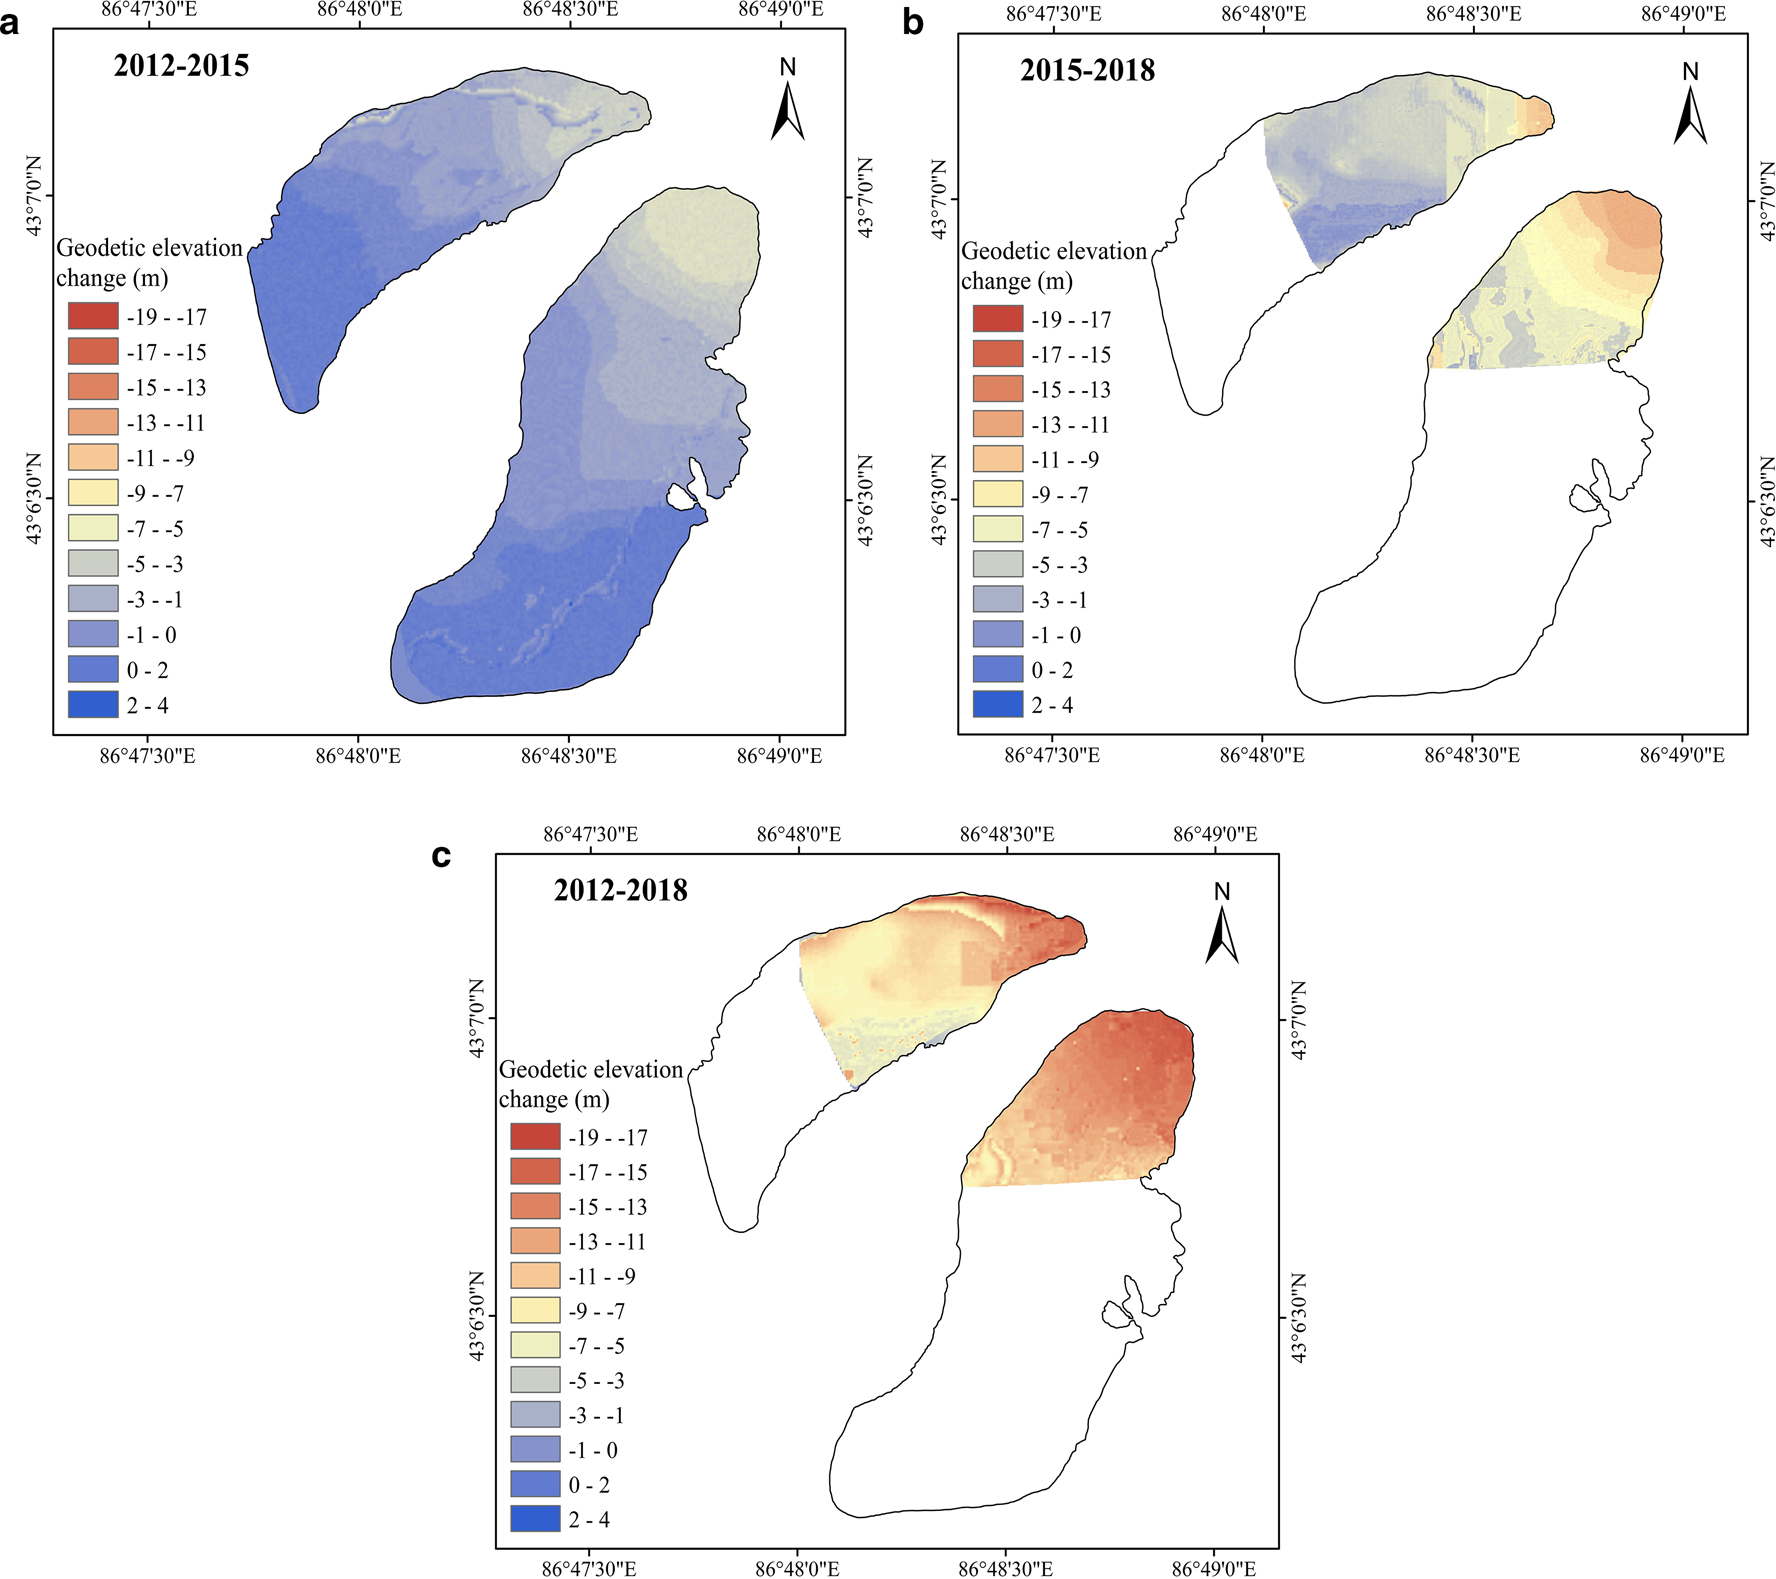
Figure 6 shows mass balance vs altitude of UG1, with histograms and polyline representing glacier area and mass balance in different altitude intervals, respectively. The mass-balance elevation distribution remained similar; specific mass balance increased with rising altitude. EB with the altitude above 4200 m a.s.l. showed a slightly decreasing accumulation, which may be associated with glacier dynamics. Mass balance and vertical black line met where the glacier mass balance was close to the equilibrium-line altitude in 2012–15; the corresponding altitudes of the EB and WB were 3950 and 4025 m a.s.l., respectively. Based on the geodetic mass balance derived from TLS (Xu and others, Reference Xu, Li, Li, Wang and Zhou2019), the equilibrium-line altitudes of UG1 in 2015–18 will shift: the equilibrium-line altitudes of EB may change little and the equilibrium-line altitudes of WB will rise. Although glacier extent in 2015–18 and 2012–18 was concentrated in the glacier tongue and resulting mass-balance change with elevation was incomplete, mass balance increased with rising altitude is obvious (Figs 6c, d, e, f).
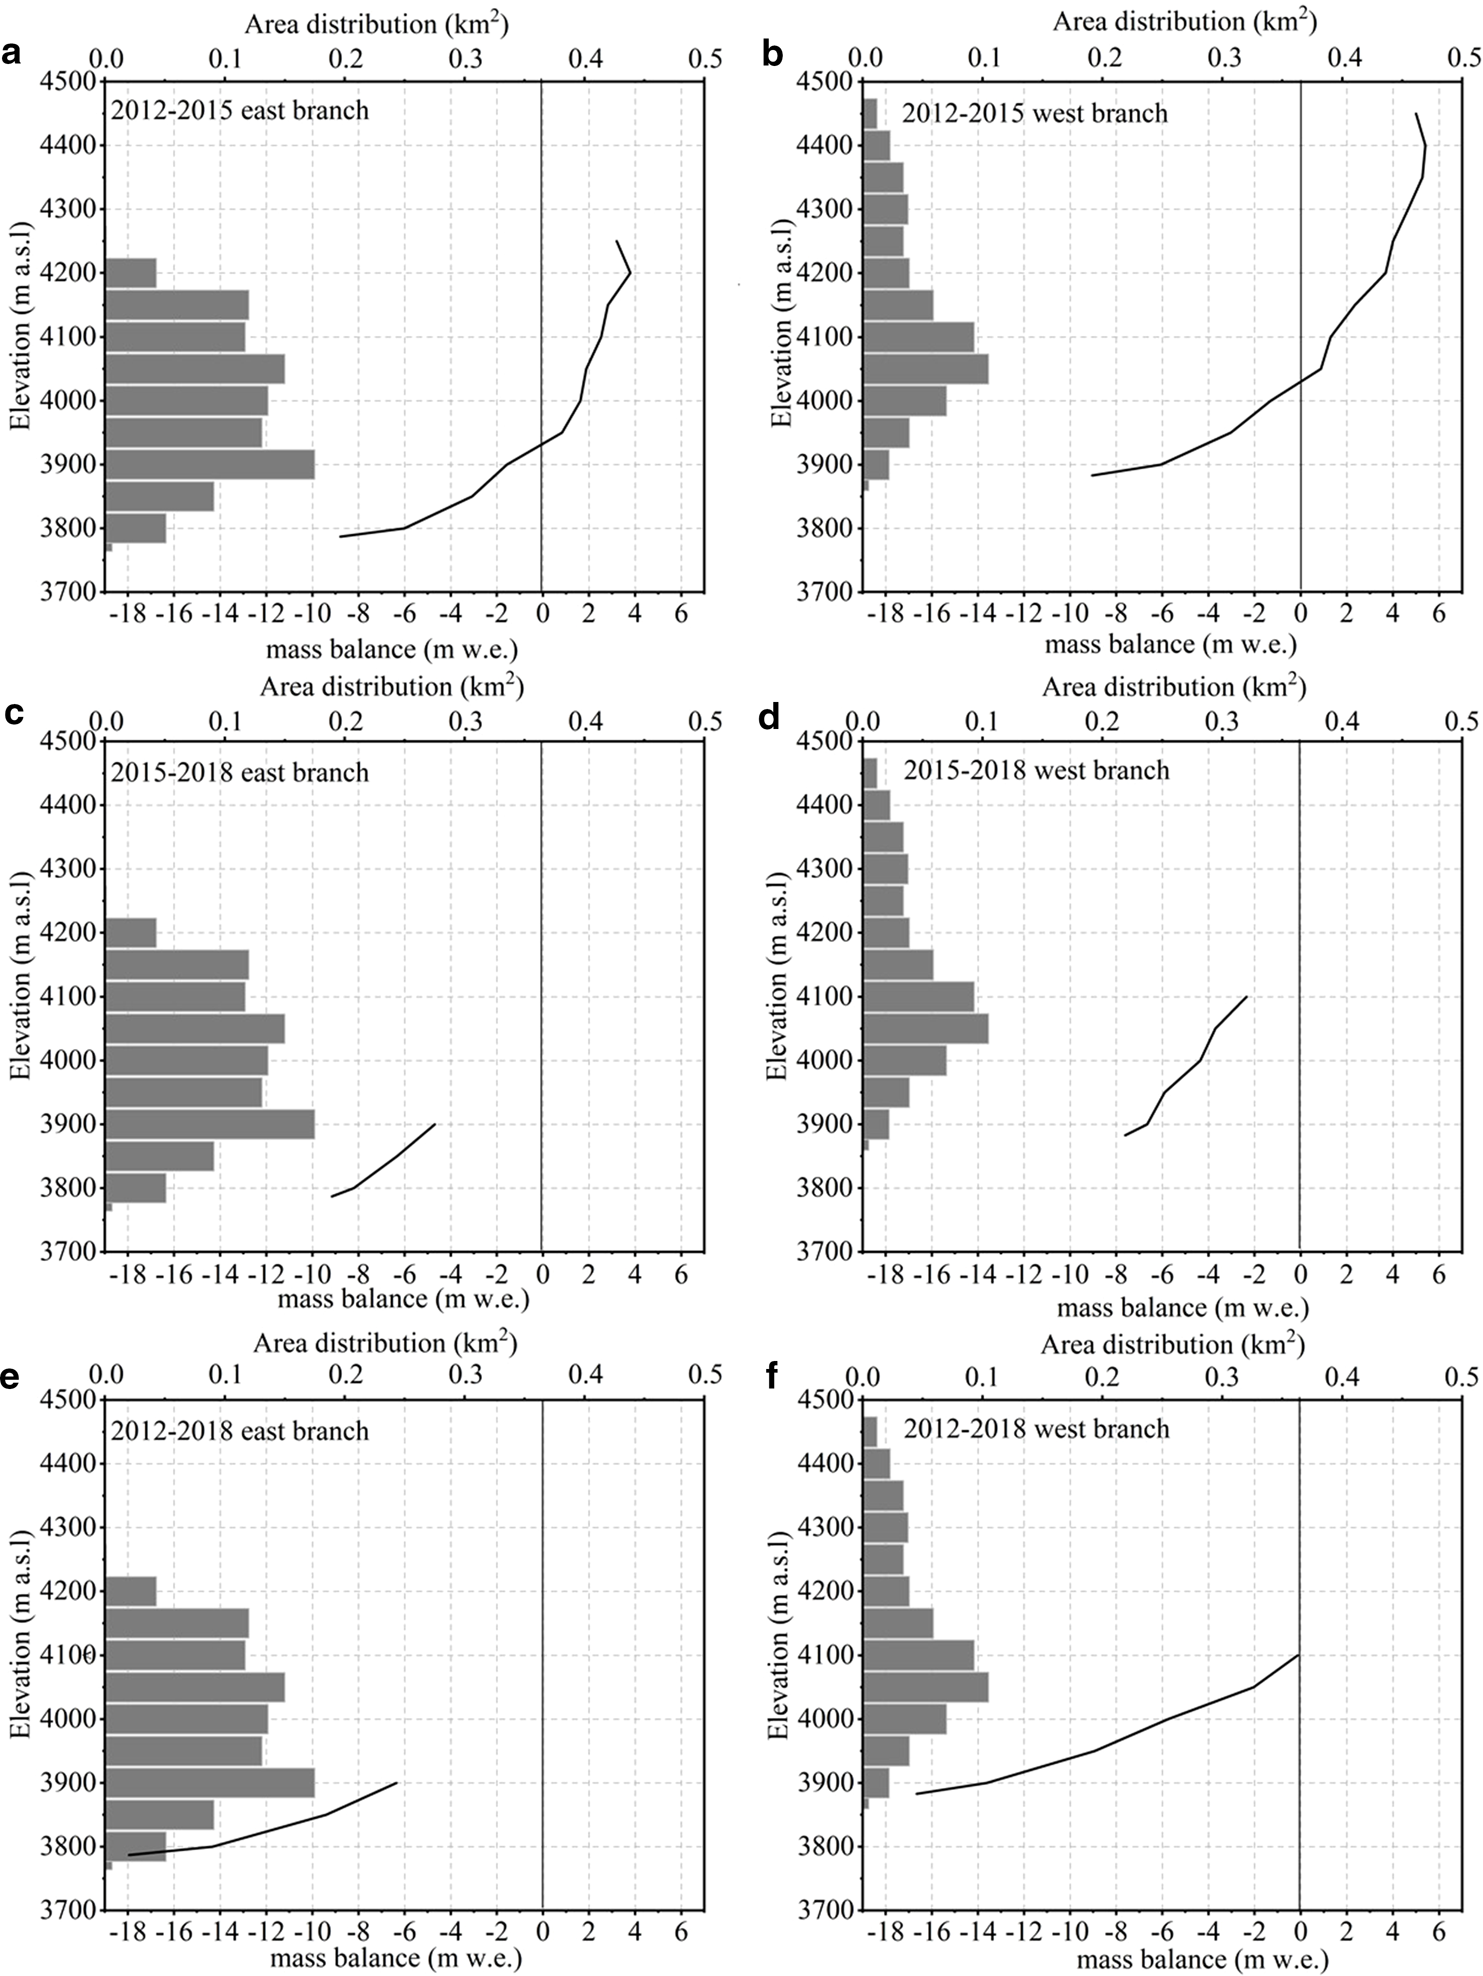
Fig. 6. Geodetic mass-balance change with elevation. Gray horizontal bars indicate the area–elevation distribution of UG1. Vertical black line represents the equilibrium-line altitude. Note that the glacier extent in 2015–18 and 2012–18 was concentrated in the glacier tongue and mass-balance change with elevation was incomplete. Altitude is obtained from the DEM which is obtained from RTK-GNSS, TLS and UAV with the resolution of 5 m. The glacier outlines are based on the glacier boundary of 2015 and 2018.
5. Discussion
5.1 Comparison of geodetic and glaciological mass balances
Geodetic mass balance of UG1 was previously calculated from 1981 to 2009, and the difference between the geodetic and glaciological mass balance was <10% (Wang and others, Reference Wang, Li, Li, Wang and Yao2014). In order to calculate the statistical significance between the geodetic and glaciological mass balances, and validate the geodetic against the glaciological mass balance, Zemp and others (Reference Zemp2013, Eqns 19–21) defined the reduced discrepancy (δ) as the closer the reduced discrepancy is to zero if the geodetic and glaciological mass balances is more consistent. The values of δ range from 0.03 to 0.22. As δ falls within the 95% (|δ| < 1.96) confidence intervals, the agreement between the geodetic and glaciological mass balances can be considered satisfactory as shown in Table 4. A calibration of the glaciological mass-balance record is therefore currently not necessary.
Table 4. Geodetic mass balance (B geod) with its uncertainty (σ geod) and glaciological mass balance (B glac) with its uncertainty (σ glac) of UG1 for the given time periods
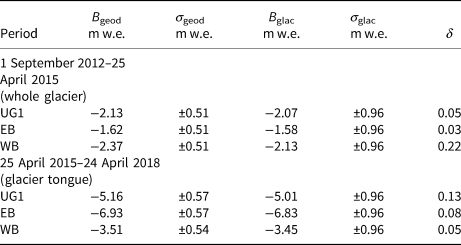
δ is the reduced discrepancy.
However, the UAV survey in 2018 was only concentrated in the glacier tongue. Therefore, the specific mass balances measured at individual ablation stakes in the glacier tongue were utilized for a comparison with the geodetic specific mass balances at the corresponding locations for the period from 1 September 2012 to 24 April 2018, and 25 April 2015 to 24 April 2018. The glaciological specific mass balance matched geodetic specific mass balance (Fig. 7). The correlation coefficients (R 2) between the glaciological specific mass balance and geodetic specific mass balance were >0.88, and the RMSEs were between 0.70 and 1.32 m w.e. a−1.
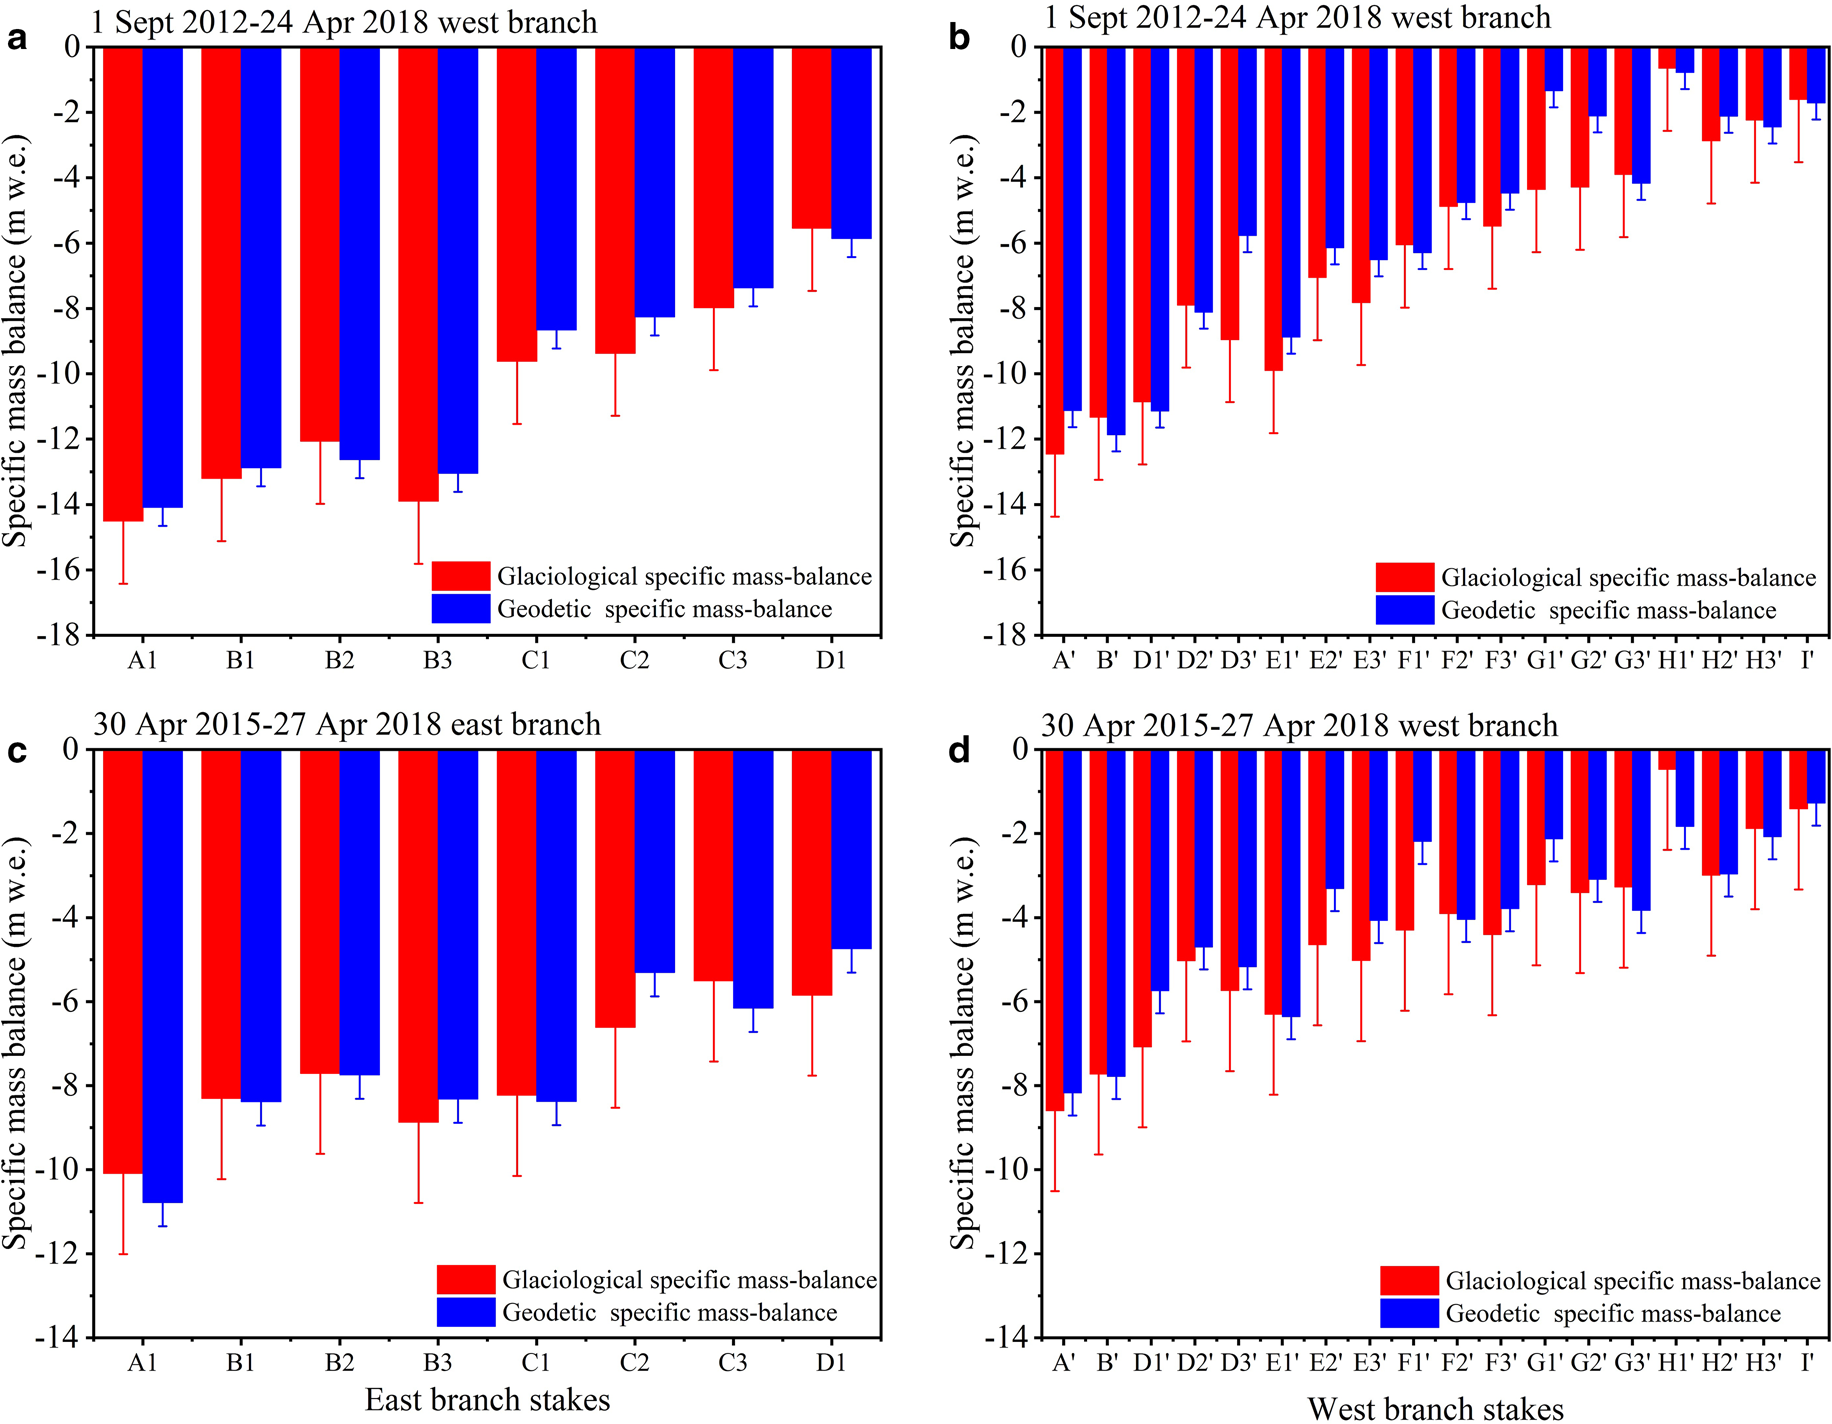
Fig. 7. Comparison between glaciological and geodetic specific mass balance for the period from 1 September 2012 to 24 April 2018 and from 25 April 2015 to 24 April 2018; red and blue error bars represent glaciological and geodetic specific mass-balance errors. The horizontal axis represents the serial numbers of the ablation stakes as shown in Figure 1b.
5.2 Accuracy of geodetic and glaciological mass balance
The quality of geodetic mass balances relies on the accuracy of glacier surface elevation changes and density conversion of volume-to-mass changes. With regard to density conversion, this study used 850 ± 60 kg m−3 recommended by Huss (Reference Huss2013). Calculated uncertainties in the geodetic mass balances ranged from ±0.17 to ±0.19 m w.e. a−1, with an average value of ±0.17 m w.e. a−1 for the investigated periods (Table 3). This may be related to differencing DEM quality (see Section 3.5) and system error in three techniques' survey (multiple scan positions and a larger scanning range, flight altitude).
The uncertainty of mass-balance measurements was ±0.32 m w.e. a−1 during 2012–18, which is greater than that of previous studies probably due to more comprehensive determination of the ablation error measured in ice and firn in our study (Wang and others, Reference Wang, Li, Li, Wang and Yao2014; Xu and others, Reference Xu, Li, Li, Wang and Zhou2019). Nonetheless, comparison of geodetic and glaciological mass balances can be considered satisfactory (see Section 5.1).
5.3 The relationship between the surface elevation, area and terminus changes
The cumulative change rate as an index can be used to analyze the relationship between the surface elevation, area and terminus. The cumulative change rates of surface elevation, area and terminus during 1962–2018 are shown in Figure 8. UG1 experienced terminus retreating and thinning, however, the decreasing rate of different periods showed differences. In the period 1962–81, area reduction rate was consistent with terminus retreat rate except for the surface elevation thinning rate. The area reduction rate (5.7%) and terminus retreat rate (4.9%) were still larger than the surface elevation thinning rate (1.4%) during 1981–86. From 1986 to 2001, the surface elevation thinning rate was the same as the terminus retreat rate, and was smaller than the area reduction rate. From 2001 to 2006, the surface elevation thinning rate increased significantly compared with the terminus retreat rate, and exceeded the area reduction rate after 2012. Although we did not obtain the whole surface elevation thinning rate of UG1 for the period 2015–18 in this study, Li (Reference Li2010) used the modified glacier dynamic models to predict the future changes of UG1, showing that the surface elevation thinning rate will be larger than the area reduction and terminus retreat rate before 2100 assuming that the future climate will remain unchanged. Although the surface thinning rate in 1961–81 is almost not changing, the glacier surface elevation thinning mainly contributed to glacier change in 1961–2018, and it was the largest contributor to local mass change especially in the long term.

Fig. 8. Relationship between the surface elevation, area and terminus change rate of UG1 in the different periods. Note that cumulative change rates from 1962 to 2006 are derived using data from Wang (Reference Wang2011). No value of surface elevation thinning rate in 2015–18 was due to incomplete UAV_DEM (Fig. 1c).
The area change and the terminus change start to diverge since 1981: the terminus retreat rate is less than the area reduction rate (Fig. 8). The surface elevation change determines glacier retreat or thinning. Since UG1 is in the U valley below 3880 m a.s.l., and the ice is concentrated, the terminus retreat rate was relatively small until UG1 retreated to the altitude of 3880 m a.s.l. (Li, Reference Li2010). Glacier mass balance (glacier surface elevation) is the most direct response to climate change. There was a delay and a response time of terminus change to a mass-balance disturbance caused by climate change (Paterson, Reference Paterson1994), probably resulting in surface elevation thinning while the terminus remained relatively stable.
5.4 Potential of the RTK-GNSS, TLS and UAV applied in glacier change monitoring
This study presents the application of three technologies in monitoring the change of UG1. The cross application of RTK-GNSS, TLS and UAV technology in glacier change can not only complement each other's advantages, but also provide more accurate results of glacier change (Fig. 9). The greatest strength of the TLS is the long-range scanning, which allows most of the glacier surface to be measured, especially in the upper steep area of the glacier. The geodetic mass balance based on the TLS in the upper steep area is well consistent with the glaciological mass balance (Xu and others, Reference Xu, Li, Li, Wang and Zhou2019; Fig. 7). The UAV at relatively low cost is suited to the study of mountain glaciers where steep topography, frequent cloud cover, surface heterogeneity and generally smaller glacier size can limit the use of satellite imagery (Wigmore and Mark, Reference Wigmore and Mark2017). UAV can also conduct glacier surface surveys at weekly, daily and even diurnal scales, which can provide unique insights into glacier processes and, is almost impossible to be obtained by TLS and RTK-GNSS. TLS and UAV are able to accurately survey potentially dangerous areas on glacier surfaces (such as avalanche paths) regardless of topography compared to the RTK-GNSS.

Fig. 9. Potential for TLS, UAV and RTK-GNSS interaction in glacier change monitoring. The boxes with text indicate that when the two techniques are used for glacier monitoring at the same time, the two techniques can complement each other.
Nevertheless, there are a few significant limitations of the TLS and UAV. It is a great challenge for a broader application of TLS measurement and point cloud data post-processing. Besides the need of specific knowledge, skills and experience for data processing, TLS survey requires that good glacier surface visual angles can be obtained at suitable scanning positions, which can be multi-temporally registered with multiple scans for change detection. Sometimes, unscanned areas may appear during TLS surveys. TLS is also very expensive in the initial costs of the scanner and software license compared to the UAV (Fischer and others, Reference Fischer, Huss, Kummert and Hoelzle2016). UAV has problems of covering a meaningful area and the uneven distribution of GCPs in off-glacier regions that can lead to distortion of UAV products. Additionally, installing GCPs in off-glacier regions requires a lot of labor and is very dangerous in many cases. The error generated by UAV survey can be reduced by the installation and survey of GCPs and the survey design (Immerzeel and others, Reference Immerzeel2014; Wigmore and Mark, Reference Wigmore and Mark2017). RTK-GNSS has a limited survey points' density, which are sparse in the upper area and the glacier tongue because of the steep terrain resulting in difficult access. However, it is difficult to evaluate quality of the DEMs because the three survey technologies have not been carried out at the same time until now.
According to the second Chinese Glacier Inventory dataset, 83% of the total number of glaciers in western China are small glaciers such as UG1 (Guo and others, Reference Guo2015). The RTK-GNSS, TLS and UAV monitoring has large potential for glacier change monitoring in western China. UAV has the potential to avoid unscanned areas in TLS survey and using RTK-GNSS fixed scanning positions can ensure consistent and good glacier surface visual angles in TLS survey. Since UAV survey also has the problem of only covering a meaningful area, we can compare the TLS and UAV products at the same time to improve the accuracy of the glacier surface elevation. To minimize distortions of UAV products the GCPs in off-glacier regions should be as evenly distributed as possible and measured by RTK-GNSS. This suggests that RTK-GNSS is critical for the TLS and UAV survey. The integration of TLS or UAV can compensate the RTK-GNSS limitation in the glacier upper area and the glacier tongue.
In future research, we plan to simultaneously use all three survey technologies to monitor the glacier at a specific time. Since UG1 has continuous observation conditions and then sufficient measurement verification data (i.e. mass balance and surface velocity) can be obtained. Additionally, Landsat images’ extraction surface temperature can also be used to validate UAV results. Hence, RTK-GNSS, TLS and UAV have great potential to quantify seasonal and annual glacier changes in the future and our approach yields insight into the smaller-scale temporal and spatial changes in glacier area, terminus and surface elevation.
6. Conclusions
In this study, RTK-GNSS, TLS and UAV surveys were conducted over UG1 in 2012, 2015 and 2018 to obtain DEMs, respectively. Three high-resolution DEMs were used to calculate area, terminus and surface elevation changes and geodetic mass balances over different periods. The statistical analysis shows that the geodetic specific mass balance was in good agreement with the glaciological specific mass balance (R 2 ⩾ 0.88), although the geodetic results were slightly positive. UG1 has experienced an accelerated recession during the period of 2012–18. Surface elevation has reduced 0.83 ± 0.57 m w.e. a−1 for 2012–15, and glacier tongue surface elevation has also reduced 2.03 ± 0.95 and 1.34 ± 0.88 m w.e. a−1 for 2015–18 and 2012–18, respectively. Glacier area had shrunk by 0.07 ± 0.07 × 10⁻³ km2 during 2012–18, with a rate of 0.01 ± 0.01 km2 a−1. The glacier terminus retreat rate was 6.28 ± 0.83 m a−1, with retreat rates of EB and WB being 7.64 ± 0.83 and 4.93 ± 0.83 m a−1, respectively.
This paper studied the application of RTK-GNSS, TLS and UAV in the monitoring of glacier changes. It is found that the three technologies have potential advantages, including (1) TLS allows most of the glacier surface to be measured due to its long-range scanning capabilities, (2) UAV with relatively low cost can conduct glacier surface surveys at weekly, daily and even diurnal scales and (3) it is strongly recommended that the TLS scan positions and UAV GCPs in off-glacier regions were surveyed using the RTK-GNSS to assure the accuracy of direct georeferencing and registration. However, limitations also existed for the three technologies: (1) choosing the suitable and stable scan positions was difficult for the TLS survey, (2) uneven distribution of GCPs in off-glacier regions can lead to distortion of UAV products and (3) survey points in the upper area and the glacier tongue were sparse during the RTK-GNSS survey. At present, we have conducted RTK-GNSS, TLS and UAV surveys to monitor UG1, and found complementary advantages between all three methods. This is especially relevant for the widely distributed small glaciers in western China similar to UG1. The combined application of RTK-GNSS, TLS and UAV has great potential for development in the future.
Acknowledgements
This research was jointly funded by the National Natural Science Foundation of China (no. 41771077), the Funds for Creative Research Groups of China (no. 41421061), the Youth Innovation Promotion Association of CAS, the National Natural Science Foundation of China (no. 42001067), the Strategic Priority Research Program of Chinese Academy of Sciences (no. XDA20020102) and the State Key Laboratory of Cryospheric Science (no. SKLCS-ZZ-2020). Additionally, the authors thank the editor Argha Banerjee and referees for their numerous invaluable comments in improving the paper.


 Open access