
Artificial Intelligence Applied to Evaluate Emissions and Energy Consumption in Commuter Railways: Comparison of Liquefied Natural Gas as an Alternative Fuel to Diesel


Abstract
:1. Introduction
2. Materials and Methods
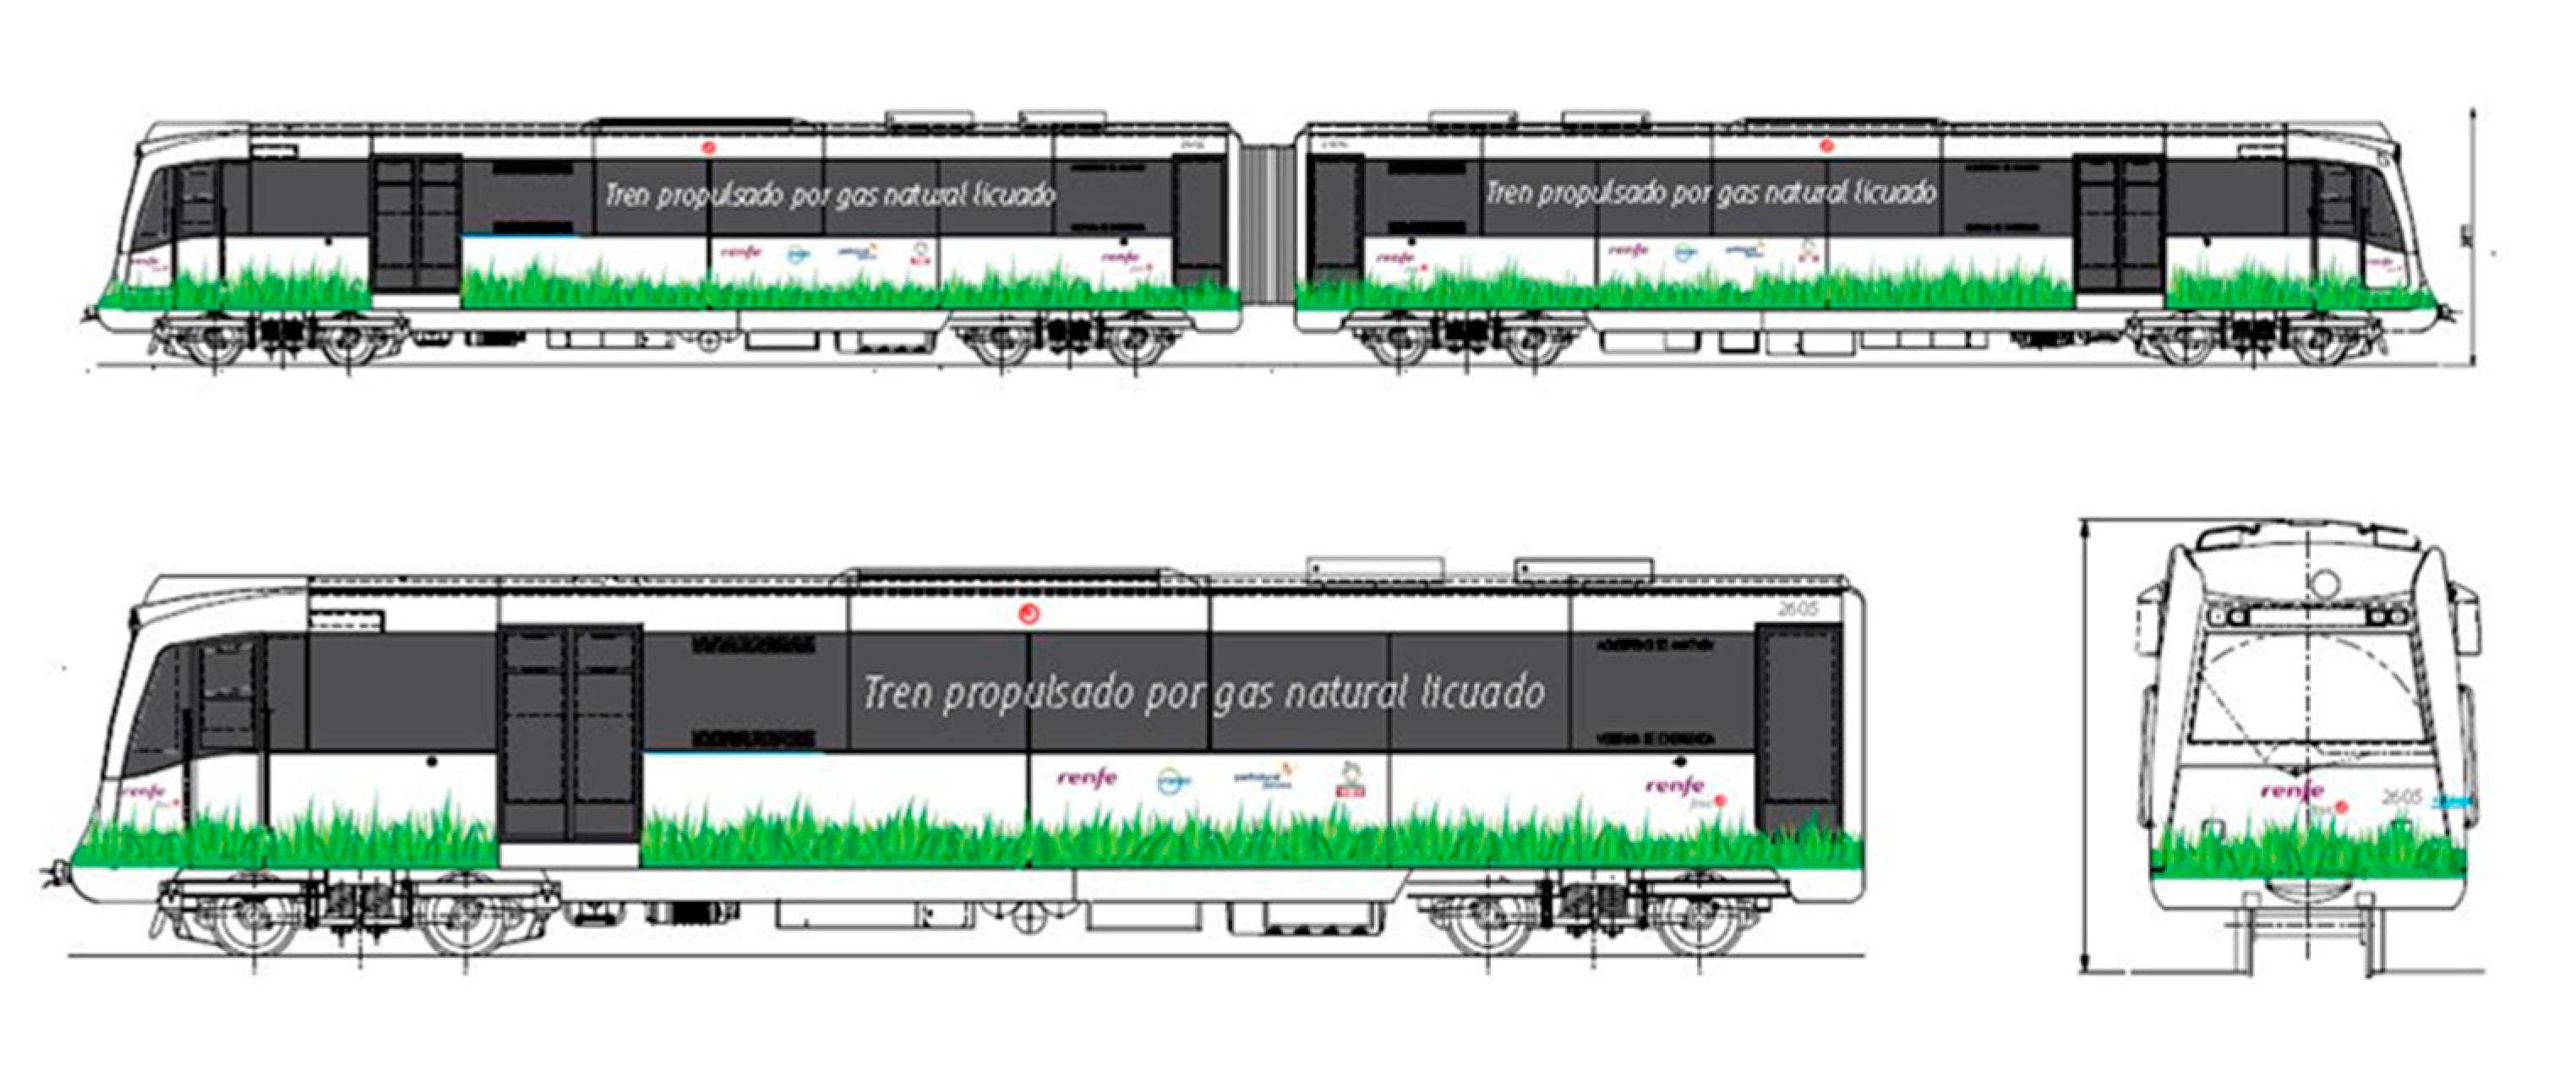
- Gauge: 1.000 m (narrow)
- Weight: Odd unit (26,420 kg) + even unit (27,040 kg) = 53,460 kg in total
- Length: 35.888 m
- Width: 2.565 m
- Height: 3.655 m
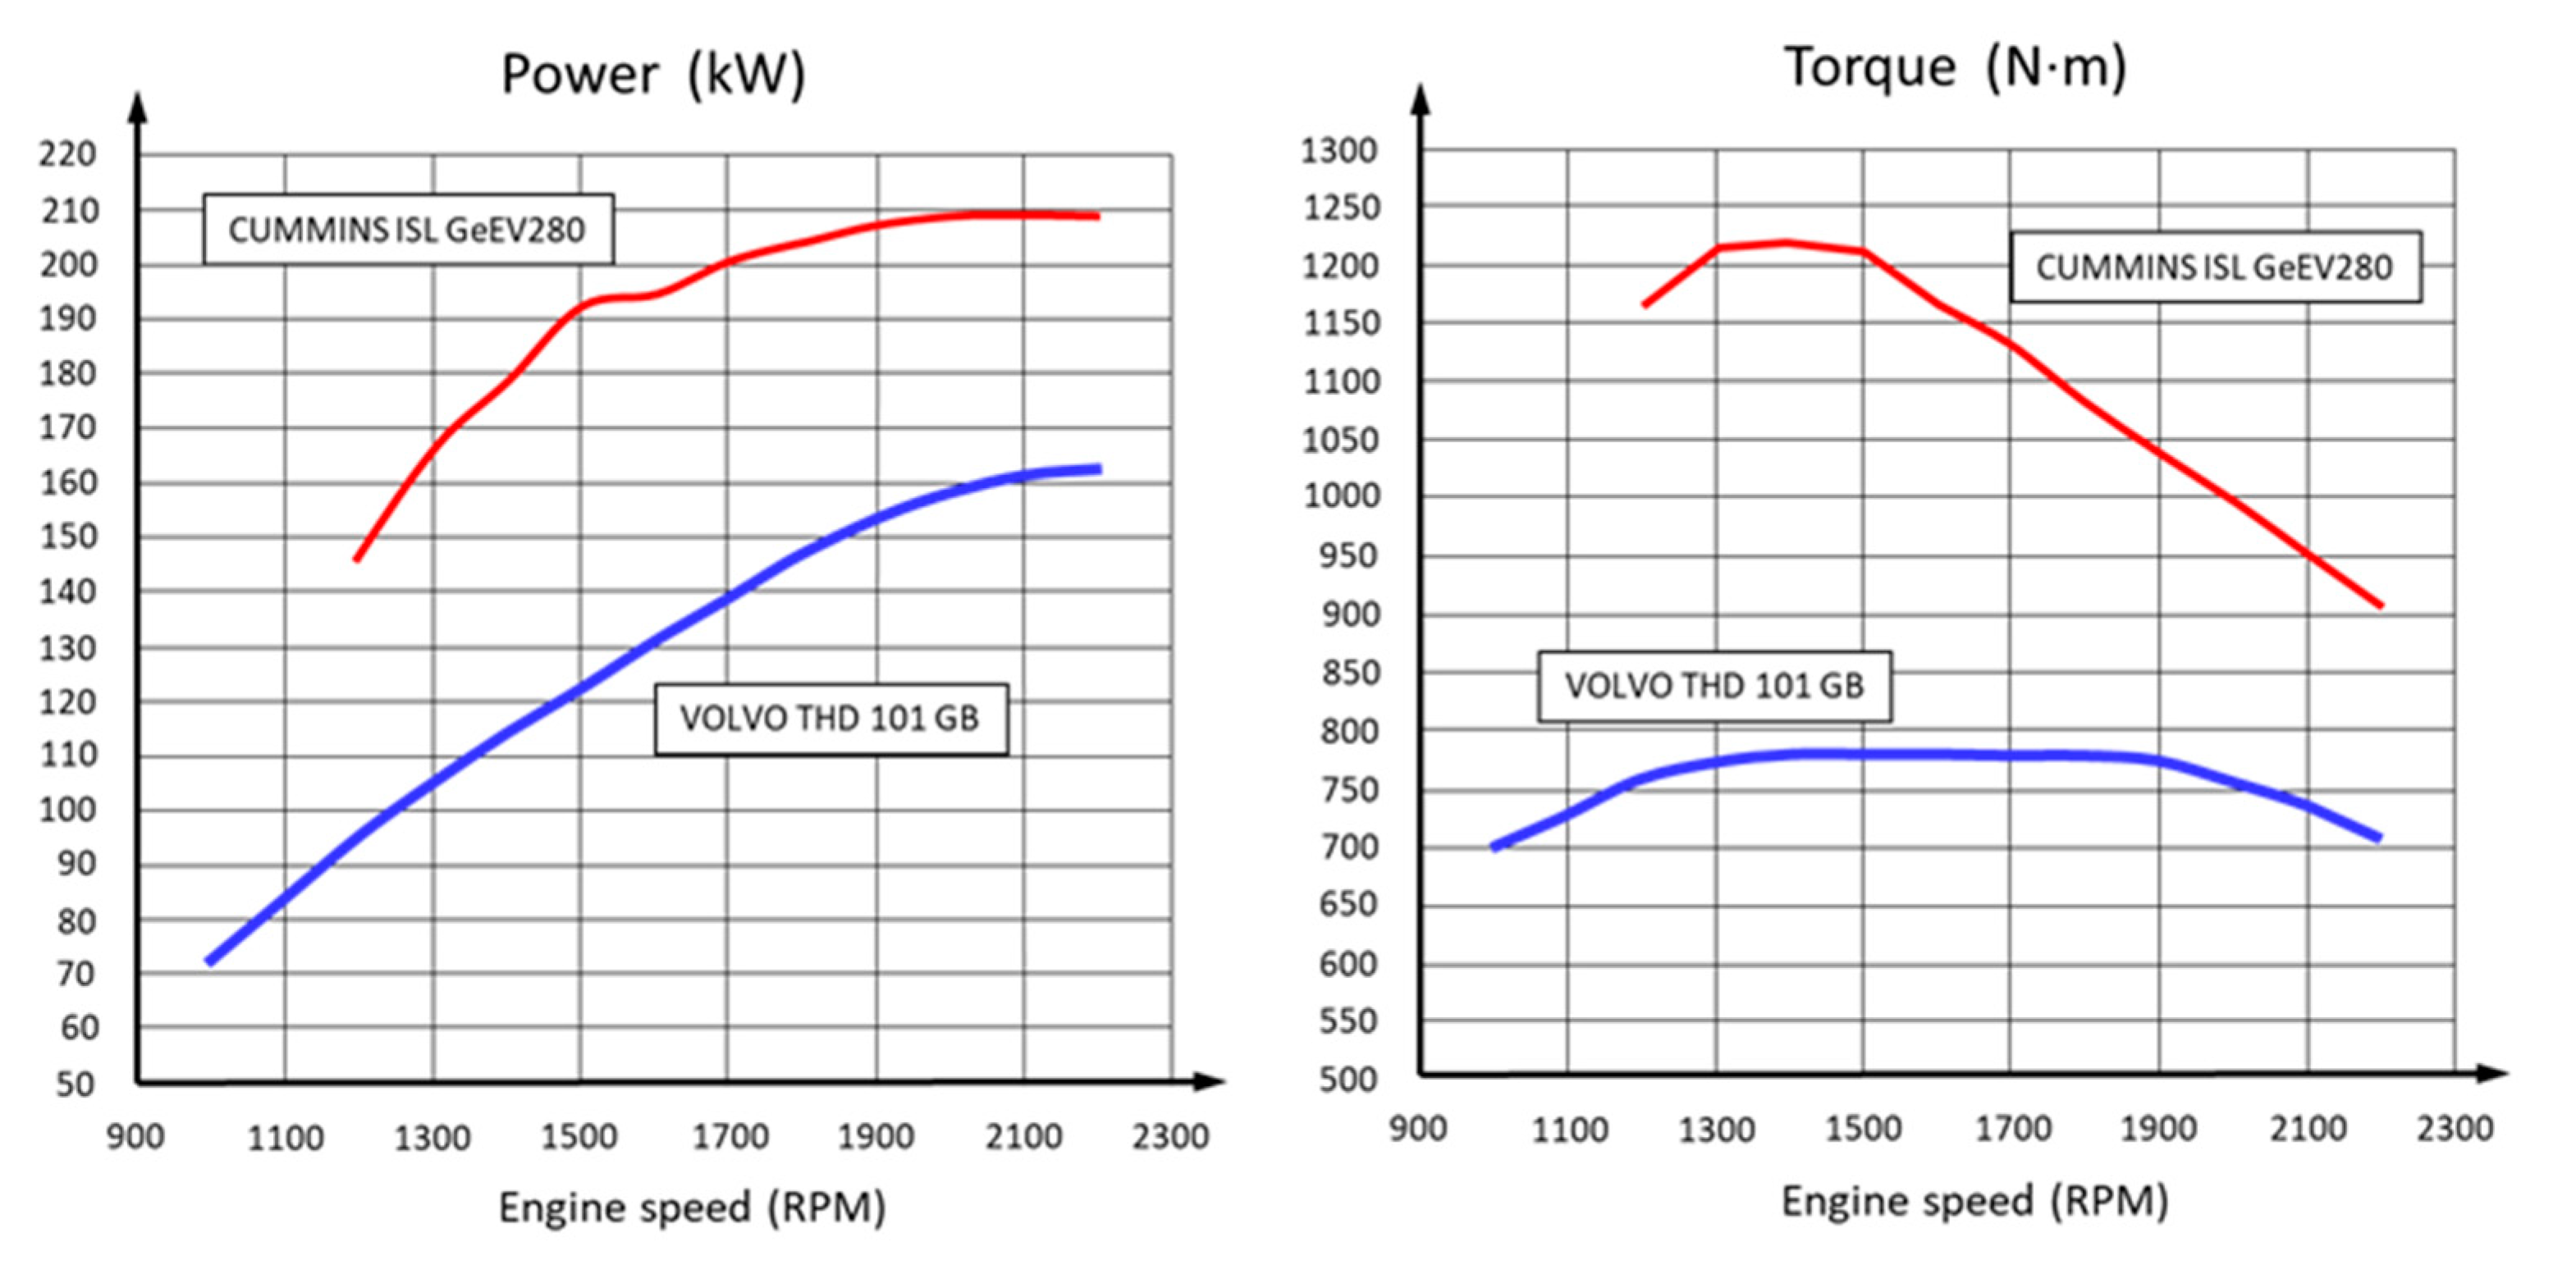
- Type: 4-cycle, in line, 6 cylinder, turbocharged/charge air cooled
- Bore and stroke: 114 × 145 mm
- Compressions ratio: 16.6:1
- Oil system capacity: 27.6 L
- Dry weight: 706 kg
- Power (according to SAE J1995): 209 kW@2000 rpm
- Torque: 1700 Nm (1300–1400 rpm)
- Garmin (16x) GPS: Latitude, longitude, and elevation
- Weather Station: Pressure, temperature, and humidity of ambient air
- AVL EFM 495: Exhaust mass flow
- DG DPA5 J939: J1939 CAN parameters
- AVL Micro Soot Sensor 483: The AVL Micro Soot Sensor is a system for continuous and transient measurement of soot concentrations (mg/m3) in exhaust gas from internal combustion engines.
- AVL Gas PEM HD 493: this is a portable emission measurement system (PEMS) that monitors THC (total hydrocarbons), CO, CO2, NO2, and O2% concentrations within the exhaust gas of internal combustion engines of any kind.
- Characterization of passive resistances, both on a straight track and on curves;
- Evaluation of inertial and mass factors and parameters;
- Evaluation of actual acceleration and braking performance;
- Execution of consumption and emission tests at various speeds and accelerations; and
- Characterization of the LNG and diesel powertrains.
- Accelerating at 0.50 m/s2 until reaching the maximum speed on each section; and
- Calculating the point at which it should decelerate at 0.50 m/s2 until the vehicle stops at the station or stopping point.
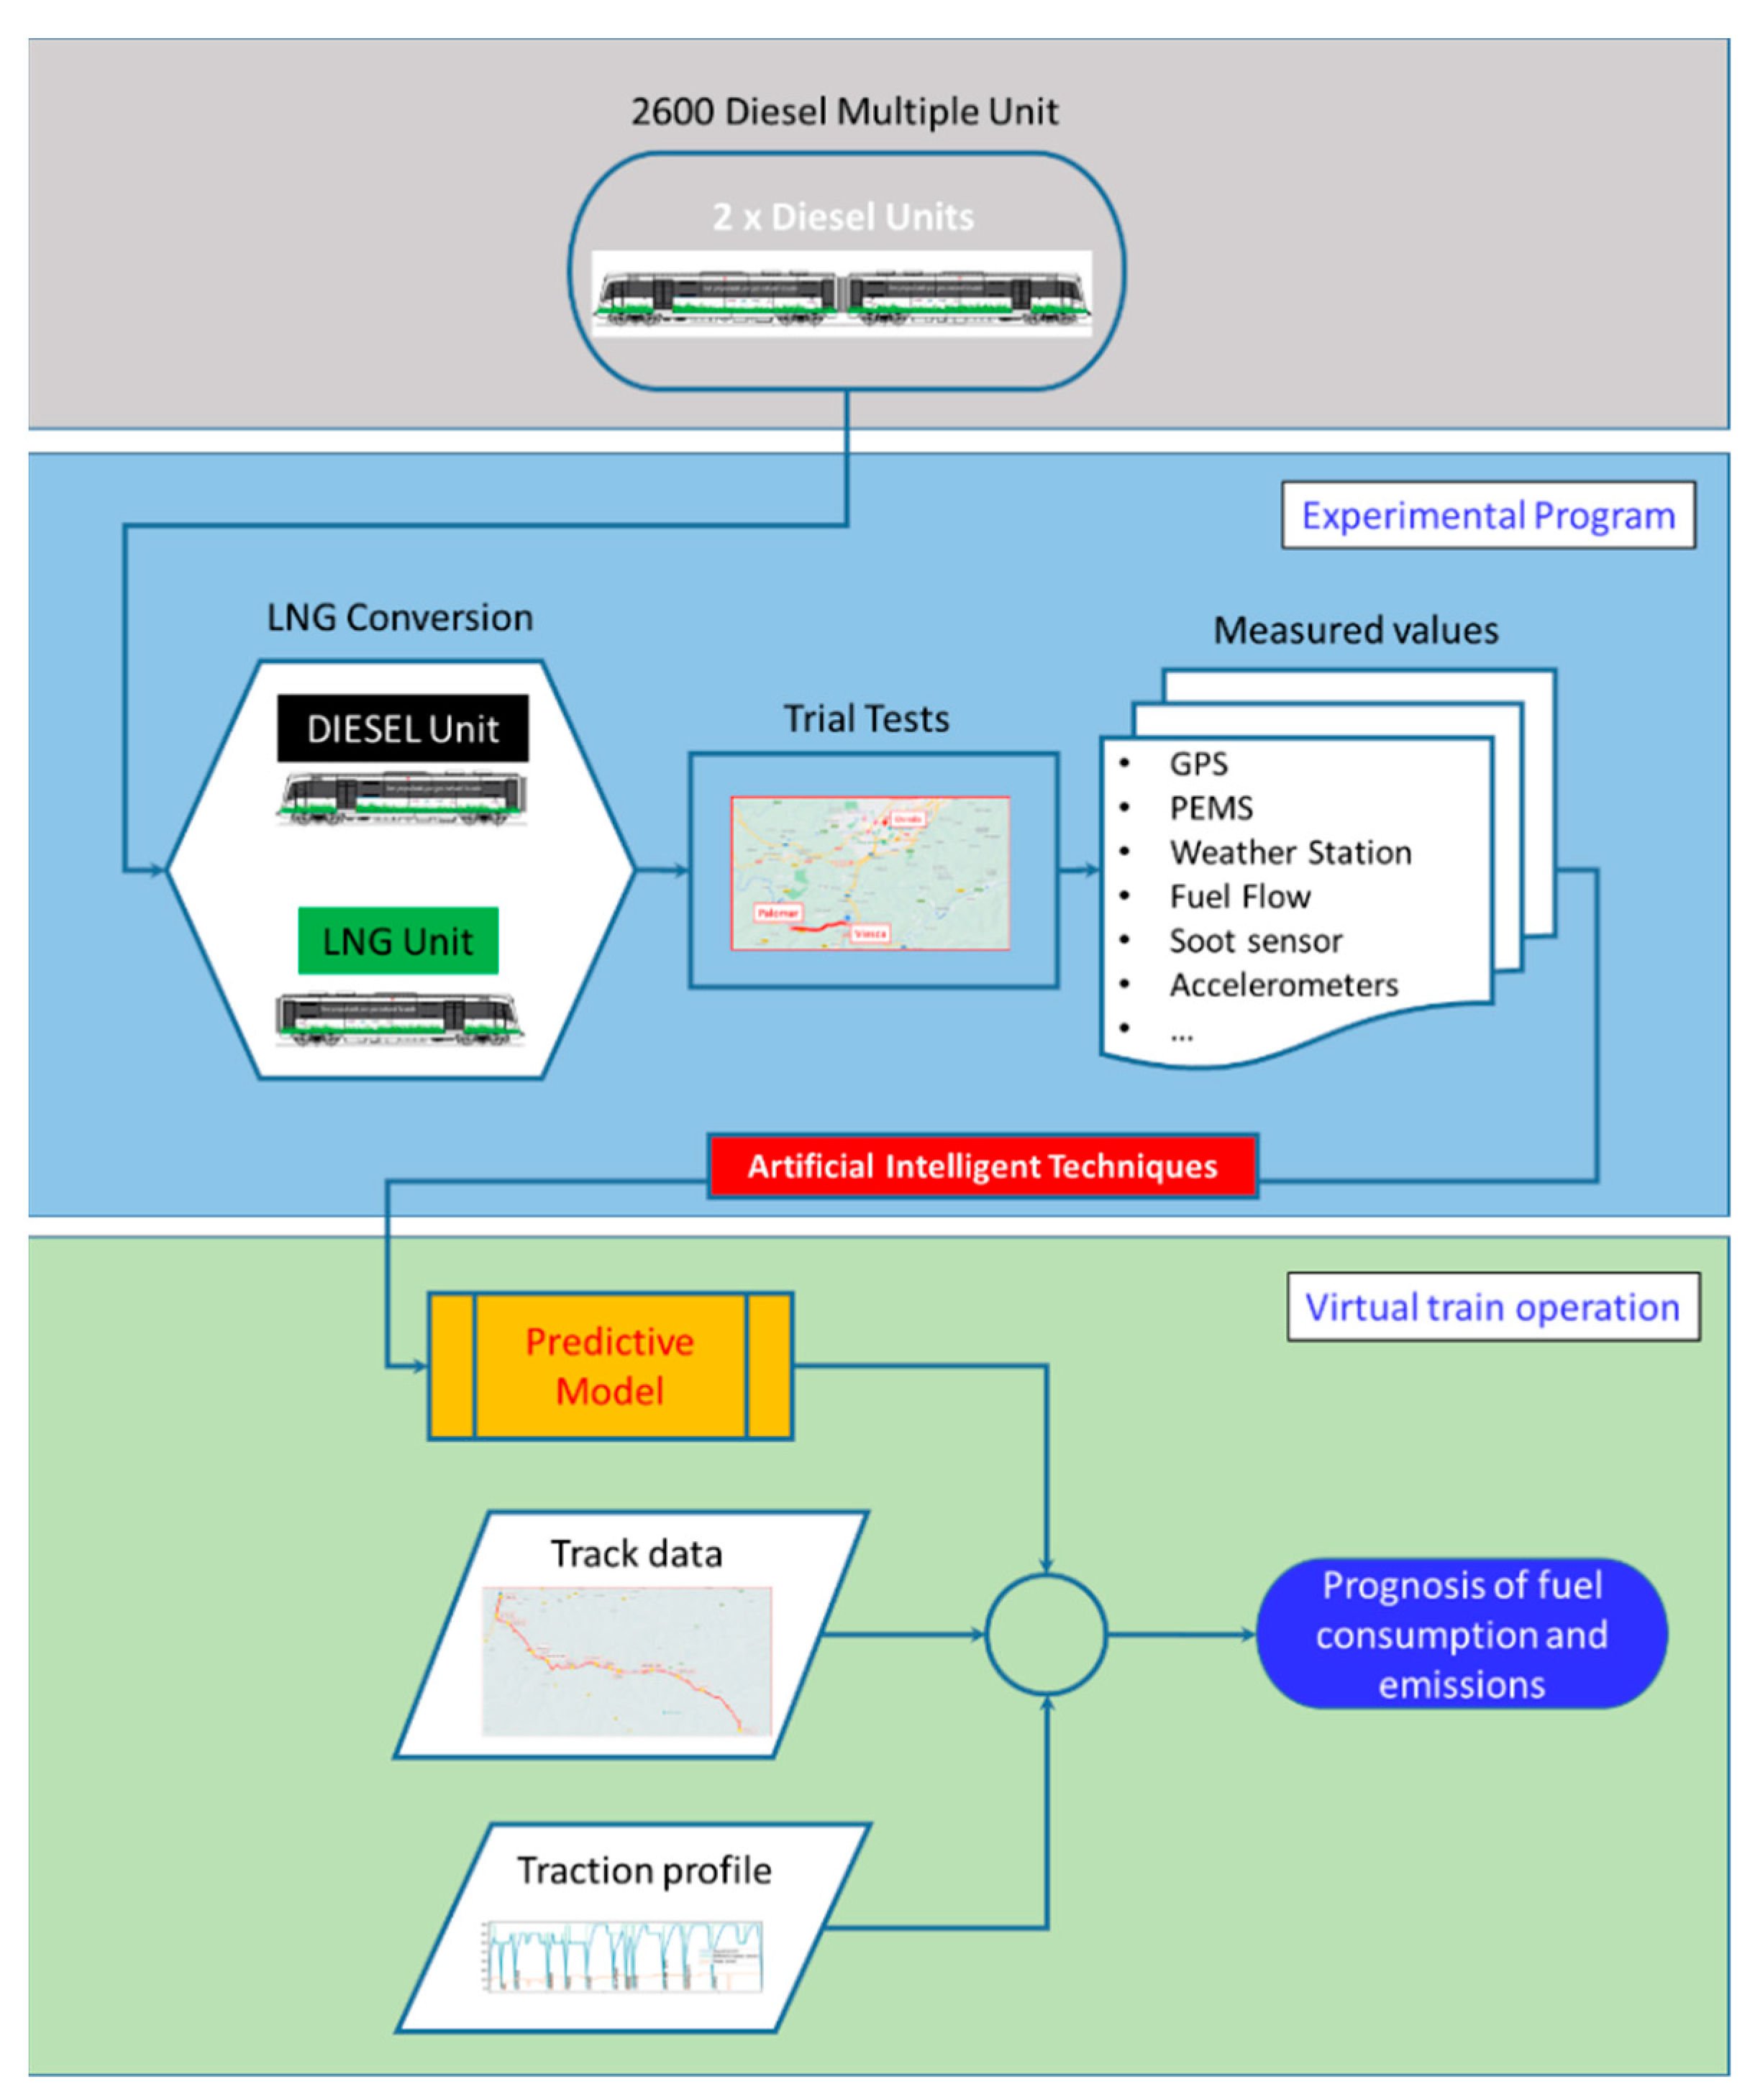
Description of the Intelligent Predictive Model
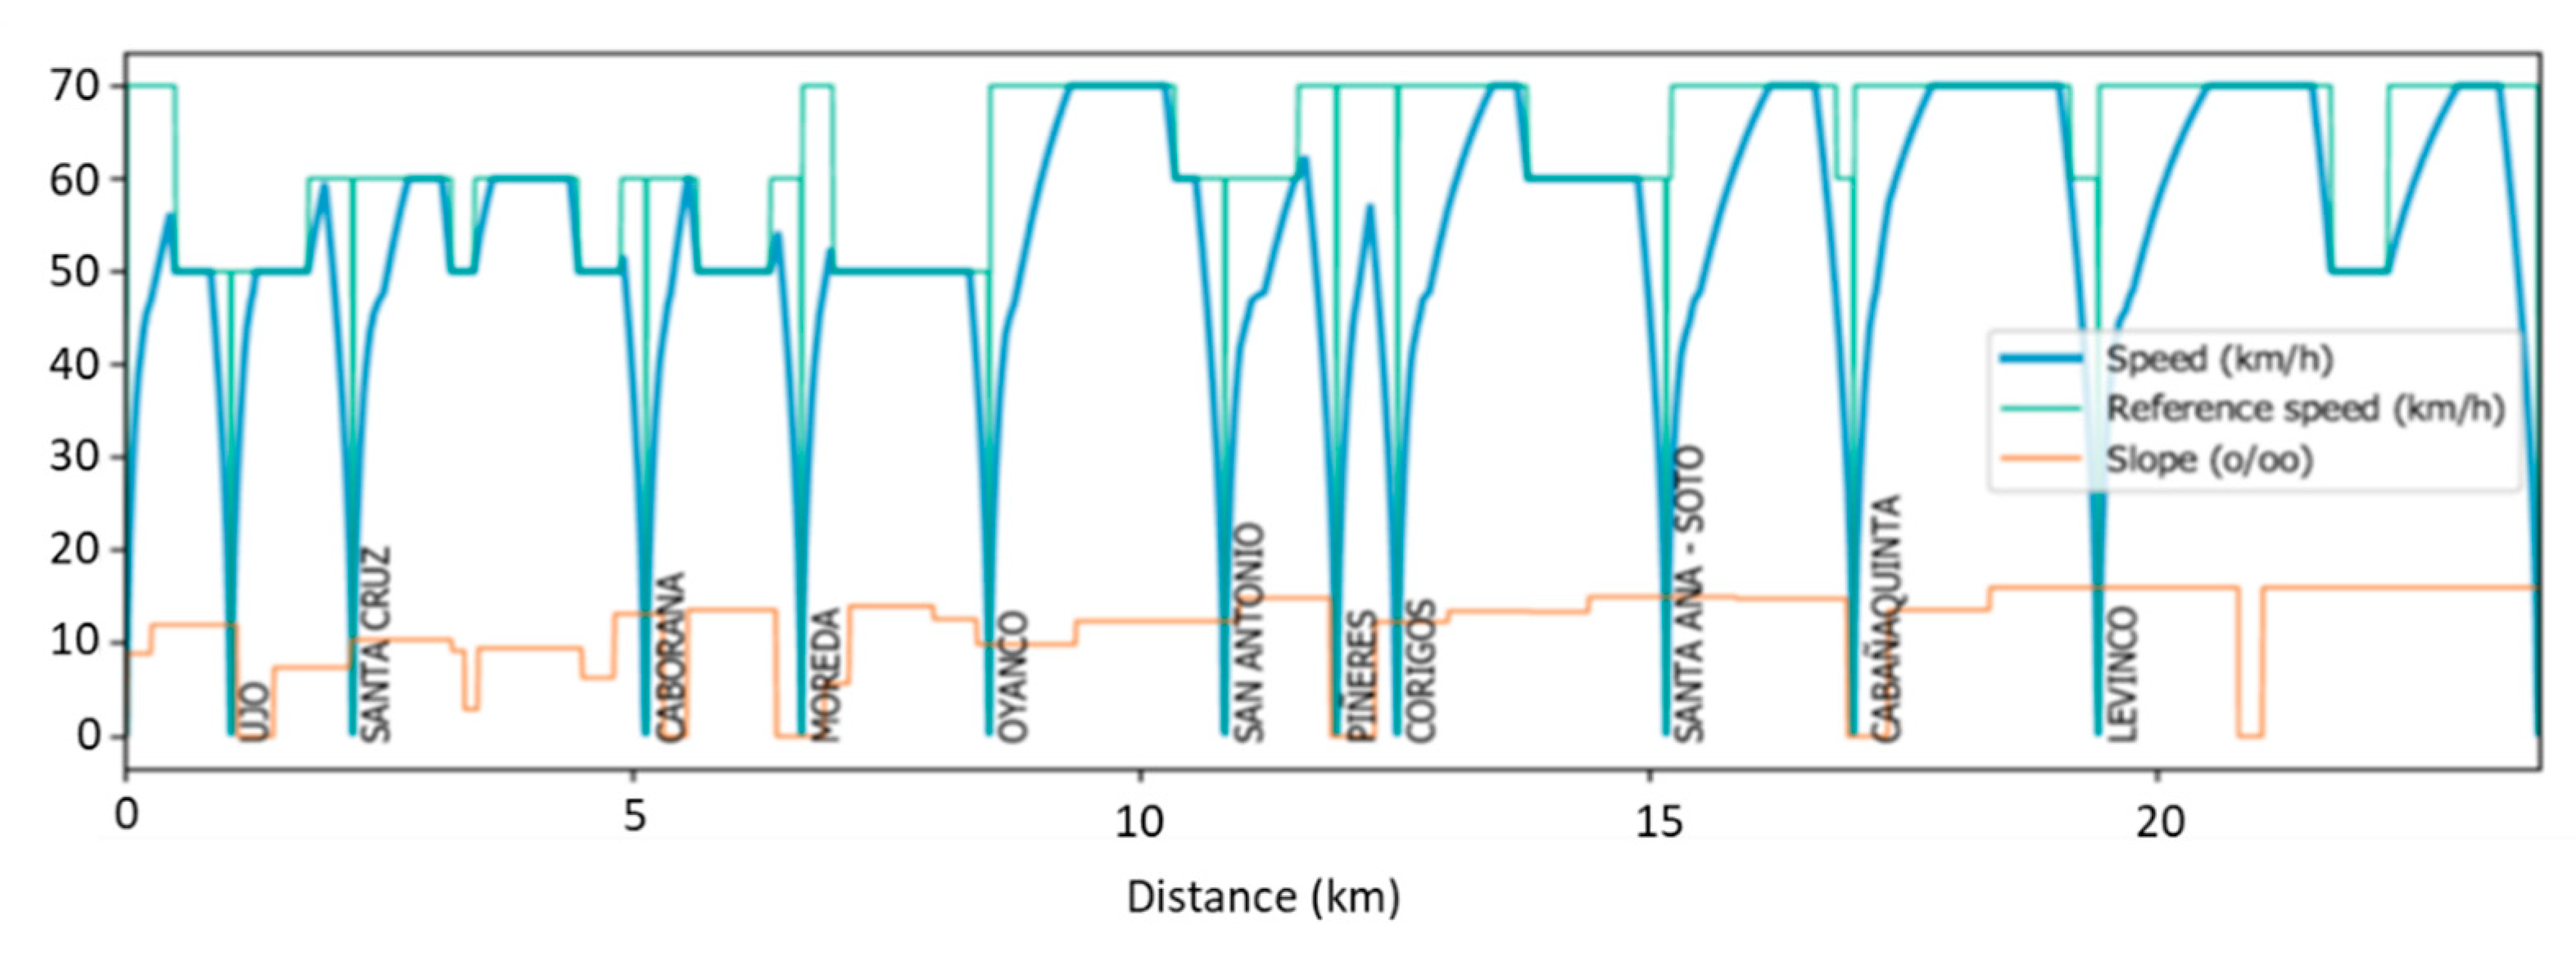
- Estimation of the speed profile of the circuit, given the layout and elevation of the new route and the properties of the engine (maximum torque curve, efficiency of the different elements of the powertrain).
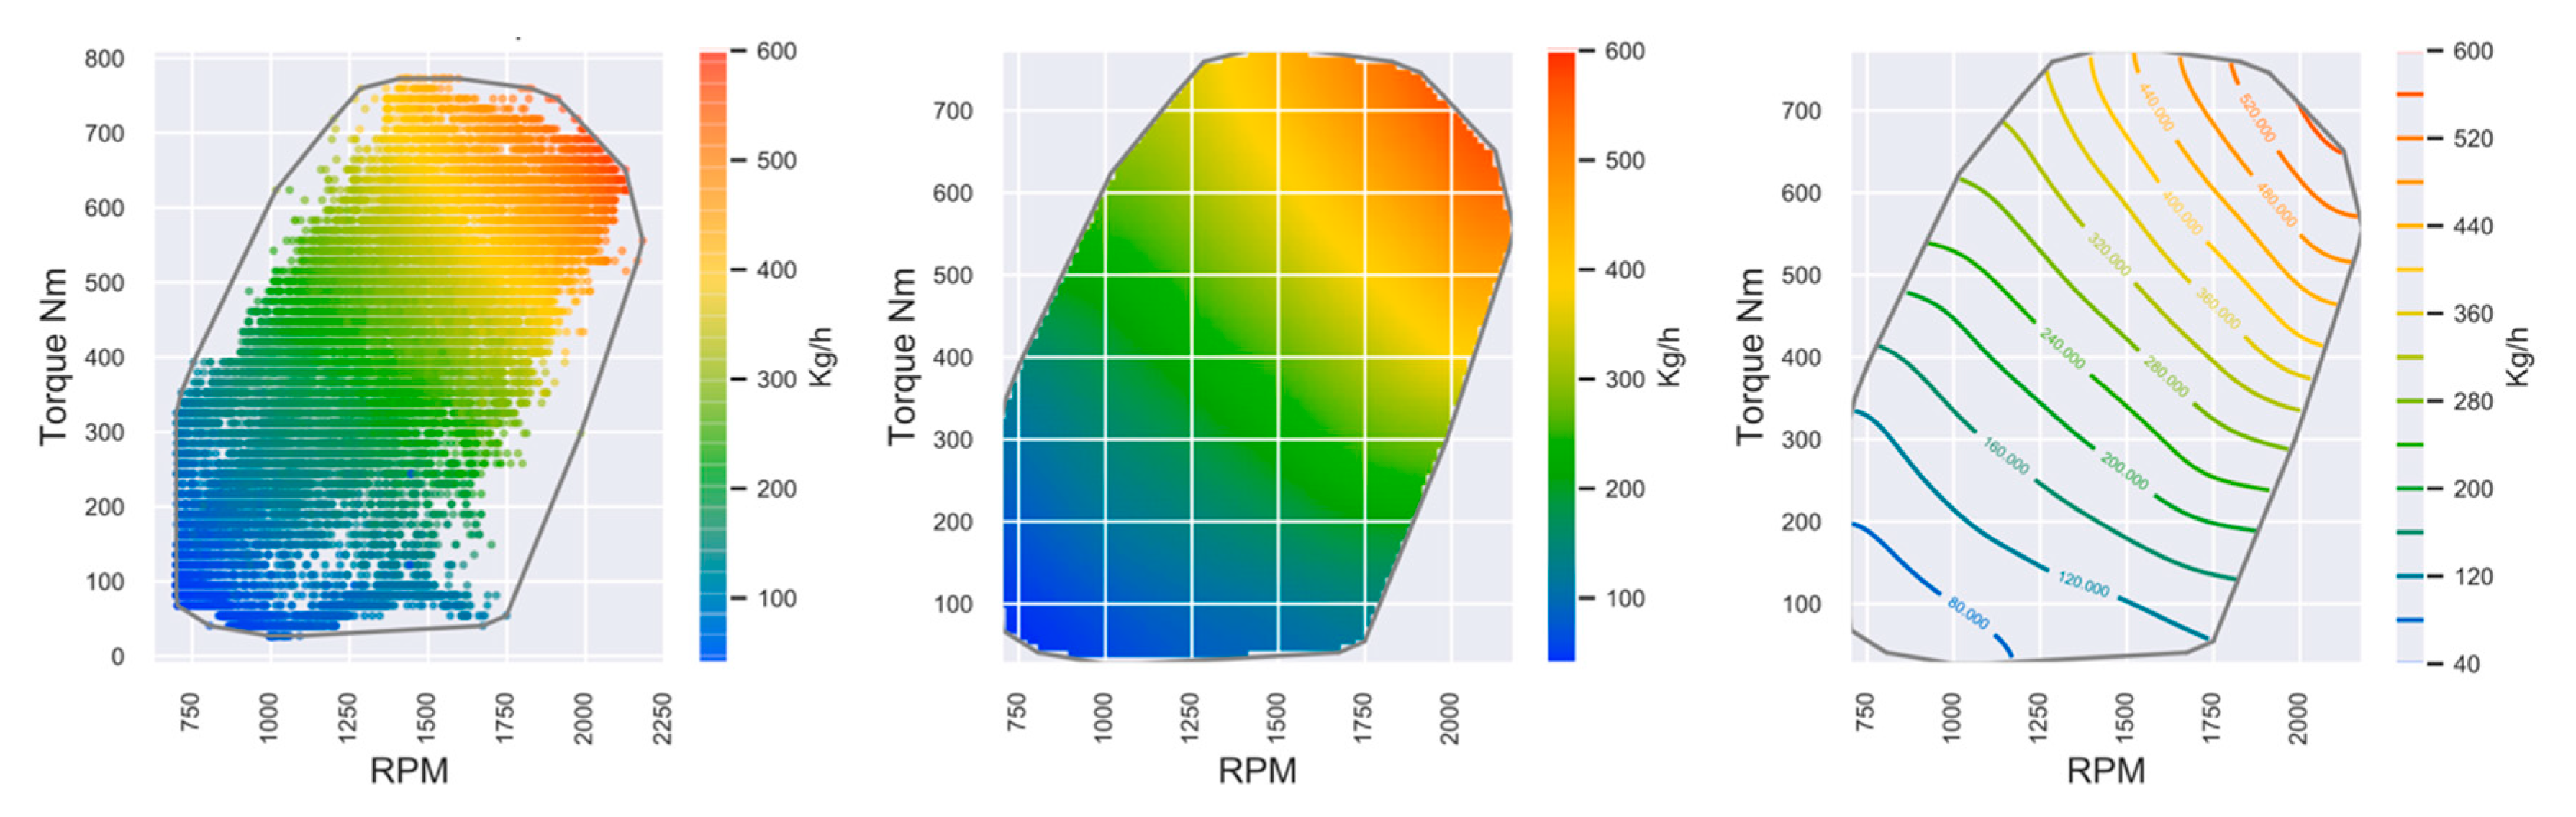
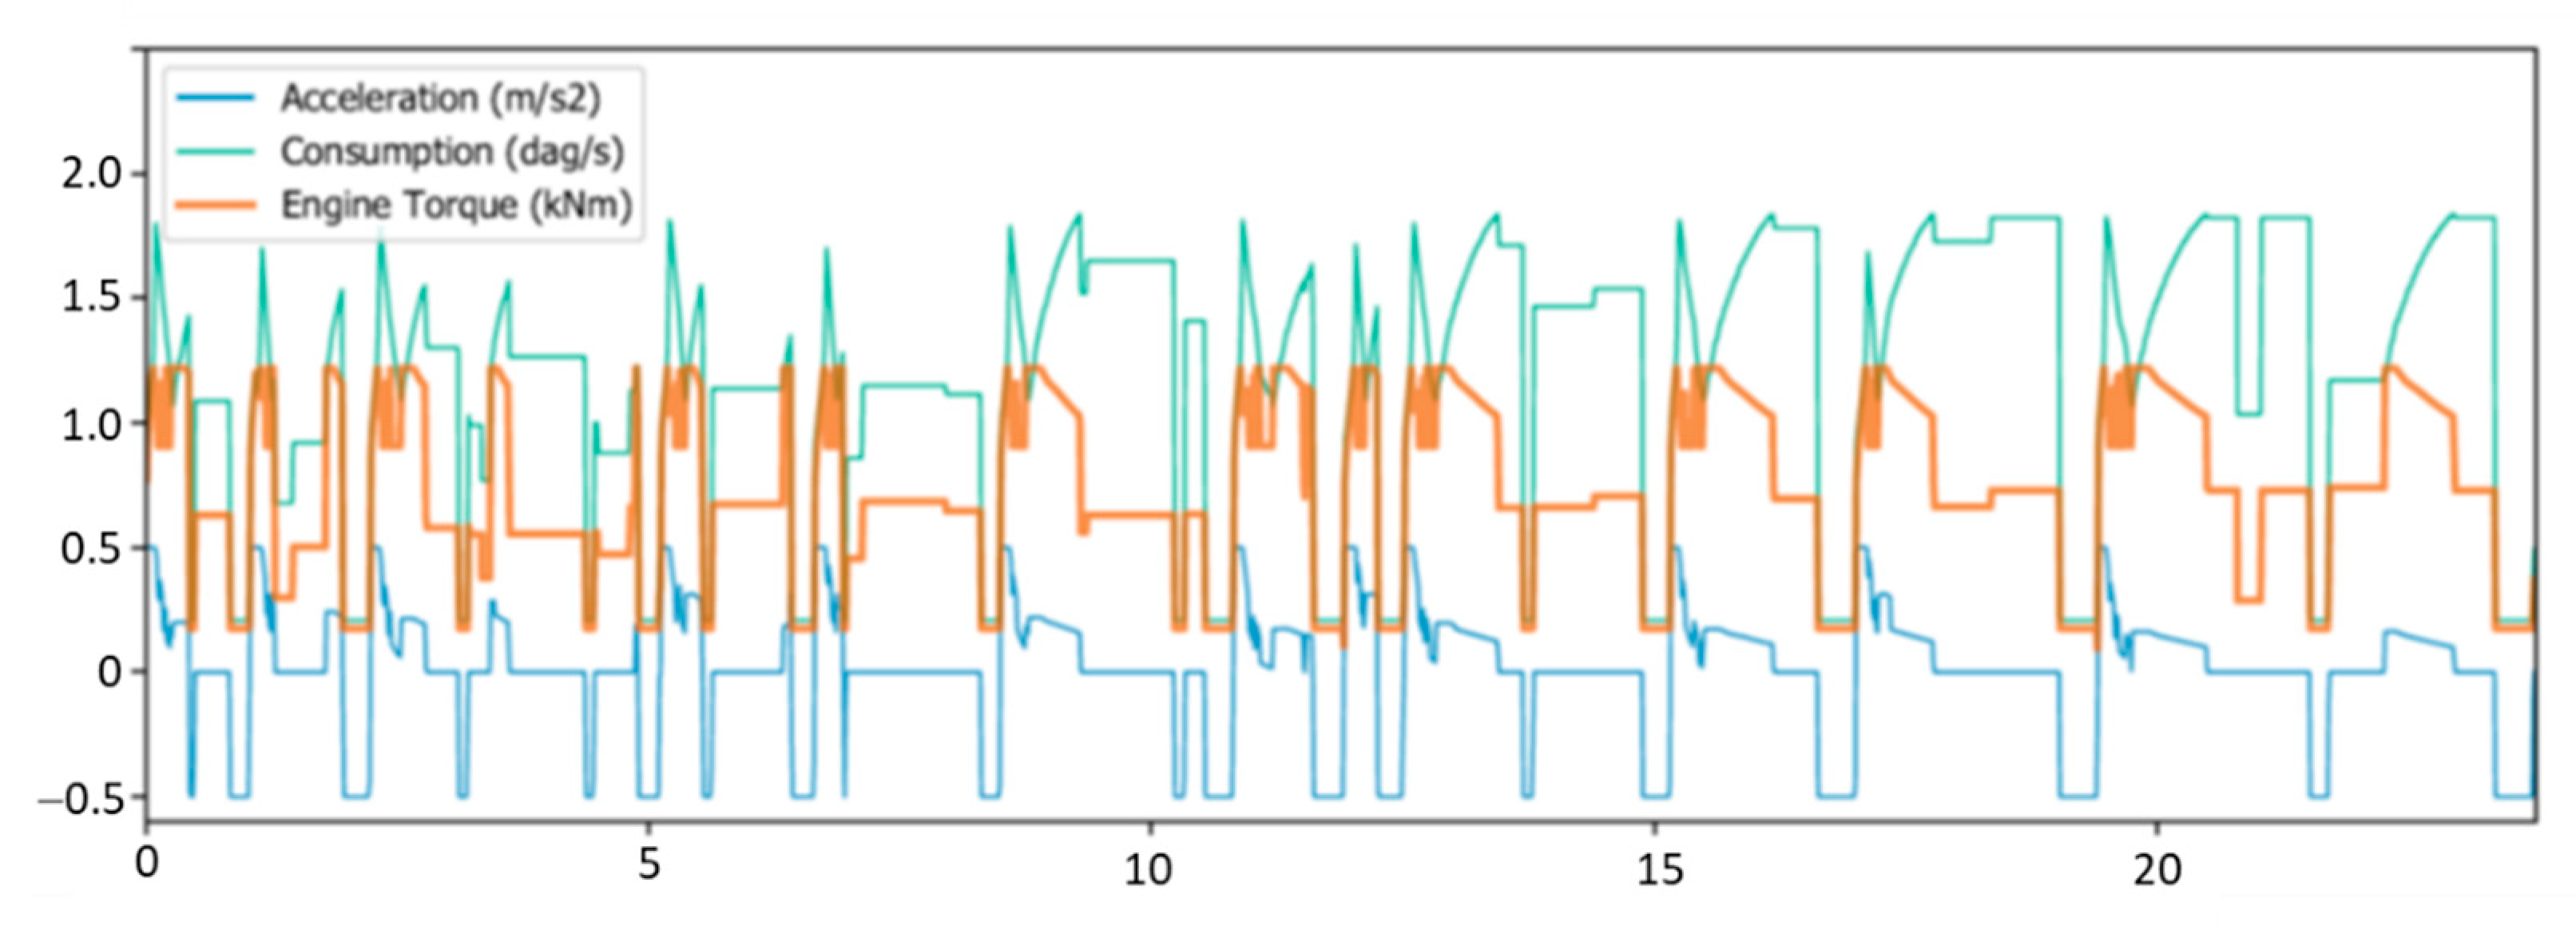
- Prediction of consumption and emissions on the new route, given the speed profile calculated in the previous step. This is done by using a consumption and emission model for each pollutant as a function of the engine operating point (torque and engine speed).
3. Results
4. Conclusions
Author Contributions
Funding
Institutional Review Board Statement
Informed Consent Statement
Data Availability Statement
Conflicts of Interest
References
- European Environment Agency. Greenhouse Gas Emissions from Transport in Europe. 2020. Available online: https://www.eea.europa.eu/data-and-maps/indicators/transport-emissions-of-greenhouse-gases-7/assessment (accessed on 5 February 2021).
- Esters, T.; Marinov, M. An analysis of the methods used to calculate the emissions of rolling stock in the UK. Transp. Res. Part D Transp. Environ. 2014, 33, 1–16. [Google Scholar] [CrossRef]
- Pope, C.A.; Dockery, D.W. Health effects of fine particulate air pollution: Lines that connect. J. Air Waste Manag. Assoc. 2006, 56, 709–742. [Google Scholar] [CrossRef]
- Kampa, M.; Castanas, E. Human health effects of air pollution. Environ. Pollut. 2008, 151, 362–367. [Google Scholar] [CrossRef] [PubMed]
- MITECO. 2021. Available online: https://www.miteco.gob.es/es/calidad-y-evaluacion-ambiental/temas/atmosfera-y-calidad-del-aire/calidad-del-aire/salud/oxidos-nitrogeno.aspx (accessed on 3 June 2021).
- Toyota. 2019. Available online: https://www.toyota.es/world-of-toyota/articles-news-events/2019 (accessed on 3 June 2021).
- Tran, P.T.M.; Adam, M.G.; Tham, K.W.; Schiavon, S.; Pantelic, J.; Linden, P.F.; Sofianopoulou, E.; Sekhar, S.C.; Cheong, D.K.W.; Balasubramanian, R. Assessment and mitigation of personal exposure to particulate air pollution in cities: An exploratory study. Sustain. Cities Soc. 2021, 72, 103052. [Google Scholar] [CrossRef]
- Logan, K.G.; Nelson, J.D.; McLellan, B.C.; Hastings, A. Electric and hydrogen rail: Potential contribution to net zero in the UK. Transp. Res. Part D Transp. Environ. 2020, 87, 102523. [Google Scholar] [CrossRef]
- Mulley, C.; Hensher, D.A.; Cosgrove, D. Is rail cleaner and greener than bus? Transp. Res. Part D Transp. Environ. 2017, 51, 14–28. [Google Scholar] [CrossRef]
- Webb, G. Comparing Environmental Impact of Conventional and High Speed Rail. Available online: https://silo.tips/download/comparing-environmental-impact-of-conventional-and-high-speed-rail (accessed on 24 June 2021).
- Hoffrichter, A.; Miller, A.R.; Hillmansen, S.; Roberts, C. Well-to-wheel analysis for electric, diesel and hydrogen traction for railways. Transp. Res. Part D Transp. Environ. 2012, 17, 28–34. [Google Scholar] [CrossRef]
- Gangwar, M.; Sharma, S.M. Evaluating choice of traction option for a sustainable indian railways. Transp. Res. Part D Transp. Environ. 2014, 33, 135–145. [Google Scholar] [CrossRef]
- Carvalhaes, B.B.; de Alvarenga Rosa, R.; de Almeida D’Agosto, M.; Ribeiro, G.M. A method to measure the eco-efficiency of diesel locomotive. Transp. Res. Part D Transp. Environ. 2017, 51, 29–42. [Google Scholar] [CrossRef]
- Railway Technology. Hydrail and LNG: The Future of Railway Propulsion? 2021. Available online: https://www.railway-technology.com/features/featurehydrail-lng-future-railway-propulsion-fuel/ (accessed on 5 February 2021).
- Palacín, R. Clean European Rail-Diesel. Impact and Performance of Alternative Fuel in Rail Applications. 2012. Available online: http://secure.cnc.it/cleaner-d/Docs/CLD-D-UNE-011-02.pdf (accessed on 24 June 2021).
- US Department of Energy. Alternative Fuels Data Center: Diesel Vehicles Using Biodiesel. 2021. Available online: https://afdc.energy.gov/vehicles/diesel.html (accessed on 5 February 2021).
- World Nuclear Association. Thorium—World Nuclear Association. 2020. Available online: https://www.world-nuclear.org/information-library/current-and-future-generation/thorium.aspx (accessed on 5 February 2021).
- Dincer, I.; Zamfirescu, C. A review of novel energy options for clean rail applications. J. Nat. Gas Sci. Eng. 2016, 28, 461–478. [Google Scholar] [CrossRef]
- Zhardemov, B.; Kanatbayev, T.; Abzaliyeva, T.; Koilybayev, B.; Nazarbekova, Z. Justification of location of LNG infrastructure for dual-fuel locomotives on the railway network in Kazakhstan. Procedia Comput. Sci. 2019, 149, 548–558. [Google Scholar] [CrossRef]
- Pfoser, S.; Aschauer, G.; Simmer, L.; Schauer, O. Facilitating the implementation of LNG as an alternative fuel technology in landlocked Europe: A study from Austria. Res. Transp. Bus. Manag. 2016, 18, 77–84. [Google Scholar] [CrossRef]
- Papagiannakis, R.G.; Hountalas, D.T. Experimental investigation concerning the effect of natural gas percentage on performance and emissions of a DI dual fuel diesel engine. Appl. Therm. Eng. 2003, 23, 353–365. [Google Scholar] [CrossRef]
- Peredel’skii, V.A.; Lastovskii, Y.V.; Darbinyan, R.V.; Savitskii, A.I.; Savitskii, A.A. Analysis of the desirability of replacing petroleum-based vehicle fuel with liquefied natural gas. Chem. Pet. Eng. 2005, 41, 590–595. [Google Scholar] [CrossRef]
- Papagiannakis, R.G.; Kotsiopoulos, P.N.; Zannis, T.C.; Yfantis, E.A.; Hountalas, D.T.; Rakopoulos, C.D. Theoretical study of the effects of engine parameters on performance and emissions of a pilot ignited natural gas diesel engine. Energy 2010, 35, 1129–1138. [Google Scholar] [CrossRef]
- Langshaw, L.; Ainalis, D.; Acha, S.; Shah, N.; Stettler, M.E.J. Environmental and economic analysis of liquefied natural gas (LNG) for heavy goods vehicles in the UK: A Well-to-Wheel and total cost of ownership evaluation. Energy Policy 2020, 137, 111161. [Google Scholar] [CrossRef]
- Madhusudhanan, A.K.; Na, X.; Boies, A.; Cebon, D. Modelling and evaluation of a biomethane truck for transport performance and cost. Transp. Res. Part D Transp. Environ. 2020, 87, 102530. [Google Scholar] [CrossRef]
- McFarlan, A. Techno-economic assessment of pathways for liquefied natural gas (LNG) to replace diesel in Canadian remote northern communities. Sustain. Energy Technol. Assess. 2020, 42, 100821. [Google Scholar] [CrossRef]
- Sun, S.; Ertz, M. Life cycle assessment and Monte Carlo simulation to evaluate the environmental impact of promoting LNG vehicles. MethodsX 2020, 7, 101046. [Google Scholar] [CrossRef]
- LNG Processing Plants. LNG_Trucks_2014-2017. Available online: http://lngplants.com/LNG_Trucks_2014-2017.html (accessed on 5 February 2021).
- Barrow, K. Russian Gas Turbine Locomotive Hauls 9000-Tonne Train. 2018. Available online: https://www.railjournal.com/locomotives/russian-gas-turbine-locomotive-hauls-9000-tonne-train/ (accessed on 5 February 2021).
- Zasiadko, M. Sinara Group Assembles New Type of LNG-Powered Locomotive _ RailTech. RailTechCom. 2019. Available online: https://www.railtech.com/rolling-stock/2019/07/16/sinara-group-assembles-new-type-of-lng-powered-locomotive/?gdpr=accept (accessed on 5 February 2021).
- Ford, N. Getting LNG on the rails [LNG Condensed]. Available online: https://www.naturalgasworld.com/getting-lng-on-the-rails-lng-condensed-70739 (accessed on 24 June 2021).
- Garneau, S. Canadian National Railways tests natural gas/diesel fuel powered locomotives between Edmonton and Fort McMurray. AB. CN Newsl. 2013, 33, 1. [Google Scholar]
- Canadian Railway Observations. Motive Power News. 2013. Available online: https://canadianrailwayobservations.com/RESTRICTED/2013/october/cn.html (accessed on 5 February 2021).
- Railway Age. FEC Rolls Out LNG. 2017. Available online: https://www.railwayage.com/mechanical/locomotives/fec-rolls-out-lng/ (accessed on 5 February 2021).
- Florida East Coast Railway. FEC Railway Gives Tour of LNG. 2017. Available online: https://fecrwy.com/news/blog-lng-operations/ (accessed on 5 February 2021).
- Vantuono, W. Florida East Coast Railway Converts Locomotive Fleet to LNG. Int. Railw. J 2017. Available online: https://www.railjournal.com/regions/north-america/florida-east-coast-railway-converts-locomotive-fleet-to-lng/ (accessed on 5 February 2021).
- Vantuono, W. IHB going CNG. Railway Age. 2017. Available online: https://www.railwayage.com/news/ihb-going-cng/ (accessed on 5 February 2021).
- Phillips, D.R.; Byrne, W.P. Latest Developments in Alternative Fuels for Rail Locomotives. 2018. Available online: https://www.hklaw.com/en/insights/publications/2018/04/latest-developments-in-alternative-fuels-for-rail (accessed on 5 February 2021).
- DiGas. Two LNG Shunter Locomotives Planned in Estonia. NGV Global News 2019. Available online: https://www.ngvglobal.com/blog/two-lng-shunter-locomotives-planned-in-estonia-1129#more-112899 (accessed on 5 February 2021).
- Smith, K. Renfe to Trial LNG on Passenger Train. Int. Railw. J 2017. Available online: https://www.railjournal.com/rolling-stock/renfe-to-trial-lng-on-passenger-train/ (accessed on 5 February 2021).
- Allonca, D.; Mantaras, D.A.; Luque, P.; Alonso, M. A new methodology to optimize a race car for inertial sports. Proc. Inst. Mech. Eng. Part P J. Sports Eng. Technol. 2019, 233, 312–323. [Google Scholar] [CrossRef]
- Luque, P.; Mántaras, D.A.; Maradona, Á.; Roces, J.; Sánchez, L.; Castejón, L.; Malón, H. Multi-objective evolutionary design of an electric vehicle chassis. Sensors 2020, 20, 3633. [Google Scholar] [CrossRef]
- Luque-Rodríguez, P.; Álvarez-Mántaras, D.; Wideberg, J. Evaluation of the road network: Use of a monitoring vehicle for the record of potentially dangerous events. Dyna 2011, 86, 431–437. [Google Scholar] [CrossRef]
- Luque, P.; Mántaras, D.A.; Pello, A. Racing car chassis optimization using the finite element method, multi-body dynamic simulation and data acquisition. Proc. Inst. Mech. Eng. Part P J. Sports Eng. Technol. 2013, 227, 3–11. [Google Scholar] [CrossRef]
- Wideberg, J.; Luque, P.; Mantaras, D. A smartphone application to extract safety and environmental related information from the OBD-II interface of a car. Int. J. Veh. Syst. Model. Test. 2012, 7, 1–11. [Google Scholar] [CrossRef]
- Cuesta, C.; Luque, P.; Mántaras, D.A. State estimation applied to non-explicit multibody models. Nonlinear Dyn. 2016, 86, 1673–1686. [Google Scholar] [CrossRef]
- Boggs, P.T.; Tolle, J.W. Sequential quadratic programming. Acta Numer. 1995, 4, 1–51. [Google Scholar] [CrossRef] [Green Version]
- Chen, T.; Guestrin, C. XGBoost: A scalable tree boosting system. In Proceedings of the 22nd ACM SIGKDD International Conference on Knowledge Discovery and Data Mining, San Francisco, CA, USA, 13–17 August 2016; pp. 785–794. [Google Scholar]


| Fuel | CO2 (kg/kWh) | CO (g/kWh) | NO2 (g/kWh) | NO (g/kWh) | HC (g/kWh) | Soot (g/kWh) | |
| Diesel | 0.26 L/kWh | 0.59 | 1.14 | 0.43 | 7.32 | 0.53 | 0.02 |
| LNG | 0.18 kg/kWh | 0.45 | 1.44 | 0.00 | 0.00 | 0.22 | 0.00 |
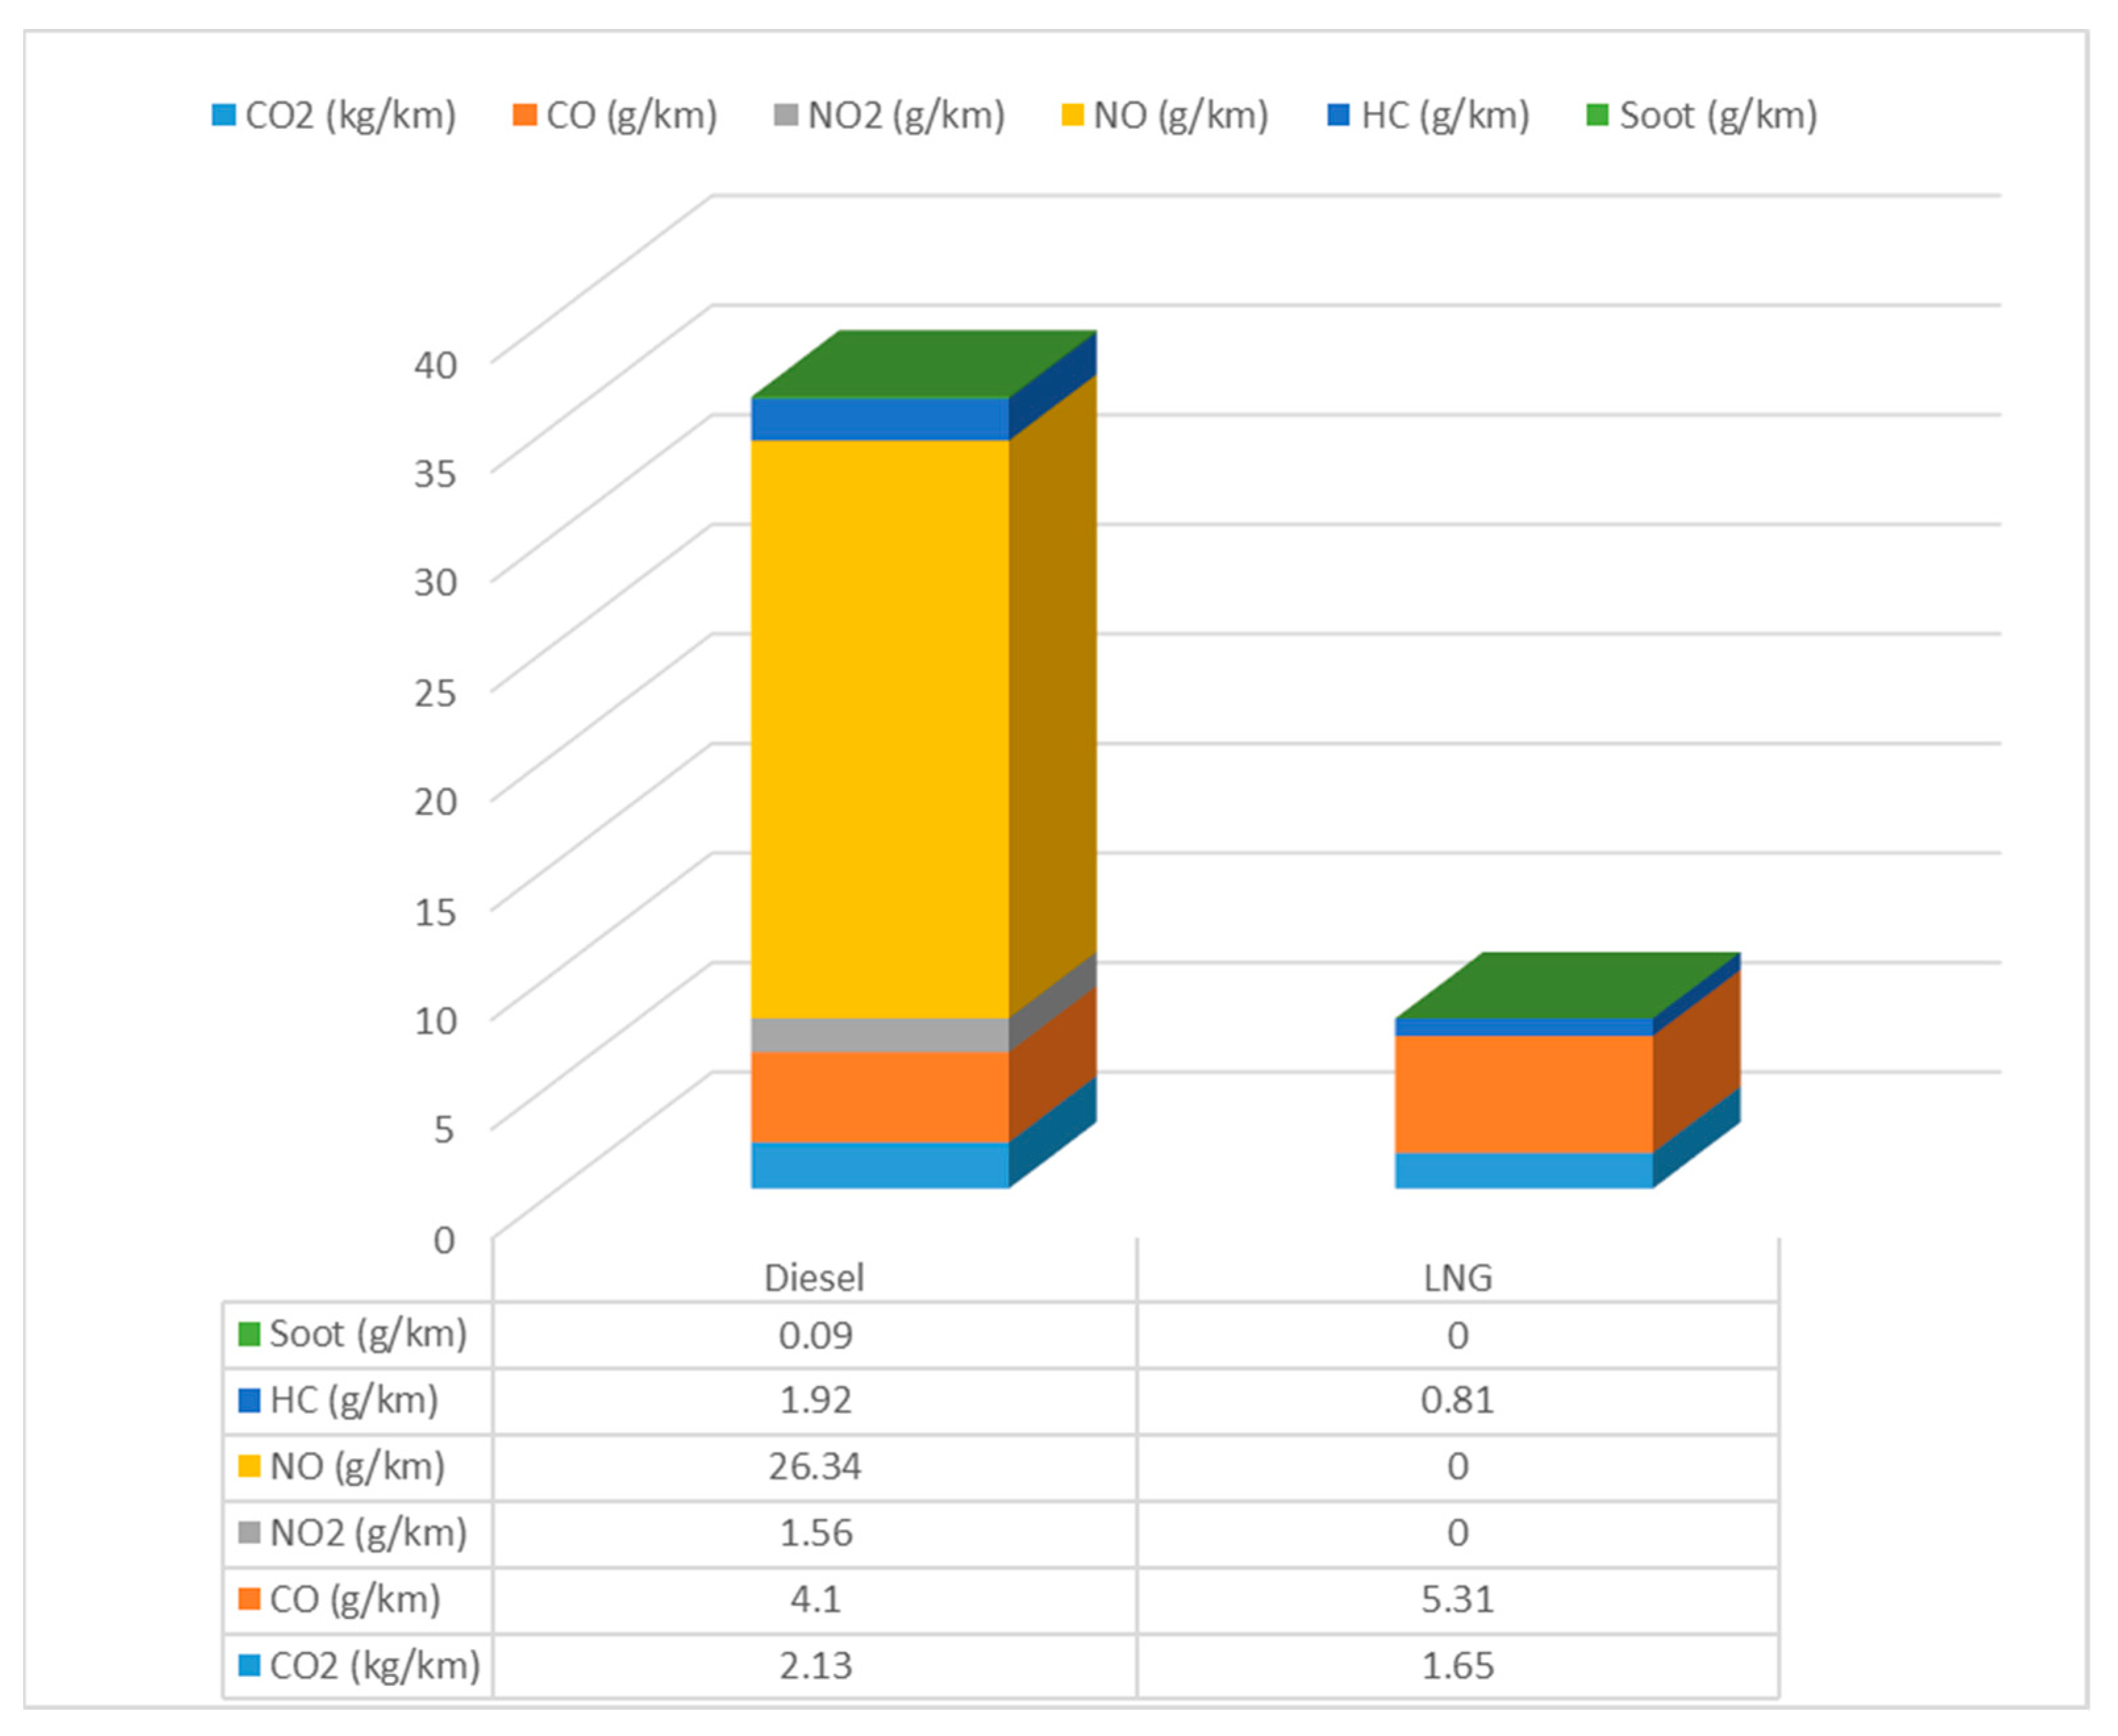
| Fuel | CO2 (kg/km) | CO (g/km) | NO2 (g/km) | NO (g/km) | HC (g/km) | Soot (g/km) | |
| Diesel | 0.92 L/km | 2.13 | 4.10 | 1.56 | 26.34 | 1.92 | 0.09 |
| LNG | 0.67 kg/km | 1.65 | 5.31 | 0.00 | 0.00 | 0.81 | 0.00 |
| Fuel | CO2 (kg/h) | CO (g/h) | NO2 (g/h) | NO (g/h) | HC (g/h) | Soot (g/h) | |
| Diesel | 33.92 L/h | 78.34 | 150.84 | 57.22 | 968.09 | 70.51 | 3.16 |
| LNG | 26.15 kg/h | 63.93 | 205.61 | 0.00 | 0.01 | 31.37 | 0.01 |
Publisher’s Note: MDPI stays neutral with regard to jurisdictional claims in published maps and institutional affiliations. |
© 2021 by the authors. Licensee MDPI, Basel, Switzerland. This article is an open access article distributed under the terms and conditions of the Creative Commons Attribution (CC BY) license (https://creativecommons.org/licenses/by/4.0/).
Share and Cite
Luque, P.; Mántaras, D.A.; Sanchez, L. Artificial Intelligence Applied to Evaluate Emissions and Energy Consumption in Commuter Railways: Comparison of Liquefied Natural Gas as an Alternative Fuel to Diesel. Sustainability 2021, 13, 7112. https://doi.org/10.3390/su13137112
Luque P, Mántaras DA, Sanchez L. Artificial Intelligence Applied to Evaluate Emissions and Energy Consumption in Commuter Railways: Comparison of Liquefied Natural Gas as an Alternative Fuel to Diesel. Sustainability. 2021; 13(13):7112. https://doi.org/10.3390/su13137112
Chicago/Turabian StyleLuque, Pablo, Daniel A. Mántaras, and Luciano Sanchez. 2021. "Artificial Intelligence Applied to Evaluate Emissions and Energy Consumption in Commuter Railways: Comparison of Liquefied Natural Gas as an Alternative Fuel to Diesel" Sustainability 13, no. 13: 7112. https://doi.org/10.3390/su13137112