
Sustainable Growth Variables by Industry Sectors and Their Influence on Changes in Business Models of SMEs in the Era of Digital Transformation


Department of Knowledge Service Consulting, Hansung University, Seoul 136-792, Korea
Sustainability 2021, 13(13), 7114; https://doi.org/10.3390/su13137114
Submission received: 10 May 2021
/
Revised: 16 June 2021
/
Accepted: 20 June 2021
/
Published: 24 June 2021
(This article belongs to the Special Issue Business Models for SME’s Sustainability)
Abstract
:SMEs around the world are constantly under threats to their survival and sustainable growth. This study evaluated the variables influencing the sustainable growth of SMEs in the technological evolution of digital transformation. I propose a business model innovation strategy for the sustainable growth of SMEs. Furthermore, I evaluated the variables influencing growth by industry sector and present strategies for innovation in the business model. Data were collected from 205 CEOs in six sector industries in Korea, and I investigated the effect of variables that affected the company’s sustainability when introducing digital transformation. A partial least-squares regression was used for the statistical analysis and was performed using a data group analysis. I found that the SME performance varied by industry and that technological competency had a mediating effect. The variables that most affected the SME performance were management, technology, and technical competence in marketing and innovation. This research went beyond the limitations of studying only the effects of each of the previous literature variables through causal studies linking these variables. The variables affecting the performance of the industries were found to be different. By comparing the variables that led to a difference in performance in the industrial sector, I developed a business model innovation strategy that can affect the sustainable performance of SMEs.
1. Introduction
With the evolution of technology, the primary trend of the world economy is the Industrial Revolution 4.0 (IR 4.0) as a new paradigm for sustainable growth. IR 4.0 technology has many advantages for manufacturing that allow for a more efficient and flexible production setup to target large-scale product customization without a loss-of competitiveness or increased production costs. Large enterprises have developed most of the current technology [1].
However, Imran et al. [1] mentioned that IR 4.0 is disconnected from the needs of small- and medium-sized enterprises (SMEs). Therefore, research is needed to support the sustainable survival and growth of SMEs. The conceptual definition of digital transformation (DT) is composed of five corporate activities (AT Kearney) that increase a business’s competitiveness in response to changes in the business environment, which are triggered by new digital technologies, such as big data (BD), artificial intelligence (AI), the Internet of things (IoT), smart factories (SF), cyber-physical systems (CPS), and interoperability (IOP).
Vial [2] pointed out that a comprehensive and precise definition of digital transformation is needed. DT claims to maintain a sustainable business and positively impact overall business performance [3,4,5].
From a DT perspective, other researchers have explained the disruptive impact that digital technology has on businesses, including corporate strategy [6,7], innovation [8,9], and business models [10,11,12]. It is emphasized that DT is not a one-off project; it is a continuous transformation and an evolutionary process [13,14]. The rapid development of information and communication technology (ICT) in recent years has emphasized the importance of the concept of a business model (BM) in the field of information systems (IS). DT refers to innovativeness [15], financial performance [16], and organizational growth [17].
Moreover, some organizational performance improvements, including reputation [18,19], were also associated with a company’s competitive advantage [20]. DT is a new business opportunity. Eisingerich and Bell [3] demonstrated that DT enables companies to use digital capabilities to create new BMs, products, and services. They argued that this is an ongoing process that adapts to the customer or market changes and drives innovative change. The digital age is fundamentally changing the way our society and businesses operate. Business model innovation (BMI) has become a fundamental function to survive competition, especially for SMEs. Digital technology is a powerful force that is pushing companies to embrace new BMs [21,22], making innovation increasingly relevant [23,24,25].
The digital age and Industry 4.0 paradigm combine disparate technologies and open up unexpected possibilities, creating fundamentally new products and services and providing the potential to share knowledge between multiple actors in the technology ecosystem [26]. Industry 4.0 also creates innovative BMs [27,28]. BMI represents a new system of activities for a company [29] and an innovative structure for value creation and value capture [24] in which a single company and its alliance partners and customers [30] participate. The role of BMI has been discussed theoretically; however, empirical studies still lack mentions of SMEs [31].
Thus, the researchers identified that DT may be linked to influencing BMs and BMI as a basic function for surviving competition in SMEs. The term business model (BM) was first used decades ago [32]. The term “business model” refers to the intermediary structure between technological artifacts and the achievement of strategic goals and objectives, including creating essential economic value. Similarly, Kamoun [33] argued that a “BM becomes a blueprint for how businesses create and capture value in new services, products, or innovations” (p. 638). Following this approach, Yuan and Zhang [34] argued that it is not the technological application itself, but the BM behind technology artifacts, that achieves success and enables high-tech enterprises to achieve their strategic goals and objectives.
In a study on the structural causal relationship between DT and performance [35], DT was found to affect business models. Park [35] argued that the BM involves a company’s operational performance and corporate performance. Oderanti and Li [25] [36] proposed a new framework that was more subdivided and extended. The BM framework begins with a value proposition, including product offerings, target market segments, and revenue models, to reflect the vision and strategy. A BM states that financial sustainability and stakeholder confidence are evaluated [25,36].
A BM can define value as a company’s rationale for sensing, creating, distributing, and acquiring. It explains how companies make money now and in the future, and it is BMI that changes the BM to a competitive position and improves performance. The activities of an enterprise’s suborganizations aim to enhance the performance of the enterprise [37,38]. Furthermore, they strive to create new value by utilizing existing strategic resources [39]. It has been argued that companies are using digital technologies, such as the IoT, cloud, big data, and AI, to create new products and services, as well as BM changes [40].
The researcher developed objectives and research questions that could help to address the limitations of the existing research:
- The influential variables for SME sustainable growth start from the management side and the technical side. Is it necessary to verify whether the entrepreneur’s management ability and technical ability affect performance?
- Will there be influential variables, such as the ability to mediate corporate performance, in addition to the entrepreneur’s ability?
- Is there a difference between the variables for sustainable growth by a business group and the variables for BM innovation?
To address the limitations of previous research, the researcher used SME financial and technical performances to measure business model innovation. In other words, the purpose of the study was to identify the influential variables that affected performance and then to compare and evaluate the magnitude of the effects according to the variables. Then, an empirical analysis was used to verify the changes in the BM and variables capable of sustainable growth. Moreover, I aim to present a strategic proposal for BMI that was created after verifying the differences for each industry group in terms of which changes in a BM and variables can stimulate the sustainable growth of SMEs.
More specifically, the variables that were capable of sustainable growth were found to be entrepreneurial management ability (EMA) and entrepreneurial technological ability (ETA). Technical competency (technology innovation competency (TIC) and technology marketing competency (TMC)) was used as a parameter and financial (FP) and technical performance (TP) were indicators of BM change. Overcoming the failures of SMEs worldwide in the aftermath of COVID-19 in 2020 is an important research area. The industry sector’s research on SME performances was not part of previous studies, and there are unique issues involved. Verifying the relationship between SME ability variables, competency, and performances will contribute academically and industrially.
2. Theoretical Background and Hypotheses
2.1. DT and BM
Prior research has focused primarily on large enterprises and how unique characteristics, organization-wide approaches to collaborative innovation [22], and the unique context prevailing within SMEs can influence BMI. Some authors have highlighted that large companies are more active than small businesses at using external resources for innovation [41]. Simultaneously, digitization presents opportunities for SMEs, and unstructured organizations can develop their ability to proactively drive BMI faster [42]. Enterprises can organize a business model into an internal value chain (products and services, activities, and resources) or an external value chain (customers, partners, and competitors).
Business models help innovation by turning market opportunities into revenue and providing value for services or products through commercialization [43]. Companies commercialize new ideas and technologies through BMs. However, companies often have a wide range of investments and processes to explore new ideas and technologies but can rarely innovate BMs [23,27]. In other words, digitization has widened the boundaries of the enterprise and has to be reviewed; therefore, the BM also needs to be reexamined.
Technology and relationship boundary management functions are relevant; however, factors, such as entrepreneurship, creativity, and leadership skills, do not appear to affect BMI. For this reason, SMEs should pay attention to relationship and technology boundary competencies to connect more with real business model innovators than with entrepreneurship, creativity, and innovation. Teece [44] defined a BM as the design or architecture of a set of observable activities of an enterprise that is explicitly committed to the mechanism of value creation, delivery, and capture [45].
A BM’s value creation mechanisms reflect organizational decisions regarding defining resource allocation, identifying and exploiting new business opportunities, and introducing new products and services to the market [45]. Entrepreneurs can take advantage of the flexibility of their business models to accommodate market uncertainty and the changes that are needed in the company’s day-to-day activities [46,47]. A BM affects value creation and appropriation, business agility, and the company’s success [46,47,48,49]. A BM is a competitive tool that is used to innovate an organization’s core processes progressively or radically [46] and enable actionable and conservative business decisions [43,45,49].
Moreover, previous studies have confirmed that BMI (i.e., superior to a product or technological innovation) contributes to the globalization success, competitive advantage, and success of SMEs [49]. Small businesses that participate in BMI can internationalize faster than nonparticipating small businesses [49]. Creative and groundbreaking contributions [45] involve discussing value chain analysis [50], resource-based perspectives [51], strategic network theory [52,53], and externality theory [54]. The Schumpeterian innovation theory [55,56], construction theory [57,58], and contingency theory [59,60] added to the definition of the business model as the design of transaction content, structure, and governance to create value through the use of business opportunities [45].
2.2. DT, BM and Sustainable Growth
The BM theme complements the effects of each company, industry, and country on corporate performance by conditioning fluctuations in corporate performance [61,62,63,64]. Four distinct themes have been proposed: novelty, efficiency, complementarity, and fixation [25,45,65,66]. There is no research on how the industry is changing due to BMI through changing BM themes [67,68,69]. Velu [70] distinguished other forms of organizational elements: management innovation and BMI.
A BM summarizes the architecture and logic of the business and defines an organization’s value proposition and approach to value creation and value capture. In doing so, a BM serves as a vehicle for converting the benefits of technology through the marketplace into customer value. BM innovation articulates changes in the means of value creation and capture. BM innovation can often include management innovation. However, it can improve performance by implementing management innovation in the existing BM.
The industry 4.0 concept in digital technology [71], originating from the manufacturing industry, provides the ability to implement efficiency gains within the manufacturing process through BMs, such as identifying and tracking materials within the industrial supply chain [69]. Rajput and Singh [72] argued that implementing circular economic principles in an enterprise’s BM while supporting the view that digital technology supports value creation and capture and activates resource flow strategies is the value of Industry 4.0 technology, which was found to be a significant driver of innovation.
For a BM to be successful, it must be suitable for the ecosystem conditions, and therefore the viability of the applied BM configuration must be continuously monitored [44,73]. If nonconformities are identified, the BM should be adapted to the new ecosystem conditions [74,75,76]. This adjustment is called BMI. According to the BM literature, existing research on BMI provides a heterogeneous understanding of the phenomenon. BMI is defined as the gradual changes of individual components of the BM, expansion of existing BMs, and the introduction of parallel business models and potentially BMs [77]. Moreover, BMI needs to replace the old model with a radically different one.
While some scholars argue that BMI should be new to the industry [78], I follow a different strand of research claiming that BMI can be new to the company [79,80,81]. Recent research has advanced the focus from a static understanding of the business model to a dynamic view of the business model [81], its innovation [24,68,82], and its transformation [83,84]. Climent and Haftor [85] stated, stable industries exposed to relevant new technologies are more susceptible to being successfully destroyed by novel BM themes. According to the analysis results of previous studies, DT is recognized as essential for all companies and necessary for survival, regardless of being large versus small or medium-sized enterprises [21,22,27,28].
However, in reality, this has been limited to large enterprises, and research on SMEs was not actively conducted. In addition, a BM is a realistic means for SMEs to grow small in the changing industrial environment due to the influence of DT [27,28]. As SMEs lack the resources to improve themselves on how to innovate and complement their BMs [41]. Through this study, I intend to demonstrate the key nutritional factors for the sustainable growth of SMEs in the DT era and provide BM innovation directions for intensive improvement by industry. Therefore, the purpose is to empirically present a strategy in terms of BMs along with factors affecting the survival and sustainable growth of SMEs.
This research model was developed based on the following studies: (1) corporate strategy [6,7], innovation [8,9], and business models [10,12]; (2) digital technology innovations [23,24,25] that push firms to embrace new BMs [21,22]; (3) Industry 4.0 also creates innovative BMs [27,28]; (4) a BM achieves success and enables the company to achieve its strategic goals and objectives [35]; (5) in studies on the structural causal relationship between DT and performance, DT affects business models [36]; and (6) it is argued that the value of Industry 4.0 technology is that digital technology implements the principle of circular economy in the BM of enterprises [72].
2.3. Hypothesis
Previous studies were limited to a single variable. In addition, some studies were conducted on the management performance of variables; however, there has been no study on the mediating effect of SME capabilities [85,86]. Overall, the challenge in previous research is to identify the variables that determine success in terms of management performance and competencies. Therefore, there is a limit on the ability to determine causal or dynamic relationships between variables. In previous studies, it was impossible to comprehensively study the potential influencing variables, such as managerial ability, technical ability, and competence [86,87,88,89,90,91,92,93,94,95,96,97,98,99,100,101].
Therefore, the researcher studied the effects of success variables on corporate competency and management performance and the effect of competency on performance. The effects of technological expertise and management ability on the innovation and competitiveness of SMEs were studied by [89], and the results showed that the indirect effect of competency was much stronger than the direct effect on competitive advantage. Kim et al. [90] suggested that the research model for technology competency had a positive (+) effect on the core competencies of SMEs, and competencies did not directly affect corporate performance, but corporate core competencies had a full mediating effect. Prohorovs et al. [91] studied six success factors of startups, including management ability, education, and technology, experience, communication, managerial support, and financial potential (the objectives and investment target).
The effect of corporate competencies on the success of business incubators was an independent variable [92]. The dynamic competencies positively impact startup business performance [93]. An empirical study on the effect of technology commercialization competency on management performance, technology competency, and marketing competency as a control variable for technology commercialization competency as independent variables was conducted [94]. An empirical research model of the impact of performance and technology commercialization competency was presented [95]. Technology innovation and commercialization competencies were used to study the effect of management performance [96].
Therefore, the necessary competencies that affect performance as mediating variables need to focus on technological competencies and verify their effectiveness. It was necessary to test the hypothesis to create business results as well as the variables that act as mediating factors. The effect of the CEO’s technological competency in SMEs on management performance was studied [97]. A research model was presented on the impact of technological competency on management performance. Knowledge and networks in the global startup process study suggested a network’s necessity [98]. An empirical study was conducted on network competency, and the effect of marketing competency on management performance was assessed [102].
The effects of core competencies and network competencies on SME management performance were studied [103]. The effect of network entrepreneurship of technology startups on business performance was studied [104]. Furthermore, the effect of network competency on technological innovation capability and innovation performance was studied [103]. This study was divided into a management perspective and a technical perspective. Regarding management, it is necessary to categorize it into four subfactors—management strategies, exit strategies, technical ability, and technical commercialization ability—to verify the effectiveness. The reason is that it is difficult to identify the effects’ factors without excluding external factors. As a variable of success for entrepreneurs, it was necessary to focus on technology and management factors, excluding external influences. Therefore, the researcher proposed the following hypothesis:
Proposition 1.
Entrepreneurial abilities affect the competence of SMEs.
Hypothesis 1:
Entrepreneurial Management Ability affects the Technology Innovation Competency of SMEs.
Hypothesis 2:
Entrepreneurial Management Ability affects the Technology Marketing Competency of SMEs.
Hypothesis 3:
Entrepreneurial Management Ability affects the Financial Performance of SMEs.
Hypothesis 4:
Entrepreneurial Management Ability affects the Technical Performance of SMEs.
Proposition 2.
SME competencies affect performance.
Hypothesis 5:
Entrepreneurial Technological Ability affects the Technology Innovation Competency of SMEs.
Hypothesis 6:
Entrepreneurial Technological Ability affects the Technology Marketing Competency of SMEs.
Hypothesis 7:
Entrepreneurial Technological Ability affects the Financial Performance of SMEs.
Hypothesis 8:
Entrepreneurial Technological Ability affects the Technical Performance of SMEs.
Proposition 3.
SME entrepreneurial abilities affect performance.
Hypothesis 9:
Technology Innovation Competency affects the Financial Performance of SMEs.
Hypothesis 10:
Technology Innovation Competency affects the technical performance of SMEs.
Hypothesis 11:
Technology Marketing Competency affects the Financial Performance of SMEs.
Hypothesis 12:
The Technology Marketing Competency affects the Technical Performance of SMEs.
BMI is a fundamental function for surviving competition, especially for small and medium-sized enterprises (SMEs), and digital technology is a powerful force for enterprises to drive new BMs [21,22], creating innovation [23,24,25]. Yuan and Zhang [34] argued that it is the BM behind technology that enables companies to achieve their strategic goals and objectives. In studies of structural causality between DT and performance, DT influences business models [35]. BMs were assessed for financial sustainability [36]. Comprehensively, it can be seen that the sustainable growth of SMEs is measured by the company’s performance, and that the sustainable growth is affected by the BM of SMEs.
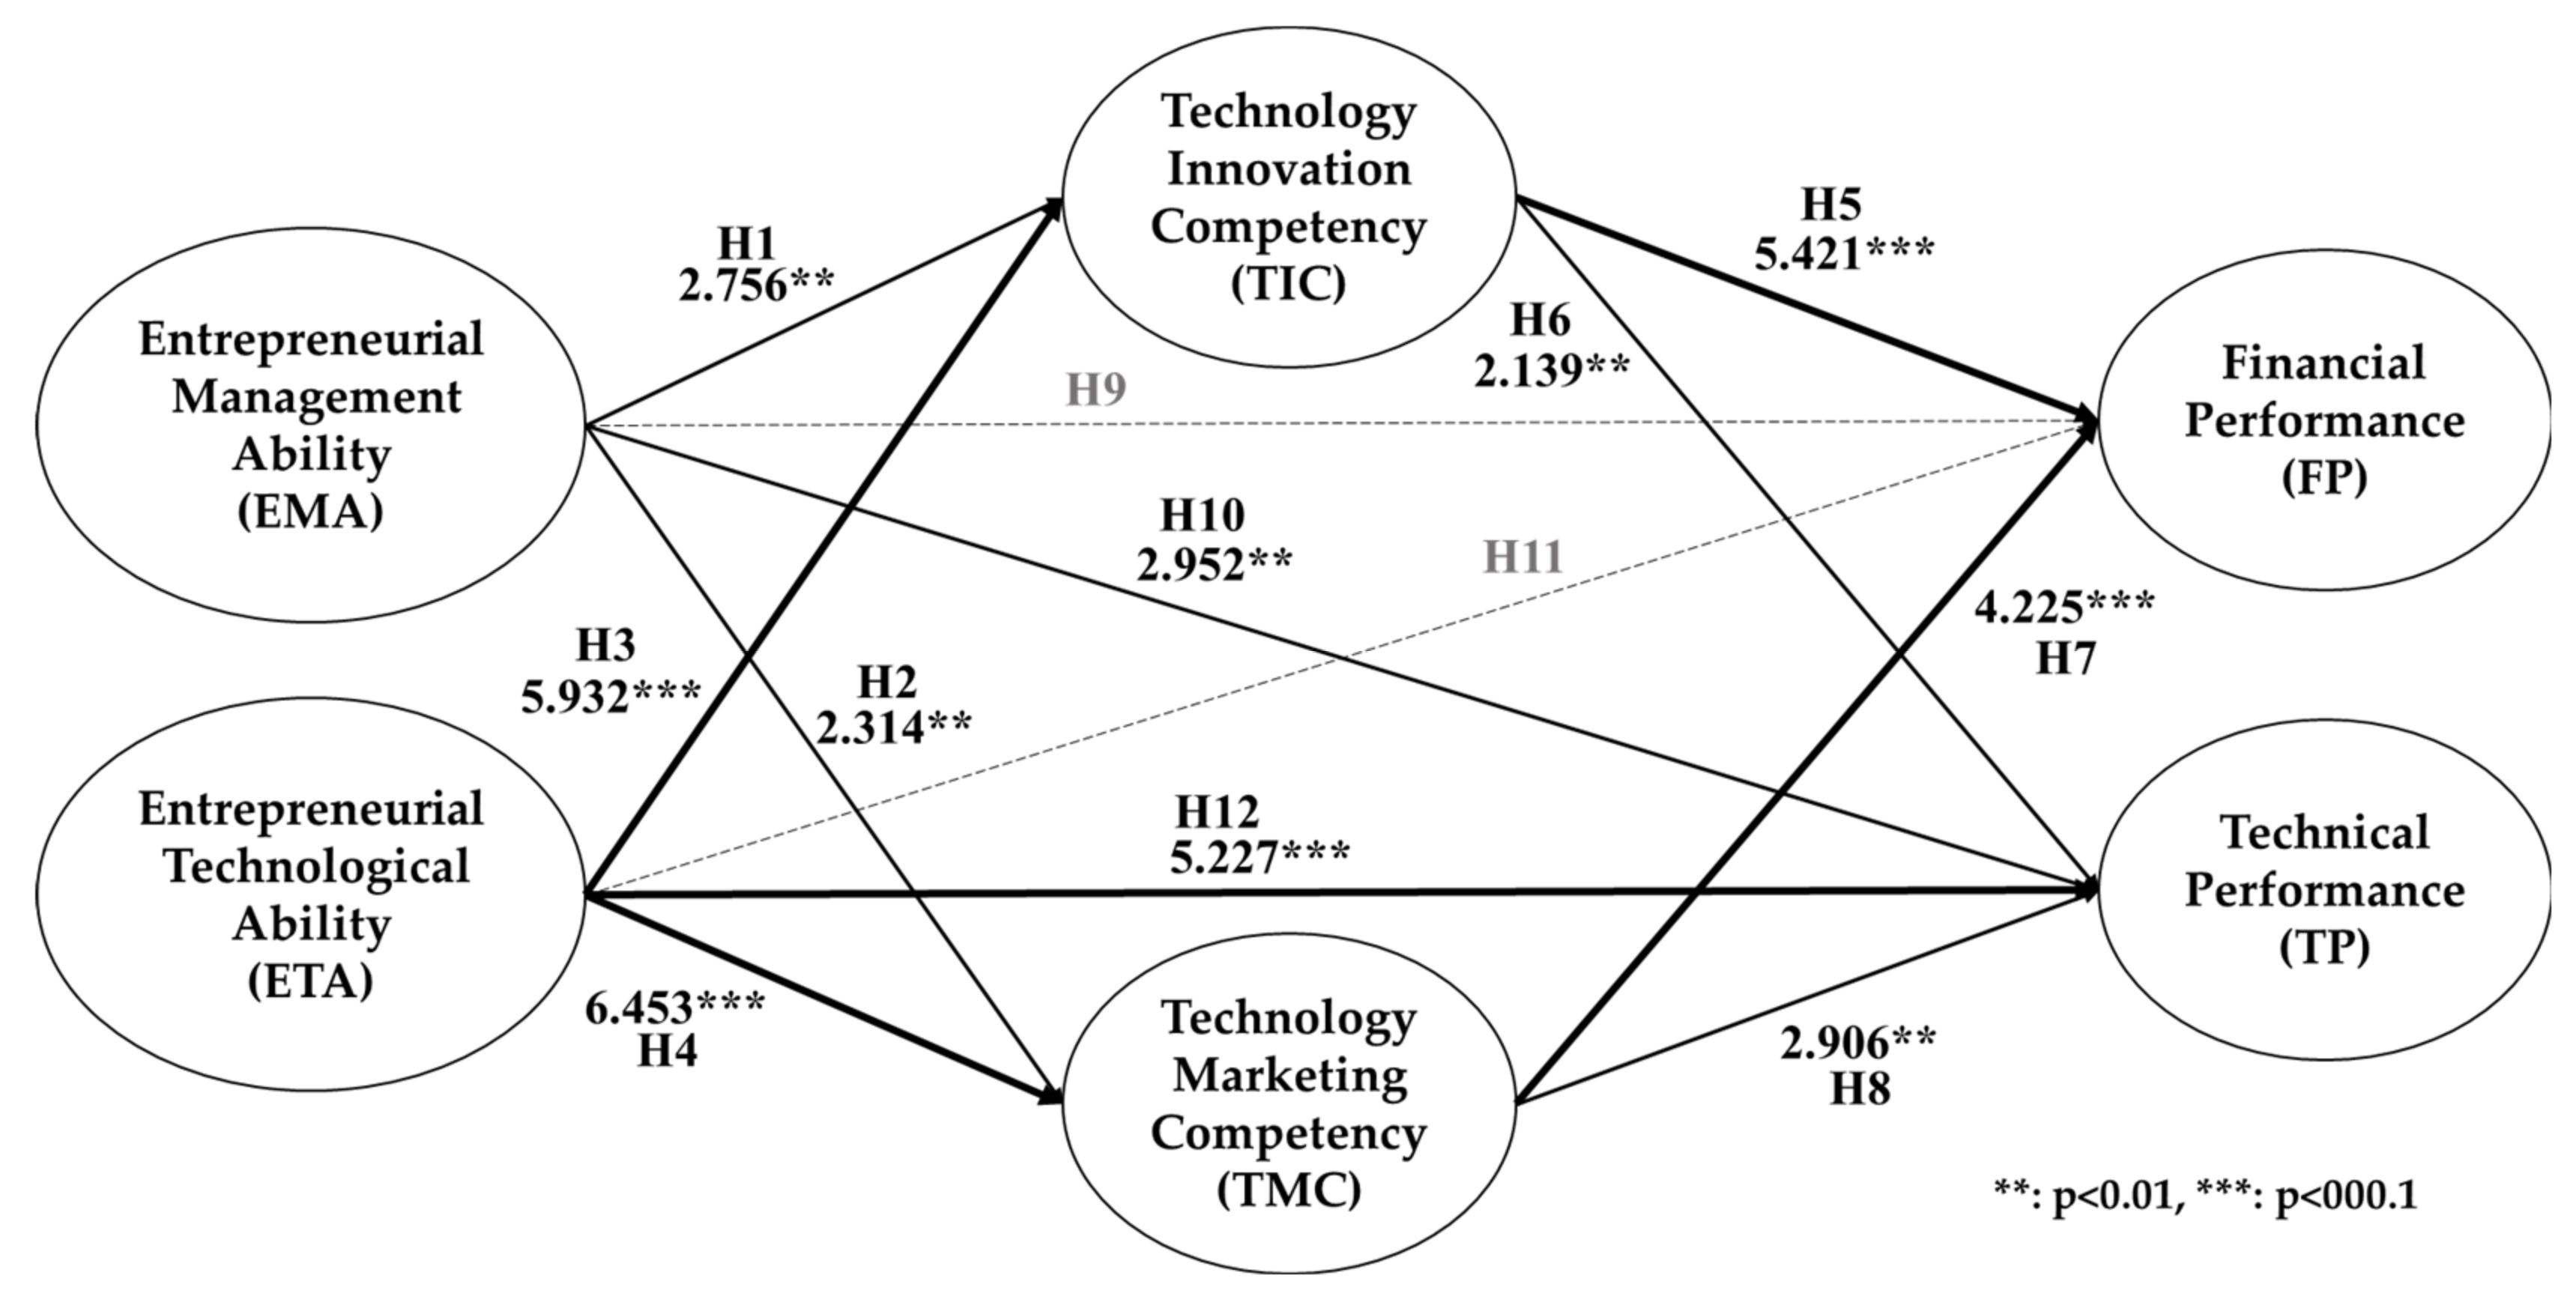
It is BMI that enables SMEs to generate revenue now and in the future and turn BMs into competitive positions and improve performance. Therefore, this study established the hypothesis that the ability of SMEs affects competence and performance, that competence verifies the key factors affecting performance, and that performance accompanies changes in BMs. In addition, these changes in BMs will be different according to the six industry classifications, and we verify the important factors that influence each industry. Figure 1 shows this research model.
Table 1 summarizes the differences between this study and previous studies. Table 1 shows the hypothesis proposition development process in this study. Independent variables, parameters, and dependent variables studied in previous studies were compared and analyzed to show the differentiation of the variables used in this study, and a hypothesis frame is displayed at the bottom of Table 1.
3. Materials and Methods
3.1. Measures: Independent Variables (Ability)
3.1.1. Entrepreneurial Management Ability (EMA)
A study of a manager’s psychological characteristics showed that creative innovation enables developing new products, technologies, and procedures through research and development and innovation [109]. Research on management ability is significant because it can systematically and concretely explain the relationship between a manager’s characteristics and management performance. The evaluation of observable management ability can give a company’s manager direction for the company’s development. Early-stage SMEs are not precisely organized; therefore, there is a limit to creating results based on an organization’s capabilities. Although management abilities vary from time to time in each study, the technical competence, strategic thinking ability, and organizational competency are important.
3.1.2. Entrepreneurial Technical Ability (ETA)
Technical ability is vital for promoting and supporting a company’s innovation strategy and the sustainable success resulting from innovation activities [106]. A company’s technical ability can be represented using six categories: learning ability, R&D ability, resource allocation ability, production ability, organizational ability, and strategic planning ability [112].
3.2. Measures: Mediating Variables (Competency)
3.2.1. Technology Innovation Competency (TIC)
Technology innovation competency is critical and leads to a company’s continuous growth. At the same time, it is a characteristic of a comprehensive company that promotes and supports technological innovation [110]. However, researchers found that the relationship between the R&D investment level and business performance was negative or nonexistent. In a study of the technological innovation system framework and the entrepreneur’s view of innovation, the technological innovation system generated valuable insights into the processes that need stimulation for the successful development and implementation of innovative sustainability technologies. It has been shown that innovation capacity positively affects performance [111].
3.2.2. Technology Marketing Competency (TMC)
Analysis of the success or failure of technological development shows that marketing’s importance is reduced. In other words, 20–40% of technical failures are due to defects in the technology itself [99]. The rest are due to a lack of marketing competency, especially for high-tech products; the ratio of lack of marketing competency was shown to reach up to 75% [100]. The concept of technology marketing is interpreted differently depending on the researcher and is expressed in two ways. As a unique research area of marketing, it is high-tech product marketing that sells or purchases products with technology-type products through marketing techniques.
3.3. Measures: Dependent Variables (Performance)
3.3.1. Financial Performance (FP)
Despite the diversity of indicators for management performance, profitability and growth are mainly used for empirical analyses. There are also quantitative and qualitative methods for measuring performance based on the financial statements’ numerical values. Financial performance indicators show past management results but have limitations in predicting future management performance. One of the newly emerged performance indicators that was developed to respond to these problems is the balanced scorecard (BSC), which is not about short-term goal management but is centered only on financial indicators to achieve its vision and strategic objectives. Long-term and comprehensive balance management of indicators is viewed from four perspectives: finances, customers, internal processes, and learning and growth [101].
3.3.2. Technical Performance (TP)
Technical performance has a relatively significant effect on technical management competency, production support, marketing competency, research and development competency, and new product development competency. It has a significant impact on market information and business performance. It is said that securing superior technology can act directly as a determinant of investment by venture capital or other investment companies because it is directly related to the growth or profits of venture companies [113].
3.4. Sample Characteristics
Data were collected from 205 CEOs in six sector industries in Korea. Electrics/electronics, Machinery/parts, IT/SW, Chemicals/fibers/materials, Life industry/food, and Craft/others. Table 2 shows the characteristics of the demographical dataset (n = 205).
Table 3 summarizes the variables and definitions used in the previous study.
4. Results
Table 4 and Table 5 demonstrate the internal consistency reliability, convergent validity, and discriminant validity of the measurement model configuration concept. The Cronbach’s α, rho_A, C.R, AVE, and Fornell–Larcker values all met the evaluation criteria reliability, and the validity of the measurement model was demonstrated.
Table 6 demonstrates the multicollinearity between the endogenous constituent concepts. Since all VIF values were less than 5, we confirmed that there was no multicollinearity between the constituent concepts.
In the hypothesis justification results in Table 7, the variables and paths that were significant in FP and TP, representing the sustainable growth of SMEs, are as follows.
- Hypotheses, variables, and paths that were significant for FP:
- H5 (accept): technology innovation competency → financial performance;
- H7 (accept): technology marketing competency → financial performance.
Financial performance was significantly influenced by technology innovation competency and technology marketing competency. In other words, it can be stated that technical competence affected financial performance rather than management and technical competence. This result is seen as demonstrating that DT’s technical competence (TMC and TIC) was a critical variable in terms of the financial performance.
- The significant hypotheses, variables, and pathways for technical performance (TP):
- 3.
- H10 (accept): management ability → technical performance;
- 4.
- H12 (accept): technological ability → technical performance;
- 5.
- H6 (accept): technology innovation competency → technical performance;
- 6.
- H8 (accept): technology marketing competency → technical performance.
Technical performance was significantly influenced by technology innovation competency and technology marketing competency. In other words, unlike financial performance, technical performance was shown as having affected the entrepreneur’s management ability and technical ability. In addition, technical competency was also identified as a variable that affected technical performance. This result is seen as showing that entrepreneurial management (EMA and ETA) and technical competence (TMC and TIC) were critical variables in the technological performance of SMEs.
In the hypothesis verification results in Table 7, the variables and paths in which the entrepreneur’s management competency and technical competency were significant for technical competence (TMC and TIC) are as follows:
- 7.
- H1 (accept): management ability → technology innovation competency;
- 8.
- H2 (accept): management ability → technology marketing competency;
- 9.
- H3 (accept): technological ability → technology innovation competency;
- 10.
- H4 (accept): technological ability → technology marketing competency.
The entrepreneur’s management capability and technical capability were evaluated as having a significant influence on both technical capabilities (TMC and TIC). This result is seen as showing that entrepreneurs’ management and technical capabilities (EMA and ETA) were critical variables in improving SME technological capabilities.
The variables and paths that were significant for the mediating effect of technical competence (TMC and TIC) on FP and TP representing sustainable growth of SMEs are as follows:
- Special indirect variables and paths that were relevant to financial performance:
- 11.
- Technological ability → technology innovation competency → financial performance;
- 12.
- Management ability → technology marketing competency → financial performance;
- 13.
- Management ability → technology innovation competency → financial performance;
- 14.
- Technological Ability → technology marketing competency → financial performance.
Table 8 shows that technical competence (TMC, TIC) mediated EMA and ET and had a significant indirect effect on FP. In other words, technical competence (TMC and TIC) was evaluated as an essential variable that not only directly affected FP (as in the H1 and H9 verification results) but also mediated entrepreneurial competence (EMA and ETA). This result is seen as verifying that DT’s technical competence is a critical variable in FP, in addition to achieving FP only with entrepreneurial competence (EMA and ETA).
Table 9 demonstrates the explanatory power of the independent variable for endogenous variables; it can be seen that all four variables showed a high explanatory power of 0.6 or higher. In particular, TP was the highest at 0.882, followed by FP at 0.808.
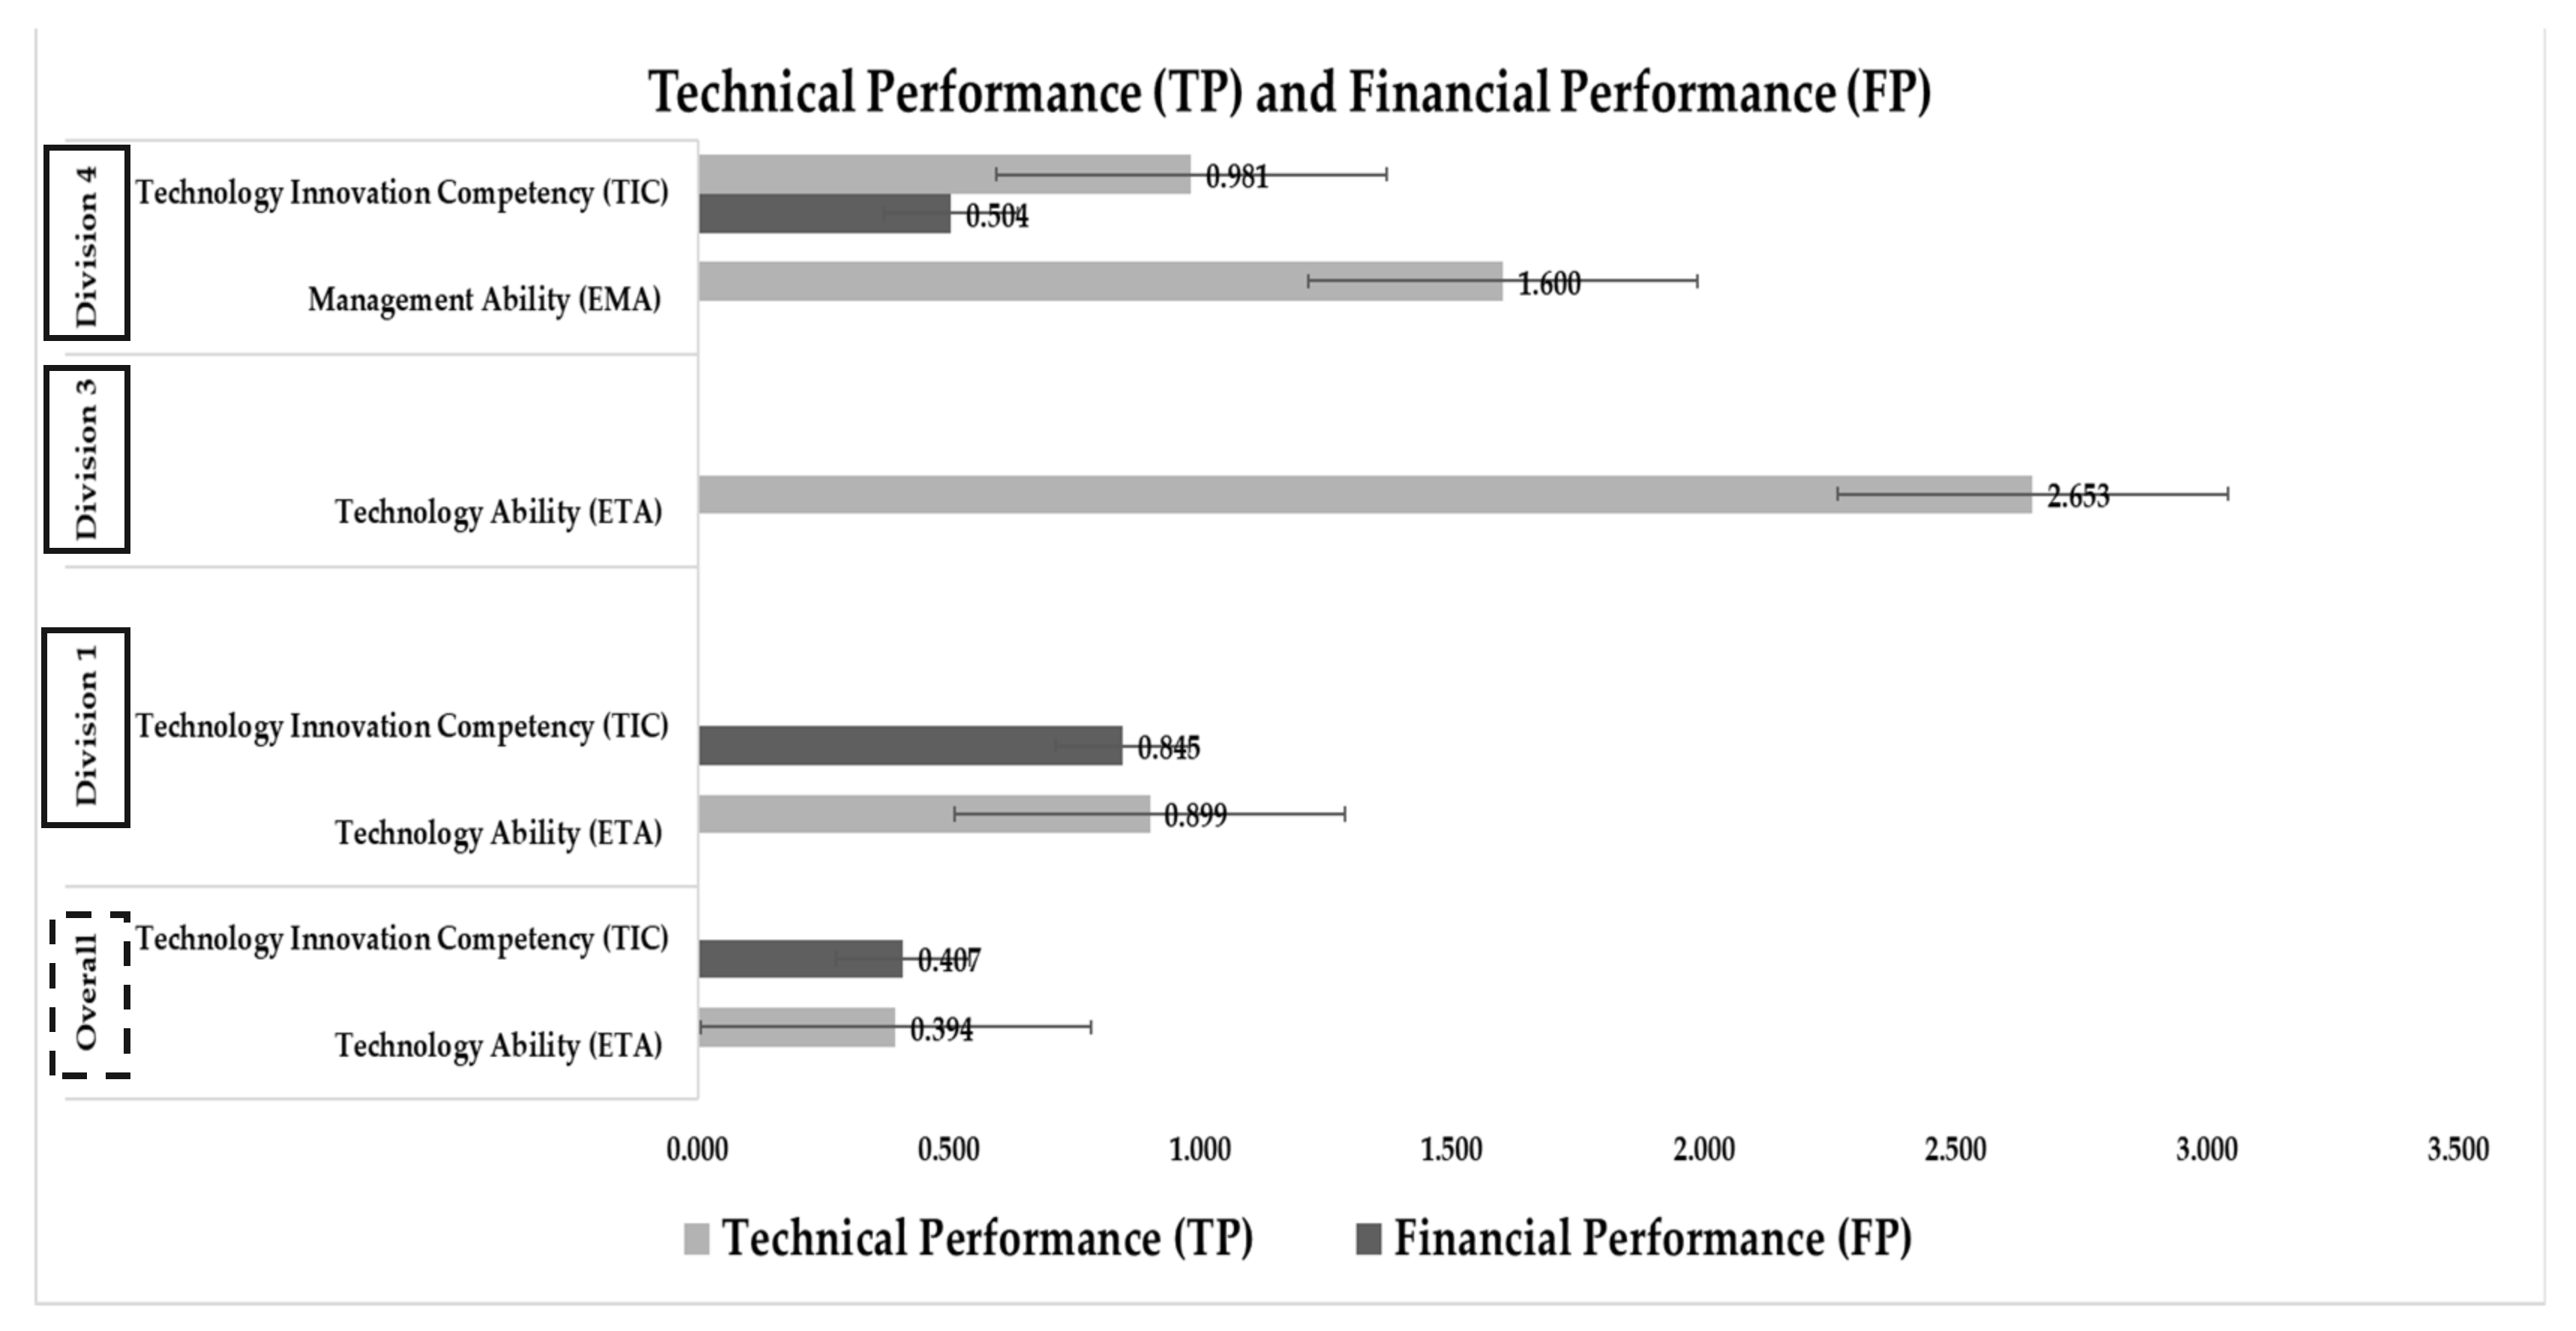
Table 10 shows the effect size results for independent variables, parameters, and dependent variables. The effect size for FP of TIC was 0.407, which had a powerful effect. ETA had a powerful effect, as the effect size for TP was 0.394. TMC had a strong effect of 0.214 for FP. ETA had a powerful effect, as the effect size for TMC was 0.481. The effect size for TIC was 0.379, which was also very strong.
Figure 2 shows the results of the hypothesis test of the structural model. The variables that affected FP and TP can be checked in detail.
In Table 11, the difference in the total effect on FP and TP, which represents the sustainable growth of SMEs according to industry divisions, is shown, along with the difference between each influence variable. Figure 3 is a graph of Table 8, where it can be seen that the sizes of the influence of FP and TP were different depending on the division; the influencing variable was also different. Figure 3 shows the most significant findings of this study. The variables that had the most significant influence while enabling the sustainable growth of SMEs were different depending on the industry division. A BM’s change or innovation showed that different directions and strategies were needed depending on the industry division.
5. Discussion
The basic prior research theory for asserting the conclusion was from the hypothesis test results of Garzella [30]. The BM is a mediating structure between technical artifacts and the achievement of strategic goals and objectives, including the creation of essential economic value. Therefore, a BM needs to be differentiated according to industry sector, which results in a differentiation that guarantees sustainable growth. Using the results verified in this study, the changes or innovations in BM by industry can be suggested as follows:
- The significant variables for the impact of sustainable growth of SMEs were EMA, ETA, TMC, and TIC. This result confirmed that management ability affects sustainable growth [85].
- The most significant variable for the impact of sustainable growth of SMEs according to industry sectors was DIV 3. The effect was in the order DIV 3 > DIV 4 > DIV 1. This shows that DIV 3 (IT/SW) was highly influenced by ETA and that a BM innovation strategy that improves ETA is needed. This result is a finding in the study and an achievement for the purpose of this study.
5.1. Hypothesis Testing
In the process of identifying the direct effect, mediating effect, and total effect, Hypotheses 9 and 11 were rejected after identifying the significances of the path coefficients. Both the mediating effect and the total effect were significant. In addition, the hypotheses, excluding Hypotheses 9 and 11, were found to have a significant direct effect, mediating effect, and total effect. For Hypothesis 9, I confirmed that EMA did not directly affect FP [113]. This indicated that it was not a variable to consider regarding transforming a BM.
In other words, although traditional manufacturing industries have emphasized EMA for the growth and survival of companies, it is necessary to change EMA to survive with the application of DT. Regarding Hypothesis 11, it was confirmed that ETA was not a variable that affected FP. This confirms the research results that management ability affects financial performance [109]. In other words, FP was not directly affected by ETA. This indicates that it was not a variable to consider regarding transforming a BM. As can be seen from the results of the hypothesis verification, considering that the rapid industrial application of DT is a global trend, the existing EMA and ETA together showed that there was a limit to sustainable growth and survival.
5.2. Differences in Variables Influencing Sustainable Growth of SMEs According to Industry Divisions
- The researcher showed that the variables that influence the sustainable growth of SMEs according to the industry division will be different, which was an essential finding of this research. EMA, ETA, TMC, and TIC were indicators of sustainable growth, FP, and TP. This result confirmed the results of previous studies [90,92,93,103,105]. By comparing the total effect, the differences between each influence variable were identified. The difference in the total effect on FP and TP, which represents the sustainable growth of SMEs according to the industry division, was identified.
The differences between each influence variable are shown. Depending on the division, the magnitude of the impact on the FP and TP of the four influence variables was different, and the influencing variable was also different. Since the variables that had the greatest influence while enabling the sustainable growth of SMEs differed depending on the industry division, a change or innovation in a BM showed that different directions and strategies were needed depending on the industry.
There were six types of industry sectors considered in this study: DIV 1—electrics/electronics, DIV 2—machinery/parts, DIV 3—IT/SW, DIV 4—chemicals/textiles/materials, DIV 5—life/food, and DIV 6—crafts/others. Overall, DIVs 1–4 had a substantial total effect on TP for the four influencing variables compared to the entire industry group. DIV 3 was the largest. The effect was in the order of: DIV 3 > DIV 4 > DIV 1. This shows that DIV 3 (IT/SW) was highly influenced by ETA and that a BM innovation strategy to improve ETA is needed.
6. Conclusions
In conclusion, since the variables that had the most significant influence while enabling the sustainable growth of SMEs differed depending on the industry division, the change or innovation of a BM showed that different directions and strategies are needed depending on the industry. The theoretical and practical contributions of this study, which offers a differentiated BM change strategy by industry, are as follows:
- Theoretical Implications: Influencing variables for sustainable growth varied by industry. I provided verification results of the specific influencing variables that went beyond the limits of the conceptual framework for the change of a prior BM. Through an empirical verification, I presented areas in which to seek changes and specific directions that should be taken to incorporate BM innovation in business operations.
- Managerial implications: By presenting variables that must be considered when pursuing change and innovation in a BM by industry, I provided practical BM change factors that can overcome the limitations of existing theoretical research.
In particular, the electronics industry was shown to have a significant effect on both TP and FP through TIC and ETA. Strategies for improving ETA and TIC were essential. In the case of the IT/SW industry, TIC and EMA were shown to have a significant effect on TP. Moreover, TIC was essential for sustainable growth compared to other industries. Therefore, when establishing a BM innovation strategy, strategies for improving SMEs’ EMA and TIC were essential.
As verified from the IT/SW industry results and the electronics industry, it can be seen that different industries required different strategies for BM innovation. The limitation of this study is that it was not possible to directly demonstrate the BM change of SMEs due to the DT effect through an interview method. To understand the direct impact on performance by implementing BMI for SMEs in the future, it is necessary to perform follow-up research through longitudinal studies. Future research is planned to conduct case studies with a few key players.
Funding
This research received no external funding.
Institutional Review Board Statement
Not applicable.
Informed Consent Statement
Not applicable.
Data Availability Statement
Not applicable.
Acknowledgments
This study was financially supported by Hansung University, Korea.
Conflicts of Interest
The author declares no conflict of interest.
References
- Imran, M.; Aziz, A.; Hamid, S.; Shabbir, M.; Salman, R.; Jian, Z. Retracted: The mediating role of total quality management between entrepreneurial orientation and SMEs export performance. Manag. Sci. Lett. 2018, 8, 519–532. [Google Scholar] [CrossRef]
- Vial, G. Understanding digital transformation: A review and a research agenda. J. Strateg. Inf. Syst. 2019, 28, 118–144. [Google Scholar] [CrossRef]
- Eisingerich, A.B.; Bell, S.J. Perceived service quality and customer trust: Does enhance customers’ service knowledge matter? J. Serv. Res. 2008, 10, 256–268. [Google Scholar] [CrossRef]
- Kristensen, K.; Westlund, A.H. Accountable business performance measurement for sustainable business excellence. Total Qual. Manag. Bus. Excell. 2004, 15, 629–643. [Google Scholar] [CrossRef]
- Wang, C.J. Do ethical and sustainable practices matter? Int. J. Contemp. Hosp. Manag. 2014, 26. [Google Scholar] [CrossRef]
- Bharadwaj, A.; El Sawy, O.A.; Pavlou, P.A.; Venkatraman, N. Digital business strategy: Toward a next generation of insights. MIS Q. 2013, 37, 471–482. [Google Scholar] [CrossRef]
- Chanias, S.; Myers, M.D.; Hess, T. Digital transformation strategy making in pre-digital organizations: The case of a financial services provider. J. Strateg. Inf. Syst. 2019, 28, 17–33. [Google Scholar] [CrossRef]
- Henfridsson, O.; Mathiassen, L.; Svahn, F. Managing technological change in the digital age: The role of architectural frames. J. Inf. Technol. 2014, 29, 27–43. [Google Scholar] [CrossRef]
- Yoo, Y.; Boland, R.J., Jr.; Lyytinen, K.; Majchrzak, A. Organizing for innovation in the digitized world. Organ. Sci. 2012, 23, 1398–1408. [Google Scholar] [CrossRef]
- Al-Debei, M.M.; Avison, D. Developing a unified framework of the business model concept. Eur. J. Inf. Syst. 2010, 19, 359–376. [Google Scholar] [CrossRef]
- El Sawy, O.A.; Pereira, F. Digital business models: Review and synthesis. Bus. Model. Dyn. Digit. Space 2013, 13–20. [Google Scholar] [CrossRef]
- Timmers, P. Business models for electronic markets. Electron. Mark. 1998, 8, 3–8. [Google Scholar] [CrossRef]
- Morakanyane, R.; Grace, A.A.; O’Reilly, P. Conceptualizing Digital Transformation in Business Organizations: A Systematic Review of Literature. Bled Econf. 2017, 21. Available online: https://aisel.aisnet.org/cgi/viewcontent.cgi?article=1028&context=bled2017 (accessed on 9 April 2021).
- Warner, K.S.; Wäger, M. Building dynamic capabilities for digital transformation: An ongoing process of strategic renewal. Long Range Plan. 2019, 52, 326–349. [Google Scholar] [CrossRef]
- Svahn, F.; Mathiassen, L.; Lindgren, R. Embracing Digital Innovation in Incumbent Firms: How Volvo Cars Managed Competing Concerns. MIS Q. 2017, 41, 239–253. [Google Scholar] [CrossRef]
- Karimi, J.; Walter, Z. The role of dynamic capabilities in responding to digital disruption: A factor-based study of the newspaper industry. J. Manag. Inf. Syst. 2015, 32, 39–81. [Google Scholar] [CrossRef]
- Tumbas, S.; Berente, N.; Seidel, S.; vom Brocke, J. The ‘Digital Façade’of Rapidly Growing Entrepreneurial Organizations. 2015. Available online: https://www.researchgate.net/profile/Jan-Vom-Brocke/publication/286458540_The_%27Digital_Facade%27_of_Rapidly_Growing_Entrepreneurial_Organizations/links/566b1d0008ae1a797e39c5bb/The-Digital-Facade-of-Rapidly-Growing-Entrepreneurial-Organizations.pdf (accessed on 9 April 2021).
- Kane, G.C.; Alavi, M.; Labianca, G.; Borgatti, S.P. What’s different about social media networks? A framework and research agenda. MIS Q. 2014, 38, 275–304. [Google Scholar] [CrossRef] [Green Version]
- Yang, X.; Liu, L.; Davison, R. Reputation Management in Social Commerce Communities. 2012. Available online: https://aisel.aisnet.org/amcis2012/proceedings/AdoptionDiffusionIT/23/ (accessed on 9 April 2021).
- Neumeier, A.; Wolf, T.; Oesterle, S. The Manifold Fruits of Digitalization-Determining the Literal Value Behind. 2017. Available online: https://aisel.aisnet.org/wi2017/track05/paper/5/ (accessed on 9 April 2021).
- Cohen, B.; Kietzmann, J. Ride on! Mobility business models for the sharing economy. Organ. Environ. 2014, 27, 279–296. [Google Scholar] [CrossRef]
- Fjeldstad, Ø.D.; Snow, C.C. Business models and organization design. Long Range Plan. 2018, 51, 32–39. [Google Scholar] [CrossRef]
- Chesbrough, H. Business model innovation: Opportunities and barriers. Long Range Plan. 2010, 43, 354–363. [Google Scholar] [CrossRef]
- Foss, N.J.; Saebi, T. Business models and business model innovation: Between wicked and paradigmatic problems. Long Range Plan. 2018, 51, 9–21. [Google Scholar] [CrossRef]
- Zott, C.; Amit, R. Business model design and the performance of entrepreneurial firms. Organ. Sci. 2007, 18, 181–199. [Google Scholar] [CrossRef] [Green Version]
- Lombardi, R. Knowledge transfer and organizational performance and business process: Past, present and future researches. Business Process. Manag. J. 2019, 25, 2–9. [Google Scholar] [CrossRef] [Green Version]
- Spieth, P.; Schneckenberg, D.; Matzler, K. Exploring the linkage between business model (&) innovation and the firm’s strategy. RD Manag. 2016, 46, 403–413. [Google Scholar]
- Caputo, A.; Marzi, G.; Pellegrini, M.M.; Al-Mashari, M.; Del Giudice, M. The internet of things in manufacturing innovation processes: Development and application of a conceptual framework. Business Process. Manag. J. 2016, 22. [Google Scholar] [CrossRef]
- Saebi, T.; Lien, L.; Foss, N.J. What drives business model adaptation. Long Range Plan. 2016, 50, 567–581. [Google Scholar] [CrossRef] [Green Version]
- Garzella, S.; Fiorentino, R.; Caputo, A.; Lardo, A. Business model innovation in SMEs: The role of boundaries in the digital era. Technol. Anal. Strateg. Manag. 2021, 33, 31–43. [Google Scholar] [CrossRef]
- Child, J.; Hsieh, L.; Elbanna, S.; Karmowska, J.; Marinova, S.; Puthusserry, P.; Zhang, Y. SME international business models: The role of context and experience. J. World Bus. 2017, 52, 664–679. [Google Scholar] [CrossRef] [Green Version]
- Bellman, R. A Markovian decision process. J. Math. Mech. 1957, 6, 679–684. [Google Scholar] [CrossRef]
- Kamoun, F. Rethinking the business model with RFID. Commun. Assoc. Inf. Syst. 2008, 22, 35. [Google Scholar] [CrossRef]
- Yuan, Y.; Zhang, J.J. Towards an appropriate business model for m-commerce. Int. J. Mob. Commun. 2003, 1, 35–56. [Google Scholar] [CrossRef]
- Park, T.Y.A. Study on the Structural Causal Relationship among Dynamic Capabilities, Digital Transformation, Business Model Innovation, and Performance. Ph.D. Thesis, Kumoh National Institute of Technology, Gumi-si, Korea, 2019. [Google Scholar]
- Oderanti, F.O.; Li, F. Commercialization of eHealth innovations in the market of the UK healthcare sector: A framework for a sustainable business model. Psychol. Mark. 2018, 35, 120–137. [Google Scholar] [CrossRef]
- Darroch, J.; Miles, M.P.; Paul, C.W. Corporate venturing and the rent cycle. Technovation 2005, 25, 1437–1442. [Google Scholar] [CrossRef]
- Zahra, S.A. Predictors and financial outcomes of corporate entrepreneurship: An exploratory study. J. Bus. Ventur. 1991, 6, 259–285. [Google Scholar] [CrossRef]
- Garrett, R.P., Jr.; Neubaum, D.O. Top management support and Initial strategic assets: A dependency model for internal corporate venture performance. J. Prod. Innov. Manag. 2013, 30, 896–915. [Google Scholar] [CrossRef]
- Lee, C.S.; Kim, Y.K.; Kim, S.H. A study on the support policy for digital transformation of small businesses. J. Distrib. Sci. 2018, 16, 89–99. [Google Scholar]
- Dooley, L.; Kenny, B.; Cronin, M. Interorganizational innovation across geographic and cognitive boundaries: Does firm size matter? RD Manag. 2016, 46, 227–243. [Google Scholar] [CrossRef]
- Lindgren, P.; Abdullah, M.A. Conceptualizing strategic business model innovation leadership for business survival and business model innovation excellence. J. Multi Bus. Model. Innov. Technol. 2013, 1, 113–131. [Google Scholar]
- Amit, R.; Zott, C. Creating value through business model innovation. MIT Sloan Management Review 36–44. 2012. Available online: http://marketing.mitsmr.com/PDF/STR0715-Top-10-Strategy.pdf#page=38 (accessed on 16 April 2021).
- Teece, D.J. Business models, business strategy and innovation. Long Range Plan. 2010, 43, 172–194. [Google Scholar] [CrossRef]
- Amit, R.; Zott, C. Value creation in e-business. Strateg. Manag. J. 2001, 22, 493–520. [Google Scholar] [CrossRef]
- Cavalcante, S.A. Designing business model change. Int. J. Innov. Manag. 2014, 18, 1450018. [Google Scholar] [CrossRef]
- Zahra, S.A.; Wright, M.; Abdelgawad, S.G. Contextualization and the advancement of entrepreneurship research. Int. Small Bus. J. 2014, 32, 479–500. [Google Scholar] [CrossRef]
- Foss, N.J.; Saebi, T. Fifteen years of research on business model innovation: How far have we come, and where should we go? J. Manag. 2017, 43, 200–227. [Google Scholar] [CrossRef] [Green Version]
- Asemokha, A.; Musona, J.; Torkkeli, L.; Saarenketo, S. Business model innovation and entrepreneurial orientation relationships in SMEs: Implications for international performance. J. Int. Entrep. 2019, 17, 425–453. [Google Scholar] [CrossRef] [Green Version]
- Porter’s, V.C.M. What Is Value Chain. 1985. Available online: http://www.dspmuranchi.ac.in/pdf/Blog/What%20is%20the%20First%20Mover%20Advantage.pdf (accessed on 16 April 2021).
- Wernerfelt, B. A resource-based view of the firm. Strateg. Manag. J. 1984, 5, 171–180. [Google Scholar] [CrossRef]
- Doz, Y.L.; Hamel, G. Alliance Advantage: The Art of Creating Value through Partnering; Harvard Business Press: Brighton, MA, USA, 1998. [Google Scholar]
- Gulati, R.; Nohria, N.; Zaheer, A. Strategic networks. Strateg. Manag. J. 2000, 21, 203–215. [Google Scholar] [CrossRef]
- Katz, M.L.; Shapiro, C. Network externalities, competition, and compatibility. Am. Econ. Rev. 1985, 75, 424–440. [Google Scholar]
- Schumpeter, J.A.; Nichol, A.J. Robinson’s economics of imperfect competition. J. Political Econ. 1934, 42, 249–259. [Google Scholar] [CrossRef]
- Schumpeter, J. Creative destruction. Capital. Social. Democr. 1942, 825, 82–85. [Google Scholar]
- Miles, R.E.; Snow, C.C.; Meyer, A.D.; Coleman, H.J., Jr. Organizational strategy, structure, and process. Acad. Manag. Rev. 1978, 3, 546–562. [Google Scholar] [CrossRef]
- Miles, R.E.; Snow, C.C. Organizations: New concepts for new forms. Calif. Manag. Rev. 1986, 28, 62–73. [Google Scholar] [CrossRef]
- Donaldson, L. Strategy and structural adjustment to regain fit and performance: In defence of contingency theory. J. Manag. Stud. 1987, 24, 1–24. [Google Scholar] [CrossRef]
- Miller, D. The generic strategy trap. J. Bus. Strategy 1992, 13, 37–41. [Google Scholar] [CrossRef]
- Hawawini, G.; Subramanian, V.; Verdin, P. Is performance driven by industry-or firm-specific factors? A new look at the evidence. Strateg. Manag. J. 2003, 24, 1–16. [Google Scholar] [CrossRef] [Green Version]
- McGahan, A.M.; Porter, M.E. What do we know about variance in accounting profitability? Manag. Sci. 2002, 48, 834–851. [Google Scholar] [CrossRef]
- Rumelt, R.P. How much does industry matter? Strateg. Manag. J. 1991, 12, 167–185. [Google Scholar] [CrossRef]
- Bahri, Y.; Kadmon, J.; Pennington, J.; Schoenholz, S.S.; Sohl-Dickstein, J.; Ganguli, S. Statistical mechanics of deep learning. Ann. Rev. Condens. Matter Phys. 2020, 11, 501–528. [Google Scholar] [CrossRef] [Green Version]
- Zott, C.; Amit, R. The fit between product market strategy and business model: Implications for firm performance. Strateg. Manag. J. 2008, 29, 1–26. [Google Scholar] [CrossRef] [Green Version]
- Kulins, C.; Leonardy, H.; Weber, C. A configurational approach in business model design. J. Bus. Res. 2016, 69, 1437–1441. [Google Scholar] [CrossRef]
- Casadesus-Masanell, R.; Zhu, F. Business model innovation and competitive imitation: The case of sponsor-based business models. Strateg. Manag. J. 2013, 34, 464–482. [Google Scholar] [CrossRef] [Green Version]
- Hacklin, F.; Björkdahl, J.; Wallin, M.W. Strategies for business model innovation: How firms reel in migrating value. Long Range Plan. 2018, 51, 82–110. [Google Scholar] [CrossRef]
- Campanella, P.; Lovato, E.; Marone, C.; Fallacara, L.; Mancuso, A.; Ricciardi, W.; Specchia, M.L. The impact of electronic health records on healthcare quality: A systematic review and meta-analysis. Eur. J. Public Health 2016, 26, 60–64. [Google Scholar] [CrossRef] [PubMed] [Green Version]
- Velu, C. Business model innovation and third-party alliance on the survival of new firms. Technovation 2015, 35, 1–11. [Google Scholar] [CrossRef] [Green Version]
- Nascimento, A.M.; Bellini, C.G.P. Artificial intelligence and industry 4.0: The next frontier in organizations. Bar-Braz. Adm. Rev. 2018, 15. [Google Scholar] [CrossRef] [Green Version]
- Rajput, S.; Singh, S.P. Connecting circular economy and industry 4.0. Int. J. Inf. Manag. 2019, 49, 98–113. [Google Scholar] [CrossRef]
- Bucherer, E.; Eisert, U.; Gassmann, O. Towards systematic business model innovation: Lessons from product innovation management. Creat. Innov. Manag. 2012, 21, 183–198. [Google Scholar] [CrossRef]
- Morris, M.; Schindehutte, M.; Allen, J. The entrepreneur’s business model: Toward a unified perspective. J. Bus. Res. 2005, 58, 726–735. [Google Scholar] [CrossRef]
- Demil, B.; Lecocq, X. Business model evolution: In search of dynamic consistency. Long Range Plan. 2010, 43, 227–246. [Google Scholar] [CrossRef]
- Doz, Y.L.; Kosonen, M. Embedding strategic agility: A leadership agenda for accelerating business model renewal. Long Range Plan. 2010, 43, 370–382. [Google Scholar] [CrossRef]
- Khanagha, S.; Volberda, H.; Oshri, I. Business model renewal and ambidexterity: Structural alteration and strategy formation process during transition to a Cloud business model. RD Manag. 2014, 44, 322–340. [Google Scholar] [CrossRef]
- Santos, J.; Spector, B.; Van der Heyden, L. Toward a Theory of Business Model Innovation within Incumbent Firms; INSEAD: Fontainebleau, France, 2009. [Google Scholar]
- Osterwalder, A.; Pigneur, Y.; Tucci, C.L. Clarifying business models: Origins, present, and future of the concept. Commun. Assoc. Inf. Syst. 2005, 16, 1. [Google Scholar] [CrossRef] [Green Version]
- Johnson, M.W.; Christensen, C.M.; Kagermann, H. Reinventing your business model. Harv. Bus. Rev. 2008, 86, 57–68. [Google Scholar]
- Bock, A.J.; Opsahl, T.; George, G.; Gann, D.M. The effects of culture and structure on strategic flexibility during business model innovation. J. Manag. Stud. 2012, 49, 279–305. [Google Scholar] [CrossRef]
- Achtenhagen, L.; Melin, L.; Naldi, L. Dynamics of business models–strategizing, critical capabilities and activities for sustained value creation. Long Range Plan. 2013, 46, 427–442. [Google Scholar] [CrossRef] [Green Version]
- Niosi, J.; McKelvey, M. Relating business model innovations and innovation cascades: The case of biotechnology. J. Evol. Econ. 2018, 28, 1081–1109. [Google Scholar] [CrossRef] [Green Version]
- Kranz, J.J.; Hanelt, A.; Kolbe, L.M. Understanding the influence of absorptive capacity and ambidexterity on the process of business model change–the case of on-premise and cloud-computing software. Inf. Syst. J. 2016, 26, 477–517. [Google Scholar] [CrossRef]
- Climent, R.C.; Haftor, D.M. Value creation through the evolution of business model themes. J. Bus. Res. 2021, 122, 353–361. [Google Scholar] [CrossRef]
- Jeon, S.Y. Study on the Effects of SME Managers’ Entrepreneurship and CEO Capabilities on Corporate Sustainability via Improved Management Performance. Ph.D. Thesis, Koyonggi University, Seoul, Korea, 2018. [Google Scholar]
- Kim, K.C. The Effects of Social Enterprise Characteristics and CEO’s Management Capability on Business Performance. Ph.D. Thesis, Gachon University, Seongnam-si, Korea, 2017. [Google Scholar]
- Zhu, X.J. A Study on the Influence of Technological Innovation Capability and Technology Commercialization Capability on Technological Innovation Performance and Management Performance. Ph.D. Thesis, Gachon University, Gyeonggi-do, Korea, 2013. [Google Scholar]
- Yoon, J.H. A Study on the Influence of Business Performance on Customer Orientation and Technology Capability of SMEs and Venture Business in Electric Power. Ph.D. Thesis, Konkuk University, Seoul, Korea, 2018. [Google Scholar]
- Hwang, W.S.; Choi, H.; Shin, J. A mediating role of innovation capability between entrepreneurial competencies and competitive advantage. Technol. Anal. Strateg. Manag. 2020, 32, 1–14. [Google Scholar] [CrossRef]
- Kim, J.; Cho, J.; Lee, S. The Influence of Entrepreneurial Competences on Corporate Performance of Technology-based Start-ups. J. Ind. Manag. Syst. 2020, 43, 132–142. [Google Scholar] [CrossRef]
- Prohorovs, A.; Bistrova, J.; Ten, D. Startup Success Factors in the Capital Attraction Stage: Founders’ Perspective. J. East West Bus. 2019, 25, 26–51. [Google Scholar] [CrossRef]
- Pauceanu, A.M.; Alpenidze, O.; Edu, T.; Zaharia, R.M. What determinants influence students to start their own business? Empirical evidence from United Arab Emirates Universities. Sustainability 2019, 11, 92. [Google Scholar] [CrossRef] [Green Version]
- Seo, Y.W.; Lee, Y.H. Effects of internal and external factors on business performance of startups in South Korea: The engine of new market dynamics. Int. J. Eng. Bus. Manag. 2019, 11, 1847979018824231. [Google Scholar] [CrossRef] [Green Version]
- Park, H.G.; Yang, D.W. An Empirical Study on the Effect of the Technological Commercialization Ability of the Initial Entrepreneurship on Management Performance: Focusing on the Moderating Effect of Technology Entrepreneurs in Manufacturing Industries. J. Korean Entrep. Soc. 2018, 1, 14. [Google Scholar]
- Bae, H.B.; Song, M.K.; Kim, S.G. A study on the effect of competency of technology startup companies using ETRI technology on management performance. Ventur. Entrep. Res. 2018, 13, 61–72. [Google Scholar]
- Kim, Y.K.; Park, S.T. Effects of Absorptive Capacity on Technology Innovation and Commercialization Capacities and Management Performance. J. Korea Converg. Soc. 2018, 9, 217–225. [Google Scholar]
- Lee, I.K. An Empirical Study on the Effect of SME CEO Technology Competency on Management Performance. Ph.D. Thesis, Hoseo University, Seoul, Korea, 2017. [Google Scholar]
- Miller, P.; Power, M. Calculating corporate failure. In Professional Competition and Professional Power; Routledge: London, UK, 2005; pp. 65–90. [Google Scholar]
- Clugston, C.O. High-Tech demands own new-product plan. Electron. News 1995, 41, 33–36. [Google Scholar]
- Kaplan, R.S.; Norton, D.P. Linking the balanced scorecard to strategy. Calif. Manag. Rev. 1996, 39, 53–79. [Google Scholar] [CrossRef]
- Englis, P.D.; Wakkee, I.; Van Der Sijde, P. Knowledge and networks in the global startup process. Int. J. Knowl. Manag. Stud. 2007, 1, 497–514. [Google Scholar] [CrossRef]
- Kim, I.H. An Empirical Study on the Impact of Network and Marketing Competencies on Business Performance. Master’s Thesis, Hoseo University, Seoul, Korea, 2016. [Google Scholar]
- Kim, J.Y.; Bang, H.Y. The Effects of Environmental Uncertainty on the Impact Strategy and Performance of Korean, US, and Japanese Firms: Focusing on Environmental Uncertainty in the Competition Sector. Korean J. Trade Commer. 2017, 17, 135–156. [Google Scholar]
- Hwang, D.S. The Effect of Technology Entrepreneurs’ strategic orientation and network capabilities on new product development performance and corporate performance. Master’s Thesis, Hanbat University, Daejeon, Korea, 2017. [Google Scholar]
- De Franco, G.; Hope, O.K.; Lu, H. Managerial ability and bank-loan pricing. J. Bus. Financ. Account. 2017, 44, 1315–1337. [Google Scholar]
- Chandler, G.N.; Jansen, E. The founder’s self-assessed competence and venture performance. J. Bus. Ventur. 1992, 7, 223–236. [Google Scholar] [CrossRef]
- Chandler, G.N.; Hanks, S.H. Market attractiveness, resource-based capabilities, venture strategies, and venture performance. J. Bus. Ventur. 1994, 9, 331–349. [Google Scholar] [CrossRef]
- Burgelman, R.A.; Sayles, L.R. Transforming invention into innovation: The conceptualization stage. In Strategic Management of Technology and Innovation; McGraw-Hill: Boston, MA, USA, 2004; pp. 682–690. [Google Scholar]
- Johannisson, B. Network strategies: Management technology for entrepreneurship and change. Int. Small Bus. J. 1986, 5, 19–30. [Google Scholar] [CrossRef]
- Cho, K.Y. A Study on Factors of Technology Innovation Competency and Technology Management Activity Affecting the Management Performance. Ph.D. Thesis, Korea Polytechnic University, Siheung-si, Korea, 2017. [Google Scholar]
- Yam, R.C.; Guan, J.C.; Pun, K.F.; Tang, E.P. An audit of technological innovation capabilities in Chinese firms: Some empirical findings in Beijing, China. Res. Policy 2004, 33, 1123–1140. [Google Scholar] [CrossRef]
- Burgelman, R.A.; Christensen, C.M.; Wheelwright, S.C. Strategic Management of Technology and Innovation; McGraw-Hill/Irwin: Boston, MA, USA, 2008. [Google Scholar]
- Saunila, M. Innovation capability in achieving higher performance: Perspectives of management and employees. Technol. Anal. Strateg. Manag. 2017, 29, 903–916. [Google Scholar] [CrossRef]
- Andreou, P.C.; Karasamani, I.; Louca, C.; Ehrlich, D. The impact of managerial ability on crisis-period corporate investment. J. Bus. Res. 2017, 79, 107–122. [Google Scholar] [CrossRef]
- García-Muiña, F.E.; Navas-López, J.E. Explaining and measuring success in new business: The effect of technological capabilities on firm results. Technovation 2007, 27, 30–46. [Google Scholar] [CrossRef]
- Guan, J.; Ma, N. Innovative capability and export performance of Chinese firms. Technovation 2003, 23, 737–747. [Google Scholar] [CrossRef]
- Zou, S.; Fang, E.; Zhao, S. The effect of export marketing capabilities on export performance: An investigation of Chinese exporters. J. Int. Mark. 2003, 11, 32–55. [Google Scholar] [CrossRef]
- Barney, J. Firm resources and sustained competitive advantage. J. Manag. 1991, 17, 99–120. [Google Scholar] [CrossRef]
- Brown, D.M.; Laverick, S. Measuring corporate performance. Long Range Plan. 1994, 27, 89–98. [Google Scholar] [CrossRef]
- Metcalfe, J.S. Technology systems and technology policy in an evolutionary framework. Camb. J. Econ. 1995, 19, 25–46. [Google Scholar]
- Burgelman, R.A. Comparative Studies of Technological Evolution; Emerald Group Publishing Limited: Bingley, UK, 2009. [Google Scholar]
- Coombs, J.E.; Bierly, P.E., III. Measuring technological capability and performance. RD Manag. 2006, 36, 421–438. [Google Scholar] [CrossRef]
- Planko, J.; Cramer, J.; Hekkert, M.P.; Chappin, M.M. Combining the technological innovation systems framework with the entrepreneurs’ perspective on innovation. Technol. Anal. Strateg. Manag. 2017, 29, 614–625. [Google Scholar] [CrossRef] [Green Version]
- Acs, Z.J.; Audretsch, D.B. Innovation in large and small firms: An empirical analysis. Am. Econ. Rev. 1988, 78, 678–690. [Google Scholar]
- Lall, S. Technological capabilities and industrialization. World Dev. 1992, 20, 165–186. [Google Scholar] [CrossRef]
- Romijn, H.; Albaladejo, M. Determinants of innovation capability in small electronics and software firms in southeast England. Res. Policy 2002, 31, 1053–1067. [Google Scholar] [CrossRef]
- Hadjimanolis, A. A resource-based view of innovativeness in small firms. Technol. Anal. Strateg. Manag. 2000, 12, 263–281. [Google Scholar] [CrossRef]
- Schoenecker, T.; Swanson, L. Indicators of firm technological capability: Validity and performance implications. IEEE Trans. Eng. Manag. 2002, 49, 36–44. [Google Scholar] [CrossRef]
- Teece, D.J.; Pisano, G.; Shuen, A. Dynamic capabilities and strategic management. Strateg. Manag. J. 1997, 18, 509–533. [Google Scholar] [CrossRef]
- Stuart, R.; Abetti, P.A. Startup ventures: Towards the prediction of initial success. J. Bus. Ventur. 1987, 2, 215–230. [Google Scholar] [CrossRef]
- Tsai, K.H. Collaborative networks and product innovation performance: Toward a contingency perspective. Res. Policy 2009, 38, 765–778. [Google Scholar] [CrossRef]
- Jolly, R. Human development: The world after Copenhagen. Glob. Gov. Rev. Multilater. Int. Organ. 1997, 3, 233–248. [Google Scholar] [CrossRef]
- Gumbus, A.; Lussier, R.N. Entrepreneurs use a balanced scorecard to translate strategy into performance measures. J. Small Bus. Manag. 2006, 44, 407–425. [Google Scholar] [CrossRef]
- Hvolby, H.H.; Thorstenson, A. Indicators for performance measurement in small and medium-sized enterprises. Proc. Inst. Mech. Eng. Part B J. Eng. Manuf. 2001, 215, 1143–1146. [Google Scholar] [CrossRef]
- Melville, N.; Kraemer, K.; Gurbaxani, V. Information technology and organizational performance: An integrative model of IT business value. MIS Q. 2004, 28, 283–322. [Google Scholar] [CrossRef] [Green Version]
- Spencer, H.L. Spenser Studies: A Renaissance Poetry Annual VIII. 1993. Available online: https://www.jstor.org/stable/518454 (accessed on 22 April 2021).
Figure 1.
The research model.

Figure 2.
The structural model verification results.

Figure 3.
Comparison of the total effect of the variables that influenced the technical performance (TP) and financial performance (FP) according to industry division.
Figure 3.
Comparison of the total effect of the variables that influenced the technical performance (TP) and financial performance (FP) according to industry division.


Table 1.
Research framework comparison and differences relative to previous studies.
| Previous Research | Independent Variable | Mediating Variable | Dependent Variable |
|---|---|---|---|
| [91] | Management ability, network ability | Financial performance, nonfinancial performance | Sustainable growth |
| [92] | Management ability | Financial performance | |
| [95] | Technical expertise, management skills | R&D capability, complementary capability | Competitive advantage |
| [96] | Entrepreneurship, technical capability | Corporate competence | Corporate performance |
| [97] | Management skills, specialized education and skills, founder’s previous experience direct communication, managerial support, financial potential | Management performance | |
| [98,102] | Entrepreneurial competencies | Business performance | |
| [103,104,105,106,107,108] | Technology innovation competencies, technology commercialization competencies | Technical performance, management performance | |
| [100] | Technology innovation competencies | Commercialization performance, management performance | |
| [109] | The technical ability of the CEO | The technical ability of the company | Technical performance, management performance |
| [99,110,111] | Network ability, marketing ability | Management performance, technology innovation competencies, innovation performance | |
| [111] | Network ability | Technology innovation competencies | Technical performance |
| This Research | Management ability | Technology innovation competency | Technical performance |
| Technical ability | Technology marketing competency | Financial performance | |
| Proposition 1 | Independent variable → | Mediating variable | |
| Proposition 2 | Mediating variable → | Dependent variable | |
| Proposition 3 | Independent variable → | Dependent variable |
Table 2.
Characteristics of the demographical dataset.
| Frequency | Percent | ||
|---|---|---|---|
| Business type | Private business | 124 | 60.5 |
| Corporate business | 81 | 39.5 | |
| Industry sector | Electrics/electronics | 38 | 18.5 |
| Machinery/parts | 30 | 14.6 | |
| IT/SW | 36 | 17.6 | |
| Chemicals/fibers/materials | 36 | 17.6 | |
| Life industry/food | 26 | 12.7 | |
| Craft/others | 39 | 19 | |
| Years in operation | Under 1 year | 15 | 7.3 |
| 1–2 years | 66 | 32.2 | |
| 2–3 years | 66 | 32.2 | |
| 3–5 years | 48 | 23.4 | |
| More than 5 years | 10 | 4.9 | |
| Sales volume (USD) | Less than $0.1 million | 72 | 35.1 |
| $0.1–0.3 million | 66 | 32.2 | |
| $0.3–0.5 million | 45 | 22 | |
| $0.5–1 million | 19 | 9.3 | |
| More than $1 million | 3 | 1.5 | |
| Manufacturing | Outsourcing | 47 | 22.9 |
| Outsourcing and in-house | 127 | 62 | |
| In-house | 31 | 15.1 | |
| Employees | Fewer than three people | 95 | 46.3 |
| 3–5 people | 80 | 39 | |
| 6–9 people | 28 | 13.7 | |
| More than 10 people | 2 | 1 | |
| Gender | Male | 137 | 66.8 |
| Female | 68 | 33.2 | |
| CEO’s age (years) | 20 s | 18 | 8.8 |
| 30 s | 82 | 40 | |
| 40 s | 79 | 38.5 | |
| 50 or over | 26 | 12.7 | |
Table 3.
Definitions of variables used in this study.
| Category | Operational Definition | References | |
|---|---|---|---|
| Independent variables | Management ability | Leadership, network, management, creativity | [107,108,109,114,115] |
| Technical ability | Company’s technology development ability and degree of originality | [105,116,117,118,119] | |
| Mediating variables | Technology innovation competency | Management system for efficient technological innovation | [105,111,120,121,122,123,124,125,126,127,128,129] |
| Technology marketing competency | Marketing of products developed using the latest technology | [99,100,130] | |
| Dependent variables | Technical performance | Derivative effect on the technology area and technology competitiveness compared to competitors | [123,131,132] |
| Financial performance | Increase in operating profit ratio, increase in market share, increase in assets | [101,133,134,135,136,137] | |
Table 4.
The reliability and validity of the constructs.
| Variables | Criterion | Internal Consistency Reliability | Convergent Validity | Discriminant Validity | ||
|---|---|---|---|---|---|---|
| Cronbach’s α | rho_A | Composite Reliability (C.R) | Average Variance Extracts (AVE) | Fornell–Larcker | ||
| 0.5 | >0.7 | 0.5~ | >0.5 | |||
| FP | 0.908 | 0.910 | 0.942 | 0.845 | Yes | |
| EMA | 0.817 | 0.861 | 0.891 | 0.732 | Yes | |
| TP | 0.863 | 0.865 | 0.901 | 0.646 | Yes | |
| ETA | 0.915 | 0.916 | 0.934 | 0.704 | Yes | |
| TIC | 0.845 | 0.859 | 0.896 | 0.682 | Yes | |
| TMC | 0.950 | 0.951 | 0.957 | 0.667 | Yes | |
FP: Financial Performance, EMA: Entrepreneurial Management Ability, TP: Technical Performance, ETA: Entrepreneurial Technological Ability, TIC: Technology Innovation Competency TMC: Technology Marketing Competency.
Table 5.
Discriminant validity (Fornell–Larcker criterion).
| Variables | FP | EMA | TP | ETA | TIC | TMC |
|---|---|---|---|---|---|---|
| FP | 0.919 | |||||
| EMA | 0.709 | 0.856 | ||||
| TP | 0.818 | 0.821 | 0.804 | |||
| ETA | 0.777 | 0.793 | 0.906 | 0.839 | ||
| TIC | 0.865 | 0.731 | 0.833 | 0.798 | 0.826 | |
| TMC | 0.841 | 0.736 | 0.857 | 0.819 | 0.797 | 0.817 |
FP: Financial Performance, EMA: Entrepreneurial Management Ability, TP: Technical Performance, ETA: Entrepreneurial Technological Ability, TIC: Technology Innovation Competency TMC: Technology Marketing Competency.
Table 6.
Inner variance inflation factor (VIF).
| Variables | FP | TP | TIC | TMC |
|---|---|---|---|---|
| EMA | 2.973 | 2.973 | 2.691 | 2.691 |
| ET | 4.381 | 4.381 | 2.691 | 2.691 |
| TIC | 3.444 | 3.444 | ||
| TMC | 3.757 | 3.757 |
FP: Financial Performance, TP: Technical Performance, TIC: Technology Innovation Competency TMC: Technology Marketing Competency.
Table 7.
Path coefficient and effect verification.
| Hypothesis | Path | Path Coefficient | Total Indirect Effect | Total Effect | ||||
|---|---|---|---|---|---|---|---|---|
| T-Statistic | p-Value | T-Statistic | p-Value | T-Statistic | p-Value | |||
| Proposition 1 | H1 (Accept) | EMA → TIC | 2.756 | 0.006 | 2.756 | 0.006 | ||
| H2 (Accept) | EMA → TMC | 2.314 | 0.021 | 2.314 | 0.021 | |||
| H3 (Accept) | ETA → TIC | 5.932 | 0.000 | 5.932 | 0.000 | |||
| H4 (Accept) | ETA → TMC | 6.453 | 0.000 | 6.453 | 0.000 | |||
| Proposition 2 | H5 (Accept) | TIC → FP | 5.421 | 0.000 | 5.421 | 0.000 | ||
| H6 (Accept) | TIC → TP | 2.139 | 0.033 | 2.139 | 0.033 | |||
| H7 (Accept) | TMC → FP | 4.225 | 0.000 | 4.225 | 0.000 | |||
| H8 (Accept) | TMC → TP | 2.908 | 0.004 | 2.908 | 0.004 | |||
| Proposition 3 | H9 (Reject) | EMA → FP | 0.282 | 0.778 | 2.708 | 0.007 | 3.327 | 0.001 |
| H10 (Accept) | EMA → TP | 2.952 | 0.003 | 2.164 | 0.031 | 4.804 | 0.000 | |
| H11 (Reject) | ETA → FP | 0.278 | 0.781 | 6.251 | 0.000 | 7.129 | 0.000 | |
| H12 (Accept) | ETA → TP | 5.227 | 0.000 | 4.523 | 0.000 | 11.938 | 0.000 | |
FP: Financial Performance, EMA: Entrepreneurial Management Ability, TP: Technical Performance, ETA: Entrepreneurial Technological Ability, TIC: Technology Innovation Competency TMC: Technology Marketing Competency.
Table 8.
Special indirect effect.
| Indirect Path | T-Statistic | p-Value |
|---|---|---|
| ETA → TMC → TP | 2.574 | 0.010 |
| ETA → TIC → FP | 4.043 | 0.000 |
| EMA → TMC → FP | 1.994 | 0.047 |
| ETA → TIC → TP | 2.164 | 0.031 |
| EMA → TIC → FP | 2.409 | 0.016 |
| ETA → TMC → FP | 3.196 | 0.001 |
FP: Financial Performance, EMA: Entrepreneurial Management Ability, TP: Technical Performance, ETA: Entrepreneurial Technological Ability, TIC: Technology Innovation Competency TMC: Technology Marketing Competency.
Table 9.
Adjusted R2.
| Variables | Adjusted R2 | T-Statistic | p-Value |
|---|---|---|---|
| FP | 0.808 | 33.663 | 0.000 |
| TP | 0.882 | 51.620 | 0.000 |
| TIC | 0.659 | 14.580 | 0.000 |
| TMC | 0.687 | 18.300 | 0.000 |
FP: Financial Performance, TP: Technical Performance, TIC: Technology Innovation Competency TMC: Technology Marketing Competency.
Table 10.
Effect size (f2).
| Dependent Variables | Mediating Variables | |||
|---|---|---|---|---|
| FP | TP | TIC | TMC | |
| EMA | 0.001 | 0.094 | 0.078 | 0.066 |
| ETA | 0.001 | 0.394 | 0.379 | 0.481 |
| TIC | 0.407 | 0.065 | ||
| TMC | 0.214 | 0.123 | ||
EMA: Entrepreneurial Management Ability, ETA: Entrepreneurial Technological Ability, TIC: Technology Innovation Competency TMC: Technology Marketing Competency.
Table 11.
Comparison of the total effect of the variables that influenced the technical performance (TP) and financial performance (FP) according to industry division.
Table 11.
Comparison of the total effect of the variables that influenced the technical performance (TP) and financial performance (FP) according to industry division.
| Comparison | Variables | FP | TP |
|---|---|---|---|
| Overall | EMA | 0.001 | 0.094 |
| ETA | 0.001 | 0.394 | |
| TIC | 0.407 | 0.065 | |
| TMC | 0.214 | 0.123 | |
| Division 1 (DIV 1) | EMA | 0.000 | 0.028 |
| ETA | 0.011 | 0.899 | |
| TIC | 0.845 | 0.108 | |
| TMC | 0.369 | 0.173 | |
| Division 2 (DIV 2) | EMA | 0.015 | 0.025 |
| ETA | 0.215 | 0.597 | |
| TIC | 0.457 | 0.077 | |
| TMC | 0.371 | 0.049 | |
| Division 3 (DIV 3) | EMA | 0.120 | 0.451 |
| ETA | 0.237 | 2.653 | |
| TIC | 0.359 | 0.000 | |
| TMC | 0.015 | 0.215 | |
| Division 4 (DIV 4) | EMA | 0.242 | 1.600 |
| ETA | 0.247 | 0.000 | |
| TIC | 0.504 | 0.981 | |
| TMC | 0.240 | 0.003 | |
| Division 5 (DIV 5) | EMA | 0.269 | 0.416 |
| ETA | 0.092 | 0.000 | |
| TIC | 0.000 | 0.188 | |
| TMC | 0.074 | 0.288 | |
| Division 6 (DIV 6) | EMA | 0.082 | 0.046 |
| ETA | 0.012 | 0.544 | |
| TIC | 0.407 | 0.019 | |
| TMC | 0.102 | 0.441 |
FP: Financial Performance, EMA: Entrepreneurial Management Ability, TP: Technical Performance, ETA: Entrepreneurial Technological Ability, TIC: Technology Innovation Competency TMC: Technology Marketing Competency. Overall: Sum of Dvision 1 to Division 6, Division 1: electrics/electronics, Division 2: machinery/parts, Division 3: IT/S Division 4: chemicals/textiles/materials, Division 5: life/food, Division 6: crafts/others.
Publisher’s Note: MDPI stays neutral with regard to jurisdictional claims in published maps and institutional affiliations. |
© 2021 by the author. Licensee MDPI, Basel, Switzerland. This article is an open access article distributed under the terms and conditions of the Creative Commons Attribution (CC BY) license (https://creativecommons.org/licenses/by/4.0/).
Share and Cite
MDPI and ACS Style
KIM, S.-S. Sustainable Growth Variables by Industry Sectors and Their Influence on Changes in Business Models of SMEs in the Era of Digital Transformation. Sustainability 2021, 13, 7114. https://doi.org/10.3390/su13137114
AMA Style
KIM S-S. Sustainable Growth Variables by Industry Sectors and Their Influence on Changes in Business Models of SMEs in the Era of Digital Transformation. Sustainability. 2021; 13(13):7114. https://doi.org/10.3390/su13137114
Chicago/Turabian StyleKIM, Seok-Soo. 2021. "Sustainable Growth Variables by Industry Sectors and Their Influence on Changes in Business Models of SMEs in the Era of Digital Transformation" Sustainability 13, no. 13: 7114. https://doi.org/10.3390/su13137114
Note that from the first issue of 2016, this journal uses article numbers instead of page numbers. See further details here.