
Knowledge Management and Sustainable Balanced Scorecard: Practical Application to a Service SME


1
Curso de Engenharia de Produção—CPTL, Universidade Federal de Mato Grosso do Sul, Três Lagoas 79602-070, Brazil
2
Departamento de Organización de Empresas y Comercialización e Investigación de Mercado, Universidad de Valladolid, 47011 Valladolid, Spain
*
Author to whom correspondence should be addressed.
Sustainability 2021, 13(13), 7118; https://doi.org/10.3390/su13137118
Submission received: 21 May 2021
/
Revised: 15 June 2021
/
Accepted: 22 June 2021
/
Published: 24 June 2021
Abstract
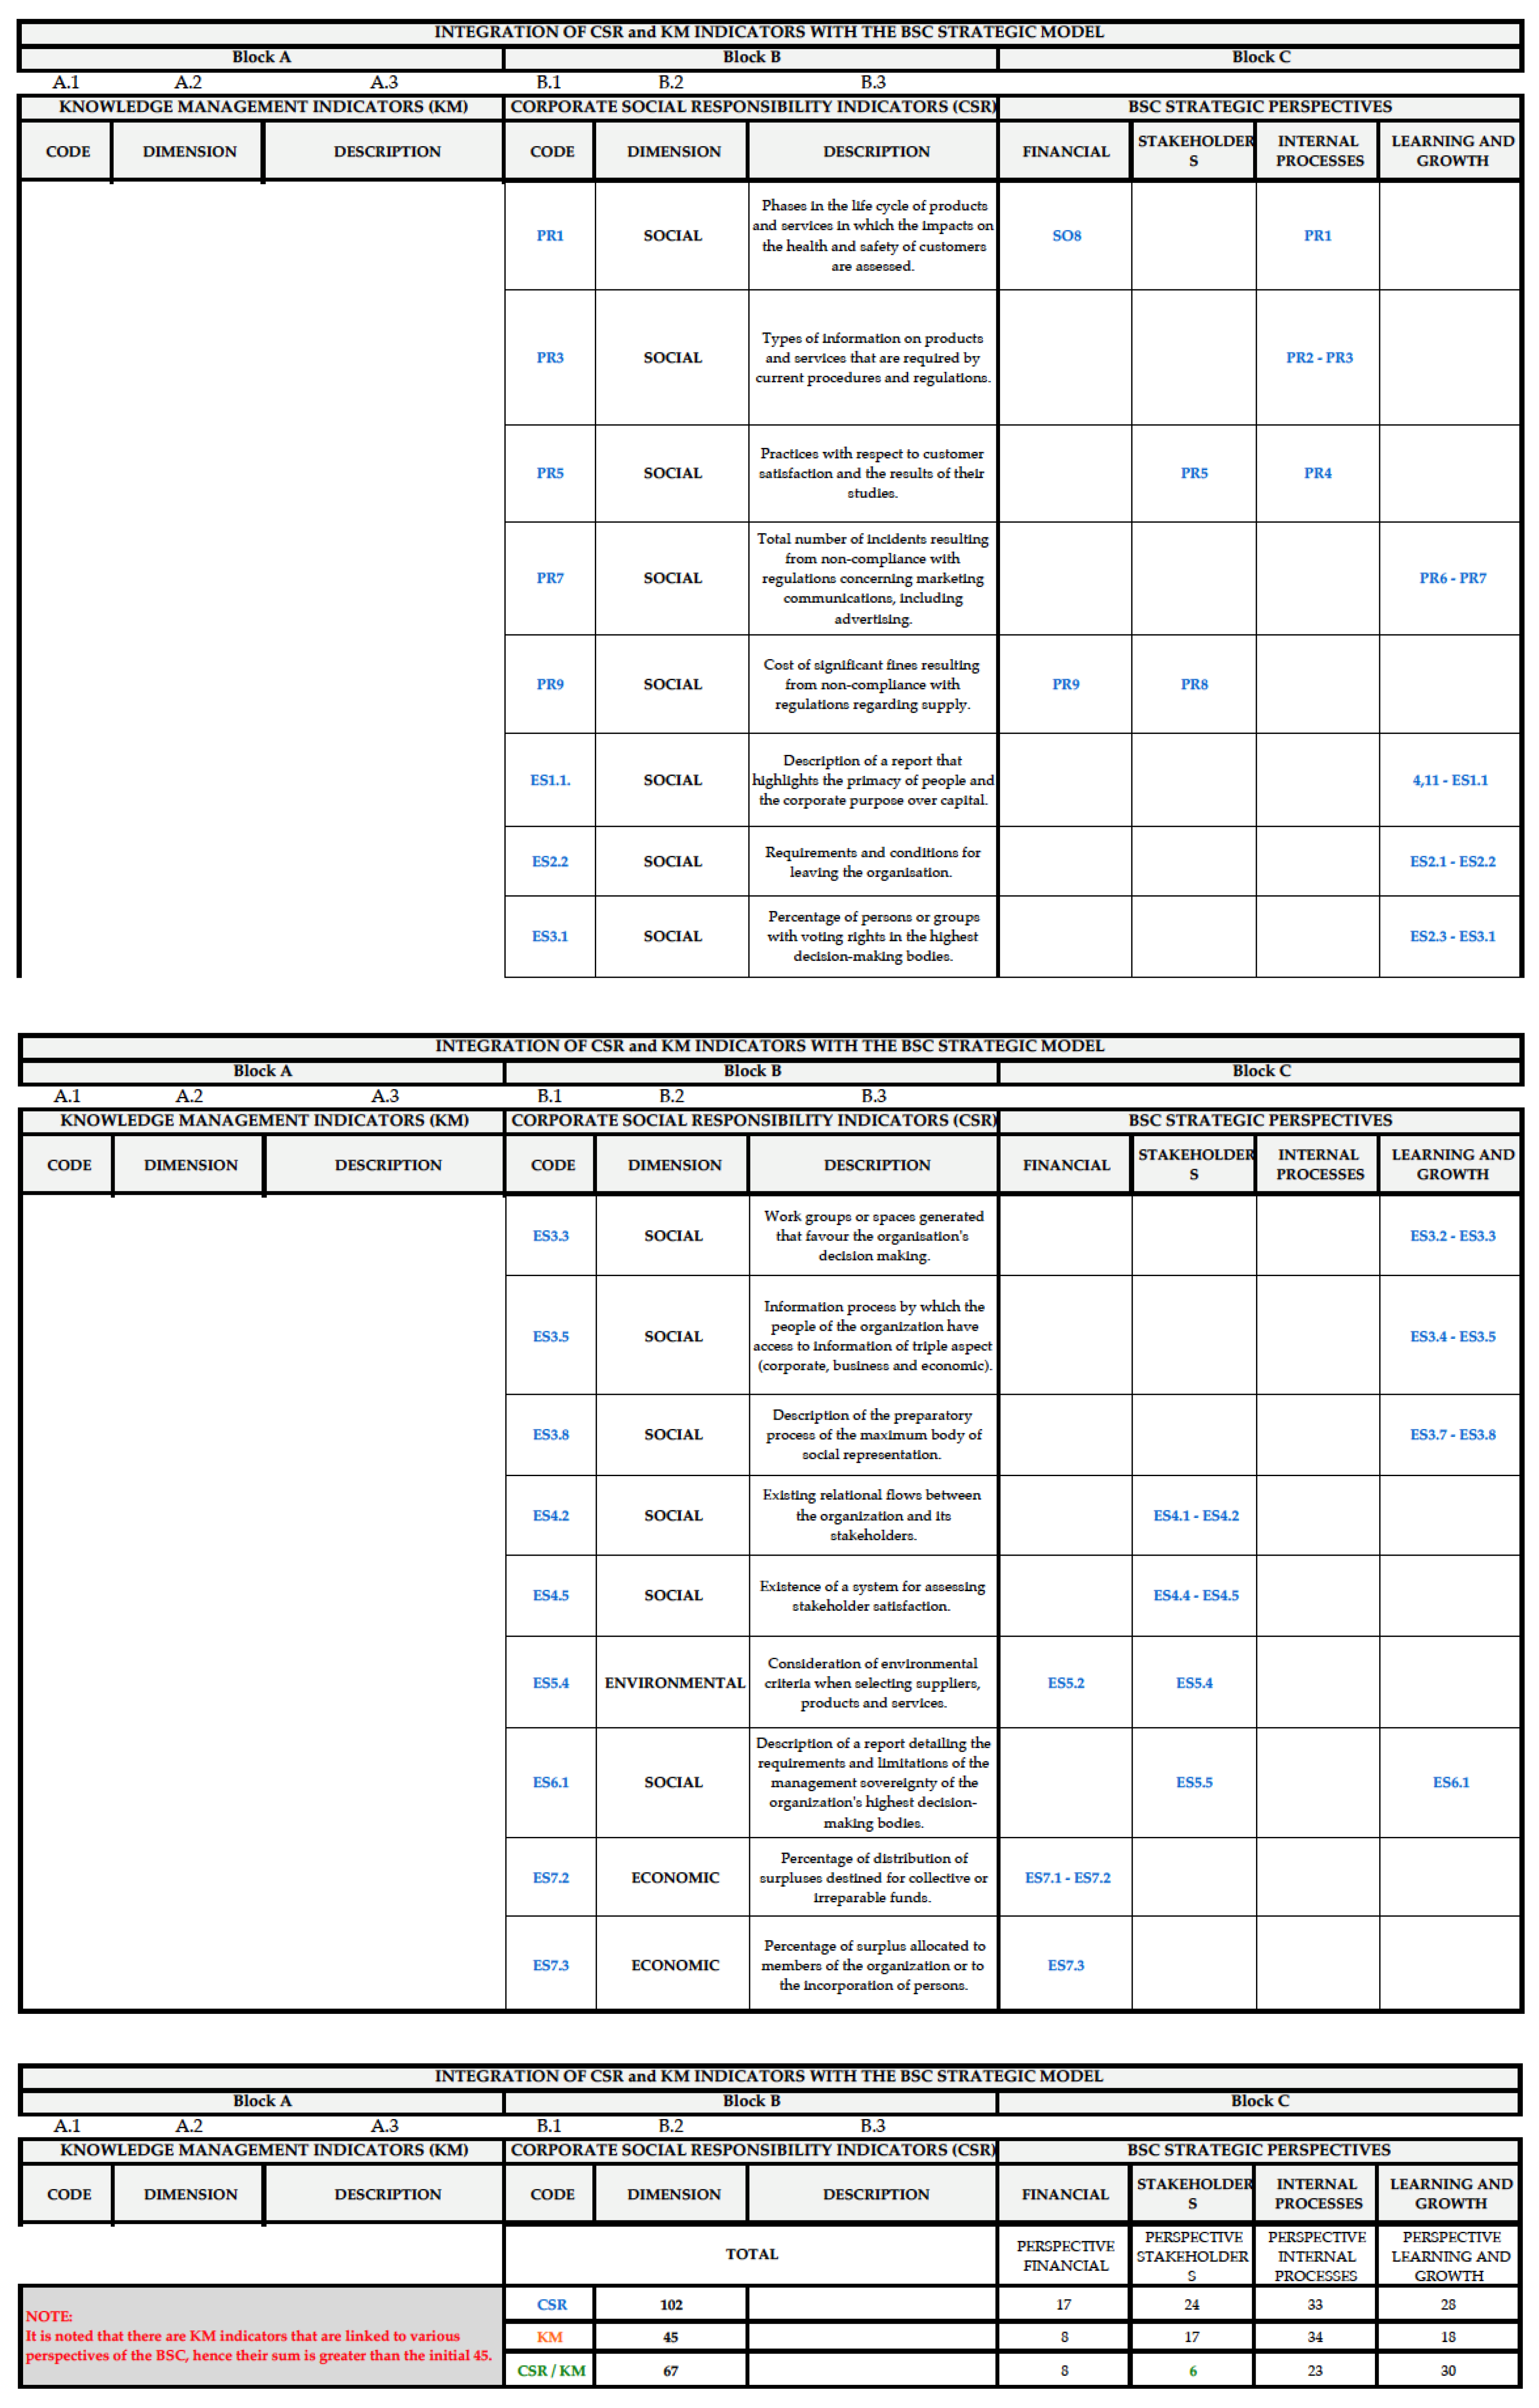
:Many works highlight the importance and added value of Corporate Social Responsibility (CSR) in companies, as well as the role of Knowledge Management (KM) for their revitalization, but even more important is to ensure that all efforts and resources are aligned with the organization’s strategic objectives (Balanced Scorecard, BSC). The aim of this work is to integrate BSC, CSR and KM based on the results of two previous researches: one on BSC–CSR and the other on KM, both of a projective nature (description-action-contrast). The research carried out has made it possible to identify 45 KM indicators, 102 CSR indicators and their corresponding correlations with the strategic objectives and perspectives of the BSC. In addition, an Excel tool was designed and developed for SMEs that is customizable, intuitive and useful for decision-making, which allowed us to contrast the obtained results.
1. Introduction
The aim of this paper is to show the process of identifying and integrating CSR and CG indicators in the management of organizations through the BSC. We also developed an Excel application that supports it, and this has allowed us to validate it in a consulting services SME.
Having set out the objective of the work, we begin by justifying why we have focused on small and medium-sized enterprises (SMEs), and more specifically, those of the services sector. Below, we list their main problems (weak points), making it clear that “improvements in management, based on technology and focused on people” constitute one of the key success factors for this type of company.
There is no single definition of SMEs globally, but all of them take into account, although with different proportions, the number of workers, the turnover and the value of assets [1,2,3]. In the case of the European Union, the definition of SMEs is set out in Annex I to Commission Regulation (EU) No 651/2014 [4]: “The category of micro, small and medium-sized enterprises (‘SMEs’) is made up of enterprises which employ fewer than 250 persons and which have an annual turnover not exceeding EUR 50 million, and/or an annual balance sheet total not exceeding EUR 43 million”.
This type of enterprises, SMEs, according to an October 2019 study by the ILO, account for approximately 70% of all enterprises worldwide (this study excludes the North American Market, in which such enterprises account for 99.9%, although they employ only 47.5% of the population [5,6,7]). In Europe [8], “Micro, small and medium-sized enterprises (SMEs) constitute 99% of companies in the EU. They provide two-thirds of private sector jobs and contribute to more than half of the total added value created by businesses in the EU”. At the Spanish level, around which we will focus our work, according to the latest report published by the General Secretariat of Industry and Small and Medium-sized Enterprises of the Spanish Ministry of Industry, Trade and Tourism, as of March 2021 [9], 98.94% of Spanish companies are SMEs, and for greater accuracy, 93.55% are micro-enterprises (less than 10 workers), and of them, 73.08% are companies linked to the services sector which employs more than 12 million people, i.e., almost 75% of all employees in Spain.
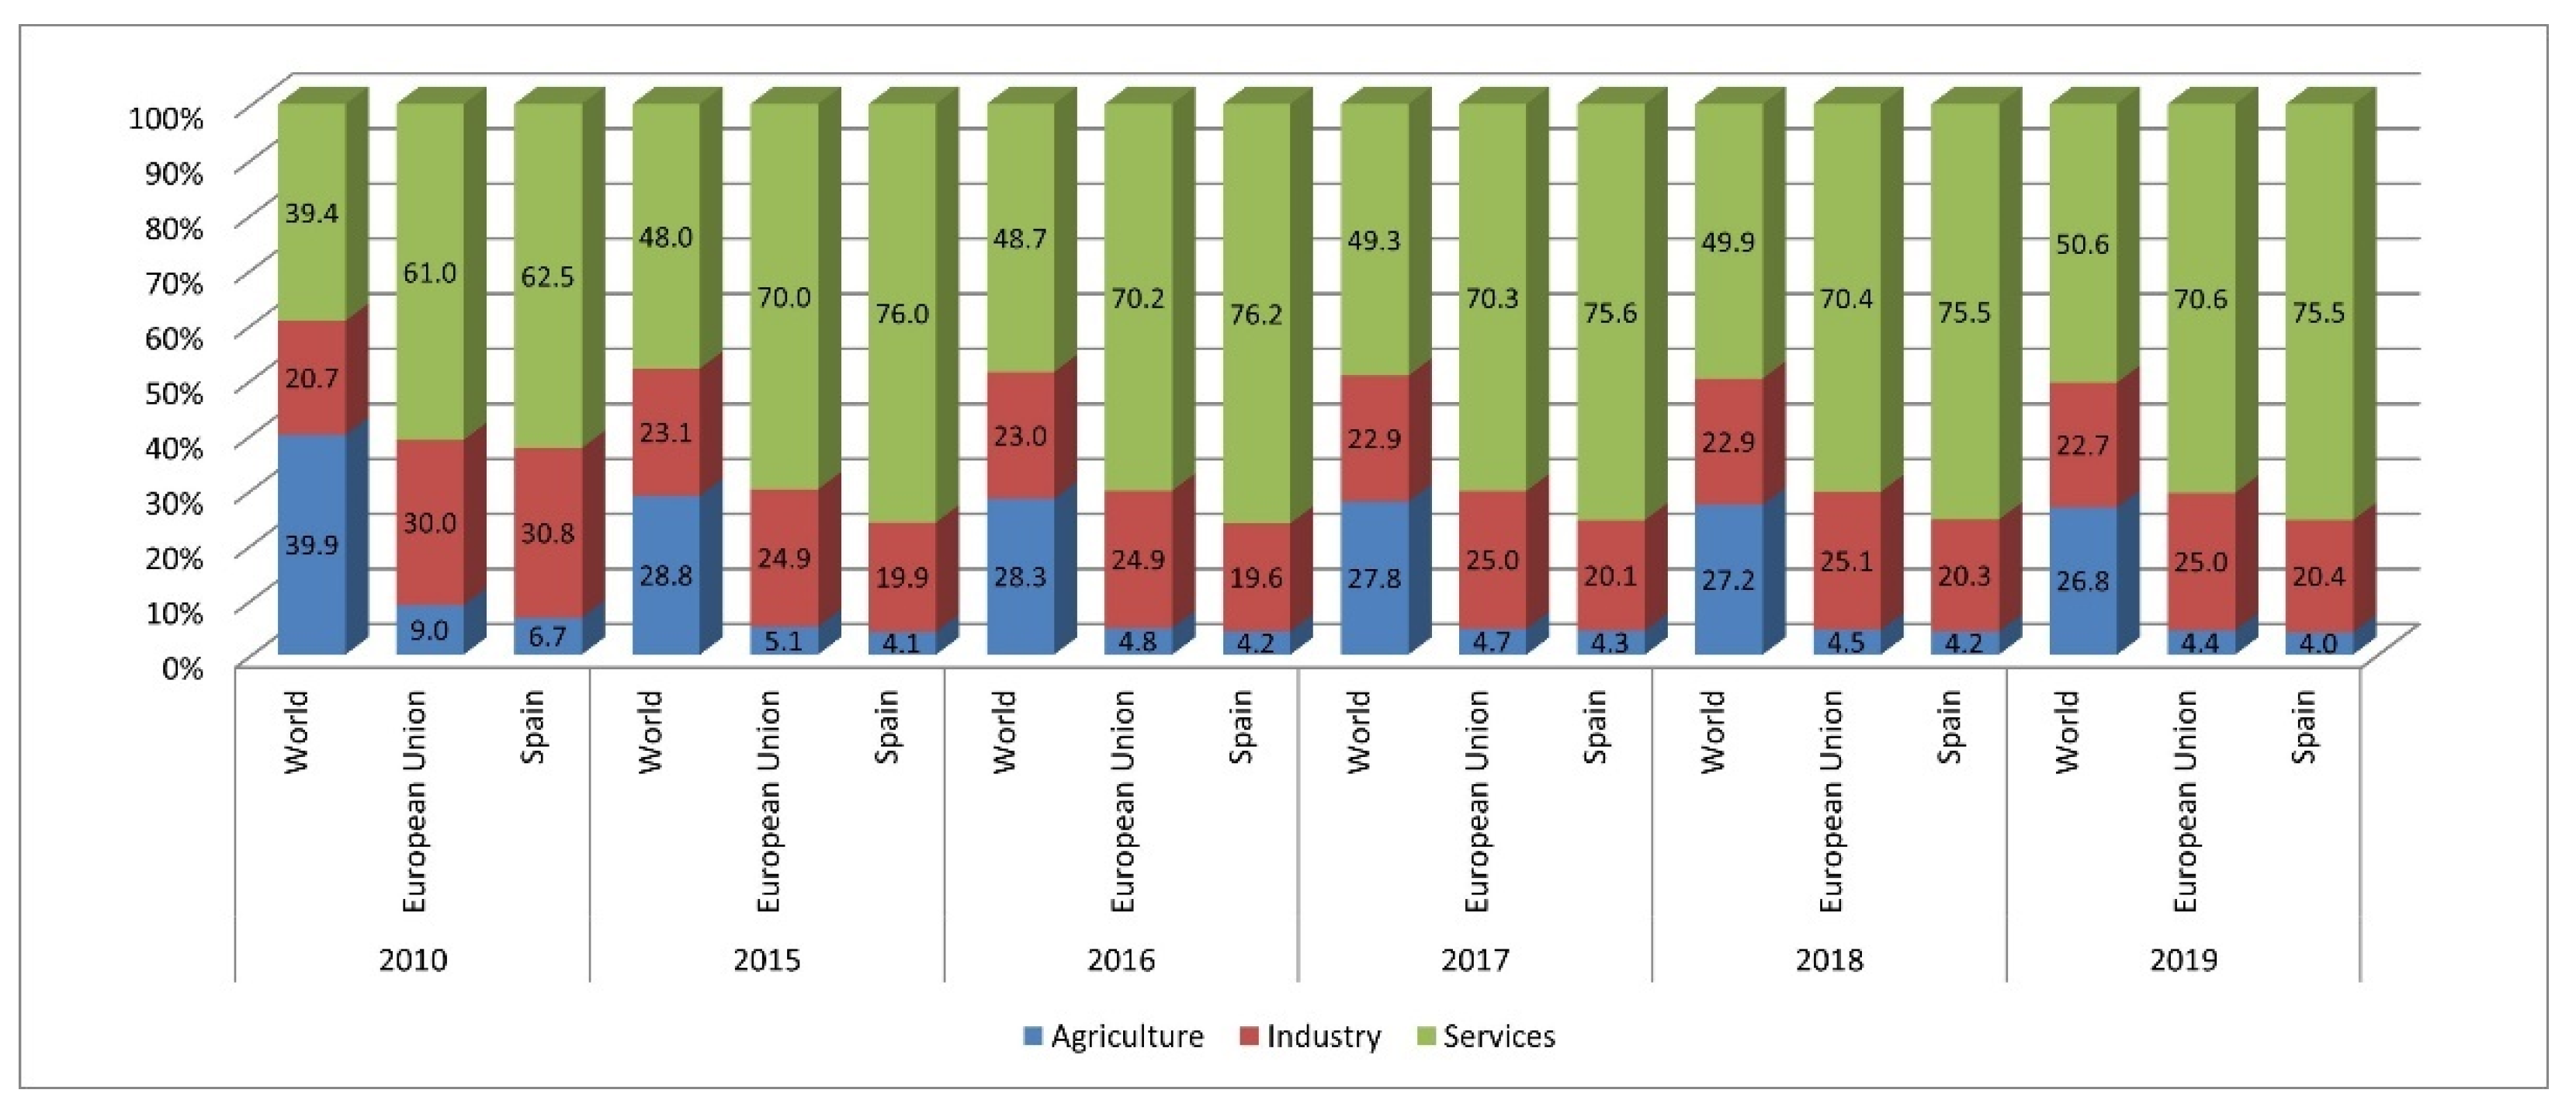
If in addition to the size of the companies, we take into account the employability by sector (Figure 1). Worldwide, according to ILOSTAT (ILOSTAT: International Labour Organization (ILO) Statistics https://www.ilo.org/global/statistics-and-databases/lang--en/index.htm, accessed on 5 March 2021), 50% of workers are in the service sector. In Europe, according to EUROSTAT (EUROSTAT: Statistical Office of the European Union https://ec.europa.eu/eurostat, accessed on 5 March 2021), this value increases to 70%, and in the particular case of Spain, according to INE (INE: National Statistics Institute of Spain https://www.ine.es/en/index.htm, accessed on 5 March 2021), this number is 75%. The result, on average, is that 65% of the total employment is concentrated in SMEs of the services sector. For this reason, when selecting a company on which to apply/validate our tool, we decided that it had to be an SME in the service sector.
What are the main problems of SMEs? Are these equal all over the world? The answers to these questions, unlike what has been stated so far, are not homogeneous. In fact, the problems of such companies are very different depending on their geographical area, such as Latin America, Africa, Asia, etc. [10,11], which is why, and taking into account the area in which we develop our research, from now on, we will focus the scope of work on the OECD/European environment.
Within the European area, in addition to the data provided on the importance of the services sector in SMEs, the report “OECD SME and Entrepreneurship Outlook 2019” [12] states that “SME structure is broadly comparable and stable across OECD countries overall, and SMEs generally concentrate in specific services with lower resource requirements” (p. 19), and therefore their main problems, strengths, challenges, key success factors, etc. are practically the same: financing, internationalization, talent management, innovation and digital transformation. This is backed by a multitude of research papers and reports of public and private institutions [13,14,15,16,17,18,19].
The European framework for small and medium-sized enterprises policy, which is responsible for addressing the major problems of European SMEs, common to most of them, consists of two documents: the “Small Business Act” recommendations [20] and the European SME-Action Programme [21]. The documents on which they are based are:
- Diagnosis of the SME ecosystem: Analysis of European and national policies and guidelines; Characterization of the situation and needs of SMEs.
1.1. Socio-Political Justification of the Proposed Work
In the “Strategic Framework in SME Policy 2030” [22] of the Directorate-General for Industry and Small and Medium-sized Enterprises of the Ministry of Industry, Trade and Tourism of the Government of Spain, it is made clear that the “governance model” is the fundamental piece for the development of the strategic framework of SMEs and that its main objective is to support the monitoring of lines of action. This aspect drives our work, and more specifically, the implementation of a “tracking model” through the BSC (Balanced Scorecard) tool, and integrating CSR and KM, thus providing coverage to lines of action 12 and 40 (LA12 and LA40, respectively).
1.2. Academic Justification of the Proposed Work
LA40: Many works highlight the importance of Knowledge Management (KM) in the dynamization of enterprises, not just SMEs [23,24]. Lee and Wong [25] say KM helps improve organizational performance by providing companies with the competitive edge they need. Like many other tools, KM requires a process that involves the whole organizational strategy, and is characterized by promoting learning and information sharing, as well as the application of specific methods and tools to address KM tasks [26].
LA12: Today, there is a greater and growing concern about social and environmental problems, which cause more and more companies to integrate Corporate Social Responsibility (CSR) initiatives into their strategic lines, as well as their measurement in the performance of the organization [27,28]. In line with what was stated by Öberseder et al. [29] “... it is important to develop unique and reliable measurement tools according to the business sector.” Despite statements such as those of Latif, Pérez, Alam and Saqib [30] that “the difficulty of measuring RSE indicators is that the proposed multidimensional measurement tools are generally designed to be used in any research environment”, works such as Redondo et al. [31] confirm that it is possible, even in SMEs in the services sector, to develop a tool that integrates CSR into the BSC.
Governance/Tracking Model: It is important to use tools such as KM, Lean, Corporate Social Responsibility (CSR), etc. This set of tools should help stakeholders to know, understand and orient actions towards the intended objectives, the most important thing being to manage to align all resources and actions towards the strategy marked by management [32]. Without a doubt, the Balanced Scorecard (BSC), since the early 1990s [33,34], has become the reference methodology for the comprehensive management of all types of indicators, financial and non-financial, taking into account intangible assets and aligning short-term objectives with long-term strategy [35].
1.3. Brief Description of the Company
The company we selected to contrast and validate the tool developed, for confidentiality reasons, is called Empr.A. It is an organization with more than 13 years of experience and with an average of seven employees dedicated to the advice and training of companies.
The company has a consolidated service portfolio, exceling in improving business management models (quality, environment, risk prevention, process management), as well as in CSR and innovation management through people. It is a leader in agri-food, health, education and the social-cooperative economy, and is one of the reference consultancies of the Club Excellence in Management, having won several awards.
Based on the above, the objective of this article is justified—to integrate CSR and KM indicators into the management of the organization through the BSC, in line with the work of Doorn et al. [36], Gangi, Mustille and Varrone [37], Ling [27] and Mehralian, Nazari and Ghasemzadeh [24]. For this we will use, as a starting point, the results of Pineyrua’s research [38] on KM with the original work of Muñoz [39] that integrated the BSC with the CSR in the same company (Empr.A), developing a customizable, intuitive and useful tool for decision making.
The work has been structured in three sections. We start by conducting a bibliographic review and presentation of the methodology followed in the work, describe the integration process and the results obtained and conclude with the presentation of the main conclusions and future lines of work.
2. Bibliography Review and Working Methodology
First, we discuss the “Sustainability Balanced Scorecard” (SBSC) as an integration of the BSC (reference tool in the piloting of strategic business management), and CRS as an element of sustainable development and its measurement and monitoring by means of indicators. We will continue with the valorization of the KM and the main challenges of its management, to conclude with the process of diagnosis and integration of the KM with the “Sustainability Balanced Scorecard”.
2.1. Sustainability Balanced Scorecard (SBSC): Integrating CSR in the BSC
Many studies have analyzed the origin and evolution of the term Corporate Social Responsibility (CSR) [40,41,42,43,44], which is not a static concept; on the contrary, it has varied, and varies, depending on the period in question, the degree of development of society, the nature of the company, etc. However, we have opted for a definition based on Font, López and Pérez [45]: CSR is a strategic challenge (a key factor for business success), voluntary, focused on promoting good practices that guarantee the economic, social and environmental sustainability of its actions, and involving all stakeholders of the company.
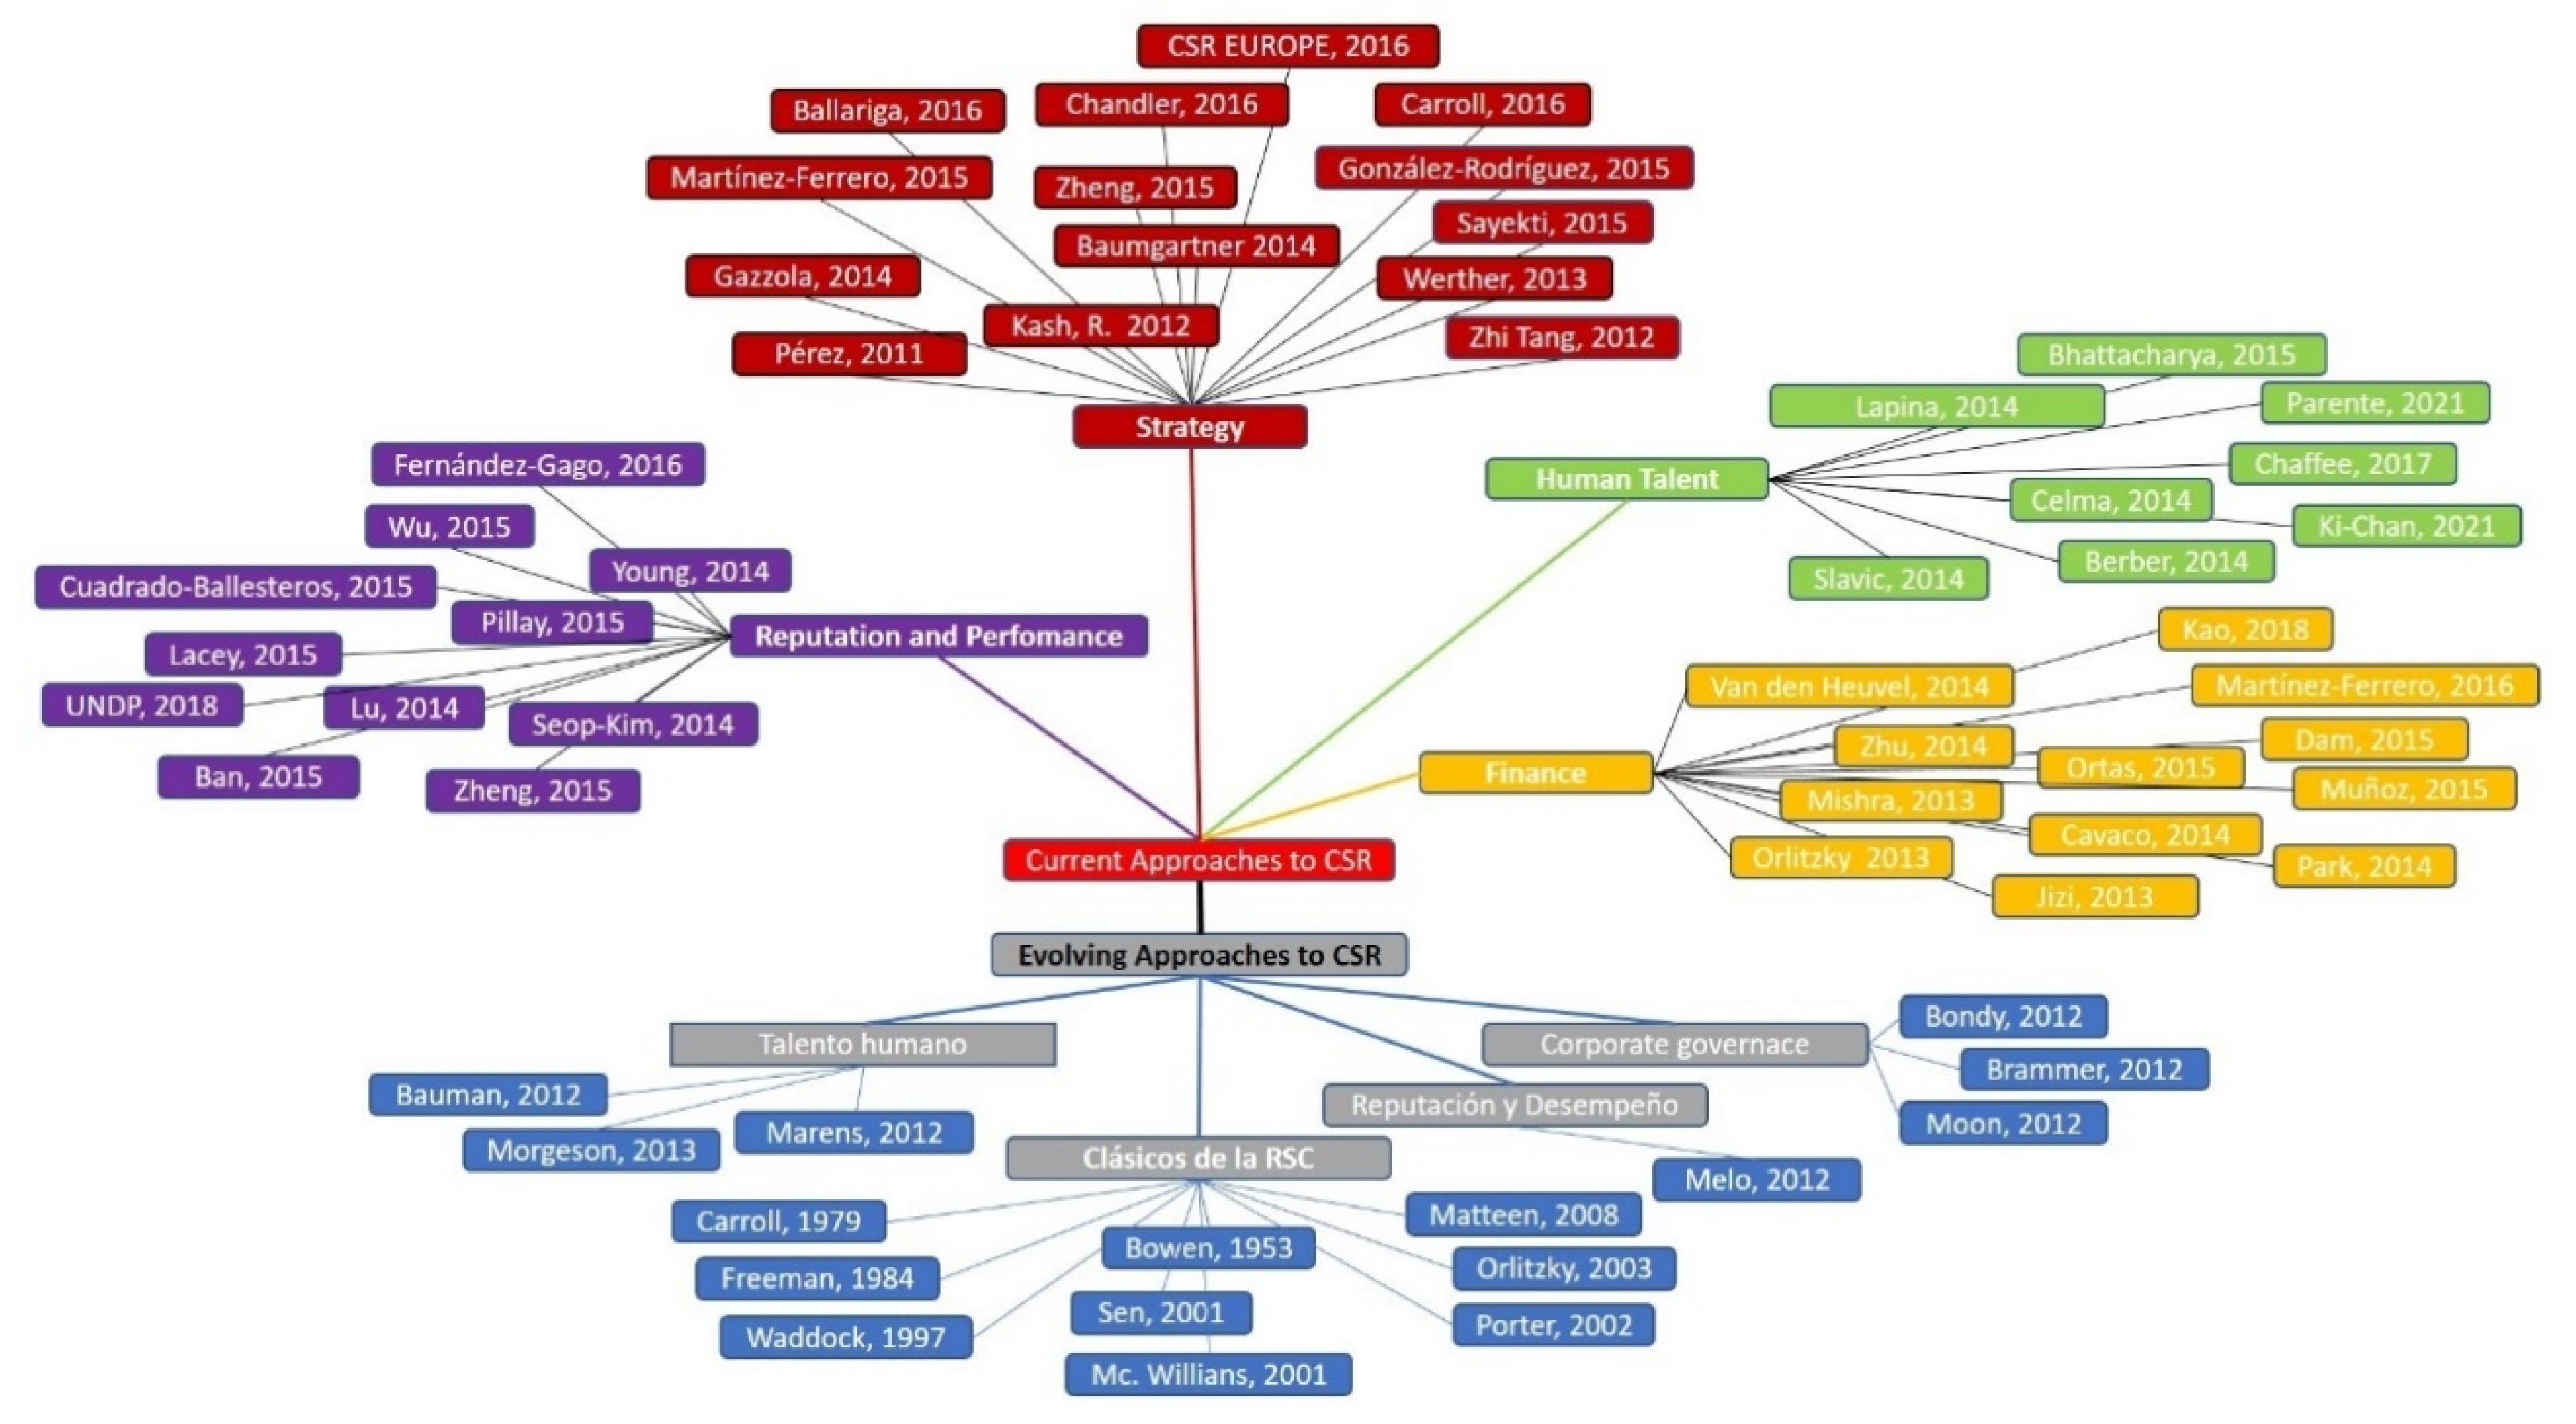
In line with the above, the research work carried out by Lizcano and Lombana [46] accredits the evolution and theoretical development of CSR through what is stated by: “Bowen (1953), Carroll (1979), Freeman (1984), Waddock (1997), Sankary Bhattachary (2001), Williams (2001), Porter and Kramer (2002) and Orlitzky (2013)”, summarized in Figure 2, in which we highlight the groupings “Strategy”, “Finance”, “Performance” and “Human Talent”.
How can we measure CSR? The study on proposals to measure SRSE carried out by Puentes y Lis-Gutiérrez (2018) [47] based on the works of “Nazari et al. (2017), Barrena-Martínez et al. (2017), United Nations Conference on Trade and Development (2008), Vitezic (2010), Spanish Association of Accounting and Business Administration (2010), Focacci (2011), Luna-Gonzalez & Rodríguez-Hurtado (2012), Rahman & Post (2012), Gallardo-Vázquez et al. (2013), Gangone & Ganescu (2014), Burlakova (2014), Janamrung & Issarawornrawanich (2015), Bonson & Bednárová (2015), Pinto-Ferreira et al. (2015), Carroll et al. (2016), Jiménez et al. (2016), Sánchez- Hernández & Mainardes (2016), Latif (2017), Wuttichindan (2017), United Nations (2018), Martínez et al. (2013), Jonikas (2014), Morioka et al. (2016)” concludes that these can be grouped into CSR reports and single and multiple indicators. This classification shows that there are a large number of proposals and batteries of indicators; however, they highlight the proposals in which they analyze the CSR of human resources policies and the continuous effort to standardize indicators such as the GRI (Global Reporting Initiative) and ISO 26000 standards [48].
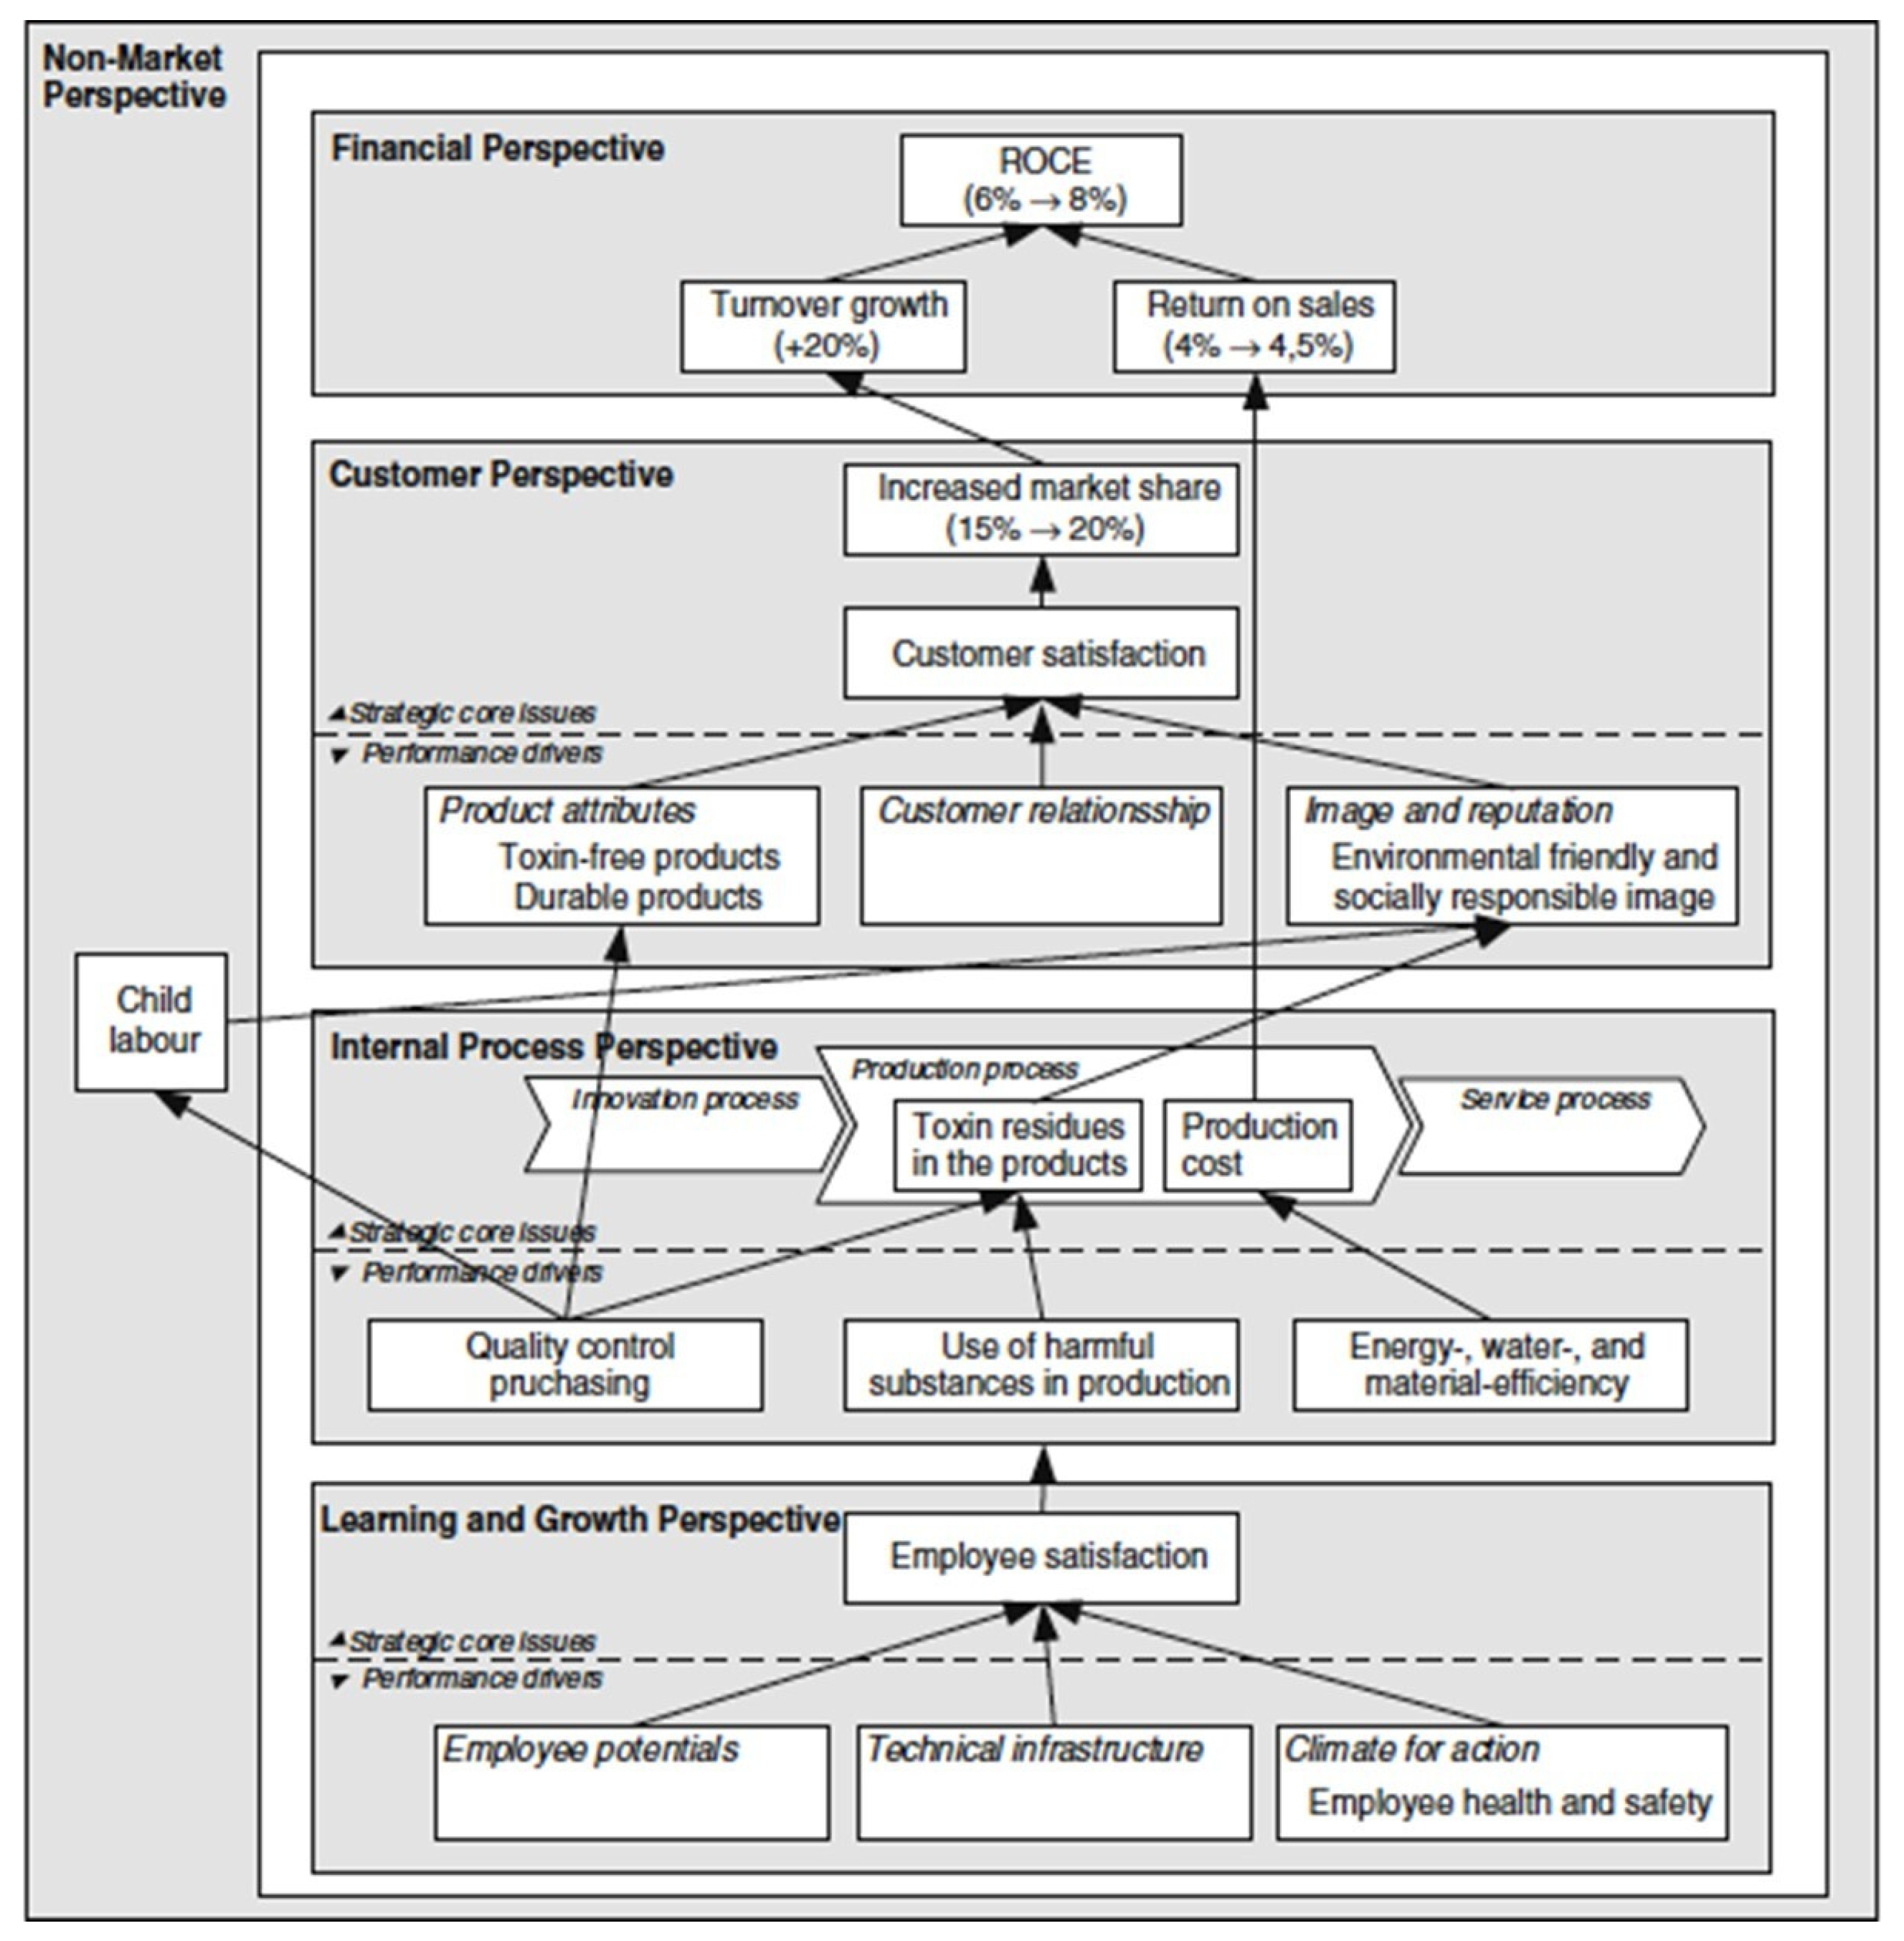
How can we integrate CSR into the ordinary management of the company? Hansen and Schaltegger’s [49] work assumes, like many other authors, both academics [50,51] as professionals [52],that the BSC is the best tool for integrating financial and non-financial indicators (aligning long-term and short-term objectives). Therefore, taking into account the increasing strategic importance of environmental, social and ethical issues, it was proposed to integrate them into the BSC, giving rise to the so-called Sustainability Balanced Scorecards (SBSCs), with an architecture such as that shown in Figure 3.
The use of inappropriate management tools, especially in the case of SMEs, can provide uncertain results, inducing errors in decision-making and in the implementation of improvement actions [54]. According to Nguyen et al. [55], it is important for SMEs to have a systematic management tool such as BSC to minimize risks related to decision-making, information control and financial instability.
According to Shafiee et al. [56], the strongest point of BSC is its ability to identify cause and effect relationships between strategies and processes through actions. To do this, it is necessary to properly implement BSC, correctly sequencing the following four stages: (1) translating the business vision into actions, (2) communicating and relating these actions to operational objectives, (3) integrating all plans for such actions with financial planning and (4) providing feedback on results obtained and adjustments needed [57,58,59,60,61].
Other advantages of BSC are:
- Its capacity to adapt, through some modifications and improvements, to different business sectors [62].
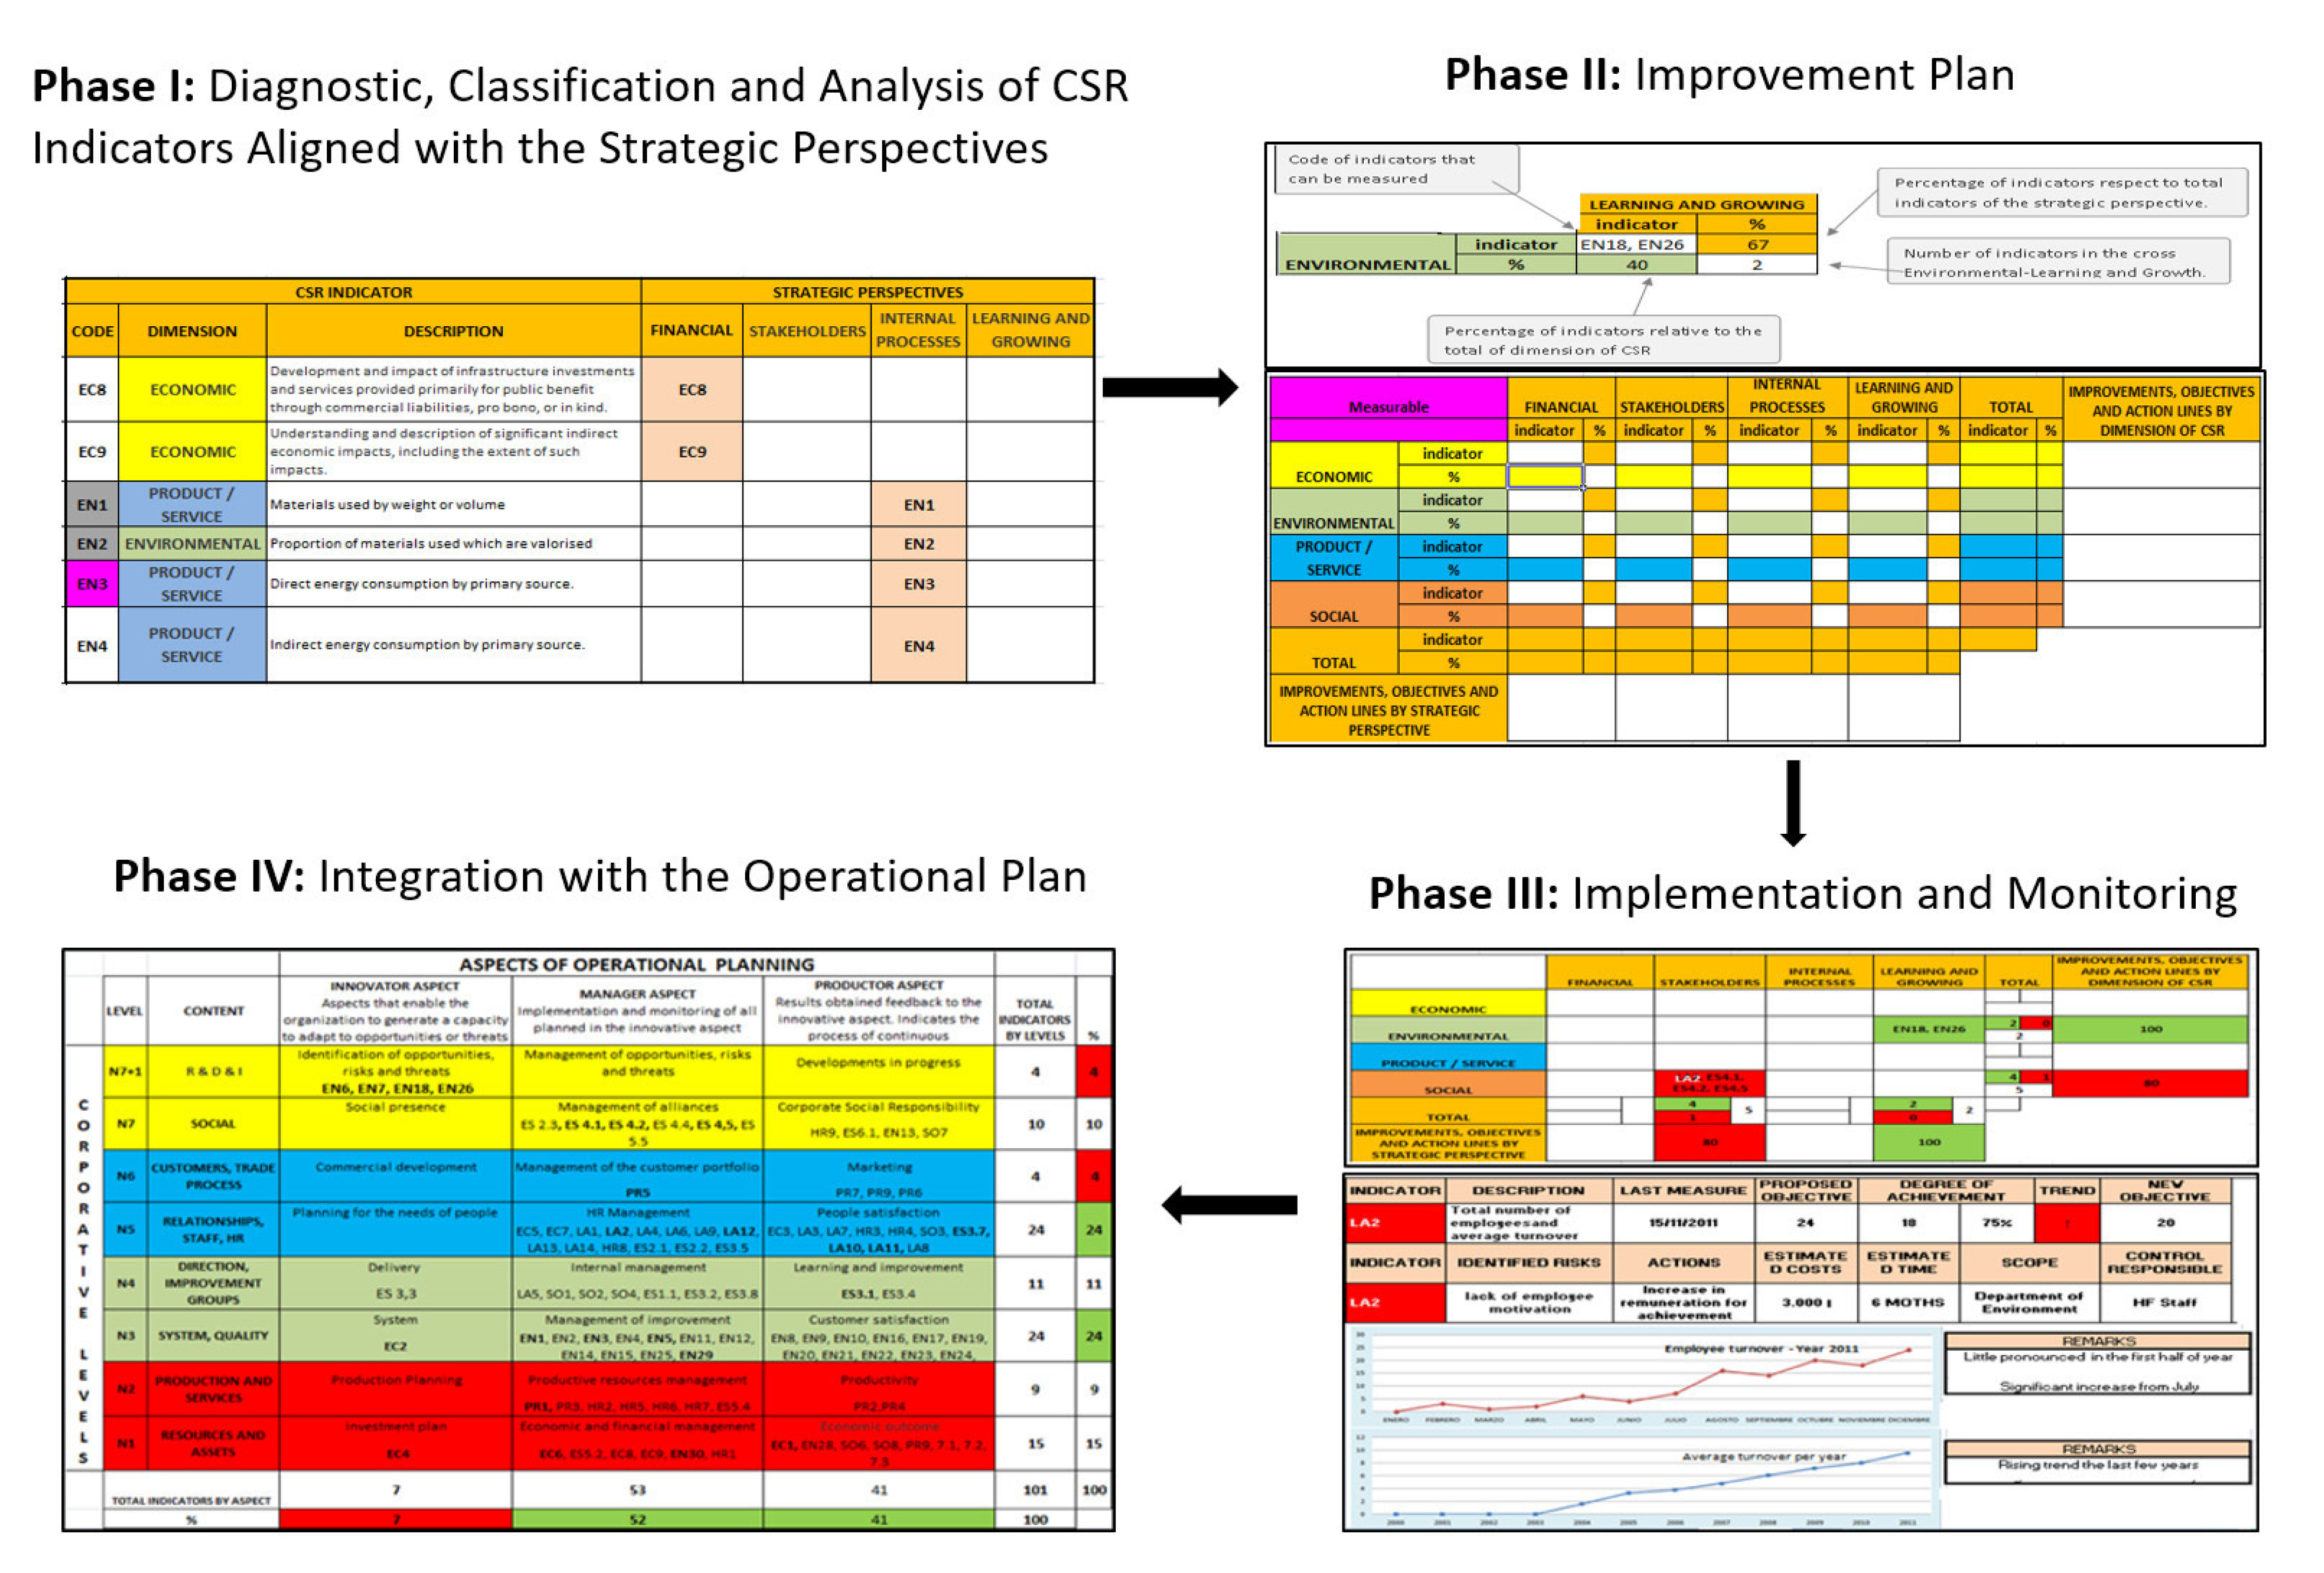
The first two aspects above—the adaptation of BSC to a sector such as “Consulting Services” and its integration with GRI-type CSR indicators—are the starting points of the work presented by Redondo et al. [31] and supported by studies such as Hristov, Chirico and Appolloni [63] and Nguyen et al. [55]. This work was based on those of Muñoz [39] and Muñumer [66], whose integration gave rise to a BSC for a services SME, in which 102 CSR indicators were identified and integrated under the GRI model, allowing “critical points” to be identified based on the prioritization of indicators carried out by the company, and to direct actions towards the strategy set (see Figure 4).
Despite the good results obtained with the designed SBSC, we consider that the model needs a dynamic and dynamizing element. For this reason and taking advantage of criticisms such as that of Nguyen et al. [55], who consider that the SBSC does not sufficiently integrate all stakeholders, and recommendations such as those of Lee and Wong [25], who propose having a model of performance indicators for Knowledge Management (KM) adapted to the characteristics and needs of SMEs, we proposed to integrate this part (element, aspect—KM) into the SBSC.
2.2. Knowledge Management (KM) and the Main Challenges of Its Management
According to the RAE, (Real Academia Española, Royal Spanish Academy) knowledge is “the action of ascertaining, through the exercise of the intellectual faculties, the nature, qualities and relationships of things”; that is, it is the faculty of the human being to understand, through reason, the nature, qualities and relationships of things. The translation of this concept, to an organization, could be defined as the capacity of the company to adapt and behave in front of the changes that occur in the competitive environment in which it is located. Therefore, a high investment in knowledge can become a very valuable resource capable of orienting actions (measures of the organization’s performance) towards corporate strategy. Knowledge, especially tacit knowledge, cannot be easily codified and imitated by competition [67]—hence, the importance of its value, and therefore of its management, being necessary to have tools to know, understand and enhance the task of knowledge management.
The AEC (Asociación Española para la Calidad—Spanish Association for Quality), in line with Nonaka and Takeuchi [68], Hanif, Malik and Hamid [69] and Gupta and Chopra [65], defines Knowledge Management (KM) as “the effort an organization makes to acquire, increase, organize, distribute and share knowledge among all employees. It is therefore all those activities aimed at enhancing the knowledge of people in the organization and the organization itself”.
Knowledge is considered a strategic resource and a determining factor in achieving sustainable competitive advantage [70]. The main challenge of knowledge management, within an organization, is double-edged: on the one hand, trying to acquire and transfer the tacit knowledge of the worker (their intrinsic skills, ideas, perceptions, etc.), which is difficult to formalize, and, on the other hand, carrying out a correct codification of explicit knowledge (the one formalized in documents, graphs, databases, etc.) through a process of interactive transformation. According to Nonaka and Takeuchi [68], the creation of knowledge by companies occurs systematically, is transmitted throughout the organization and has the capacity to incorporate it into new products and technologies, not as an explicit and specialized activity, but as a form of behavior, a means by which all workers participate in this practice.
KM provides models and tools that help companies create an environment that supports knowledge sharing. Mazorodze and Buckley [71] assert that Information and Telecommunication Technologies (ICTs) are now considered one of the enablers for the effective implementation of knowledge management, becoming an important perspective aimed at creating value for companies. According to Mills and Smith [72], when investing in knowledge management, the organization needs to create a “knowledge infrastructure”, which has as key elements information technology, culture and organizational structure, and also needs to create “knowledge process capability” that involves four dimensions: knowledge acquisition, knowledge creation, knowledge application and knowledge transfer.
Currently, research in this field is focused on trying to empirically evaluate the effect of KM practices on company results. Hanif, Malik and Hamid [69] investigated the effects of KM processes (acquisition, transfer and application) on the performance of banking companies. The results showed that each KM process has a positive effect on company performance.
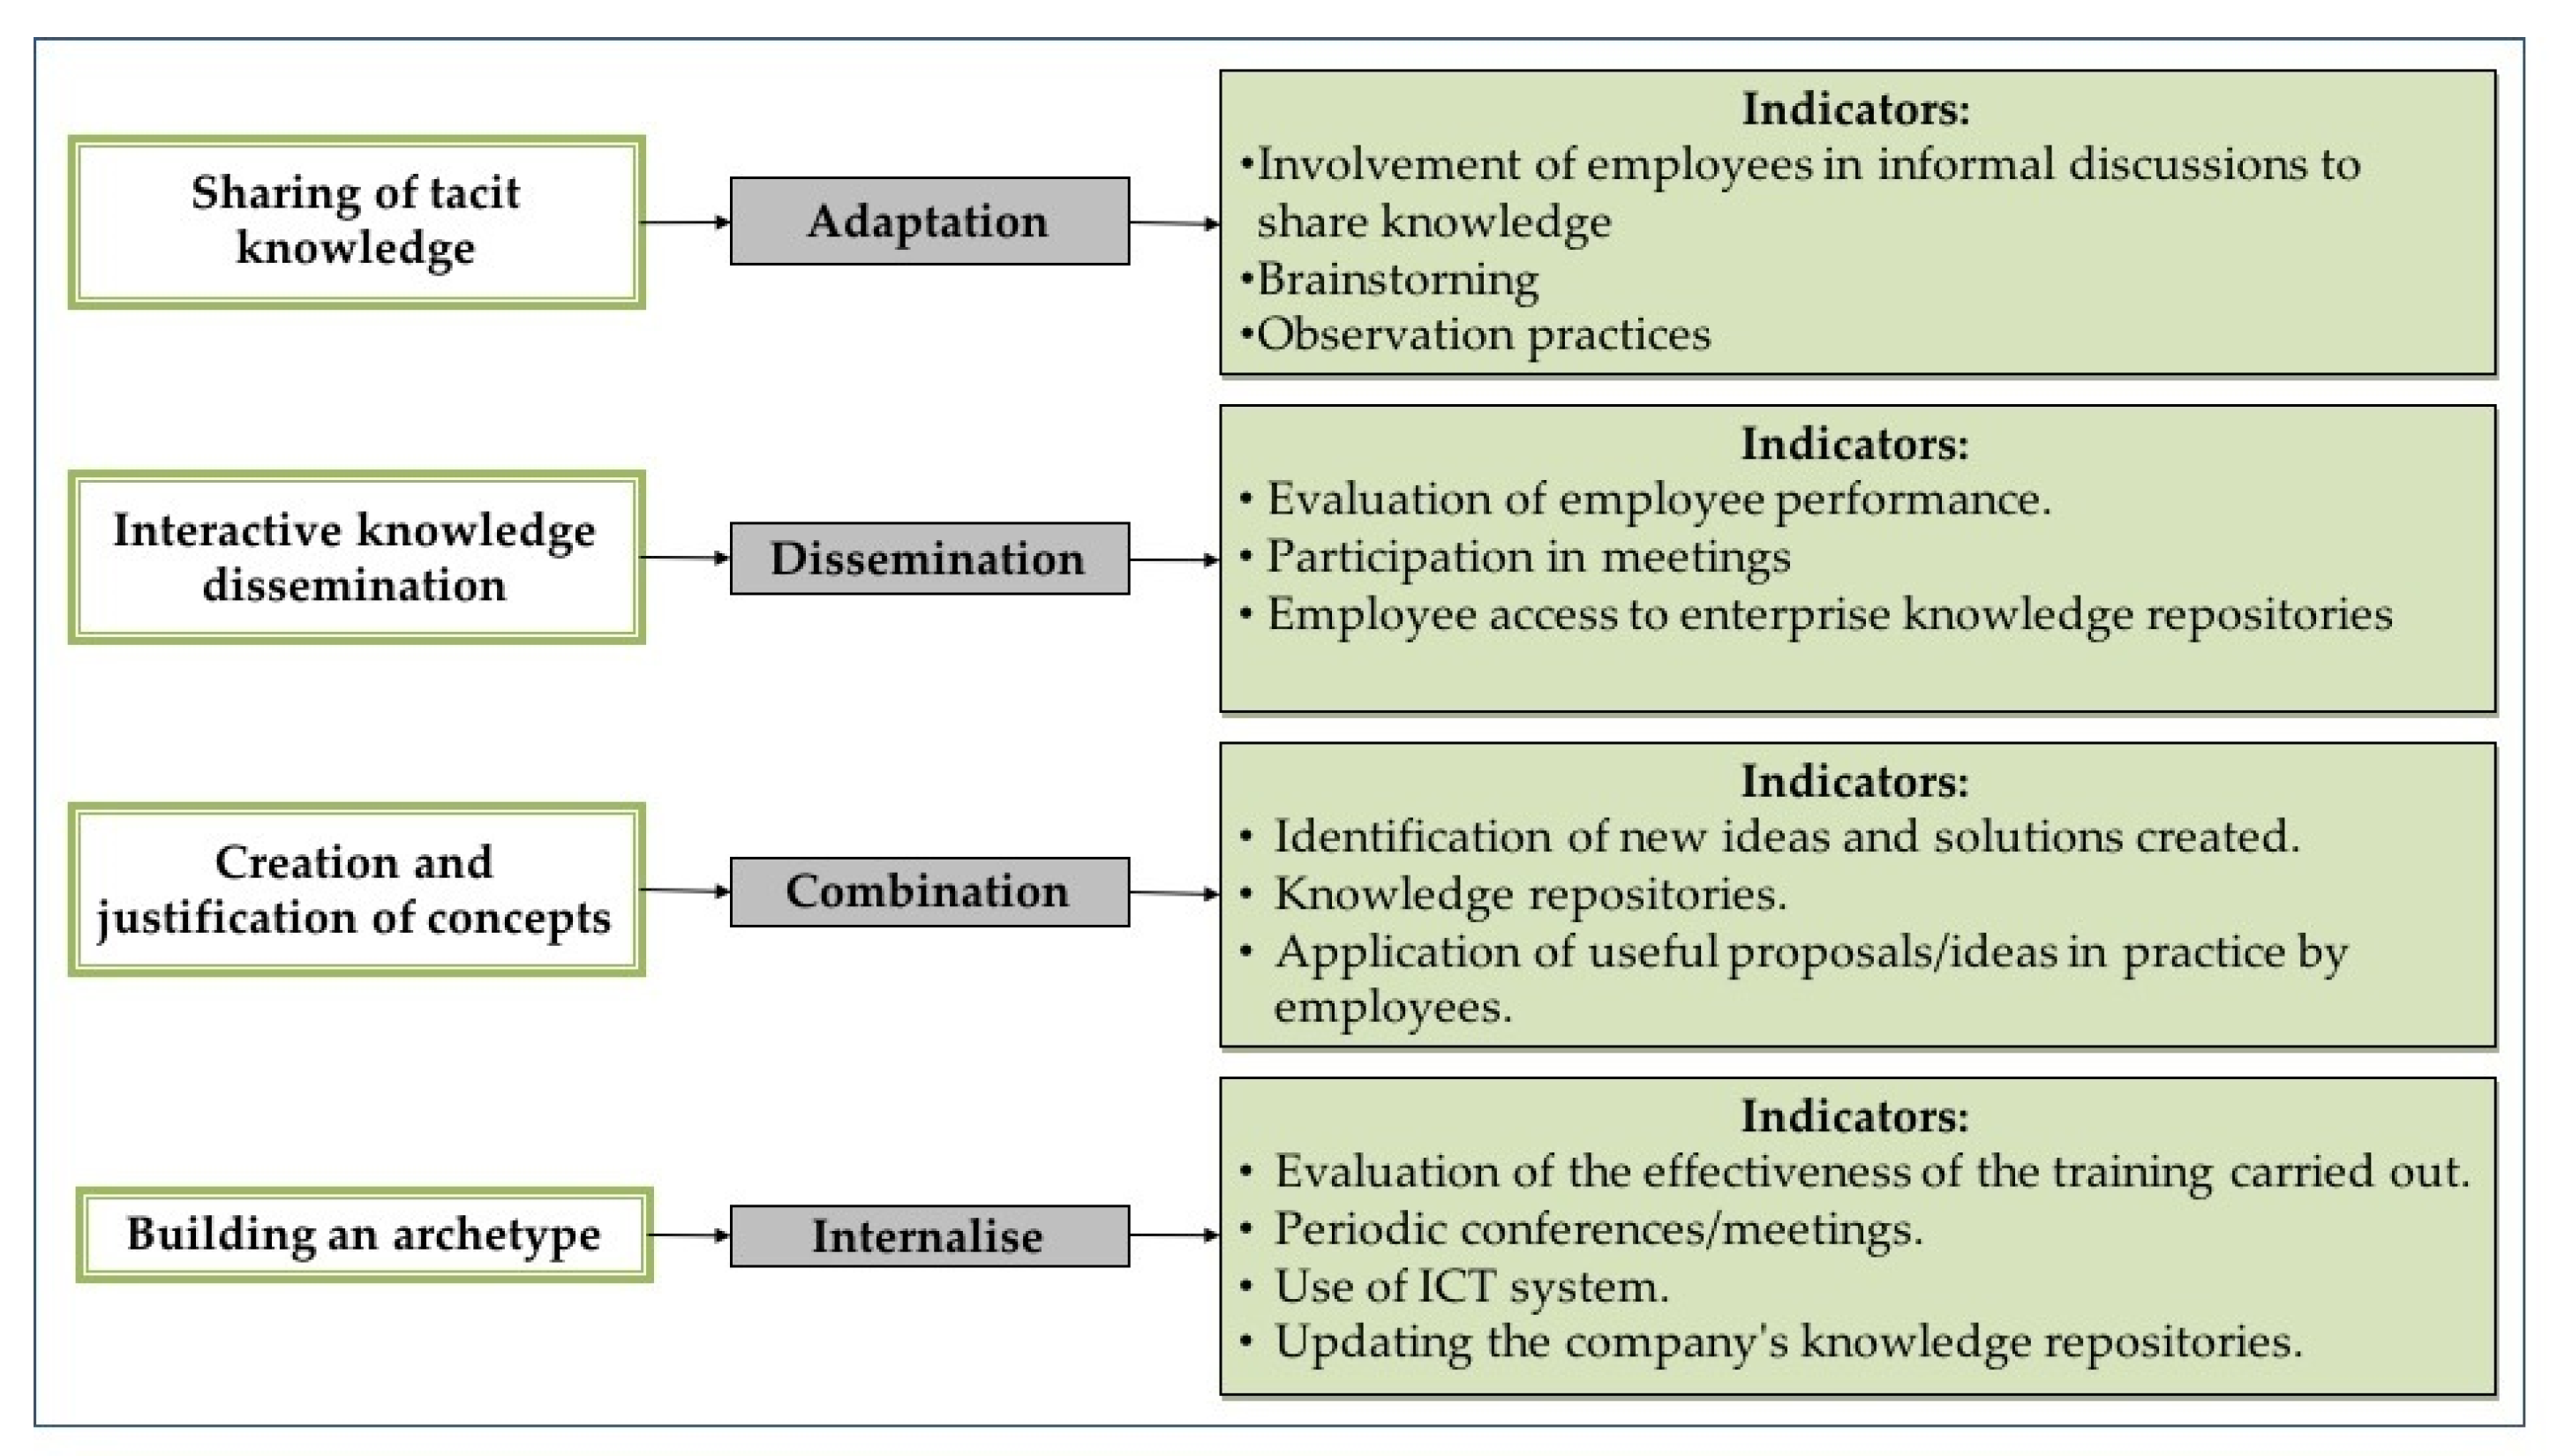
In line with this, the work of Pineyrua [38] investigated the KM indicators used in the “knowledge creation process”. Once these KM indicators were identified, a knowledge creation process was modelled that identified improvements in company management. The fieldwork carried out showed in the companies analyzed (five in the pulp sector) the poor quality of knowledge organization. To help reconvert their knowledge, a new knowledge creation procedure was proposed based on four stages: adaptation, dissemination, combination and internalization (see Figure 5).
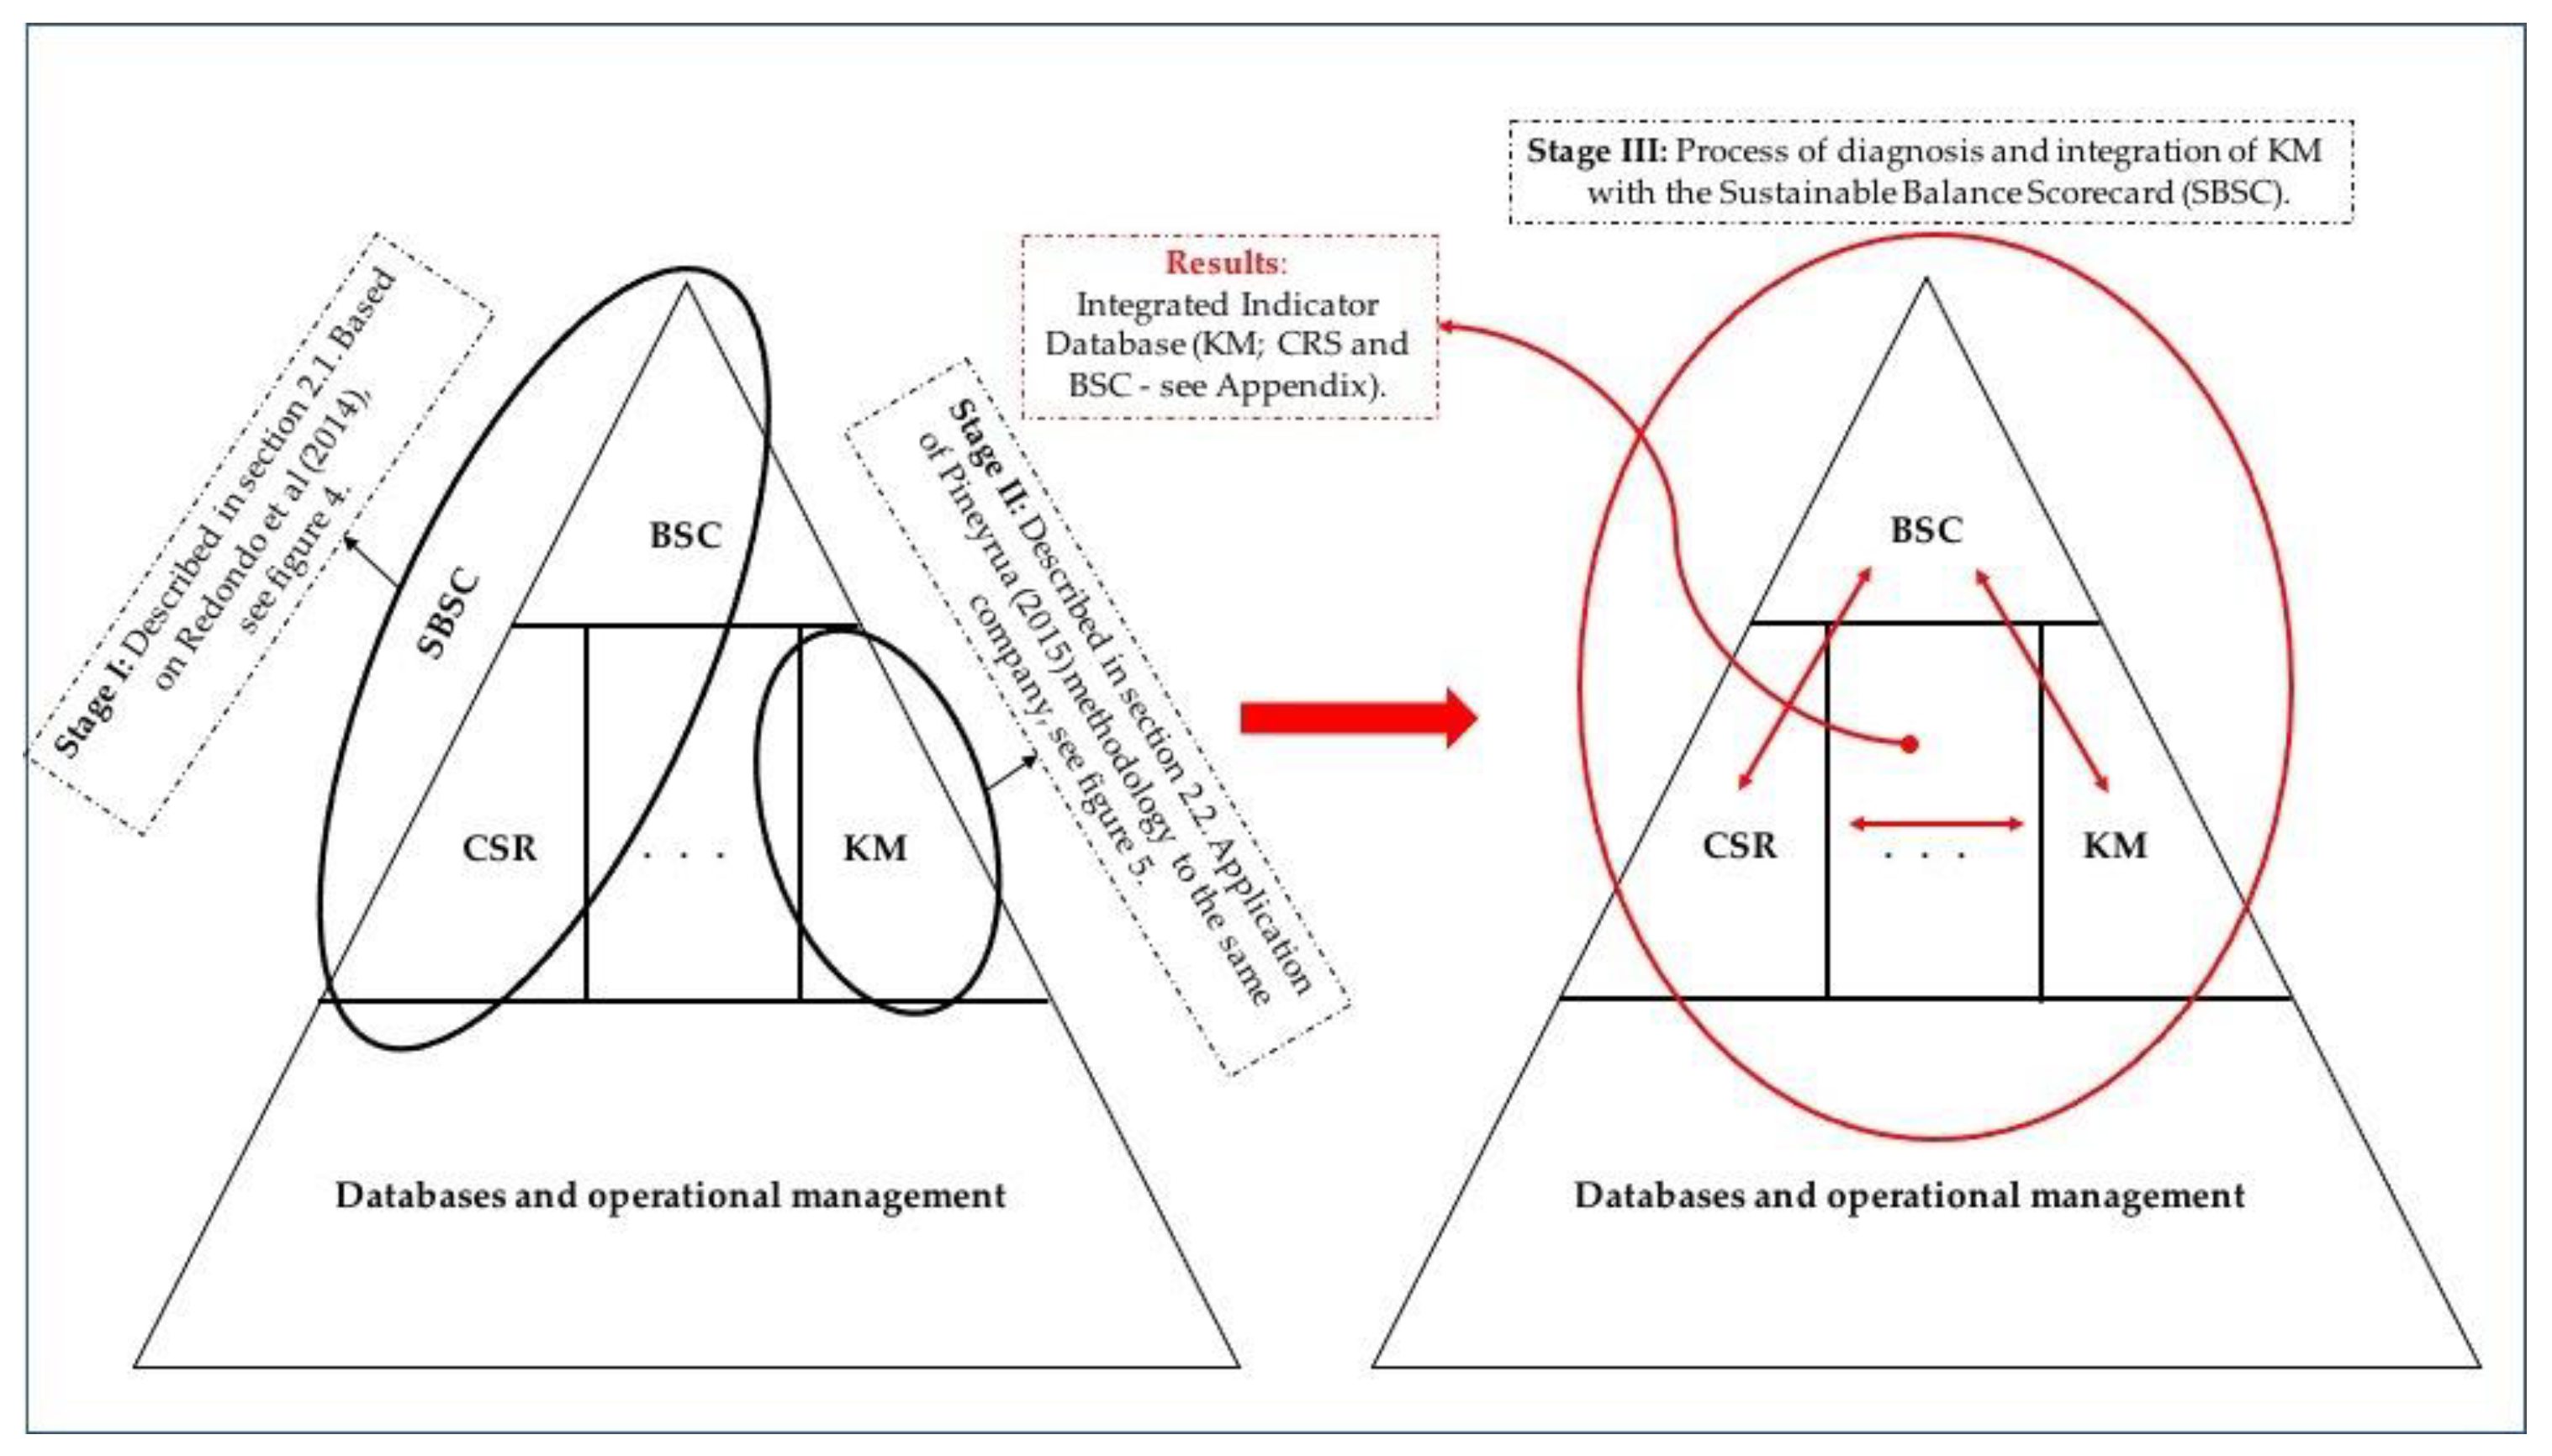
3. Process of Diagnosis and Integration of KM with the Sustainable Balance Scorecard (SBSC)—Results
Based on the above, the objective to be achieved is summarized in Figure 6.
It is important to use management tools that measure and analyze, in an integral mode, the performance of the whole organization, including the greatest possible number of aspects (items), including CSR, KM, etc., identifying and considering the impact of each of them on the company’s strategy. In order to fill this gap, studies have been carried out for some time now that relate the following aspects:
Focusing the study on SMEs, and in particular those in the service sector because of their impact on GDP, authors such as Dneprovskaya et al. [26] highlight the need to use KM indicators to improve their efficiency, enhance their growth and the development of worker skills. However, researchers such as Lee and Wong [25] show that the works carried out in the big companies are not transferable to the SMEs, and therefore it is necessary to undertake adaptations such as those carried out by Chen and Miao [78] that integrate resources, processes and factors of KM with the four perspectives of the BSC.
Recently, there has been a trend in research towards a focus on integrating BSC performance measures with KM indicators and BSC with CSR indicators. This research seeks to contribute to this new trend, integrating KM performance indicators with CSR indicators as a way to measure and evaluate the dimensions of organizational performance of the BSC, applied to a knowledge-intensive SME. In the case of knowledge-intensive SMEs, such as those providing legal advice, accounting, process consulting (engineering), management consulting, etc., greater attention should be paid to KM and its integration with the BSC [23,77].
The integration of both works, based on an extensive bibliographic search, was carried out in three stages:
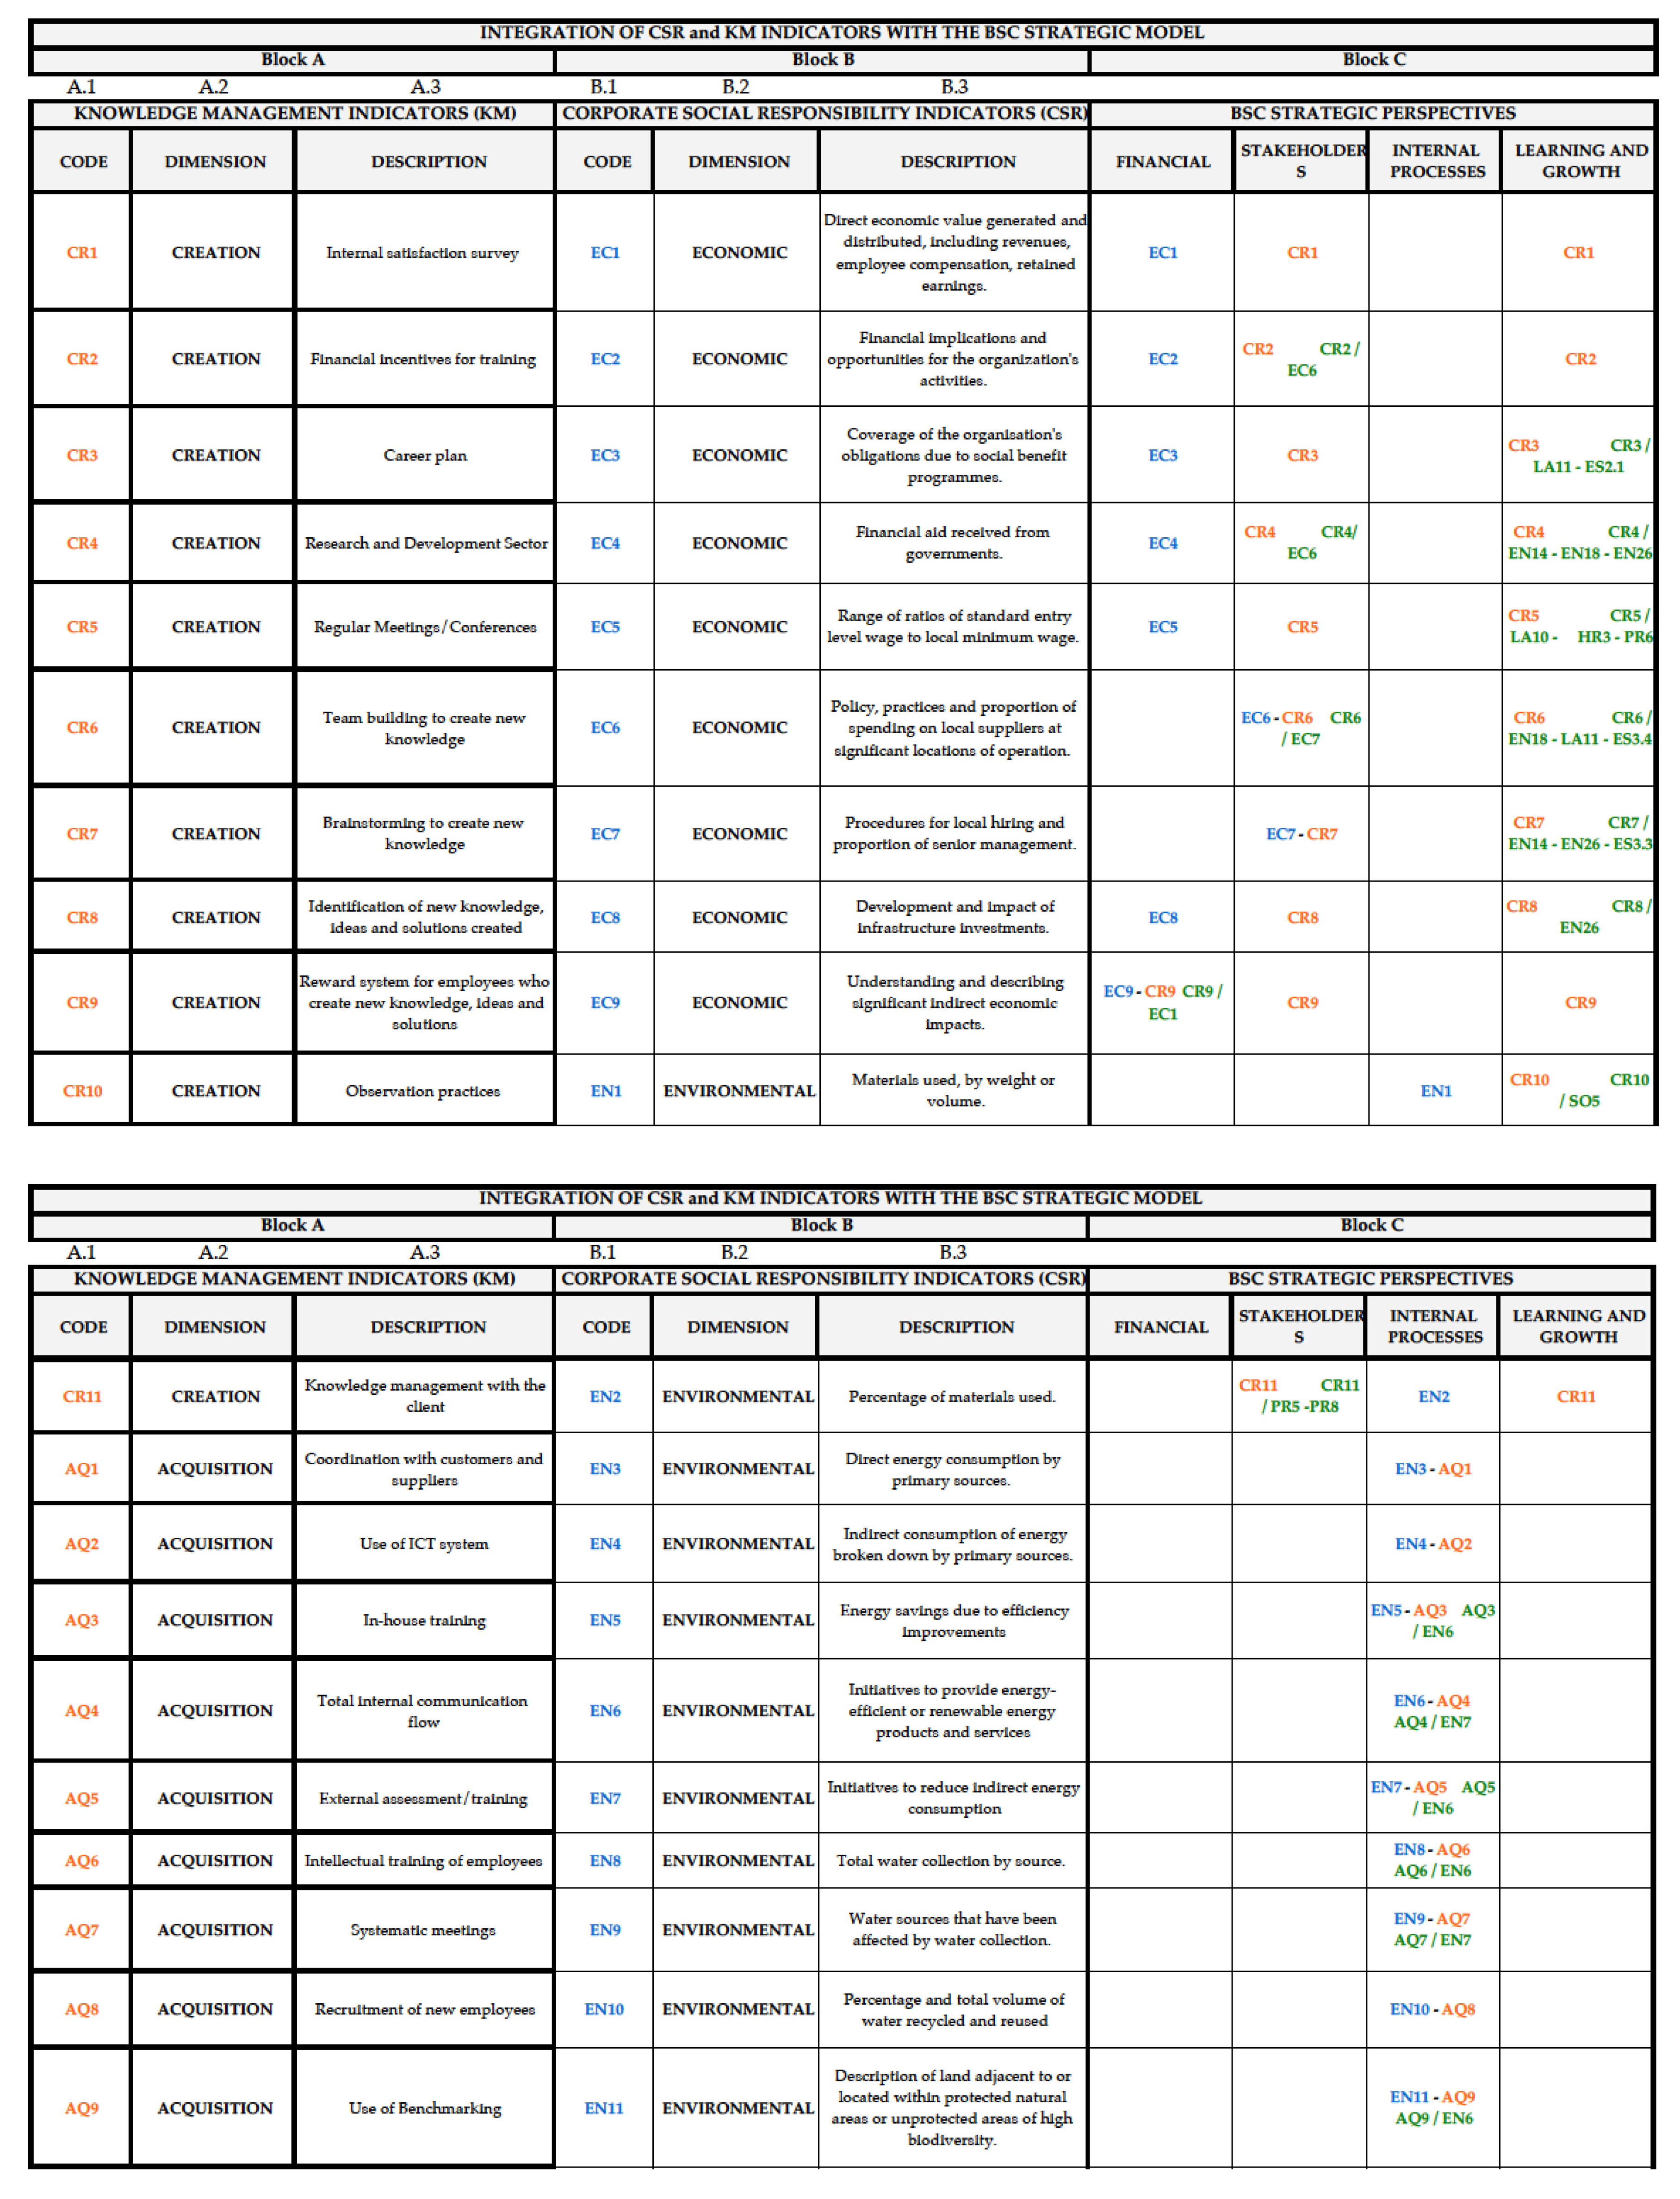
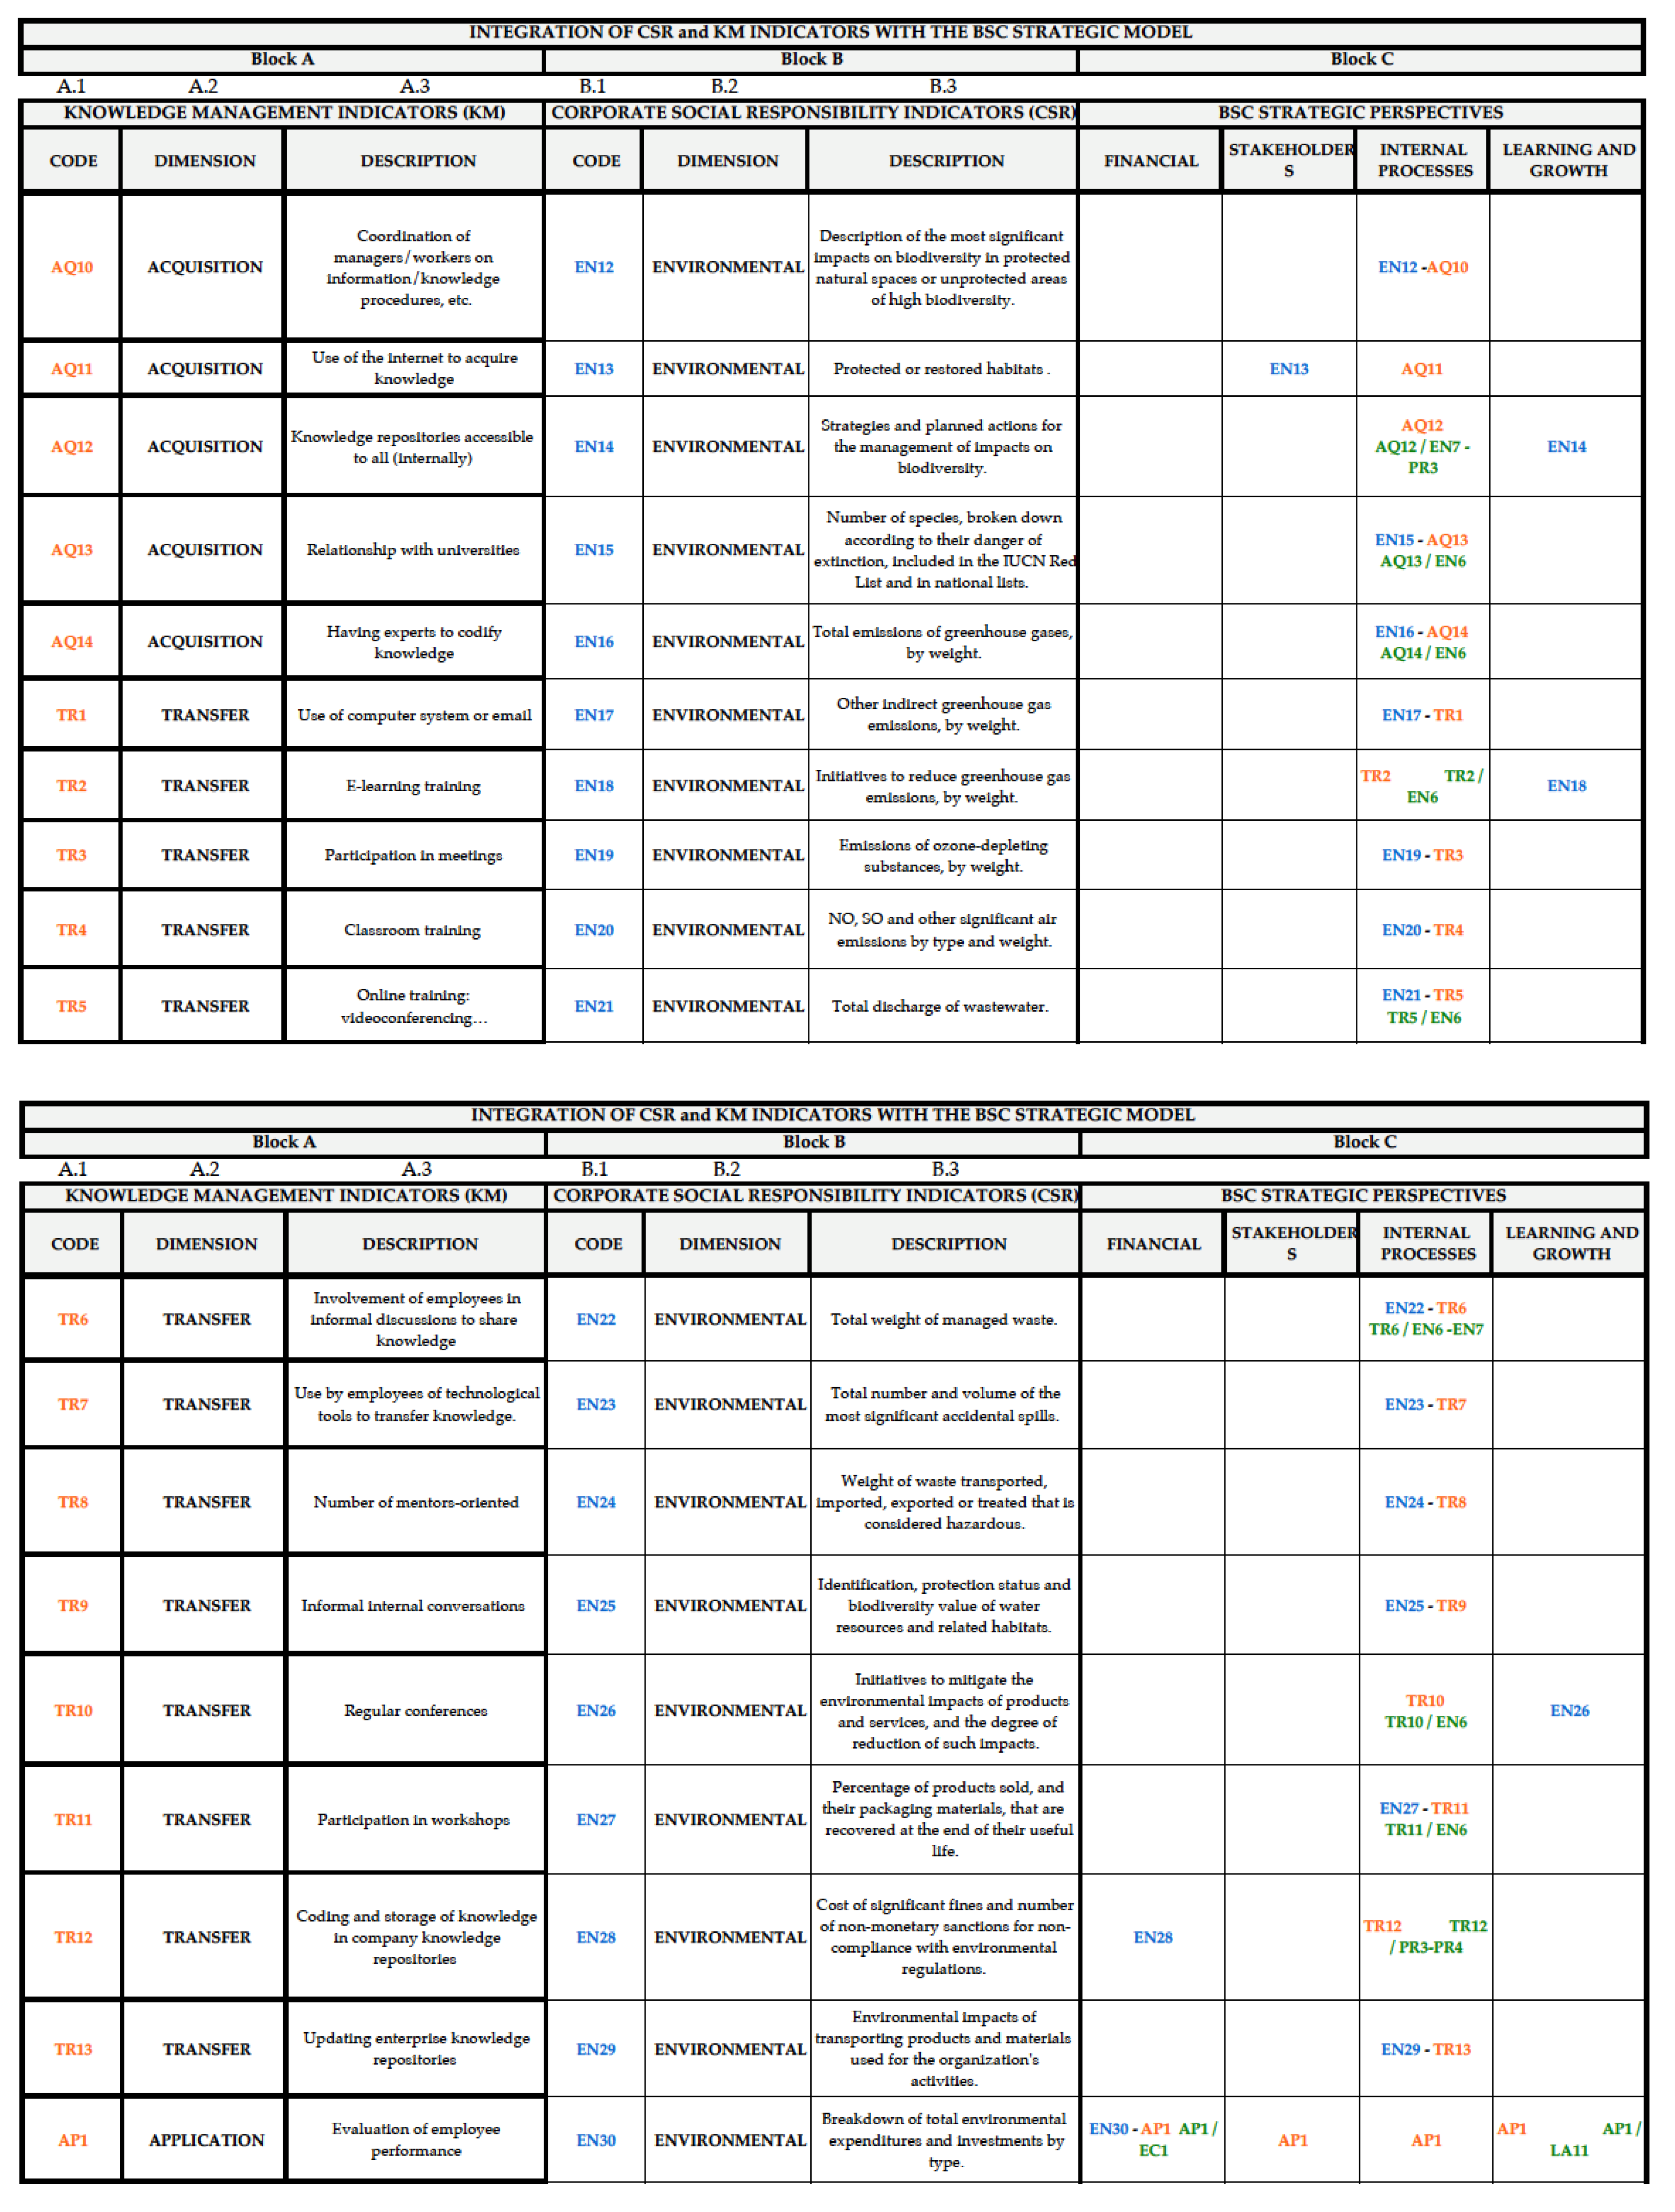
- The research of Mazorodze and Buckcley [71], Mehralian, Nazari and Ghasemzadeh [24], Gupta and Chopra [65] and Lee and Wong [25], together with the work of Pineyrua [38], allowed us to identify 45 indicators of KM in companies, compared with 13 in the original work (Column A.1 of Block A of Appendix A).
- Subsequently, based on the work of Lyu, Zhou and Zhang [75] and Kefe [79], together with Pineyrua’s [38] “knowledge creation process”, the mapping of these 45 indicators was realized with each of the perspectives of the BSC (Column A.2 of Block A of the table in Appendix A).
- In the third stage, the KM indicators were integrated with the BSC perspectives and indicators defined in Muñoz’s [39] work. The result is shown in Block C of the table in Appendix A. To achieve this result, the classification criteria shown in Table 2 have been considered.
3.1. Identification of KM and CSR Indicators in an SME
Once the KM and CSR indicators had been identified and classified, and their relationship with the BSC’s perspectives had been established, it was necessary to compile information from the company again, as it was not the time to collect everything related to KM; furthermore, we had to do it with the same methodology used by Pineyrua [38].
The company used for the validation of the model is an SME, founded in 2007, dedicated to providing consulting and training services in continuous improvement through the design and implementation of quality assurance systems (according to ISO 9000 standards) and with EFQM Model of excellence for the management of their organizations.
With the data from the interviews, conducted in person with the project manager, the director of strategy and excellence areas and a senior consultant, and according to the model questionnaire used in Pineyrua’s [38] work, the company’s KM indicators were identified and classified, as well as its degree of commitment and implementation of a Knowledge Management system.
These indicators of KM were integrated with the CSR indicators registered by Muñoz [39] in the same company, while identifying which were being measured, which were susceptible to being measured or evaluated and which are not applicable to this company. In Table 3 and Table 4, all the identified indicators are synthesized.
3.2. Integrated Management Model (BSC + CSR + KM) in a Consulting SME
This consulting SME is managed through its own innovative management system (it is registered). This system has been developed and implemented internally with the aim of using it as a key tool to achieve excellence in management. This system is called “7 + 1 Level Model”. The levels, from bottom up, are:
- Level 1. Resources and Assets: These are the material and financial resources available to the organization and necessary to carry out its activity. The fundamental activities included in this level are knowledge and study of costs of each of the 7 + 1 Corporate Levels, as well as the income of the different productive units; control of margins by level; development of a budget, annual with systematic monthly monitoring; planning and control of investments; provision of the necessary financial guidelines; and management of purchases and suppliers.
- Level 2. Production and Services: Everything related to the productive activity of the company is included, with the products and services it offers. At this level, the organization’s production is planned and managed and the performance and compliance with the planning in each project is measured. The activities included in this level are definition of the organization’s service/product portfolio; production capacity and margins by product; analysis of products/services by profitability and useful life; and programming of multi-person and/or multi-task jobs and projects.
- Level 3. Quality System: Includes the management by processes of the organization and the systems implemented, whether quality, environmental management, prevention of occupational risks, energy management, etc. In addition, at this level, processes related to excellence and openness and monitoring of parts or actions aimed at continuous improvement are controlled, with all types of indicators.
- Level 4. Management—Improvement Groups: Managing the leadership of people, policies and strategy, other levels of the organization, meeting management, etc.
- Level 5. Staff: Includes management of the people who make up the organization. Personnel plans are managed for conciliation, training and the evaluation of people’s satisfaction. The activities developed are evaluation, selection, training and promotion of people (PIDE process); job maps, personnel maps; remuneration and incentive plans; and satisfaction of the people in the organization.
- Level 6. Customers—Commercial Process: Performs all activities related to customer management. It includes activities to attract new customers, information gathering to discover customers’ needs and requirements, offer processes, customer relations, customer portfolio management, satisfaction measurement, marketing, market research, etc.
- Level 7. Social: Includes everything that unites the company with society and the impact of its activity on it. It includes the legal requirements demanded by the administrations for the operation of the company, the corporate image, all the activities related to Corporate Social Responsibility, the management of external relations with public or private bodies and the management of alliances.
- Level 7 + 1. R + D + I: This level establishes one more part to be developed within each of the other seven levels, innovation, which must reach all areas of the organization. It represents excellence at all levels, and how, based on innovation and learning, the continuous improvement of the organization is sought. At this level, R&D and the design of new and innovative services are managed, as well as all the processes related to the monitoring of the environment, which allow the organization to be up to date with external innovations that can give rise to opportunities for improvement.
4. Conclusions
The KM indicators identified in the consulting firm present a high correlation with the mapping work between KM and BSC performed by Lyu, Zhou and Zhang [75]. This correlation has facilitated the interconnection of KM indicators with the four perspectives of BSC, through the processes of creation, acquisition, transfer and application of knowledge.
- From a financial perspective, the KM indicators identified (see Table 5) correspond to the “knowledge application” stage, and their objective is to improve the efficiency of the company’s management and productivity levels, taking into account the knowledge of the workers, and expressed through measurable financial indicators.
- The perspective of the stakeholders is linked to the processes of creation and application of knowledge. Through the indicators collected there, it is shown how the company responds to external changes, which is demonstrated through the quality, performance and support of the company’s products and services, in addition to developing innovation in its technologies and services.
- The work carried out corroborates the importance that KM has on the perspective of improving the company’s internal processes, as already indicated in Gupta and Chopra [64]. Just like in the mapping carried out by Lyu, Zhou and Zhang [75], for the service SME analyzed, the internal process perspective is the one that presents the highest number of KM processes. This allows us to analyze and manage the company’s capacity to acquire, transfer and apply knowledge, thus contributing to the improvement of its internal processes.
- For the company not only to maintain but also to improve its performance (growth), employees must learn, grow and innovate continuously. All these aspects are linked to the process of creation and the application of knowledge, which has a very high correlation with the learning and growth perspective of the BSC.
Table 6 shows the list of identified indicators and their relationship to the KM process and the BSC perspective.
The research carried out has allowed us not only to identify some KM indicators such as AP2 and AP4, CR5 and CR7, AQ1 and AQ12, TR4 and TR13, which shows that this company has a real process to manage knowledge, but also, and thanks to the use of the BSC by the company, it has a model for its comprehensive management, aligning objectives of all kinds: financial and non-financial. Coinciding with works such as those of Mehralian, Nazari and Ghasemzadeh [24], the KM indicators identified in the consulting SME are similar to the studies on performance measurement of KM indicators in SMEs conducted by Lee and Wong [25].
In this type of business, owners/managers are considered a main source of knowledge, which can be derived from indicators CR7, AQ7 and TR3.
- SMEs are highly dependent on external knowledge from customers and suppliers, as their sources of knowledge are limited, all of which are captured in indicators AQ1, CR11 and TR12.
- Indicators are also needed to assess how employees are acquiring knowledge, and indicators AP2, AP4, CR7, AQ5, AQ11, AQ12 and TR11 are often used for this purpose.
- Knowledge sharing in an SME occurs through informal activities, such as those listed in indicators TR6 and TR9, while the use of IT in SMEs is usually assessed using indicators AQ2, AQ11 and TR1.
For a knowledge-intensive company, such as the consulting firm studied, according to Mazorodze and Buckley [44], the most important KM process is knowledge transfer, followed by knowledge acquisition. The research results show a higher number of indicators related to the knowledge transfer process, a total of nine, and the knowledge acquisition process, also nine indicators and all within the perspective of the internal processes of the BSC.
The analysis of the CSR indicators carried out by Muñoz [39] on the same consulting SME showed that 66% of the indicators were measurable, although their integration and diagnosis by BSC perspective showed improvement ratios of 80% in the internal processes dimension, and around 45% in the learning and growth and stakeholders perspectives. All these aspects have been improved thanks to the incorporation of the KM indicated, and thanks to its integration in the company’s BSC, thus having a single control system in line with the recommendations of authors such as Hristov, Chirico and Appolloni [63].
Table 7 details (explicitly) the list of identified CSR indicators and their relationship with both the CSR process dimensions and the BSC perspective.
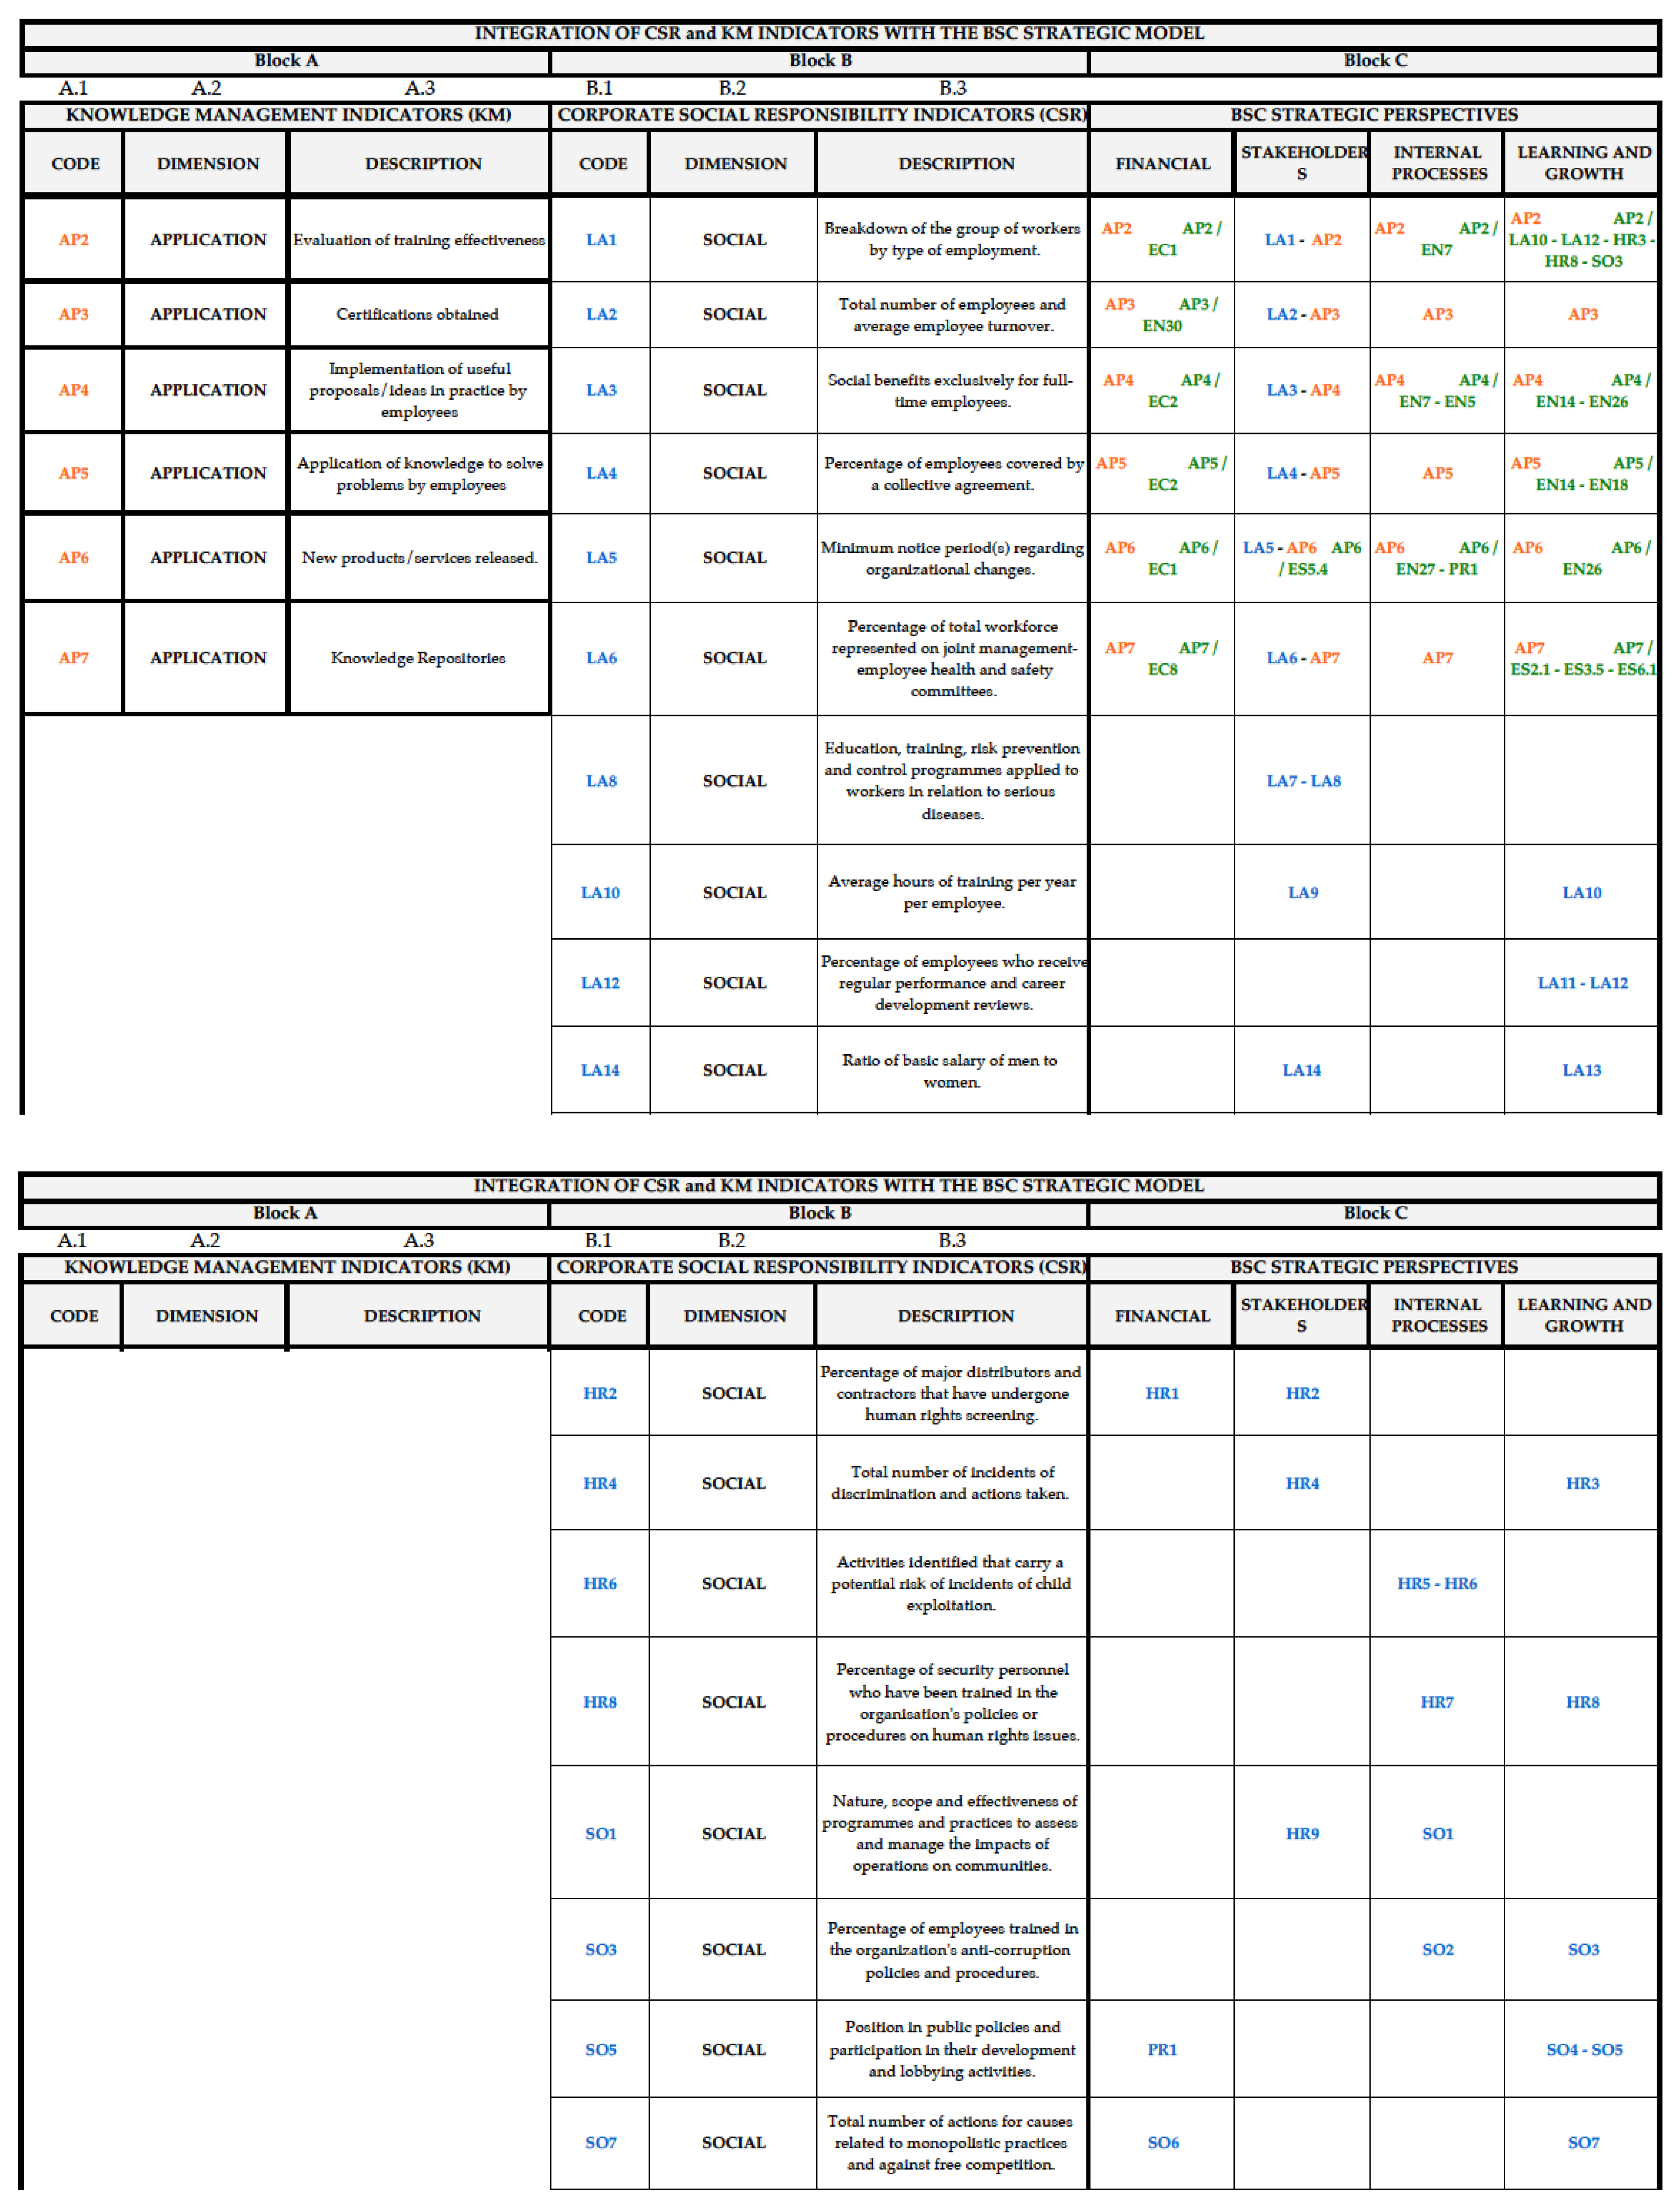
With the integration of the work of Pineyrua [38] and Muñoz [39], it has been possible to develop an operational plan, integrated into the management model used by the consulting SME, with the KM and CSR indicators (Figure A1 in Appendix A) and their link with the BSC perspectives. The use of this new set of indicators will provide better information on the performance of the activities carried out and, consequently, better decision-making in the future.
This study shows how KM and CSR complement the vision of BSC [27,67,76] by facilitating the identification of critical factors and knowledge dissemination, with the aim of supporting BSC in building competitive strategies and adopting a CSR policy in SMEs.
Despite the good results obtained, this work must be tested with a greater number of companies. To do this, the first step is to provide the application with a good data input/output interface that allows its integration with the rest of the applications implemented in the companies, so that data processing is carried out with the greatest possible traceability and integrity. This step will feed the objectives back to Long Term (L.T.) and the operational objectives to Short Term (S.T.). Another aspect to take into account is the updating of CSR objectives, aligning them through step 1 (Section 2.1.) with the Sustainable Development Goals (SDGs) of the United Nations Development Program (UNDP).
Author Contributions
D.G.F.P. and A.R. conceived the presented idea and designed the work; Á.M.G. and J.A.P. carried out data collection and literature review. A.R. proposed the initial structure of the article and D.G.F.P. planned the methodology. D.G.F.P. carried out the presentation of the results after their interpretation, carried out in conjunction with Á.M.G., A.R. and J.A.P. The final critical review was conducted by A.R. and J.A.P. All authors have read and agreed to the published version of the manuscript.
Funding
This research received no external funding.
Institutional Review Board Statement
Not applicable.
Informed Consent Statement
Not applicable.
Data Availability Statement
Not applicable.
Conflicts of Interest
The authors declare no conflict of interest.
Appendix A
Figure A1.
Integration of CSR and KM Indicators with the BSC Strategic Model.


References
- Cardozo, E.; Velasquez de Naime, Y.; Rodríguez, C. El concepto y la clasificación de PYME en América Latina. Glob. Conf. Bus. Financ. Proc. 2012, 7, 1657–1668. [Google Scholar]
- International Finance Corporation. SME Governance Guidebook; Pennsylvania Avenue: Washington, DC, USA, 2019. [Google Scholar] [CrossRef]
- Turner, R.; Ledwith, A. Project Management in Small to Medium-Sized Enterprises: Fitting the Practices to the Needs of the Firm to Deliver Benefit. J. Small Bus. Manag. 2016, 56. [Google Scholar] [CrossRef]
- Commission Regulation (EU) No 651/2014 of 17 June 2014 declaring certain categories of aid compatible with the internal market in application of Articles 107 and 108 of the Treaty. Off. J. Eur. Union 2014, L 187, 1–78.
- International Labour Organization—ILO. Small Matters: Global Evidence on the Contribution to Employment by the Self-Employed, Micro-Enterprises and SMEs; Executive Summary; International Labour Organization: Geneva, Switzerland, 2019. [Google Scholar]
- International Labour Organization—ILO. Small Matters: Global Evidence on the Contribution to Employment by the Self-Employed, Micro-Enterprises and SMEs; Report; International Labour Organization: Geneva, Switzerland, 2019. [Google Scholar]
- U.S. Bureau of Labor Statistics. United States Small Business Profile; 2018. Available online: https://www.bls.gov/web/cewbd/table_f.txt (accessed on 5 March 2021).
- Gouardères, F. Small and Medium-Sized Enterprises. Fact Sheets on the European Union; European Parliament: Brussels, Belgium, 2021; Available online: https://www.europarl.europa.eu/factsheets/en/sheet/63/small-and-medium-sized-enterprises (accessed on 3 April 2021).
- Ministerio de Industria, Comercio y Turismo. Cifras Pyme Marzo 2021; Ministerio de Industria, Comercio y Turismo: Madrid, Spain, 2021. [Google Scholar]
- Muñoz, A.E.; Mayor, M.P. Las pyme en América Latina, Japón, la Unión Europea, Estados Unidos y los clúster en Colombia. Adm. Desarro. 2015, 45, 7–24. [Google Scholar] [CrossRef]
- Henriquez, L. Políticas para las MIPYMES Frente a la Crisis. Conclusiones de un Estudio Comparativo de América Latina y Europa; Documento de Trabajo; OIT: Geneva, Switzerland; EuropeAid: Brussels, Belgium, 2009. [Google Scholar]
- OECD. OECD SME and Entrepreneurship Outlook 2019; Publishing: Paris, France, 2019. [Google Scholar] [CrossRef]
- Moral-Benito, E. Growing by learning: Firm-level evidence on the size-productivity nexus. SERIEs 2018, 9, 65–90. [Google Scholar] [CrossRef] [Green Version]
- Cámara, L.; Lozano, J. Understanding Cloud Computing Market Dynamics in Europe; BBVA Research; Digital Economy and Digital Regulation: Madrid, Spain, 2019. [Google Scholar]
- Camison, C.; de Lucio, J. La competitividad de las PYMES españolas ante el reto de la globalización. Econ. Ind. 2010, 375, 19–40. [Google Scholar]
- Campo, S.; Jiménez, J. El capital directivo y las buenas prácticas de gestión de las PYMES españolas. Econ. Ind. 2019, 414, 93–106. [Google Scholar]
- FAEDPYME, Fundación para el Análisis Estratégico y Desarrollo de la Pyme. Análisis Estratégico para el Desarrollo de la PYME en España: Digitalización y Responsabilidad Social; FAEDPYME: Madrid, Spain, 2018; ISBN 978-84-17619-75-6. [Google Scholar]
- OECD. OECD Compendium of Productivity Indicators 2019; OECD Publishing: Paris, France, 2019. [Google Scholar] [CrossRef]
- CEPYME, Confederación Española de la Pequeña y Mediana Empresa. Guía para Pymes ante los Objetivos de Desarrollo Sostenible; Consejo General de Economistas de España, Red Española del Pacto Mundial de Naciones Unidas: Madrid, Spain, 2019; ISBN 978-84-86658-78-6. [Google Scholar]
- Communication from the Commission to the Council, the European Parliament, the European Economic and Social Committee and the Committee of the Regions—“Think Small First”—A “Small Business Act” for Europe {SEC(2008) 2101} {SEC(2008) 2102} /* COM/2008/0394 Final. Available online: https://eur-lex.europa.eu/legal-content/EN/TXT/PDF/?uri=CELEX:52008DC0394&from=EN (accessed on 4 March 2021).
- Federal Ministry for Economic Affairs on behalf of the SME Envoys Network. European SME-Action Programme; Federal Ministry for Economic Affairs: Madrid, Spain, 2017. [Google Scholar]
- Ministerio de Industria, Comercio y Turismo. Marco Estratégico en Política de Pyme 2030; Ministerio de Industria, Comercio y Turismo: Madrid, Spain, 2019. [Google Scholar]
- Catoiu, I.; Tudor, L.; Bisa, C. Knowledge-intensive business services and business Consulting services in Romanian changing economic environment. Amfiteatru Econ. J. 2016, 18, 40–54. Available online: http://hdl.handle.net/10419/168986 (accessed on 16 March 2021).
- Mehralian, G.; Nazari, J.A.; Ghasemzadeh, P. The effects of knowledge creation process on organizational performance using the BSC approach: The mediating role of intelectual capital. J. Knowl. Manag. 2018, 22, 802–823. [Google Scholar] [CrossRef]
- Lee, C.S.; Wong, K.Y. Development and validation of knowledge management performance measurement constructs for small and medium enterprises. J. Knowl. Manag. 2015, 4, 711–734. [Google Scholar] [CrossRef]
- Dneprovskaya, N.; Urintsov, A.; Komleva, N.; Staroverova, O. Evaluation Indicators of Knowledge Management in the State Service. In Proceedings of the 19th European Conference on Knowledge Management (ECKM 2018), Padua, Italy, 6–7 September 2018; pp. 182–189, ISBN 978-1-5108-7210-3. Available online: http://toc.proceedings.com/41358webtoc.pdf (accessed on 5 March 2021).
- Ling, Y.H. Influence of corporate social responsibility on organizational performance Knowledge management as moderator. Vine J. Inf. Knowl. Manag. Syst. 2019, 49, 327–352. [Google Scholar] [CrossRef]
- Iwamoto, H.; Suzuki, H. An empirical study on the relationship of corporate financial performance and human capital concerning corporate social responsibility: Applying SEM and Bayesian SEM. Cogent Bus. Manag. 2019, 6. [Google Scholar] [CrossRef]
- Öberseder, M.; Schlegelmilch, B.B.; Murphy, P.E.; Gruber, V. Consumers’ perceptions of corporate social responsibility: Scale development and validation. J. Bus. Ethics 2014, 124, 101–115. [Google Scholar] [CrossRef] [Green Version]
- Latif, F.; Pérez, A.; Alam, W.; Saqib, A. Development and validation of a multi-dimensional customer-based scale to measure perceptions of corporate social responsibility (CSR). Soc. Responb. J. 2019, 15, 492–512. [Google Scholar] [CrossRef] [Green Version]
- Redondo, A.C.; Pascual, J.A.R.; Gento, A.M.M.; Muñoz, J.S. Sustainable balanced scorecard: Practical application to a services company. Managing Complexity. Lect. Notes Manag. Ind. Eng. 2014, 67–75. [Google Scholar] [CrossRef]
- Lorino, P.; Tarondeau, J.C. De la stratégie aux processus stratégiques. Rev. Fr. Gestion 2015, 253, 231–250. [Google Scholar] [CrossRef]
- Kaplan, R.; Norton, D. The balanced scorecard measures that drive performance. Harv. Bus. Rev. 1992, 70, 71–79. [Google Scholar]
- Kaplan, R.; Norton, D. Using the balanced scorecard as a strategic management system. Harv. Bus. Rev. 2007, 85, 150–161. [Google Scholar]
- Karabece, K.; Gürbüz, T. An Integrated Balanced Scorecard and Fuzzy BOCR Decision Model for Performance Evaluation. Adv. Intell. Syst. Comput. 2019, 843–851. [Google Scholar] [CrossRef]
- Doorn, J.V.; Onrust, M.; Verhoef, P.C.; Bügel, M.S. The impact of corporate social responsibility on customer attitudes and retention—the moderating role of brand success indicators. Mark. Lett. 2017, 28, 607–619. [Google Scholar] [CrossRef] [Green Version]
- Gangi, F.; Mustilli, M.; Varrone, N. The impact of corporate social responsibility (CSR) knowledge on corporate financial performance: Evidence from the European banking industry. J. Knowl. Manag. 2019, 23, 110–134. [Google Scholar] [CrossRef]
- Pineyrua, D.G.F. A Criação do Conhecimento na Indústria de Celulose: Estudos de Casos Múltiplos. Ph.D. Thesis, Universidade Nove de Julho, São Paulo, Brazil, 2015. [Google Scholar]
- Muñoz, J.S. Cuadro de Mando Responsable: Aplicación Práctica en la Consultora 1A Consultores. Proyecto Fin de Carrera, Dirigido por A. Redondo Castán en la E.I. Industriales; Universidad de Valladolid: Valladolid, Spain, 2012. [Google Scholar]
- Clara, C.; de la Morena, J.; Cortés, H. Evolución y nuevas tendencias de Responsabilidad Social en las prácticas empresariales. Rev. Responsab. Soc. Empresa 2018, 29, 17–50. [Google Scholar]
- Villafán, K.B. Evolución Conceptual de La Responsabilidad Social. Rev. Fac. Contaduría Cienc. Adm. 2020, 5, 69–80. [Google Scholar]
- Latapí Agudelo, M.A.; Jóhannsdóttir, L.; Davídsdóttir, B. A literature review of the history and evolution of corporate social responsibility. Int. J. Corp. Soc. Responsib. 2019, 4. [Google Scholar] [CrossRef] [Green Version]
- Abhishek, T.; Bains, A. Evolution of Corporate Social Responsibility: A Journey from 1700 BC till 21st Century. Int. J. Adv. Res. 2013, 1, 788–796. [Google Scholar]
- Yevdokymova, M.; Zamlynskyi, V.; Minakova, S.; Biriuk, O.; Ilina, O. Evolution of corporate social responsibility applied to the concept of sustainable development. J. Secur. Sustain. Issues 2019, 8, 473–480. [Google Scholar] [CrossRef]
- Font, I.; López, M.; Pérez, S. La Responsabilidad Social Empresarial: Un Fenómeno en Evolución. In Políticas Públicas y Renovación Social en el Siglo XXI, 1st ed.; Editorial HESS, S.A.: Mexico City, Mexico, 2017; pp. 227–259. ISBN 978-987-1285-53-2. [Google Scholar]
- Lizcano-Prada, J.; Lombana, J. Responsabilidad Social Corporativa (RSC). Civ. Cienc. Soc. Hum. 2018, 18, 119–134. [Google Scholar] [CrossRef]
- Puentes, A.; Lis Gutiérrez, M. Medición de la responsabilidad social empresarial: Una revisión de la literatura (2010–2017). Rev. Suma Neg. 2018, 9, 145–152. [Google Scholar]
- Global Reporting Initiative (GRI). GRI and ISO 26000: How to Use the GRI Guidelines in Conjunction with ISO 26000; Global Reporting Initiative: Amsterdam, The Netherlands, 2011; ISBN 978-90-8866-041-2. [Google Scholar]
- Hansen, E.G.; Schaltegger, S. The Sustainability Balanced Scorecard: A Systematic Review of Architectures. J. Bus. Ethics 2016, 133, 193–221. [Google Scholar] [CrossRef]
- Epstein, M.J.; Wisner, P.S. Using a Balanced Scorecard to Implement Sustainability. Environ. Qual. Manag. 2001, 11, 1–10. [Google Scholar] [CrossRef]
- Epstein, M.J.; Wisner, P.S. Good Neighbors: Implementing Social and Environmental Strategies with the BSC. In Balanced Scorecard Report; Reprint Number B0105C; Harvard Business School: Cambridge, MA, USA, 2001. [Google Scholar]
- Rohm, H.; Montgomery, D. Link Sustainability to Corporate Strategy Using the Balanced Scorecard; The Balanced Scorecard Institute: Cary, NC, USA, 2011. [Google Scholar]
- Figge, F.; Hahn, T.; Schaltegger, S.; Wagner, M. The sustainability balanced scorecard—Linking sustainability management to business strategy. Bus. Strategy Environ. 2002, 11, 269–284. [Google Scholar] [CrossRef]
- Valmohammadi, C.; Ahmadi, M. The impact of knowledge management practices on organizational performance. A balanced scorecard approach. J. Enterp. Inform. Manag. 2015, 28, 131–159. [Google Scholar] [CrossRef]
- Nguyen, D.; Ngo, T.; Nguyen, R.; Cao, H.; Pham, H. Corporate social responsibility, balanced scorecard system and financial performance in the service sector: The case of Vietnam. Manag. Sci. Lett. 2019, 9, 2215–2228. [Google Scholar] [CrossRef]
- Shafiee, M.; Hosseinzadeh, F.L.; Saleh, H. Supply chain performance evaluation with data envelopment analysis and balanced scorecard approach. Appl. Math. Model. 2014, 38, 5092–5112. [Google Scholar] [CrossRef]
- Jones, P. Strategy Mapping for Learning Organizations: Building Agility into Your Balanced Scorecard; Rutledge: Abingdon-on-Thames, UK, 2016; ISBN 978-0-566-08811-7. [Google Scholar]
- Niven, P.R. Balanced Scorecard Evolution: A Dynamic Approach to Strategy Execution; John Wiley & Sons: Hoboken, NJ, USA, 2014; ISBN 978-1-118-72631-0. [Google Scholar]
- Smith, R.F. Business Process Management and the Balanced Scorecard: Using Processes as Strategic Drivers; John Wiley & Sons: Hoboken, NJ, USA, 2007; ISBN 978-0-470-04746-0. [Google Scholar]
- Wiraeus, D.; Creelman, J. Agile Strategy Management in the Digital Age: How Dynamic Balanced Scorecards Transform Decision Making, Speed and Effectiveness; Palgrave MacMillan: London, UK, 2019. [Google Scholar] [CrossRef]
- Bhagwat, R.; Sharma, M.K. Performance measurement of supply chain management: A balanced scorecard approach. Comput. Ind. Eng. 2007, 53, 43–62. [Google Scholar] [CrossRef]
- Pérez, C.A.; Montequín, V.R.; Fernandéz, F.O.; Balsera, J.V. Integration of Balanced Scorecard (BSC), Strategy Map, and Fuzzy Analytic Hierarchy Process (FAHP) for a Sustainability Business Framework: A Case Study of a Spanish Software Factory in the Financial Sector. Sustainability 2017, 9, 527. [Google Scholar] [CrossRef] [Green Version]
- Hristov, I.; Chirico, A.; Appolloni, A. Sustainability Value Creation, Survival, and Growth of the Company: A Critical Perspective in the Sustainability Balanced Scorecard (SBSC). Sustainability 2019, 11, 2119. [Google Scholar] [CrossRef] [Green Version]
- Nikolaou, I.E.; Tsalis, T.A. Development of a Sustainable Balanced Scorecard Framework; Ecological Indicators; Elsevier: Amsterdam, The Netherlands, 2013; Volume 34, pp. 76–86. [Google Scholar]
- Gupta, V.; Chopra, M. Gauging the impact of knowledge management practices on organizational performance—A balanced scorecard perspective. J. Inform. Knowl. Manag. Syst. 2018, 48, 21–46. [Google Scholar] [CrossRef]
- Muñumer, H. La Responsabilidad Social de la Empresa. Actualización del Sistema de Gestión Ética (SGE21:2008) e Integración de los Criterios de la Guía de Responsabilidad Social ISO26000:2010. Proyecto Fin de Carrera, dirigido por A. Redondo Castán en la E.I. Industriales; Universidad de Valladolid: Valladolid, Spain, 2011. [Google Scholar]
- Iazzolino, G.; Laise, D.; Gabriele, R. Knowledge-based strategies and sustainability: A framework and a case study application. Meas. Bus. Excel. 2017, 21, 152–174. [Google Scholar] [CrossRef]
- Nonaka, I.; Takeuchi, H. The Knowledge-Creating Company: How Japanese Companies Create the Dynamics of Innovation; Harvard Business Press: Boston, MA, USA, 1997. [Google Scholar]
- Hanif, M.I.; Malik, F.; Hamid, A.B.A. The effect of knowledge management and entrepreneurial orientation on organization performance. J. Entrep. Educ. 2018, 21, 1–13. [Google Scholar]
- Pour, M.J.; Zadeh, Z.K.; Zadeh, N.A. Designing an Integrated Methodology for Knowledge Management Strategic Planning. The roadmap toward strategic alignment. Knowl. Manag. Strateg. Plan. 2018, 48, 373–387. [Google Scholar] [CrossRef]
- Mazorodze, A.H.; Buckley, S. Knowledge management in knowledge-intensive organisations: Understanding its benefits, processes, infrastructure and barriers. S. Afr. J. Inform. Manag. 2019, 1, 1–6. [Google Scholar] [CrossRef]
- Mills, A.M.; Smith, T.A. Knowledge management and organizational performance: A decomposed view. J. Knowl. Manag. 2011, 15, 156–171. [Google Scholar] [CrossRef]
- Arora, R. Implementing KM—A balanced scorecard approach. J. Knowl. Manag. 2002, 240–249. [Google Scholar] [CrossRef]
- Wake, N.J. The use of the balanced scorecard to measure knowledge work. Intern. J. Product. Perfor. Manag. 2015, 64, 590–602. [Google Scholar] [CrossRef]
- Lyu, H.; Zhou, Z.; Zhang, Z. Measuring Knowledege Management Performance in Organizations: Na Integrative Framework of Balanced Scorecard and Fuzzy Evaluation. Information 2016, 7, 29. [Google Scholar] [CrossRef] [Green Version]
- Rajnoha, R.; Lesníková, P.; Krajcík, V. Influence of business performance measurement systems and corporate sustainability concept to overal business performance: “Save the planet and keep your performance”. Bus. Adm. Manag. 2017, 1, 111–127. [Google Scholar] [CrossRef]
- Bumberová, V.; Milichovský, F. Sustainability Development of Knowledge-Intensive Business Services: Strategic Actions and Business Performance. Sustainability 2019, 11, 5136. [Google Scholar] [CrossRef] [Green Version]
- Chen, H.; Miao, Y. Knowledge Management for SMEs Based on the Balanced Scorecard. In Proceedings of the International Conference on Management and Service Science, Wuhan, China, 24–26 August 2010. [Google Scholar] [CrossRef]
- Kefe, I. The Determination of Performance Measures by using a Balanced Scorecard Framework. Found. Manag. 2019, 11, 43–56. [Google Scholar] [CrossRef] [Green Version]
Figure 1.
Percent of employees by sector: world, Europe and Spain. (Source: The World Bank Group, International Labour Organization, ILOSTAT database. https://data.worldbank.org/, accessed on 5 March 2021).
Figure 1.
Percent of employees by sector: world, Europe and Spain. (Source: The World Bank Group, International Labour Organization, ILOSTAT database. https://data.worldbank.org/, accessed on 5 March 2021).

Figure 2.
Evolution and theoretical development of CSR. Source: Based on Lizcano and Lombana [46].
Figure 2.
Evolution and theoretical development of CSR. Source: Based on Lizcano and Lombana [46].

Figure 3.
Strategy map of the SBSC in a sample company. Source: Figge et al. [53] p. 282.
Figure 3.
Strategy map of the SBSC in a sample company. Source: Figge et al. [53] p. 282.

Figure 4.
Integration of CSR and BSC in a services SME and its implementation [31].
Figure 4.
Integration of CSR and BSC in a services SME and its implementation [31].

Figure 5.
Proposed knowledge creation process [38].
Figure 5.
Proposed knowledge creation process [38].

Figure 6.
Integration scheme.


Table 1.
Based on Strategic Framework in SME Policy 2030, Ministry of Industry, Trade and Tourism of Spain, 2019 [22].
Table 1.
Based on Strategic Framework in SME Policy 2030, Ministry of Industry, Trade and Tourism of Spain, 2019 [22].
| Governance model: It is the cornerstone in the development of the Strategic Framework, and its main objective is to support the monitoring and subsequent achievement of the lines of action. | |
| Challenges and opportunities | Lines of action |
| Organisational structure | Its organisational and functional structure must be aligned with the strategic lines of action. |
| Monitoring model | Defining the right set of indicators, and Establish the necessary instruments to carry out a complete and comprehensive monitoring of indicators in accordance with the defined strategy. |
| Strategic lines | |
| Challenges and opportunities | Lines of action |
| Entrepreneurship | LA1. Boosting skills development and training for employment LA2. Prestigate and promote vocational training LA3. Strengthening the SME culture and fostering entrepreneurship LA4. Measures to stimulate the entrepreneurial ecosystem LA5. Continue to make progress in the simplification of setting up an SME, as well as in the improvement and development of support services. LA6. Encourage and simplify the transfer of businesses LA7. Measures to promote second chance |
| Business management and talent | LA8. Measures for attracting and retaining talent in SMEs. LA9. Improving business management training. LA10. Advancing the digital skills of employers and employees LA11. Encourage intra-entrepreneurship LA12. Promoting corporate social responsibility |
| Regulatory framework | LA13. Encourage the creation of larger companies through the merger of existing SMEs. LA14. Advise SMEs through personalised support that favours their growth. LA15. Simplify sectoral regulation LA16. Improve inter-administrative coordination in relation to SME activity. LA17. Encourage cooperation between large companies and SMEs: Encourage cooperation between large and small companies through procurement to enable the latter to improve their management and productivity. LA18. Encourage public procurement of SMEs by the Administration. |
| Funding | LA19. Promote alternatives to bank financing LA20. Expanding financial availability at different stages of the life cycle of SMEs LA21. Reorient taxation conditions to improve SME financing. LA22. Simplifying access to aid for SMEs LA23. Strengthening mechanisms to reduce late payments LA24. Development of a framework on Moveable Collateral LA25. Strengthen the Spanish guarantee system and promote its knowledge and use among SMEs. LA26. Promote information and training on public finance LA27. Promoting good governance and financial transparency of SMEs LA28. Encourage more flexible access requirements and promote the advantages of the Alternative Stock Market and the Alternative Fixed Income Market, as well as crowdfunding and crowdlending platforms. LA29. Other financing measures |
| Innovation and digitalisation | LA30. Incorporate digital tools in the relationship between SMEs and the Administration. LA31. Facilitating the digital transformation of SMEs as a key element in their life cycle. LA32. Fostering business collaboration and the development of business clusters LA33. Encourage innovation programmes among SMEs as well as the development of innovative ecosystems. LA34. One-stop shop for innovation LA35. Funding for digitisation LA36. Develop assistance programmes for SMEs in Industry 4.0. LA37. Supporting the uptake of enabling technologies—KETs LA38. Promote awareness among SMEs on how to protect their industrial property rights as well as intellectual property. LA39. Funding for innovation |
| Sustainability | LA40. Promoting environmental information, communication and dissemination LA41. Make progress in the simplification and implementation of environmental regulation. LA42. Facilitating the transformation to a circular economy LA43. Facilitating the transition to a low-carbon economy |
| Internationalization | LA44. Increase information on the resources and services available for internationalization assistance. LA45. Favour the integral accompaniment of the company in its internationalization process. LA46. Increase the base of companies that export regularly. LA47. Ensure financial support for internationalization operations. LA48. Encourage foreign investment in Spain LA49. Facilitating the digitalization of SMEs as a dynamizing element of their export activity. LA50. Expand and strengthen the presence of Economic and Commercial Offices in the external network |
Yellow parts represent the aspects of the European and Spanish strategy that our work addresses.
Table 2.
Criteria for the classification of CSR and KM indicators in strategic perspectives (BSC).
| Perspective | Items Included |
|---|---|
| Financial | Economic profitability. Sales and income, expenses and costs. Sources of income: customers, products, markets. Improvement of tangible and intangible economic assets. Creation of value and turnover. Financial management and structure (including threats, opportunities and risks). Investments. Sanctions. |
| Stakeholders | Stakeholder management (shareholders, partners, staff, customers, suppliers, competition, society, public administrations, financial institutions, associations, universities, NGOs, media). Environmental management not related to the direct activity developed in the company. Information and communication systems (ICT). Commitment to the principles of social responsibility. Education, training, advice, prevention and control of occupational risks. |
| Internal Processes | Operational process management. Innovation management. Management of labor and environmental regulation processes directly related to the business activity. |
| Learning and Growth | Corporate governance and management. Training and development plans and courses. Initiatives, improvements, proposals, etc. |
Source: Muñoz [39].
Table 3.
Diagnosis of KM indicators in SMEs.
| Indicators | Financial | Stakeholders | Internal Processes | Learning and Growth | ||||||
|---|---|---|---|---|---|---|---|---|---|---|
| Type | No. of Indicators | % | No. of Indicators | % | No. of Indicators | % | No. of Indicators | % | No. of Indicators | % |
| Currently being measured | 27 | 60.0 | 4 | 50.0 | 9 | 52.9 | 22 | 64.7 | 9 | 50.0 |
| Susceptible to measurement | 12 | 26.7 | 3 | 37.5 | 6 | 35.3 | 8 | 23.5 | 6 | 33.3 |
| Not applicable | 6 | 13.3 | 1 | 12.5 | 2 | 11.8 | 4 | 11.8 | 3 | 16.7 |
| TOTAL | 45 | 100 | 8 | 100 | 17 | 100 | 34 | 100 | 18 | 100 |
Source: Author’s elaboration.
Table 4.
Diagnosis of CSR indicators in SMEs.
| Indicators | Financial | Stakeholders | Internal Processes | Learning and Growth | ||||||
|---|---|---|---|---|---|---|---|---|---|---|
| Type | No. of Indicators | % | No. of Indicators | % | No. of Indicators | % | No. of Indicators | % | No. of Indicators | % |
| Currently being measured | 35 | 34.3 | 11 | 64.7 | 9 | 37.5 | 3 | 9.1 | 12 | 42.9 |
| Susceptible to measurement | 32 | 31.4 | 1 | 5.9 | 7 | 29.2 | 12 | 36.4 | 12 | 42.9 |
| Not applicable | 35 | 34.3 | 5 | 29.4 | 8 | 33.3 | 18 | 54.5 | 4 | 14.3 |
| TOTAL | 102 | 100 | 17 | 100 | 24 | 100 | 33 | 100 | 28 | 100 |
Source: Author’s elaboration.
Table 5.
Aspects of operational planning.
| Innovative Feature | Management Aspect | Creative Aspect | |||
|---|---|---|---|---|---|
| Level | Content | Activities to Build Capacity to Adapt to Opportunities or Threats | Implementation and Planning of Innovation Activities | Results and Feedback of Innovation Actions | Total Indicators by Level |
| 7 + 1 | R + D + i | Identification of Opportunities, Risks and Threats CR4, CR6, CR7, CR8, AQ3, AQ4, AQ5, AQ6, AQ7, AQ9, AQ12, AQ13, AQ14, TR2, TR6, TR10, TR11, AP2, AP4, AP6 | Management of Opportunities, Risks and Threats | Developments in progress | KM—20 |
| 7 | Social | Social presence | Partnership Management ES2.3, ES4.1, ES4.2, ES4.4, ES4.5, ES5.5 | Corporate Social Responsibility AP7 HR9, ES5.4, ES6.1, EN13, SO7 | KM—1 CSR—11 |
| 6 | Customers | Sales Development | Customer portfolio management CR11 PR5 | Marketing CR11 PR7, PR8, PR6 | KM—2 CSR—4 |
| 5 | Staff | Planning for people’s needs | HR Management CR3, CR6, AP2, AP7 EC5, EC7, LA1, LA2, LA4, LA6, LA9, LA12, LA13, LA14, HR8, ES2,1, ES2.2, ES3.5 | People’s satisfaction CR3, CR5, AP1, AP2 EC3, LA3, LA7, HR3, HR4, SO3, ES3.7, LA10, LA11, LA8 | KM—8 CSR—24 |
| 4 | Management | Delivery CR7 ES3,3, EN18, EN26 | Internal Management LA5, SO1, SO2, SO4, SO5, 4, 11, ES1.1, ES3.2, ES3.8 | Learning and improvement CR6 ES3.1, ES3.4 | KM—2 CSR—14 |
| 3 | Quality System | System AP4, AP5 EC2, EN6, EN7 | Improvement Management CR4, CR7, AP4, AP5 EN1, EN2, EN3, EN4, EN5, EN11, EN12, EN14, EN15, EN25, EN29 | Customer Satisfaction EN8, EN9, EN10, EN16, EN17, EN19, EN20, EN21, EN22, EN23, EN24, EN27 | KM—6 CSR—26 |
| 2 | Production and Services | Production planning | Management of productive resources AQ12, TR12, AP6 EC6, PR1, PR3, HR2, HR5, HR6, HR7 | Productivity TR12 PR2, PR4 | KM—4 CSR—9 |
| 1 | Resources and Assets | Investment Plan EC4 | Economic and financial management CR2, AP7 ES 5.2, EC8, EC9, EN30, HR1 | Economic Results CR9, AP1, AP2, AP6 EC1, EN28, SO6, SO8, PR9, 7.1, 7.2, 7.3 | KM—6 CSR—14 |
| Total indicators | KM—23 CSR—7 | KM—14 CSR—53 | KM—12 CSR—42 | KM—49 CSR—102 | |
Bold values are values identified as most relevant and/or critical for the service company analysed. Source: Author’s elaboration.
Table 6.
Indicators’ relationship to the KM process and the BSC perspective.
| KM Process | Indicators | BSC Perspectives |
|---|---|---|
| Application of Knowledge | AP1: Evaluation of employee performance AP2: Evaluation of the effectiveness of the training carried out AP4: Evaluation of the proposals/idea applied by the employees AP6: Number of new products/services launched | Financial Stakeholders Internal Processes Learning and Growth |
| Knowledge Creation | CR3: Career plan CR4: Research and development sector CR5: Fortnightly conferences CR7: Brainstorming sessions to create new knowledge CR11: Customer relationship management | Stakeholders Learning and Growth |
| Acquisition of Knowledge | AQ1: Consultation with customers and suppliers AQ2: Use of computer system AQ3: Internal training AQ5: Searching for external training AQ7: Fortnightly lectures AQ8: Hiring new employees AQ9: Use of benchmarking AQ11: Use of the Internet to acquire knowledge AQ12: Access by the employee to the company’s knowledge repositories to acquire knowledge | Internal Processes |
| Transfer of Knowledge | TR1: Use of computer system or e-mail TR2: E-Learning training TR3: Participation in meetings TR4: Face-to-face training TR6: Participation of employees in informal discussions to share knowledge TR9: Internal informal discussions TR11: Participation in workshops TR12: Coding and storage of knowledge in the company’s knowledge repositories TR13: Updating of company knowledge repositories | Internal Processes |
Source: Author’s elaboration.
Table 7.
Relationship between indicators and CSR dimensions and BSC perspectives.
| CSR Dimensions | Indicators | BSC Perspectives |
|---|---|---|
| Economic | EC1: Direct economic value generated and distributed, including revenues, employee compensation, retained earnings. EC3: Coverage of the organization’s obligations due to social benefit programmes. EC4: Financial aid received from governments. EC5: Range of ratios of standard entry level wage to local minimum wage. EC7: Procedures for local hiring and proportion of senior management. | Financial Stakeholders |
| Environmental | EN28: Cost of significant fines and number of non-monetary sanctions for non-compliance with environmental laws and regulations. EN30: Breakdown of total environmental expenditures and investments by type. EN3: Direct energy consumption by primary source. EN7: Initiatives to reduce indirect energy consumption. EN8: Total water withdrawal by source. | Financial Internal Processes |
| Social | EN28: Cost of significant fines and number of non-monetary sanctions for non-compliance with environmental laws and regulations. EN30: Breakdown of total environmental expenditures and investments by type. PR9: Cost of significant fines for non-compliance with regulations concerning supply. ES5.2: Existence of actions linked to socially responsible investments. ES7.1: Percentage of liabilities corresponding to collective or irrevocable funds. ES7.2: Percentage distribution of surplus to collective or irrevocable funds. ES7.3: Percentage of surplus allocated to members of the organization or to the incorporation of persons. LA1: Breakdown of the collective of workers by type of employment. LA2: Total number of employees and average turnover. LA4: Percentage of employees covered by a collective bargaining agreement. LA14: Ratio of basic salary of men to women. PR5: Practices related to customer satisfaction and survey results. PR8: Total number of complaints regarding respect for privacy and leakage of customer data. ES4.1: Definition of a map of stakeholders focused on the organization. ES5.5: Number and type of cooperation activities carried out with other organizations. LA10: Average hours of training per year per employee. LA11: Programs for skills management and continuous training. LA12: Percentage of employees who receive regular performance and professional development evaluations. LA13: Composition of corporate governance bodies and diversity indicators staff. ES1.1: Description of a report that highlights the primacy of people and the corporate purpose over capital. ES2.1: Requirements for new members to join the organization ES2.2: Requirements and conditions for leaving the organization. ES2.3: Evolution of partners or members, describing the variation of registrations and cancellations. ES3.3: Working groups or spaces generated that favour the organization’s decision-making. ES3.7: Average actual participation in the highest decision-making bodies. ES3.8: Description of the preparatory process for the maximum body of social representation. ES6.1: Description of a report detailing the requirements and limitations of the management sovereignty of the organization’s maximum decision-making bodies. | Financial Stakeholders Learning and Growth |
Source: Author’s elaboration.
Publisher’s Note: MDPI stays neutral with regard to jurisdictional claims in published maps and institutional affiliations. |
© 2021 by the authors. Licensee MDPI, Basel, Switzerland. This article is an open access article distributed under the terms and conditions of the Creative Commons Attribution (CC BY) license (https://creativecommons.org/licenses/by/4.0/).
Share and Cite
MDPI and ACS Style
Ferber Pineyrua, D.G.; Redondo, A.; Pascual, J.A.; Gento, Á.M. Knowledge Management and Sustainable Balanced Scorecard: Practical Application to a Service SME. Sustainability 2021, 13, 7118. https://doi.org/10.3390/su13137118
AMA Style
Ferber Pineyrua DG, Redondo A, Pascual JA, Gento ÁM. Knowledge Management and Sustainable Balanced Scorecard: Practical Application to a Service SME. Sustainability. 2021; 13(13):7118. https://doi.org/10.3390/su13137118
Chicago/Turabian StyleFerber Pineyrua, Diego G., Alfonso Redondo, José A. Pascual, and Ángel M. Gento. 2021. "Knowledge Management and Sustainable Balanced Scorecard: Practical Application to a Service SME" Sustainability 13, no. 13: 7118. https://doi.org/10.3390/su13137118
Note that from the first issue of 2016, this journal uses article numbers instead of page numbers. See further details here.