Article

The Effect of Different Soil Tillage Systems and Crop Residues on the Composition of Weed Communities

by
Vaida Steponavičienė
*,
Aušra Marcinkevičienė
,
Lina Marija Butkevičienė
,
Lina Skinulienė
and
Vaclovas Bogužas
Institute of Agroecosystems and Soil Sciences, Faculty of Agronomy, Vytautas Magnus University, K. Donelaičio Str. 58, 44248 Kaunas, Lithuania
*
Author to whom correspondence should be addressed.
Agronomy 2021, 11(7), 1276; https://doi.org/10.3390/agronomy11071276
Submission received: 26 May 2021 / Revised: 16 June 2021 / Accepted: 21 June 2021 / Published: 23 June 2021
(This article belongs to the Special Issue Conservation Agriculture and Agroecological Weed Management)

Abstract

:
The composition of weed communities in agricultural crops is dependent on soil properties and the applied agronomic practices. The current study determined the effect of different tillage systems and crop residue on the soil weed community composition. The research programme encompassed 2013–2015 in a long-term field experiment located in the Experimental Station of Vytautas Magnus University in Lithuania. The soil type in the experimental field was qualified as Endocalcaric Stagnosol (Aric, Drainic, Ruptic, Amphisiltic). Weeds were categorised into communities according to soil pH, nitrogen and moisture indicators. The results of investigations were grouped using cluster analysis. Agricultural crops were dominated by different weed species depending on the soil pH and moisture. Weed species were relatively more frequent indicating nitrogen-rich and very nitrogen-rich soils. In the reduced tillage and no-tillage systems, an increase in the abundance of weed species indicating moderate acidity and low acidity, moderately wet and wet, nitrogen-rich and very nitrogen-rich soils was observed. The application of plant residues decreased the weed species abundance. In the reduced tillage and no-tillage systems, the quantitative distribution of weed was often uneven. By evaluating the association of weed communities with groups of different tillage systems with or without plant residues, their control can be optimised.

1. Introduction

Technologies to protect the environment, soil, resources, and tillage are rapidly being adopted in modern agriculture [1]. The popularity of reduced tillage systems is increasing worldwide [2]; however, the increased weeds caused by reduced tillage systems are among the main obstacles to their implementation [3]. Reduced soil tillage systems cause major impacts to weed species composition and weed population densities, and the impact of tillage on different weed groups varies, unlike direct sowing that increases the incidence of perennial and annual weeds [4,5,6].
Reduced weed populations in cultivated fields are evidence of the negative impacts of modern farming on farmland biodiversity [7]. Many experiments have confirmed the fundamental role of tillage intensity in the nutrition supplied by abundant and diverse weed species. The soil tillage system and climate conditions within an agricultural year influence the weeds in the crops. In minimum tillage plots, larger weeds have been recorded than in conventional tillage plots [8]. For instance, in some studies, the abundance of perennial weeds doubled when tillage intensity was reduced, and the change from a traditional to a conservation tillage system alters the disturbance regime, leading to a shift in the weed species composition [9,10]. The researchers identified that the tillage system affected the composition and functional attributes of the weed communities [11]. Weed communities under reduced tillage were potentially less competitive because they were shorter, with less affinity to nutrients. Conversely, weed communities under conventional tillage potentially have lower seed production with a lower abundance of perennial species. Understanding tillage effects on weed community dynamics can be challenging. The effects vary depending on the interactions with other management systems, environmental conditions, and weed biology, and it has been observed that surface residues lowered average soil temperatures and delayed the emergence of both crops and weeds [12,13]. The germination and growth of small-seeded annuals will suffer from restricted light availability, physical growth barriers, and potential allelopathic effects from surface residue. By increasing the number of residues, the emergence of all weed species was reduced [14].
Weed response is regulated by agronomic factors (such as crop selection and crop rotation practices, weed control methods, fertilisation, seed treatment, and soil cultivation) but is primarily determined by specific biological attributes and environmental conditions [15]. A weed community’s composition in agricultural crops is more dependent not on the crop species but on soil properties and the agronomic/management practices applied. No-ploughing, reduced tillage, and direct drilling result in increased weed incidence [16], particularly of perennial weeds [17]. The maximum population of weed plants was obtained, for most of the years, from the first 2–3 cm of undisturbed soil, but soil moisture near field capacity is necessary to obtain a maximum population density [18]. The indicator species system in Ellenberg is one of the most widely used and describes a species’ response to edaphic and climatic parameters compared to other species [19]. A small amount of data was provided about the effect of tillage systems and crop residues on the composition of weed communities; therefore, the current study aimed to determine the effect of different tillage systems and crop residue in the soil on weed community composition.

2. Materials and Methods

2.1. Site Description

The research took place during 2013–2015 in a long-term field experiment, initially set up in 1999, at the Experimental Station of Vytautas Magnus University (54°52′50″ N latitude and 23°49′41″ E). According to the latest edition of the international soil classification system (IUSS Working Group WRB, 2015), soil type in the experimental field was qualified as Endocalcaric Stagnosol (Aric, Drainic, Ruptic, Amphisiltic). The topsoil of the experimental site is very rich in content of available phosphorus (213.70 mg kg−1), and moderate in the content of available potassium (137.85 mg kg−1), pHKCl (7.6) and soil organic carbon (SOC) (16.6 g kg−1). The agroecosystems include spring oilseed rape (Brassica napus L.), winter wheat (Triticum aestivum L.), and spring barley (Hordeum vulgare L.)—the most popular crops grown in Lithuania.

2.2. Experiment Design and Agricultural Practices

The field experiment arranged as two factor. Factor A involved straw retention: 1. Without straw, for a control (R), and 2. With straw (S). Factor B involved tillage systems (Table 1).
The long-term experiment has a split-plot design with 4 replications and 48 plots. The initial plot size was 102 m2 (6 m × 17 m), and after segregation into experimental units, the harvested plot size was 30 m2 (15 m × 2.0 m).
After harvesting, the plots of treatments CP and SP were stubble-cultivated with a plough. The plots of only treatment CP were ploughed deeply in the autumn. The plots of treatment SL were shallow-cultivated with a cultivator with goose-feet coulters and disks at the 8–10 cm depth. The plots of treatments SR and GMR were tilled only with a rotovator before sowing. After the harvesting of cereals, the plots of GMR treatment were sown with a catch crop, white mustard for green manure. The plots of NT were not tilled either in the autumn or the spring.
In 2013, before the spring rape sowing, the NT treatment plots were sprayed with a systemic herbicide, Roundup (a.i. glyphosate 480 g L−1), at a rate of 4.0 L ha−1. The spring rape cv. ‘Fenja’ was sown on May 2 at a seed rate of 4.50 kg ha−1 and a sowing depth of 2 cm. Fertilisation (N16P16K16) was applied at a rate of 300 kg ha−1. At the beginning of flowering, the crop was sprayed with a broad-spectrum, systemic fungicide Folicur 1 L ha−1 (a.i. tebuconazole 250 g L−1, includes N,N-dimethyldecanamide). Spring rape was harvested on 9 August.
In 2013, winter wheat cv. ‘Ada’ was sown on 10 September at a seed rate of 200 kg ha−1. Sowing included a placement application of N9P15K28 + S6 300 kg ha−1. On 14 March 2014, after resumption of vegetation the crop was fertilised with ammonium nitrate N41 at a rate of 120 kg ha−1. Two weeks later, N44 was applied at a rate of 130 kg ha−1. Winter wheat was harvested on 29 July 2014.
In 2015, before sowing spring barley, the NT treatment plots were sprayed with Roundup at a rate of 4.0 L ha−1 (a.i. glyphosate 480 g L−1). Spring barley cv. ‘KVS Orphelia’ was sown at a seed rate of 170 kg ha−1 with N16P16K16 at a rate of 300 kg ha−1. At the tillering stage, an additional application of ammonium nitrate N41 was applied at a rate of 120 kg ha−1. At the initial symptoms of disease on the leaves, the crop was sprayed with the fungicide Bumper (a.i. propiconazole 250 g L−1). At the flag leaf stage, the spring barley crop was fertilised with ammonium nitrate N44 at a rate of 100 kg ha−1 and sprayed with the fungicide Amistar at a rate of 0.60 L ha−1 (a.i. azoxystrobin 250 g L−1). The spring barley was harvested on 12 August 2015.

2.3. Methods and Analysis

Weed incidence and species composition of predominant weeds were counted in 10 spots per experimental plot using a 20 × 30 cm frame. The total number of weeds, species composition and mass were determined at a milk maturity stage. Research was carried out each year.
Weeds were categorised into communities according to soil pH, nitrogen and moisture indicators (Table 2).
Weed communities based on soil pH requirements: 1. Weed of very acidic soils, 2. Weed of very acidic and acidic soils, 3. Weed of acidic soils, 4. Weed of acidic and moderately acidic soils, 5. Weed of moderately acidic soils, 6. Weed of moderately acidic and low acidity soils, 7. Weed of low acidity and weakly alkaline soils, 8. Weed of low acidity and weakly alkaline and alkaline soils, 9. Weed of alkaline soils and x. Indifferent weed species (tolerates various soil acidity levels). Weed communities based on soil moisture requirements: 1. Weed of very dry soils, 2. Weed of very dry and dry soils, 3. Weed of dry soils, 4. Weed of dry and moderately wet soils, 5. Weed of moderately wet soils, 6. Weed of moderately wet and wet soils, 7. Weed of wet soils, 8. Weed of wet and very wet soils, 9. Weed of very wet soils, and x. Indifferent weed species (tolerant of various soil moistures). Weed communities based on soil nitrogen requirements: 1. Weed of soils poor in nitrogen, 2. Weed of soils poor in nitrogen and in soils poor in nitrogen more frequent than in soils moderately rich and rich in nitrogen; 3. Weed in soils poor in nitrogen more frequent than in soils moderately rich and rich in nitrogen; 4. Weed mainly in soils poor in nitrogen than in soils moderately rich and rich in nitrogen, 5. Weed of soils moderately rich in nitrogen, 6. Weed more frequently in soils moderately rich in nitrogen and soils rich in nitrogen than in soils poor and moderately rich in nitrogen, 7. Weed in soils rich in nitrogen more frequent than in the soils poor or moderately rich in nitrogen, 8. Weed of soils very rich in nitrogen, 9. Weed of soils excessively high in nitrogen and x. Indifferent weed species (tolerant of various soil nitrogen statuses).
The results of investigations were grouped using cluster analysis. The clustering of all tested soil tillage systems without/with crop residue considering the estimated weed communities was carried out according to the Ward criterion using Euclidean distance matrices.
The homogeneity of weed distribution into communities was determined using χ2 test:
χ 2 = i = 1 r j = 1 c Oij ( Oij ( ( ni . × n . j ) × n 1 ) ) × ( ( ni . × n . j ) × n 1 ) 1
where χ2—chi-square; Oij—i population part, when variable x passes to category j; j = 1 c Oij —number of initiate members, where the meaning of x is xi; j = 1 c Oij —number of initiate members, where the meaning of indication y is yj; n = i = 1 r j = 1 c Oij —size of initiate. All analyses were performed using the statistical software STATISTICA 10 (SPSS Inc., Chicago, IL, USA). In all analyses a probability value less than 0.05 was considered statistically significant (p < 0.05). A result of 0.01 < p ≤ 0.05 was considered statistically significant. 0.001 < p ≤ 0.01 was considered highly statistically significant. p ≤ 0.001 was considered an extremely statistically significant result.

3. Results

3.1. Weed Communities Based on Soil pH Requirements

3.1.1. Composition of Weed Communities

In 2013, in the spring oilseed rape crop under different soil tillages, weed species were classified into five communities according to their soil pH requirements (Table 3).
In the crops without and with straw, weeds tolerant of low acidity and weakly alkaline soils (particularly Lamium purpureum L.) and indifferent weed species were dominant (Table 2). In 2014, in the winter wheat crop four weed communities according to soil pH were prevalent (Table 4).
The indifferent weed species (particularly Chenopodium album L., Persicaria lapathifolia L., Elytrygia repens L., and Cirsium arvense L.) were the most abundant (Table 1). In 2015, in the spring barley crop weed species were distributed into five communities according to the need for soil pH (Table 5).
In the deeply ploughed, shallowly ploughed, and cultivated and harrowed plots without and with plant residues, weed species tolerant of low acidity and weakly alkaline soils were dominant.

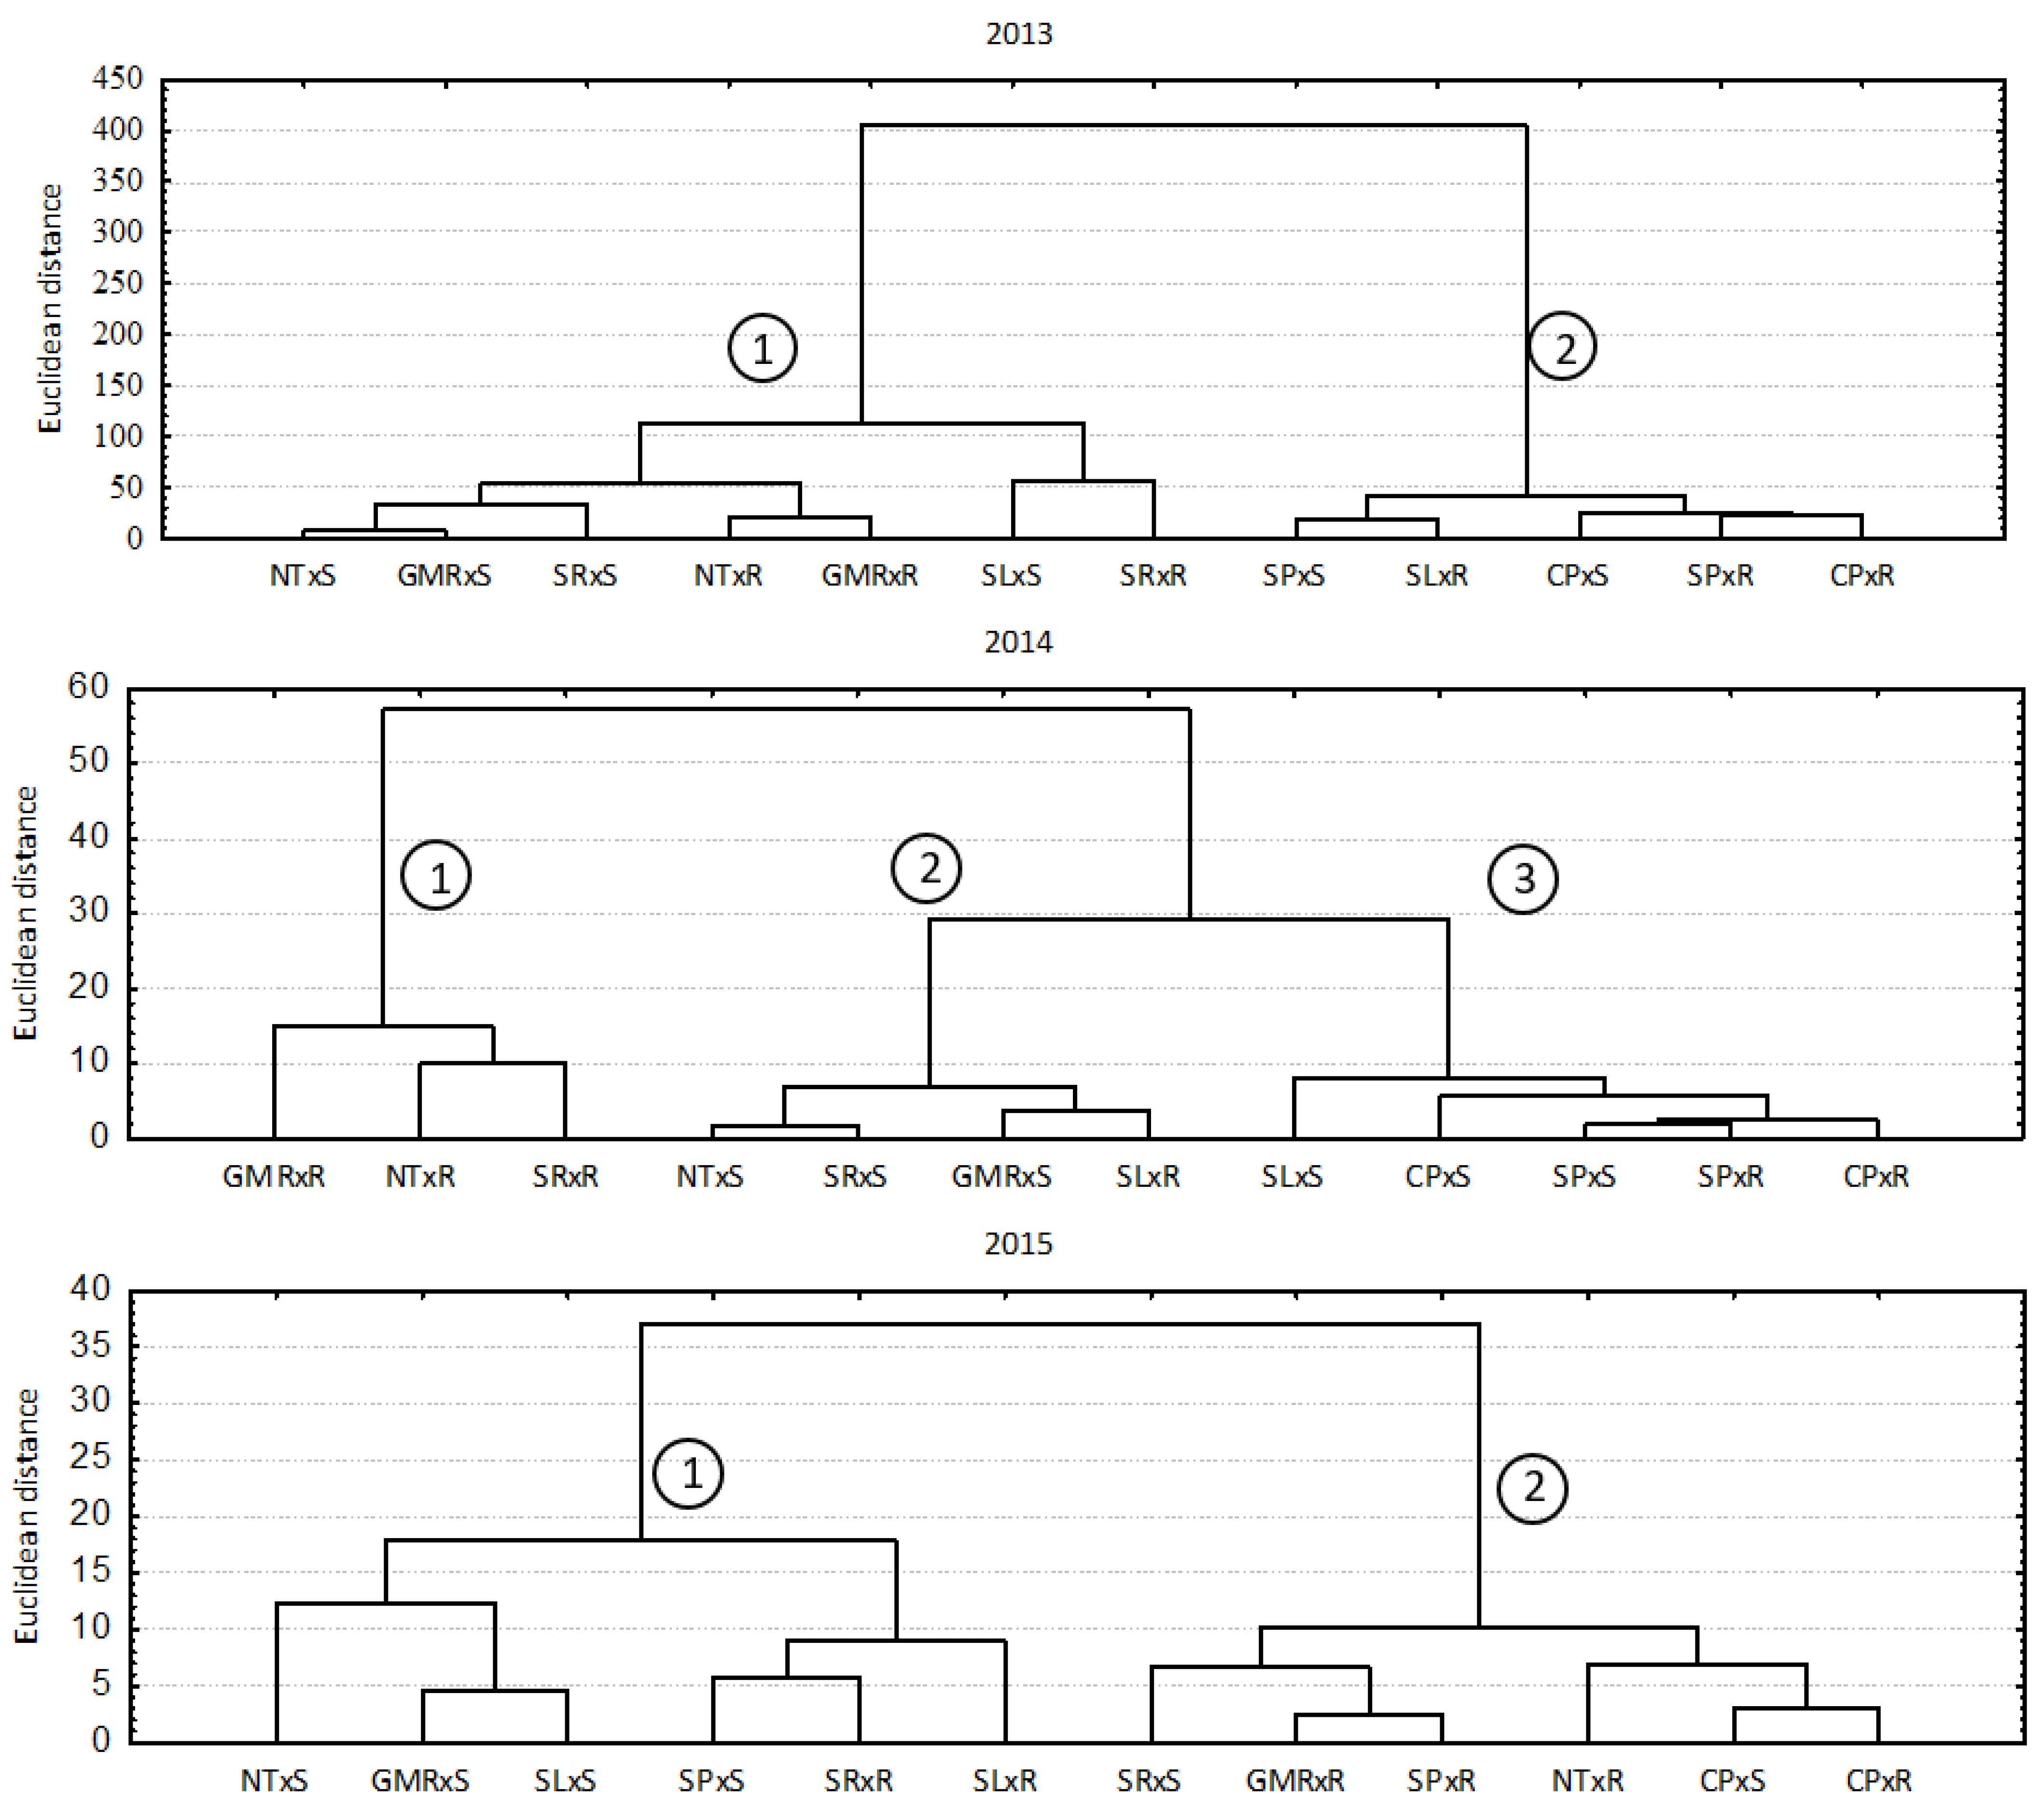
3.1.2. Clustering of Soil Tillage Systems without/with Crop Residues Considering the Estimated Weed Communities

We determined that different soil tillage systems without and with the incorporation of crop residues could be grouped based on their impact on the weed communities’ structure. In 2013 and 2014, hierarchical cluster analysis revealed three distinct groups of soil tillage systems without/with crop residues (Figure 1).
In 2013, shallow loosening, green manure incorporation with a rotary cultivator with crop residues, direct drilling without/with crop residues (group 1); deep ploughing with crop residues, shallow loosening with sweep and disc harrows without/with crop residues, green manure incorporation with a rotary cultivator without crop residues (group 2); deep ploughing without crop residues, shallow ploughing without/with crop residues and shallow loosening with a rotary cultivator without crop residues (group 3) had similar weed communities based on soil pH requirements. Weed communities associated with group 1 had lower total weed abundance than groups 2 and 3. Different soil tillage systems without/with crop residues groups varied depending on the cultivated crops and different meteorological conditions. In 2014, the smallest group (group 1) consisted of green manure incorporation with a rotary cultivator and direct drilling without crop residues. The middle group (group 2) consisted of shallow loosening with sweep and disc harrows without/with crop residues, shallow loosening with a rotary cultivator without crop residues and green manure incorporation with a rotary cultivator with crop residues. The largest group (group 3) consisted of deep ploughing and shallow ploughing without/with crop residues, shallow loosening with a rotary cultivator and direct drilling with crop residues. Weed communities associated with group 3 had lower total weed abundance than groups 1 and 2. In 2015, hierarchical cluster analysis revealed two distinct groups of soil tillage systems without/with crop residues. Group 1 consisted of shallow loosening, green manure incorporation with a rotary cultivator, and direct drilling without/with crop residues. Group 2 consisted of deep ploughing, shallow ploughing and shallow loosening with sweep and disc harrows without/with crop residues. The total weed abundance of both groups was similar.

3.1.3. Homogeneity Analysis of Weed Communities

In 2013, in the plots with reduced tillage and direct drilling (with the exception of shallow ploughing), the mass of weeds in the moderately acidic soils decreased from 1.3 to 10.7 times compared with deep ploughing (Table 3).
The abundance of indifferent weeds increased 1.7 and 1.5 times after the autumn shallow ploughing and shallow loosening with a rotary cultivator compared with deep ploughing. In the plots of reduced tillage and direct drilling with incorporated straw, the mass of weeds of moderately acidic, low acidity, weakly alkaline and alkaline soils and the mass of indifferent weed species were found to be lower than in the plots of conventional tillage, while the mass of weeds of moderately acidic soils was found to be higher, with the exception of shallow cultivating and harrowing. Due to these reasons, in the plots of reduced tillage and direct drilling, the quantitative distribution of weeds into communities according to the need for soil pH was uneven compared with the plots of deep ploughing.
In 2014, in the plots without plant residues, where shallow loosening with a rotary cultivator was used, with white mustard mass incorporated at 5 cm depth with a rotary cultivator and direct drilling, the mass of indifferent weed species was 5.9, 7.9 and 8.4 times higher compared with the plots of deep ploughing (Table 4).
In the plots where green manure was shallowly incorporated with a rotary cultivator in spring before sowing and direct drilling was used, the mass of weeds of moderate and low acidity soils significantly increased compared with the plots of deep ploughing. Due to this reason, the quantitative distribution of weeds into communities in the aforementioned plots was uneven.
In 2015, in the plots without straw and with straw, in the direct drilling system, the mass of indifferent weeds increased compared with the plots of deep ploughing (Table 5). In the plots without straw, no weeds of moderate and low acidity soils were found in the deeply ploughed plots, and with reduced tillage intensity or direct drilling the mass of weeds increased. Deep ploughing, shallow ploughing, shallow cultivating and harrowing increased the mass of weeds of low acidity and weakly alkaline soils.

3.2. Weed Communities Based on Soil Moisture Requirements

3.2.1. Composition of Weed Communities

In 2013, weed species were distributed into six communities according to the need for soil moisture (Table 6).
In the crop of spring oilseed rape, the weed species of moderately wet soils (Lamium purpureum L., Follopia convonvulus L., and Taraxacum officinale L.) and of wet soils (Rumex crispus L.) as well as of wet and very wet soils (Persicaria lapathifolia L.) were prevalent (Table 2.). In 2014, the weed species were distributed into five communities according to their soil moisture requirements (Table 7).
In the crops without and with spring rape residues, the most prevalent weeds were those of moderately moist soils: Lamium purpureum L., Follopia convonvulus L., Sonchus arvensis L. There was an especially high abundance of indifferent weed species adapted to various soil moisture levels (Table 2). In 2015, the growing season was drier than the long-term average; therefore, the weed species prevalent in spring barley were species adapted to dry, moderately wet soils and indifferent weed species (Table 8).

3.2.2. Clustering of Soil Tillage Systems without/with Crop Residues Considering the Estimated Weed Communities

In 2013, hierarchical cluster analysis revealed two distinct groups of soil tillage systems without/with crop residues, which resulted in a similar weed community structure based on soil moisture requirements (Figure 2).
The largest group (group 1) consisted of shallow loosening with sweep and disc harrows with crop residues, shallow loosening, green manure incorporation with a rotary cultivator, and direct drilling without/with crop residues. The smaller group (group 2) consisted of deep ploughing and shallow ploughing without/with crop residues, and shallow loosening with sweep and disc harrows without crop residues. Weed communities associated with group 1 had lower total weed abundance than group 2. In 2014, three distinct groups of soil tillage systems without/with crop residues were identified by the hierarchical cluster analysis. The smallest group (group 1) consisted of shallow loosening, green manure incorporation with a rotary cultivator and direct drilling without crop residues. The middle group (group 2) consisted of shallow loosening with sweep and disc harrows without crop residues, shallow loosening, green manure incorporation with a rotary cultivator and direct drilling with crop residues. The largest group (group 3) consisted of deep ploughing and shallow ploughing without/with crop residues, and shallow loosening with sweep and disc harrows with crop residues. Weed communities associated with group 3 had lower total weed abundance than groups 1 and 2. In 2015, hierarchical cluster analysis revealed two distinct groups of soil tillage systems without/with crop residues. Group 1 consisted of shallow ploughing, green manure incorporation with a rotary cultivator, direct drilling with crop residues, shallow loosening with sweep and disc harrows without/with crop residues and shallow loosening with a rotary cultivator without crop residues. Group 2 consisted of deep ploughing without/with crop residues, shallow ploughing, green manure incorporation with a rotary cultivator, direct drilling without crop residues and shallow loosening with a rotary cultivator with crop residues. The total weed abundance of both groups was low.

3.2.3. Homogeneity Analysis of Weed Communities

In 2013, in the plots without straw, where shallow loosening with a rotary cultivator was used, with white mustard mass incorporated at 5 cm depth with a rotary cultivator and direct drilling, the mass of weed species of moderately wet and wet soils increased; however, the mass of weed species of wet and very wet soils decreased compared with deep ploughing (Table 6).
In the shallowly ploughed plots without plant residues, a higher mass of weed species of wet and very wet soils was established compared with the plots of deep ploughing. In the plots with straw, where shallow loosening with a rotary cultivator was used, where white mustard mass was incorporated with a rotary cultivator and direct drilling was used, the mass of weeds of wet soils was the highest. In the plots of reduced tillage and direct drilling with incorporated straw, the mass of indifferent weed species varied from 1.8 to 7.2 times lower than the conventional tillage plots. Therefore, the quantitative distribution of weed species into communities based on their soil moisture requirements in the minimal tillage and direct drilling plots was uneven compared with the deep ploughing plots.
In 2014, in the reduced tillage and direct drilling plots without and with plant residues, the mass of indifferent weed species was found to be accordingly 1.6–8.7 and 3.9–11.3 times higher compared with the plots of conventional tillage (Table 7).
In the plots with shallowly incorporated white mustard mass, the mass of weed species of wet and very wet soils was 4.9 times higher compared with conventional tillage plots. In the direct drilling plots, higher mass was established of weed species of dry and moderately wet and wet soils compared with ploughed plots. Therefore, weed species distribution into communities according to the need for soil moisture in the latter plots was uneven.
In the dry 2015 year, the retained straw inhibited the evaporation of soil moisture, which created favourable conditions for increased weed biomass (Table 8). In the crops with plant residues, the average mass of the weed species of moderately wet soils was 78.9% higher than in the crops without plant residues. In the plots of reduced tillage and direct drilling without the incorporation of the pre-crop straw, the mass of weed species of moderately wet soils was 2.5 to 4.9 times greater compared with the plots of conventional tillage. The greatest mass of indifferent weed species was recorded in the direct drilling plots. In the reduced tillage and direct drilling plots with plant residues, the weed species of moderately wet soils were more prevalent when compared with the conventional tillage plots. In the plots of reduced tillage and direct drilling with incorporated residues, the mass of indifferent weed species was 1.5 to 4.6 times lower than in the plots of conventional tillage. In the plots of shallow ploughing with plant residues and in the direct drilling plots with and without plant residues, the distribution of weeds into communities was uneven when compared with the deep ploughing plots.

3.3. Weed Communities Based on Soil Nitrogen Requirements

3.3.1. Composition of Weed Communities

In 2013, weed species were classified into five communities according to their soil nitrogen requirements (Table 9).
In the spring oilseed rape crop, the most prevalent weed species were those more frequently found in nitrogen-rich soils than in nitrogen-poor or moderately nitrogen-rich soils (Chenopodium album L., Lamium purpureum L., and Elytrygia repens L.) (Table 2). In 2014, weed species were distributed into four communities based on their soil nitrogen requirements (Table 10).
The following weed species that were more frequent in nitrogen-rich soils than in nitrogen-poor or moderately rich soils were Chenopodium album L., Elytrygia repens L., and Cirsium arvense L. The weed species occurring in the soils very rich in nitrogen (Persicaria lapathifolia L. and Galium aparine L.) were also growing in the winter wheat crop (Table 2). In 2015, in the spring barley crop the weed species of soils rich and very rich in nitrogen were also dominant (Table 11).

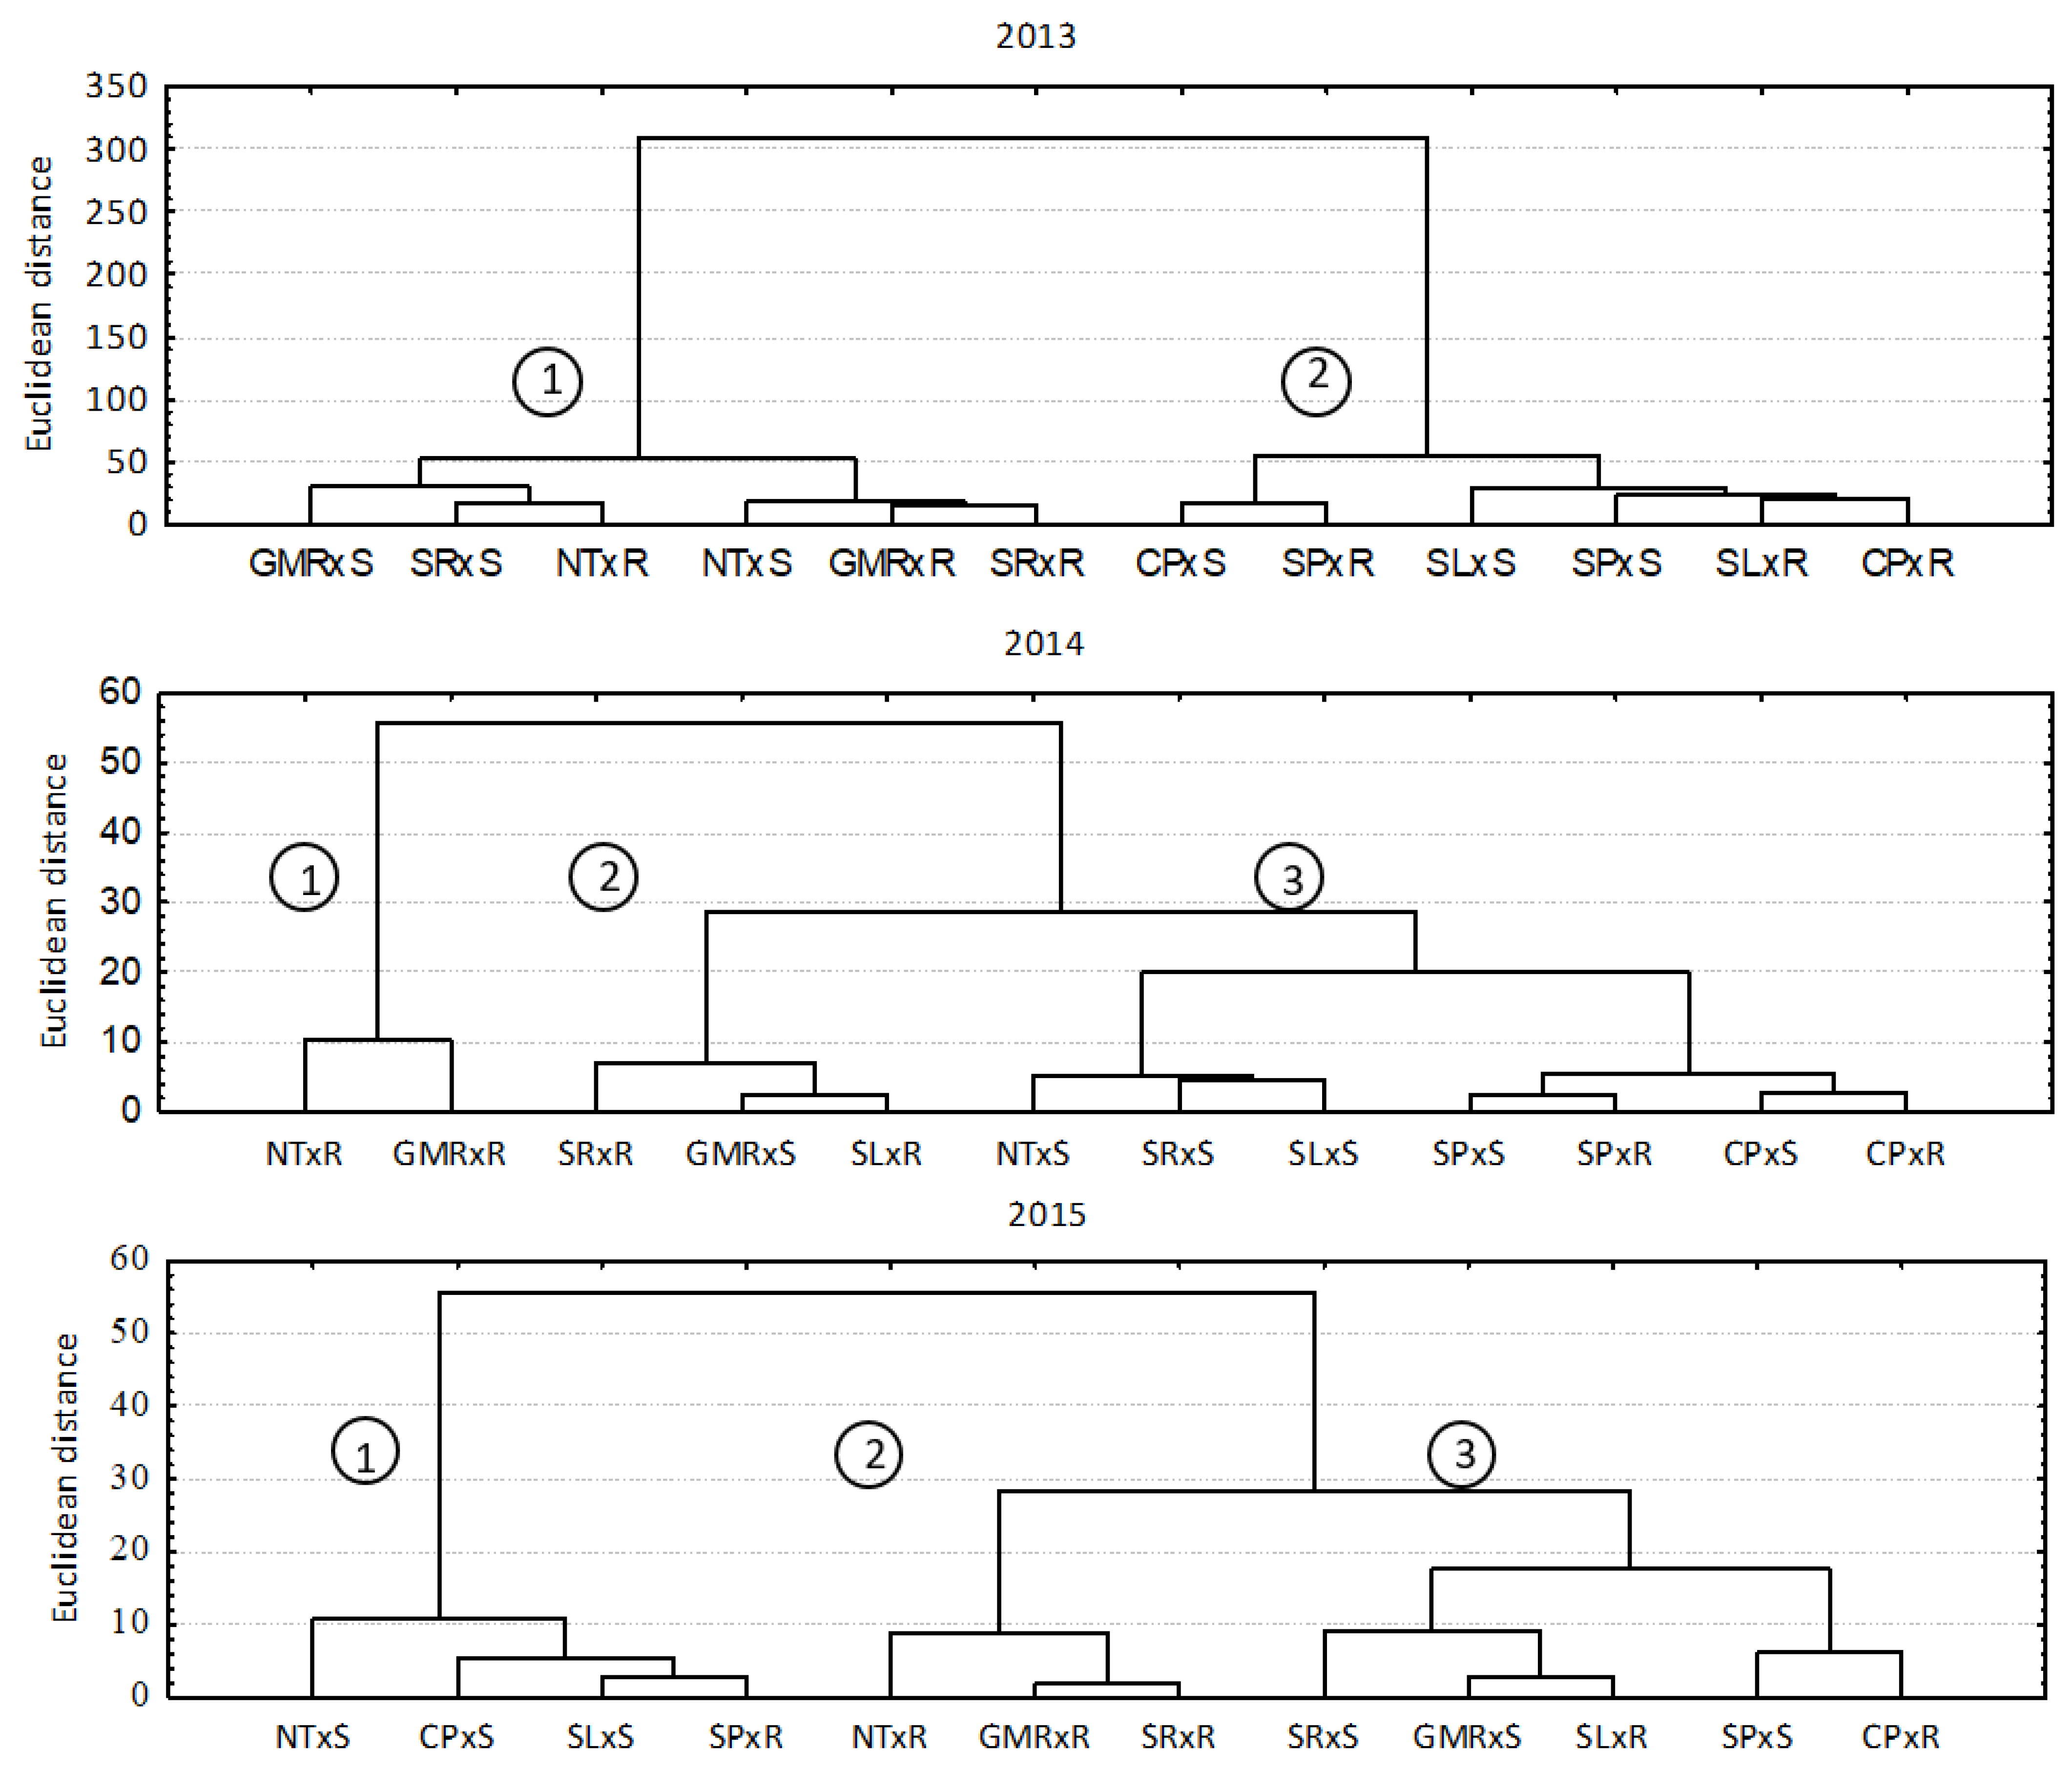
3.3.2. Clustering of Soil Tillage Systems without/with Crop Residues Considering the Estimated Weed Communities

In 2013, two distinct groups of soil tillage systems without/with crop residues were identified by the hierarchical cluster analysis, which led to a similar weed community structure based on soil nitrogen requirements (Figure 3).
Group 1 consisted of shallow loosening, green manure incorporation with a rotary cultivator and direct drilling without/with crop residues. Group 2 consisted of deep ploughing, shallow ploughing and shallow loosening with sweep and disc harrows without/with crop residues. Weed communities of group 3 had lower total weed abundance in comparison with group 2. In 2014 and 2015, hierarchical cluster analysis revealed three distinct groups of soil tillage systems without/with crop residues. In 2014, the smallest group (group 1) consisted of green manure incorporation with a rotary cultivator and direct drilling without crop residues. Group 2 consisted of shallow loosening with sweep and disc harrows, shallow loosening with a rotary cultivator without crop residues and green manure incorporation with a rotary cultivator with crop residues. The largest group (group 3) consisted of deep ploughing and shallow ploughing without/with crop residues, shallow loosening with sweep and disc harrows, shallow loosening with a rotary cultivator and direct drilling with crop residues. The total weed abundance of all three groups was similar. In 2015, group 1 consisted of shallow ploughing without crop residues, deep ploughing, shallow loosening with sweep and disc harrows and direct drilling with crop residues. Group 2 consisted of shallow loosening, green manure incorporation with a rotary cultivator and direct drilling without crop residues. Group 3 consisted of deep ploughing and shallow loosening with sweep and disc harrows without crop residues, shallow ploughing, shallow loosening and green manure incorporation with a rotary cultivator with crop residues. Weed communities associated with group 2 had lower total weed abundance than groups 1 and 3.

3.3.3. Homogeneity Analysis of Weed Communities

In 2013, the pre-crop straw significantly reduced the average mass of weed species of soils very rich in nitrogen (by 20.4%) (Table 9). In the plots with and without straw, where reduced tillage systems and direct drilling were used, the mass of weed species found more frequently in nitrogen-rich soils than in nitrogen-poor and moderately rich soils increased. Conversely, the mass of weed species occurring in the very rich nitrogen soils decreased (with the exception of shallow ploughing) when compared with the conventional tillage plots. The greatest weed mass of moderately nitrogen-rich and nitrogen-rich soils was recorded in the direct drilling plots without residues. Indifferent weed species spread only in the plots with plant residues that had been shallowly ploughed and tilled with a rotary cultivator. Due to these reasons, the quantitative distribution of weed species into communities based on nitrogen requirements was uneven in the plots of reduced tillage and direct drilling when compared with the deep ploughing plots.
In 2014, oilseed rape residues retained after harvesting significantly reduced the total mass of weeds from all communities when compared with the crops without plant residues (by 47.2%) (Table 10). When compared with the conventional tillage plots, the reduced tillage and direct drilling without plant residues plots contained a 5.6 to 18.2 times higher mass of weed species found more frequently in nitrogen-rich soils than in nitrogen-poor or moderately rich soils. In all tillage plots and direct drilling plots with incorporated straw, the mass of weed species of soils very rich in nitrogen increased from 4.3 to 20.2 times compared with the plots of deep ploughing. In the plots where white mustard mass had been incorporated by a rotary cultivator, without plant residues and in direct drilling plots with and without plant residues, the distribution of weeds into communities was uneven compared with deep ploughing.
In 2015, the retained straw of winter wheat increased the mass of weeds of soils moderately rich in nitrogen and of those more frequent in nitrogen-rich soils and reduced the mass of weeds of soils very rich in nitrogen (Table 11).
The greatest increase in the mass of weeds of soils very rich in nitrogen occurred in the plots without straw and with straw, where shallow loosening with a rotary cultivator was used, with white mustard mass incorporated at 5 cm depth with a rotary cultivator and direct drilling, compared with deep ploughing. The greatest mass of weed species of nitrogen-rich soils was determined in shallowly ploughed plots with incorporated straw of the pre-crop. The greatest mass of weeds of moderately nitrogen-rich and nitrogen-rich soils was recorded in plots of deep ploughing with straw.

4. Discussion

4.1. The Effect of Different Tillage Systems and Crop Residue in the Soil on Weed Community Composition

With the changes in soil management conditions (use of ploughless technologies, plant residue retention), changes occur in soil ecological conditions, including moisture, temperature, and nutrient content. These conditions and changes in the crops over a year are reflected by the communities of weeds. The crop rotation applied in our experimental field (spring rape, winter wheat, spring barley) favoured the spread of weed species of various communities: five communities according to the need for soil pH and moisture, six communities according to the need for soil nitrogen. Agricultural crops were dominated by indifferent weed species according to the need for soil pH and moisture, and weed species more frequent in nitrogen-rich and very nitrogen-rich soils. The composition of weed species is associated with a complex gradient of increasing altitude, precipitation, decreasing temperature, and soil acidity [20]. Soil temperature and soil water potential greatly influence the composition of the weed flora of a cultivated area [21].
Soil moisture is one of the key factors that determine the abundance of weeds and weed species in crops [22]. The grouping of weeds according to the need for soil moisture showed that not only their number in the crop varied over the year but also the quality in response to different tillage systems. The retained plant residues of the decomposing pre-crop cover the soil as mulch, inhibit the emergence of weeds, supply plants with nutrients and do not allow moisture to evaporate from the soil. At the end of vegetation, when plant residues had partly decomposed and when there was a sufficient amount of moisture, favourable conditions occurred for the spread of weed species of wetter soils. The spread of these weeds in 2013 might have been influenced by the abundant amount of rainfall in July and the first ten-day period of August.
Our research data showed that in 2014 and 2015 in the plots with and without straw, where reduced tillage systems and direct drilling were used, the weed mass of nitrogen-rich and very nitrogen-rich soils increased compared with deep ploughing.
The effect of catch crops on the weed incidence in the main crops varies greatly and depends on the specific conditions of the experimental site, the species of crops grown, the method and time of their biomass incorporation (for green manure) and other factors [23]. In our experiment, shallowly incorporating white mustard (as a green manure) encouraged the spread of weeds of wet, nitrogen-rich and very nitrogen-rich soils. Previous research has shown that reduced tillage increases the incidence of the weed species of nitrogen-rich and very rich soils (Cirsium arvense L., Elytrygia repens L., Poa annua L., Stellaria media (L.) Vill., Tripleurospermum perforatum (Mérat) M. Laínz) in spring and winter cereal crops [24,25]. Studies carried out in Lithuania show that in the direct drilling system, the total density of weeds before herbicide application was 21.0% higher and before harvesting was 42.0% higher when compared with conventional ploughing [26].

4.2. Clustering of Soil Tillage Systems without/with Crop Residues Considering the Estimated Weed Communities

Using multivariate analysis, we identified 2–3 groups of soil tillage systems with-out/with crop residues that led to a similar weed community structure based on soil pH, moisture and nitrogen requirements. The variation of the estimated groups that resulted in a similar weed community structure depended on different environmental conditions. Different soil tillage systems without/with crop residues groups varied depending on the cultivated crops and different meteorological conditions. Deep ploughing and shallow ploughing without/with crop residues in many cases had a different weed community structure compared to shallow loosening, green manure incorporation with a rotary cultivator and direct drilling without/with crop residues.
In the reduced tillage systems and no-tillage system, weed species of moderate acidity and low acidity, moderately wet and wet, nitrogen-rich, and very nitrogen-rich soils dominated. The results show that soil tillage affects the weed community structure, suggesting that farmers can manage weed communities and the potential for weed interference by adjusting the timing of their tillage [27]. Crop residue retention decreases the weed density and species richness above-ground and inhibits the growth of broadleaf weeds by the residue [28]. The results show that it is possible to maintain weed infestation in the no-tillage system at a level that does not significantly affect winter wheat yield and does not pose a threat of perennial and invasive weeds when effective herbicide protection is applied [29]. The data of this study can be used to optimise the control of weeds associated with specific soil tillage systems without/with crop residues.

5. Conclusions

The weeds were distributed into five communities based on their soil pH and soil nitrogen requirements and into six communities according to their soil moisture needs. Agricultural crops were dominated by indifferent weed species (for soil pH and moisture), by more frequently found weed species in nitrogen-rich rather than in nitrogen-poor and moderately rich soils and by weed species occurring in soils very rich in nitrogen. The dominant species included Chenopodium album L., Galium aparine L., Lamium purpureum L., Persicaria lapathifolia L., Elytrygia repens L., Cirsium arvense L., Taraxacum officinale L., and Rumex crispus L.
Compared with deep ploughing, in the reduced tillage systems, and in the no-tillage system, we observed an increase in the abundance of weed species of moderate acidity and low acidity, moderately wet and wet, nitrogen-rich and very nitrogen-rich soils. In most cases, plant residue application decreased the abundance of weed species of the various communities. In the reduced tillage systems and no-tillage systems, the quantitative distribution of weed communities was uneven, except in 2015 for the soil pH and nitrogen requirements.
Deep ploughing and shallow ploughing without/with crop residues in many cases had different weed community structures compared to shallow loosening, green manure incorporation with a rotary cultivator, and direct drilling without/with crop residues.
In a coherent farming system, soil tillage should be reduced by minimising mechanical tillage and maximising the use of biological soil fertility maintenance measures combined with proper weed management consider the long-term changes of weed communities.

Author Contributions

V.S. and A.M. designed the research framework and contributed to the application of the study methodology and the analysis of the results. L.M.B., L.S. and V.B. played an active role in writing, reviewing and editing the manuscript. All authors have read and agreed to the published version of the manuscript.

Funding

This work was supported by the National Science Program “The effect of long-term, different-intensity management of resources on the soils of different genesis and other components of the agro-ecosystems” (grant No. SIT-9/2015) funded by the Research Council of Lithuania.

Data Availability Statement

Not applicable.

Conflicts of Interest

The authors declare no conflict of interest.

References

  1. Kassam, A.; Friedrich, T.; Shaxson, F.; Pretty, J. The spread of concervation agriculture: Justification, sustainability and uptake. Int. J. Agric. Sustain. 2009, 7, 292–320. [Google Scholar] [CrossRef]
  2. Lapins, D.; Kopmanis, J.; Dinaburga, G.; Berzins, A.; Plume, A.; Melngalvis, I. Efficacy of soil deep loosening if growing winter oil seed rape and winter wheat in conditions of uneven relief. Eng. Rural Dev. 2012, 11, 139–144. [Google Scholar]
  3. Carr, P.M.; Gramig, G.G.; Liebig, M.A. Impacts of organic zero tillage systems on crops, weeds, and soil quality. Sustainability 2013, 5, 3172–3201. [Google Scholar] [CrossRef] [Green Version]
  4. Knežević, M.; Baličević, R.; Ravlić, M.; Ranogajec, L.J. Effects of reduced herbicide doses on annual weeds and winter wheat yield by two tillage system. Herbologia 2012, 13, 7–46. [Google Scholar]
  5. Håkansson, S. Weeds and Weed Management on Arable Land: An Ecological Approach; CABI Publishing: Wallingford, UK, 2003; p. 274. [Google Scholar]
  6. Tørresen, K.S.; Salonen, J.; Fogelfords, H.; Håkansson, S.; Melander, B. Weed problems in various tillage systems in the Nordic countries. In Extended Abstracts; Nordic Association of Agricultural Scientists: Odense, Denmark, 2006; pp. 54–60. [Google Scholar]
  7. Salonen, J.; Hyvönen, T. Effect of rotational fallows on weed flora of subsequent winter rye. J. Plant Dis. Prot. 2006, 20, 651–656. [Google Scholar]
  8. Chetan, F.; Rusu, T.; Chetan, C.; Moraru, P.I. Influence of soil tillage upon weeds, production and economical efficiency of corn crop. AgroLife Sci. J. 2016, 5, 36–43. [Google Scholar]
  9. Travlos, I.S.; Cheimona, N.; Roussis, I.; Bilalis, D.J. Weed-species abundance and diversity indices in relation to tillage systems and fertilization. Front. Environ. Sci. 2018, 6, 11. [Google Scholar] [CrossRef] [Green Version]
  10. Santín-Montanyá, I.M.; Catalán, G.; Tenorio-Pasamón, J.L.; García-Baudín, J.M. Effect of the tillage systems on weed flora composition. ResearchGate 2014, 69, 143–147. [Google Scholar]
  11. Armengot, L.; Blanco-Moreno, J.M.; Bàrberi, P.; Bocci, G.; Carlesi, S.; Aendekerk, R.; Berner, A.; Cellete, F.; Grosse, M.; Huiting, H.; et al. Tillage as a driver of change in weed communities: A functional perspective. Agric. Ecosyst. Environ. 2016, 222, 276–285. [Google Scholar] [CrossRef]
  12. Légère, A.; Stevenson, F.C.; Benoit, D.L. The selective memory of weed seedbanks after 18 years of conservation tillage. Weed Sci. 2011, 59, 98–106. [Google Scholar] [CrossRef]
  13. Nichols, V.; Verhulst, N.; Cox, R.; Govaerts, B. Weed dynamics and conservation agriculture principles: A review. Field Crop Res. 2015, 183, 56–68. [Google Scholar] [CrossRef] [Green Version]
  14. Nikolić, N.; Loddo, D.; Masin, R. Effect of crop residues on weed emergence. Agronomy 2021, 11, 163. [Google Scholar] [CrossRef]
  15. Mohammaddoust-e-Chamanabad, H.R.; Baghestani, M.A.; Tulikov, A.M. The impact of agronomic practices on weed community in winter rye. Pak. J. Weed Sci. Res. 2006, 12, 281–291. [Google Scholar]
  16. Mass, M.T.; Verdu, A.M. Tillage system effects on weed communities in a 4-year crop rotation under Mediterranean dryland conditions. Soil Tillage Res. 2003, 74, 15–24. [Google Scholar] [CrossRef]
  17. Velykis, A.; Satkus, A. Effect of reduced clay loam tillage on weed infestation and spring barley yield. Agric. Sci. 2012, 19, 236–248. (In Lithuanian) [Google Scholar]
  18. Calado, J.M.G.; Basch, G.; ·De Carvalho, M. Weed emergence as influenced by soil moisture and air temperature. J. Pest Sci. 2009, 82, 81–88. [Google Scholar] [CrossRef]
  19. Ellenberg, H.; Weber, H.E.; Düll, R.; Wirth, V.; Werner, W. Zeigerwerte von Pflanzen in Mitteleuropa. Scr. Geobot. 1992, 18, 1–248. (In Germany) [Google Scholar]
  20. Lososová, Z.; Chytrý, M.; Cimalová, Š.; Kropáč, Z.; Otýpková, Z.; Pyšek, P.; Tichý, L. Weed vegetation of arable land in Central Europe: Gradients of diversity and species composition. J. Veg. Sci. 2004, 15, 415–422. [Google Scholar] [CrossRef]
  21. Travlos, I.; Gazoulis, I.; Kanatas, P.; Tsekoura, A.; Zannopoulos, S.; Papastylianou, P. Key factors affecting weed seeds’ germination, weed emergence, and their possible role for the efficacy of false seedbed technique as weed management practice. Front. Agron. 2020, 2, 1–9. [Google Scholar] [CrossRef]
  22. Santín-Montanyá, I.M.; Zambrana-Quesada, E.; Tenorio-Pasamón, J.L. Weed abundance and soil seedbank responses to tillage systems in continuous maize crops. Arch. Agron. Soil Sci. 2018, 64, 1705–1713. [Google Scholar] [CrossRef]
  23. Franczuk, J.; Kosterna, E.; Zaniewicz-Bajkowska, A. Weed-control effects on different types of cover-crop mulches. Acta Agric. Scand. Sect. B Plant Soil Sci. 2010, 60, 472–479. [Google Scholar] [CrossRef]
  24. Juchnevičienė, A.; Raudonius, S.; Avižienytė, D.; Romaneckas, K.; Bogužas, V. Effect of long-term reduced soil tillage and direct seeding on winter wheat crop. Agric. Sci. 2012, 19, 139–150. (In Lithuanian) [Google Scholar]
  25. Skuodienė, R.; Karčauskienė, R.; Čiuberkis, S.; Repšienė, R.; Ambrazaitienė, D. The influence of primary soil tillage on soil weed seed bank and weed incidence in a cereal-grass crop rotation. Zemdirb. Agric. 2013, 100, 25–32. [Google Scholar] [CrossRef] [Green Version]
  26. Seibutis, V.; Feiza, V. The influence of short crop rotations, monocrop and reduced soil tillage on weed population dynamics. Zemdirb. Agric. 2008, 95, 123–129. [Google Scholar]
  27. Cordeau, S.; Smith, R.G.; Gallandt, E.R.; Brown, B.; Salon, P.; DiTommaso, A.; Ryan, M.R. Timing of Tillage as a Driver of Weed Communities. Weed Sci. 2017, 65, 504–514. [Google Scholar] [CrossRef] [Green Version]
  28. Zhang, J.; Wu, L.-F. Impact of Tillage and Crop Residue Management on the Weed Community and Wheat Yield in a Wheat–Maize Double Cropping System. Agriculture 2021, 11, 265. [Google Scholar] [CrossRef]
  29. Feledyn-Szewczyk, B.; Smagacz, J.; Kwiatkowski, C.A.; Harasim, E.; Woźniak, A. Weed Flora and Soil Seed Bank Composition as Affected by Tillage System in Three-Year Crop Rotation. Agriculture 2020, 10, 186. [Google Scholar] [CrossRef]
Figure 1. Hierarchical cluster analysis (Ward method, Euclidean distance matrices) of soil tillage systems without/with crop residues considering the weed communities based on soil pH requirements. Groups of different tillage systems without/with straw indicate similar weed communities. 1, 2, 3-groups of soil tillage systems without/with crop residues indicate similar weed communities.
Agronomy 11 01276 g001
Figure 2. Hierarchical cluster analysis (Ward method, Euclidean distance matrices) of soil tillage systems without/with crop residues considering the weed communities based on soil moisture requirements. Groups of different tillage systems without/with straw indicate similar weed communities. 1, 2, 3-groups of soil tillage systems without/with crop residues indicate similar weed communities.
Agronomy 11 01276 g002
Figure 3. Hierarchical cluster analysis (Ward method, Euclidean distance matrices) of soil tillage systems without/with crop residues considering the weed communities based on soil nitrogen requirements. Groups of different tillage systems without/with straw indicate similar weed communities. 1, 2, 3-groups of soil tillage systems without/with crop residues indicate similar weed communities.
Agronomy 11 01276 g003
Table 1. Description of tillage system treatments.
NoSoil Tillage TreatmentsDirect Drilling of Cover CropsShallow Discing after HarvestPrimary TillageSeedbed Preparation
1.Conventional deep ploughing (control, CP)noyesploughing at 23–25 cm depthcultivation
2.Shallow ploughing (SP)noyesploughing at 12–15 cm depthcultivation
3.Shallow loosening (SL)noyesdiscing at 8–10 cm depthcultivation
4.Shallow rotovating (SR)nononorotovating at 5–6 cm depth
5.Catch cropping of green manure and rotovating (GMR)yesnonorotovating at 5–6 cm depth
6.No-tillage, direct drilling (NT)nononono
Table 2. Weed species classified into communities (based on soil pH, nitrogen (N), moisture (M)), 2013/2014/2015.
NoSpeciesCommunitiesRS
pHNMCPSPSLSRGMRNTCPSPSLSRGMRNT
1Apera spica-venti L.5x60/0/00/0/00/0/00/0/x0/0/00/0/00/0/00/0/x0/0/00/0/x0/0/00/0/0
2Chenopodium album L.x74x/x/0x/0/xx/x/xx/0/xx/x/0x/x/0x/x/0x/x/xx/x/xx/0/0x/0/0x/0/0
3Cirsium arvense L.x7x0/0/00/0/00/0/0x/x/xx/x/x0/x/00/x/00/0/xx/x/0x/x/xx/x/xx/x/x
4Elytrigia repens L.x7xx/x/xx/x/0x/x/xx/x/0x/x/xx/0/xx/x/0x/x/xx/x/0x/x/0x/x/xx/x/0
5Equisetum arvense L.x3x0/0/00/0/00/0/00/0/00/0/00/0/x0/0/00/0/00/0/00/0/00/0/x0/0/x
6Fallopia convolvulus L.x650/x/0x/x/0x/x/0x/0/0x/x/0x/0/0x/x/0x/x/0x/x/00/0/0x/x/0x/0/0
7Galium aparine L.6x80/x/00/x/0x/x/xx/x/xx/x/xx/x/x0/x/xx/x/xx/x/xx/x/xx/x/xx/x/x
8Lamium purpureum L.775x/x/xx/x/xx/x/xx/x/xx/x/xx/0/xx/x/xx/x/xx/x/xx/x/xx/x/xx/x/x
9Persicaria lapathifolia L.x88x/x/xx/x/xx/x/xx/x/xx/x/0x/x/0x/x/xx/x/xx/x/xx/x/0x/x/0x/x/0
10Poa annua L.x860/0/00/0/00/0/00/0/x0/0/x0/0/x0/0/00/0/00/0/00/0/x0/0/x0/0/x
11Rumex crispus L.x670/0/00/0/00/0/0x/0/0x/0/0x/0/00/0/00/0/00/0/xx/0/xx/0/xx/0/x
12Sinapis arvensis L.86x0/x/00/x/x0/x/x0/0/00/0/00/0/00/x/x0/x/00/x/x0/0/00/x/00/x/0
13Sonchus arvensis L. 7x50/0/00/0/0x/0/0x/x/0x/x/0x/0/0/0/x/00/0/00/x/0x/x/0x/x/0x/x/0
14Taraxacum officinale L.x850/0/0x/0/00/0/0x/x/xx/0/xx/x/x0/x/00/0/00/x/0x/0/xx/0/xx/0/x
Note: Factor A: R—straw removed (control), S—straw chopped and spread. Factor B: CP—conventional deep ploughing (control), SP—shallow ploughing, SL—shallow loosening with sweep and disc harrows, SR—shallow loosening with rotary cultivator, GMR—catch cropping and green manure incorporation with rotary cultivator, NT—no-tillage, direct drilling. Ecological groups according to soil pH: 5. Plants of moderately acidic soils; 6. Plants of moderate acidity and low acidity soils; 7. Plants of low acidity and weakly alkaline soils; 8. Plants of low acidity and weakly alkaline and alkaline soils; x. Indifferent plants (tolerate various soil acidity levels); Ecological groups according to N: 3. Plants in soils poor in nitrogen more frequent than in soils moderately rich and rich in nitrogen; 6. Plants in soils moderately rich in nitrogen and soils rich in nitrogen more frequent than in soils poor and moderately rich in nitrogen; 7. Plants in soils rich in nitrogen more frequent than in the soils poor or moderately rich in nitrogen; 8. Plants of soils very rich in nitrogen; x. Indifferent plants (tolerant of various soil nitrogen statuses); Ecological groups according to M: 4. Plants of dry and moderately wet soils; 5. Plants of moderately wet soils; 6. Plants of moderately wet and wet soils; 7. Plants of wet soils; 8. Plants of wet and very wet soils; x. Indifferent plants (tolerant of various soil moistures).
Table 3. The weed communities based on soil pH requirements, 2013.
EvaluationFactorsWeed Communities
5678x
Quantitative,
biomass of weed, g m−2
RCP27.7034.5038.8
SP41.1029.8064.6
SL8.3026.530.625.836.5
SR *2.6021.72.60059.6
GMR ***10.61.7035.013.38.80
NT **21.61.8019.9015.1
S ***CP034.645.524.636.9
SP ***37.632.628.7028.9
SL ***0048.828.420.0
SR34.813.812.9010.3
GMR ***12.920.311.802.60
NT ***17.515.611.8010.8
Explanations and definitions are provided in Table 2. Significant variations: * 0.01 < p ≤ 0.05, ** 0.001 < p ≤ 0.01, *** p ≤ 0.001.
Table 4. The weed communities based on soil pH requirements, 2014.
EvaluationFactorsWeed Communities
678x
Quantitative,
biomass of weed, g m−2
RCP0.100.303.602.70
SP0.301.203.305.80
SL0.200.901.3016.0
SR *7.202.80021.4
GMR ***22.81.00022.8
NT *22.70.605.006.90
S ***.CP0.500.300.701.70
SP1.400.101.005.00
SL1.400.701.6010.6
SR8.204.4004.30
GMR5.302.000.9012.8
NT10.33.900.101.50
Explanations and definitions are provided in Table 2. Significant variations: * 0.01 < p ≤ 0.05, *** p ≤ 0.001.
Table 5. The weed communities based on soil pH requirements, 2015.
EvaluationFactorsWeed Communities
5678x
Quantitative,
biomass of weed, g m−2
RCP0014.603.40
SP6.10012.60.401.70
SL01.1010.30.406.50
SR2.6011.0005.40
GMR014.8003.40
NT019.5007.20
S ***CP0020.00.801.30
SP2.70010.202.50
SL0019.602.50
SR2.700009.60
GMR06.600015.4
NT010.30021.1
Explanations and definitions are provided in Table 2. *** denotes significant variation (p ≤ 0.001).
Table 6. The weed communities based on soil moisture requirements, 2013.
EvaluationFactorsWeed Communities
45678x
Quantitative,
biomass of weed, g m−2
RCP00.1000100.60.30
SP ***16.00.7000115.33.50
SL *22.82.000085.317.6
SR ***2.6030.31.404.9046.80.50
GMR ***034.56.7026.601.60
NT ***034.812.96.8003.90
S ***CP07.9000114.918.8
SP ***19.52.406.40095.63.90
SL ***49.13.200034.310.6
SR ***06.904.9056.603.40
GMR ***012.31.9030.802.60
NT ***019.00.2033.403.10
Explanations and definitions are provided in Table 2. Significant differences: * 0.01 < p ≤ 0.05, *** p ≤ 0.001.
Table 7. The weed communities based on soil moisture requirements, 2014.
EvaluationFactorsWeed Communities
4578x
Quantitative,
biomass of weed, g m−2
RCP0.100.6002.004.00
SP01.4002.706.50
SL0.301.0003.4013.7
SR05.7004.0021.7
GMT ***02.3009.7034.6
NT **4.3002.900.7027.3
S ***CP0.200.400.800.301.50
SP0.100.2001.405.80
SL ***0.100.8007.505.90
SR04.400012.5
GMR02.1002.0016.9
NT02.9000.8012.1
Factor and ecological group explanations are provided in Table 2. Significant differences: ** 0.001 < p ≤ 0.01, *** p ≤ 0.001.
Table 8. The weed communities based on soil moisture requirements, 2015.
EvaluationFactorsWeed Communities
456x
Quantitative,
biomass of weed, g m−2
RCP0.101.50016.4
SP0.105.60015.1
SL0.406.6010.21.10
SR05.306.007.70
GMR03.700.8013.7
NT *07.40019.3
S ***CP0.802.10019.2
SP ***08.502.704.20
SL0.109.40012.6
SR03.3009.00
GMR010.82.308.90
NT **019.83.108.50
Factor and ecological group explanations are provided in Table 2. Significant differences: * 0.01 < p ≤ 0.05, ** 0.001 < p ≤ 0.01, *** p ≤ 0.001.
Table 9. The weed communities based on soil nitrogen requirements, 2013.
EvaluationFactorsWeed Communities
3678x
Quantitative,
biomass of weed, g m−2
RCP000.10100.90
SP ***08.300.70126.50
SL ***06.7020.3100.70
SR ***12.8020.146.86.80
GMR ***0.20021.747.50
NT ***0.2020.116.821.30
S ***CP018.87.90114.90
SP *0012.195.620.1
SL ***04.9015.876.50
SR ***014.617.622.816.8
GMR ***15.51.9019.410.80
NT ***3.303.3016.332.80
Explanations for factors and ecological groups are provided in Table 2. Significant differences: * 0.01 < p ≤ 0.05, *** p ≤ 0.001.
Table 10. The weed communities based on soil nitrogen requirements, 2014.
EvaluationFactorsWeed Communities
678x
Quantitative,
biomass of weed, g m−2
RCP3.900.802.000
SP3.204.502.900
SL1.5010.46.500
SR3.7014.610.22.70
GMR ***0.8012.532.80.50
NT **2.908.9023.40
S ***CP1.600.800.600.20
SP1.103.502.600.30
SL1.703.708.800.10
SR04.308.204.40
GMR1.0012.77.200.10
NT **0.101.5012.12.10
Explanations for factors and ecological groups are provided in Table 2. Significant differences: ** 0.001 < p ≤ 0.01, *** p ≤ 0.001.
Table 11. The weed communities based on soil nitrogen requirements, 2015.
EvaluationFactorsWeed Communities
678x
Quantitative,
biomass of weed, g m−2
RCP016.91.100
SP15.55.200.100
SL5.607.605.100
SR05.7013.30
GMR06.6011.60
NT07.2019.50
S ***CP18.82.101.200
SP011.22.401.80
SL15.13.900.502.60
SR1.303.305.002.70
GMR8.107.306.600
NT15.97.707.800
Explanations for factors and ecological groups are provided in Table 2. Significant differences: *** p ≤ 0.001.
Publisher’s Note: MDPI stays neutral with regard to jurisdictional claims in published maps and institutional affiliations.

