
Analysis of the Future Land Use Land Cover Changes in the Gaborone Dam Catchment Using CA-Markov Model: Implications on Water Resources


Abstract
:1. Introduction
2. Materials and Methods
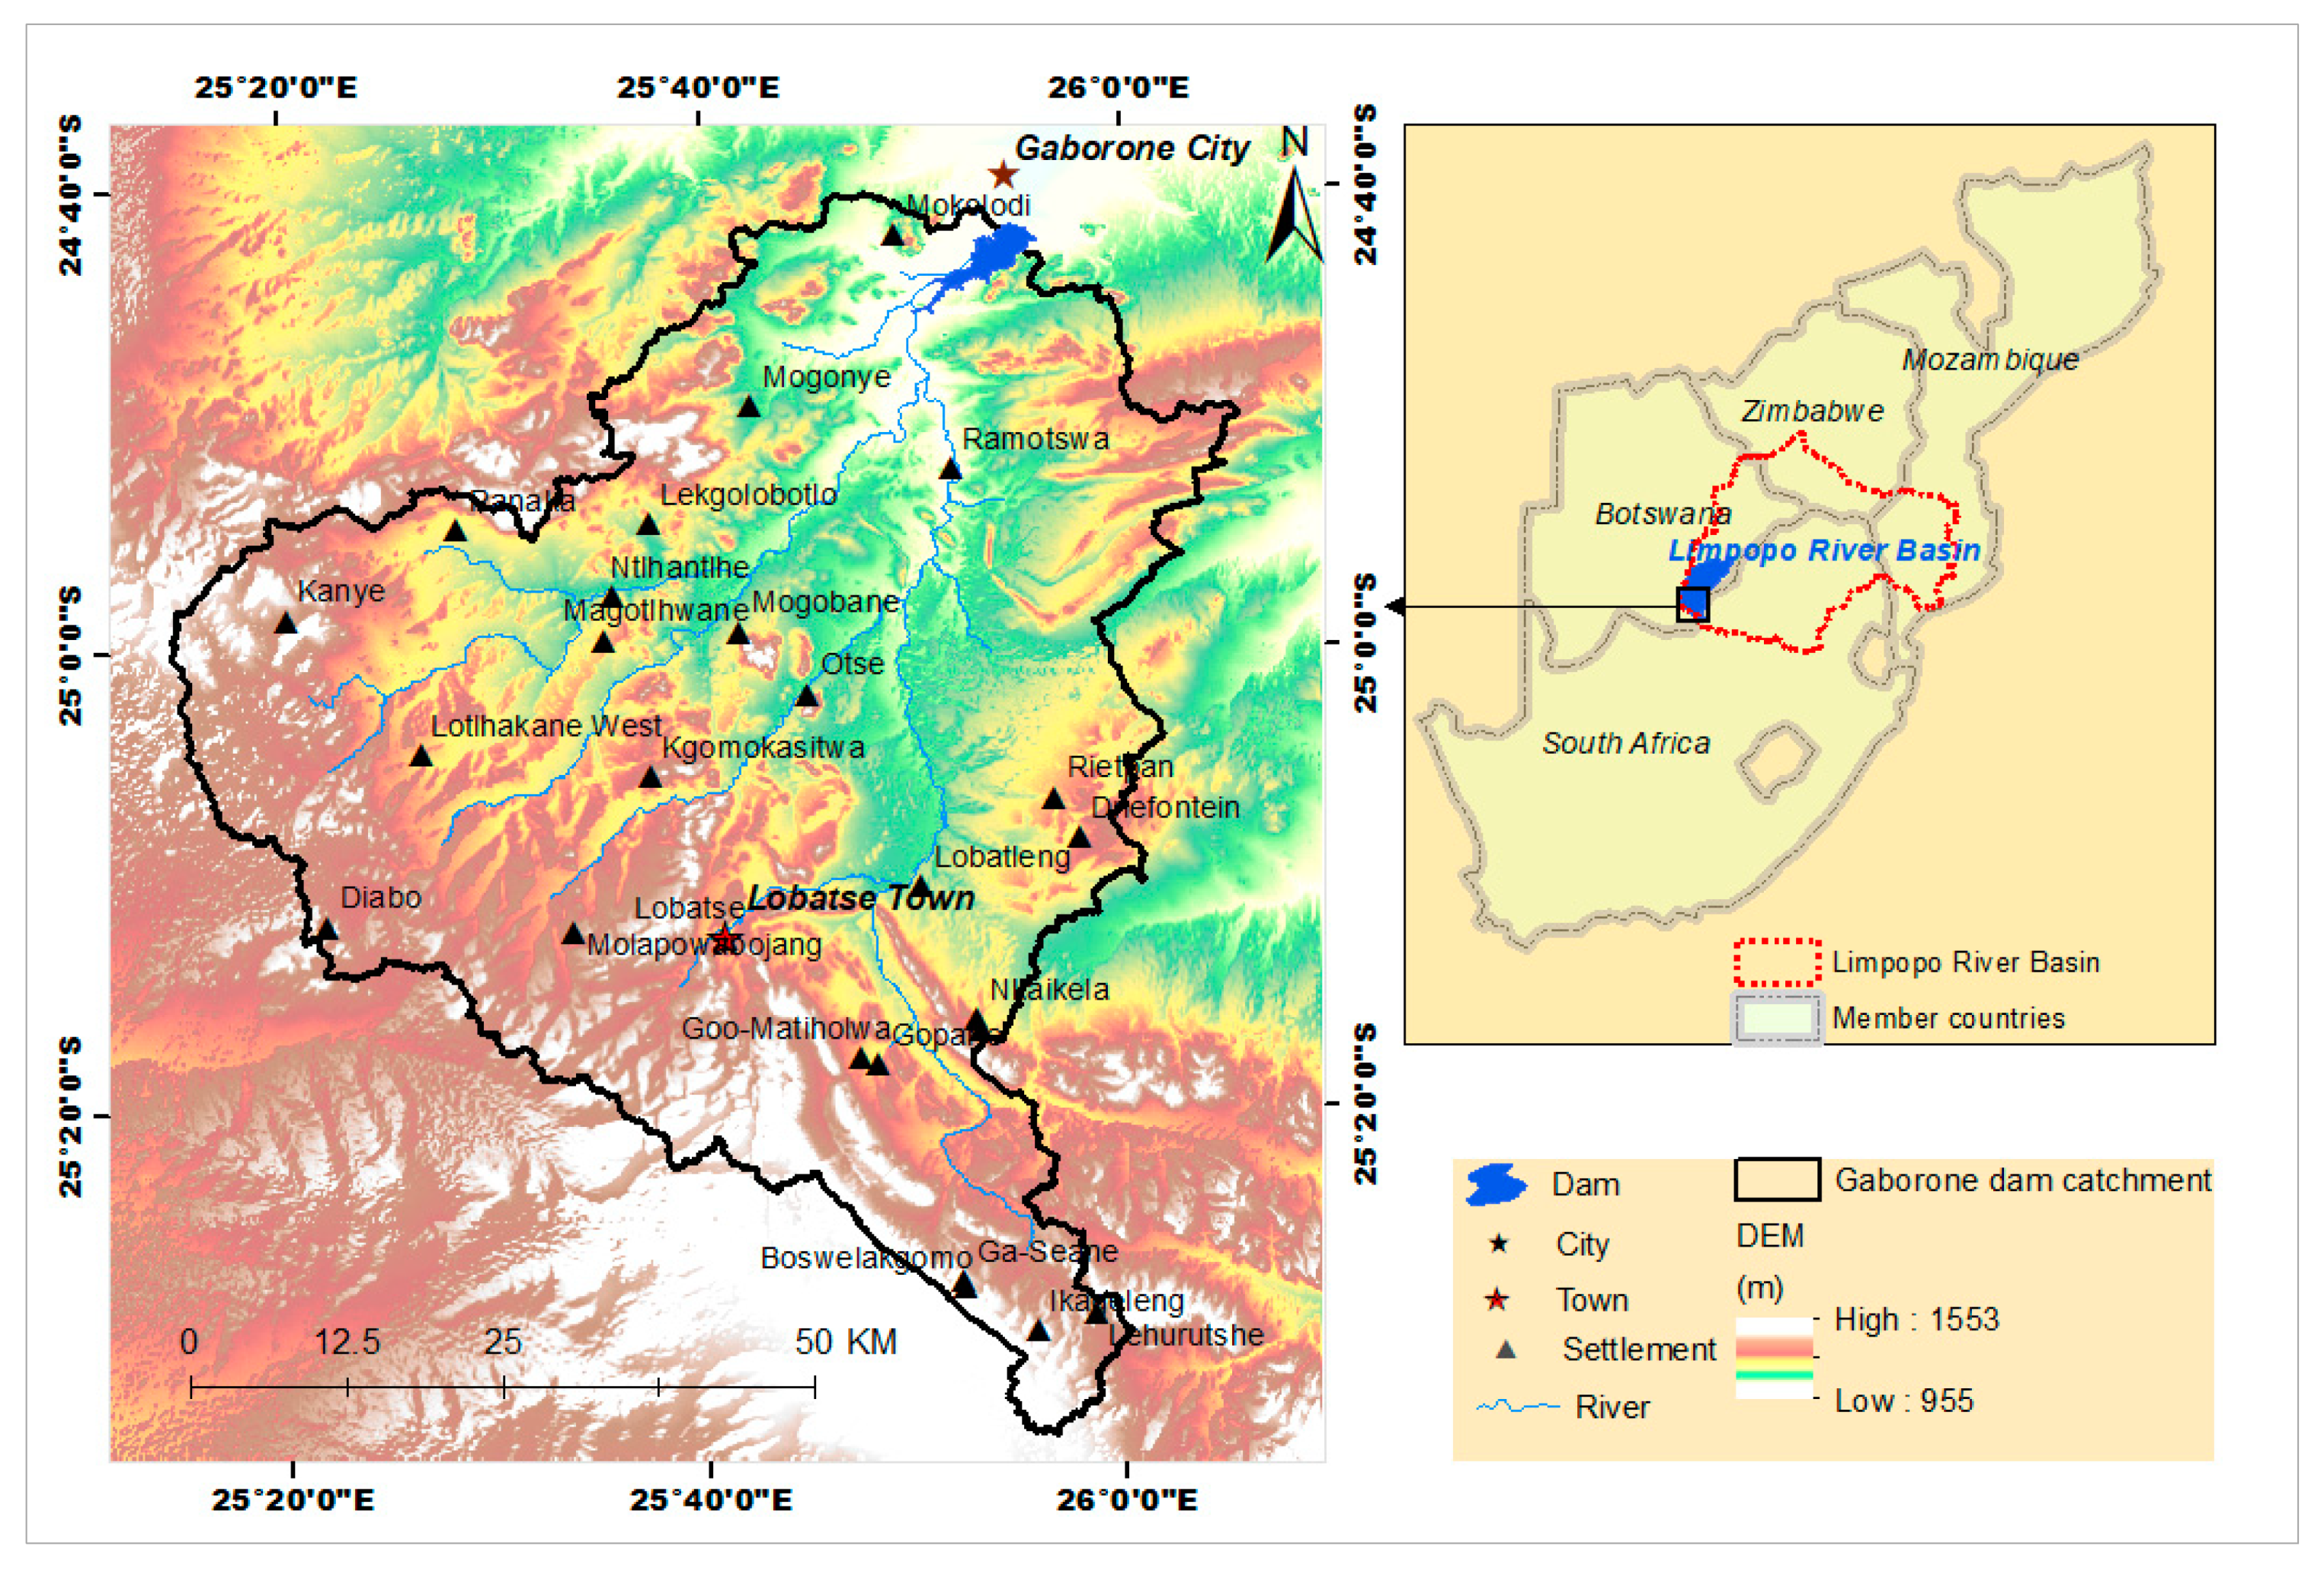
2.1. Description of the Study Area
2.2. LULC Data Sources and Classification
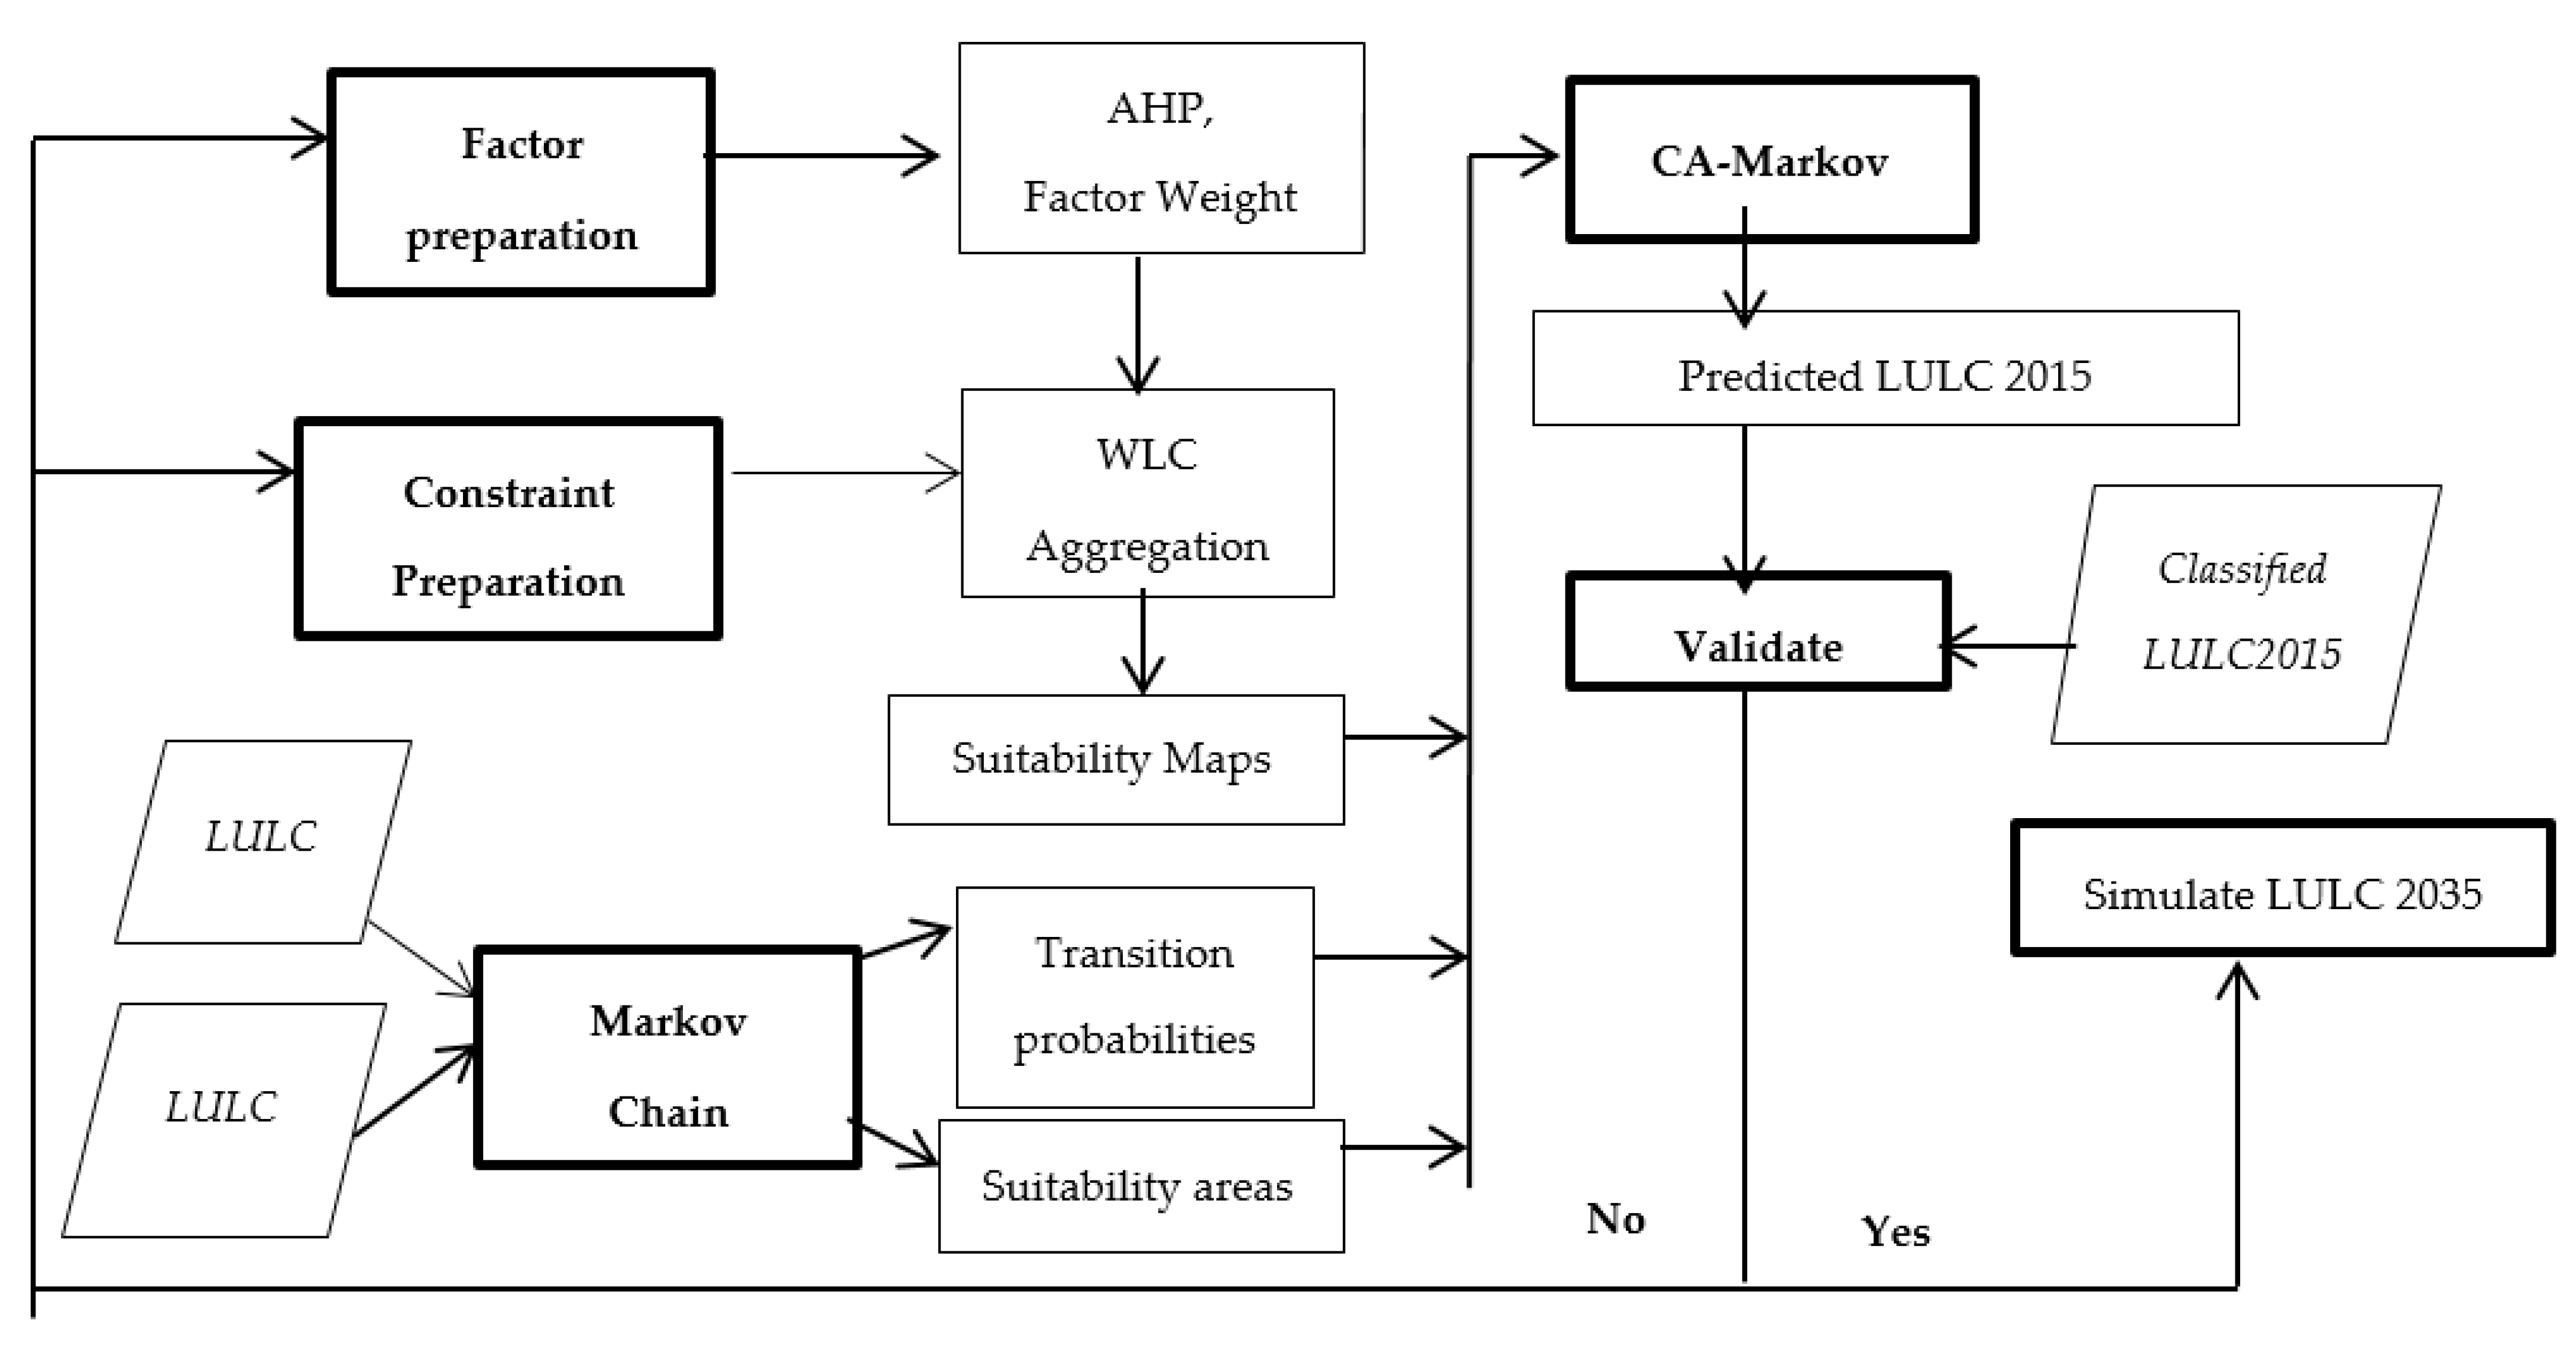
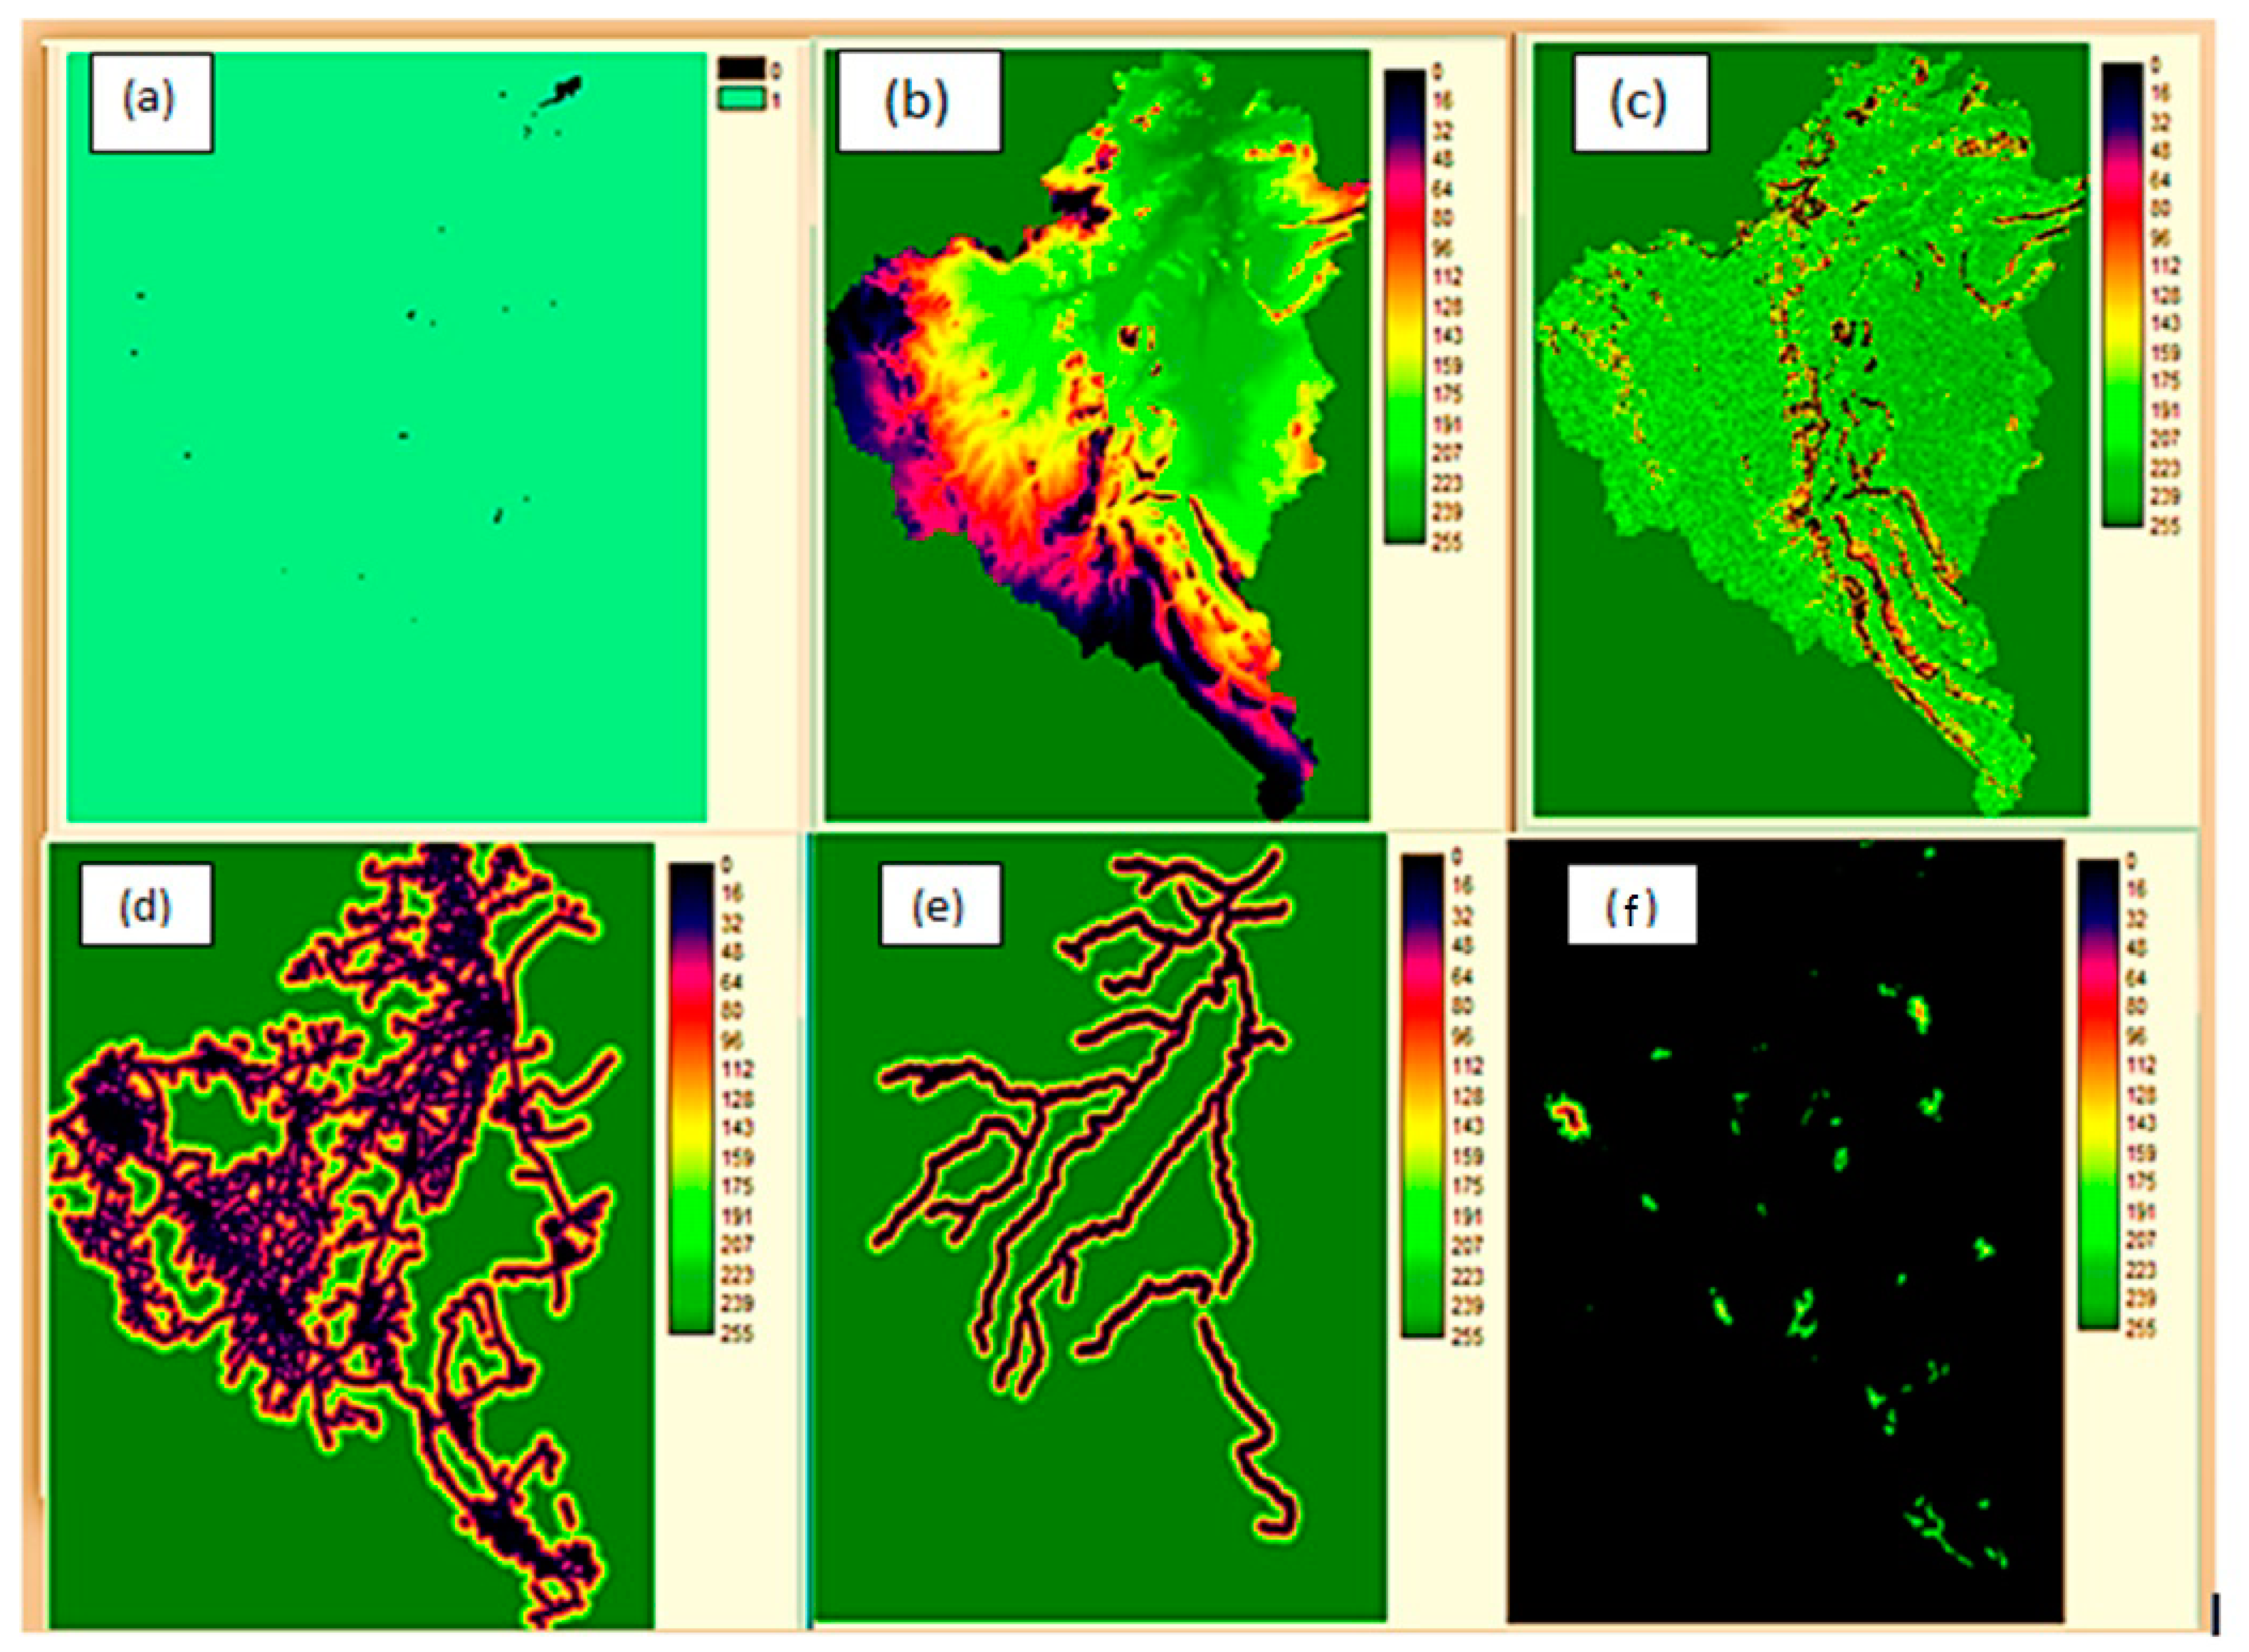
2.3. A Model Approach
2.4. LULC Modelling with CA-Markov Model
2.5. CA-Markov Model Validation
3. Results
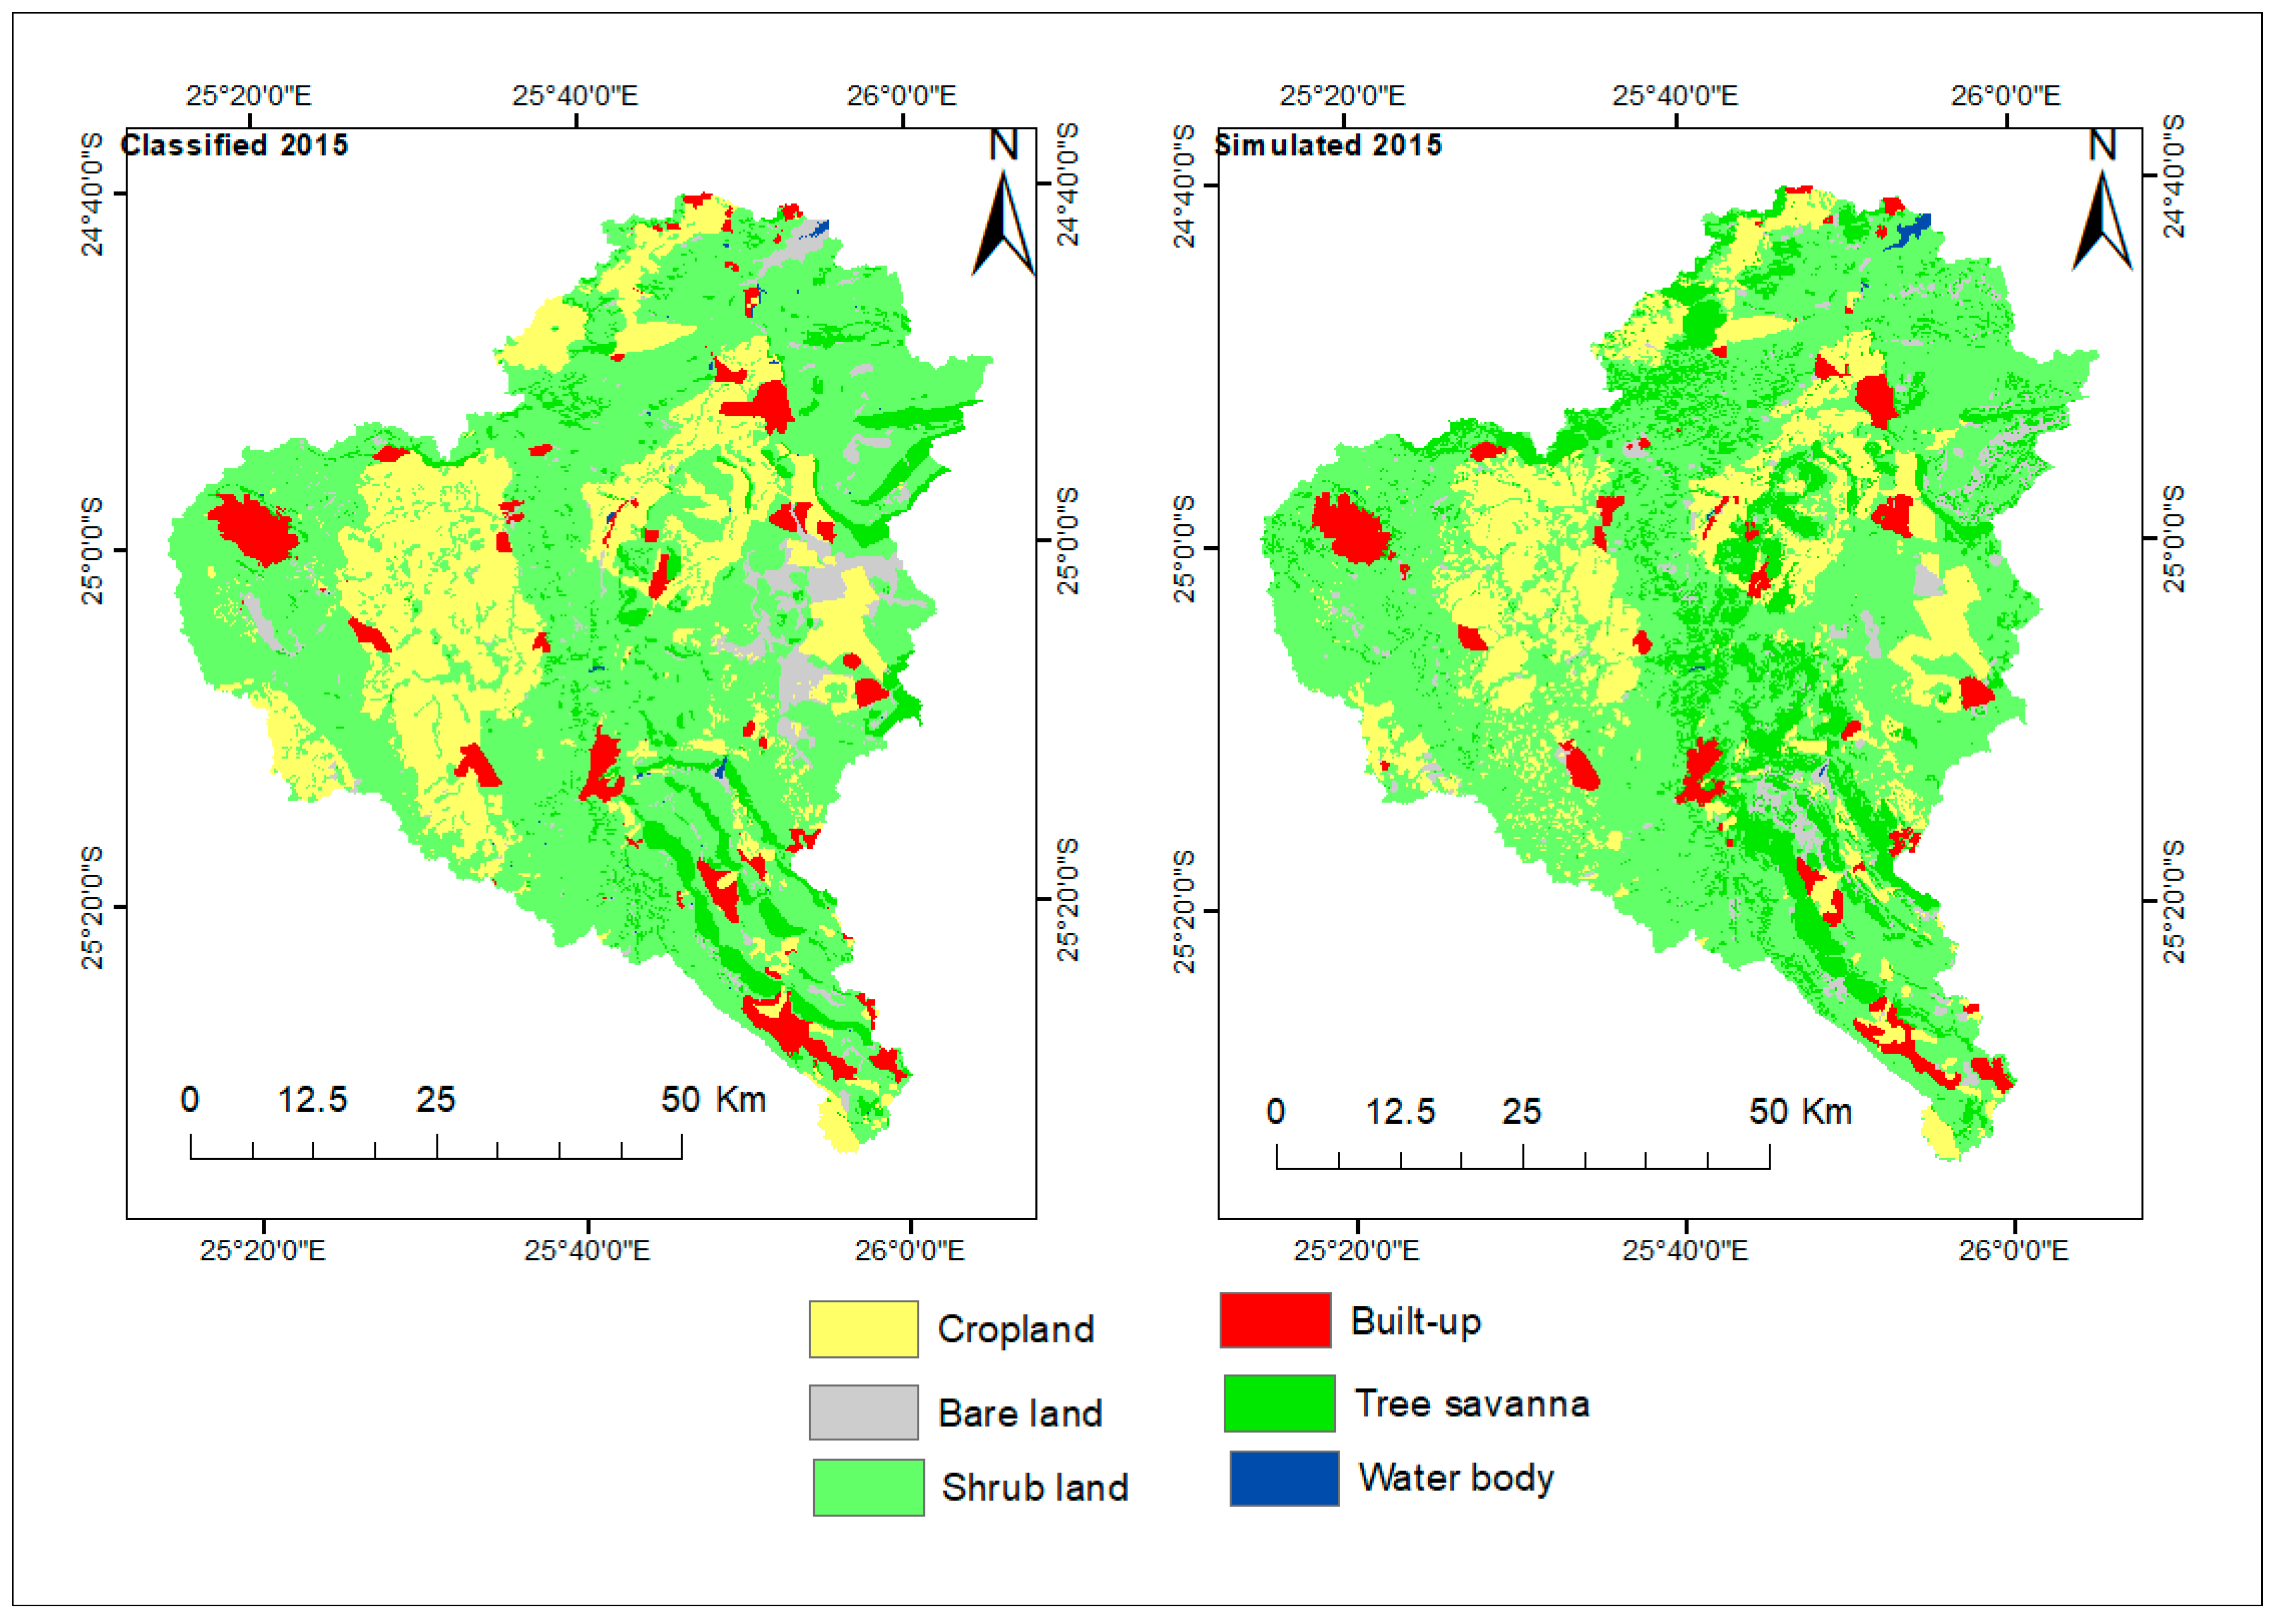
3.1. CA-Markov Model Validation
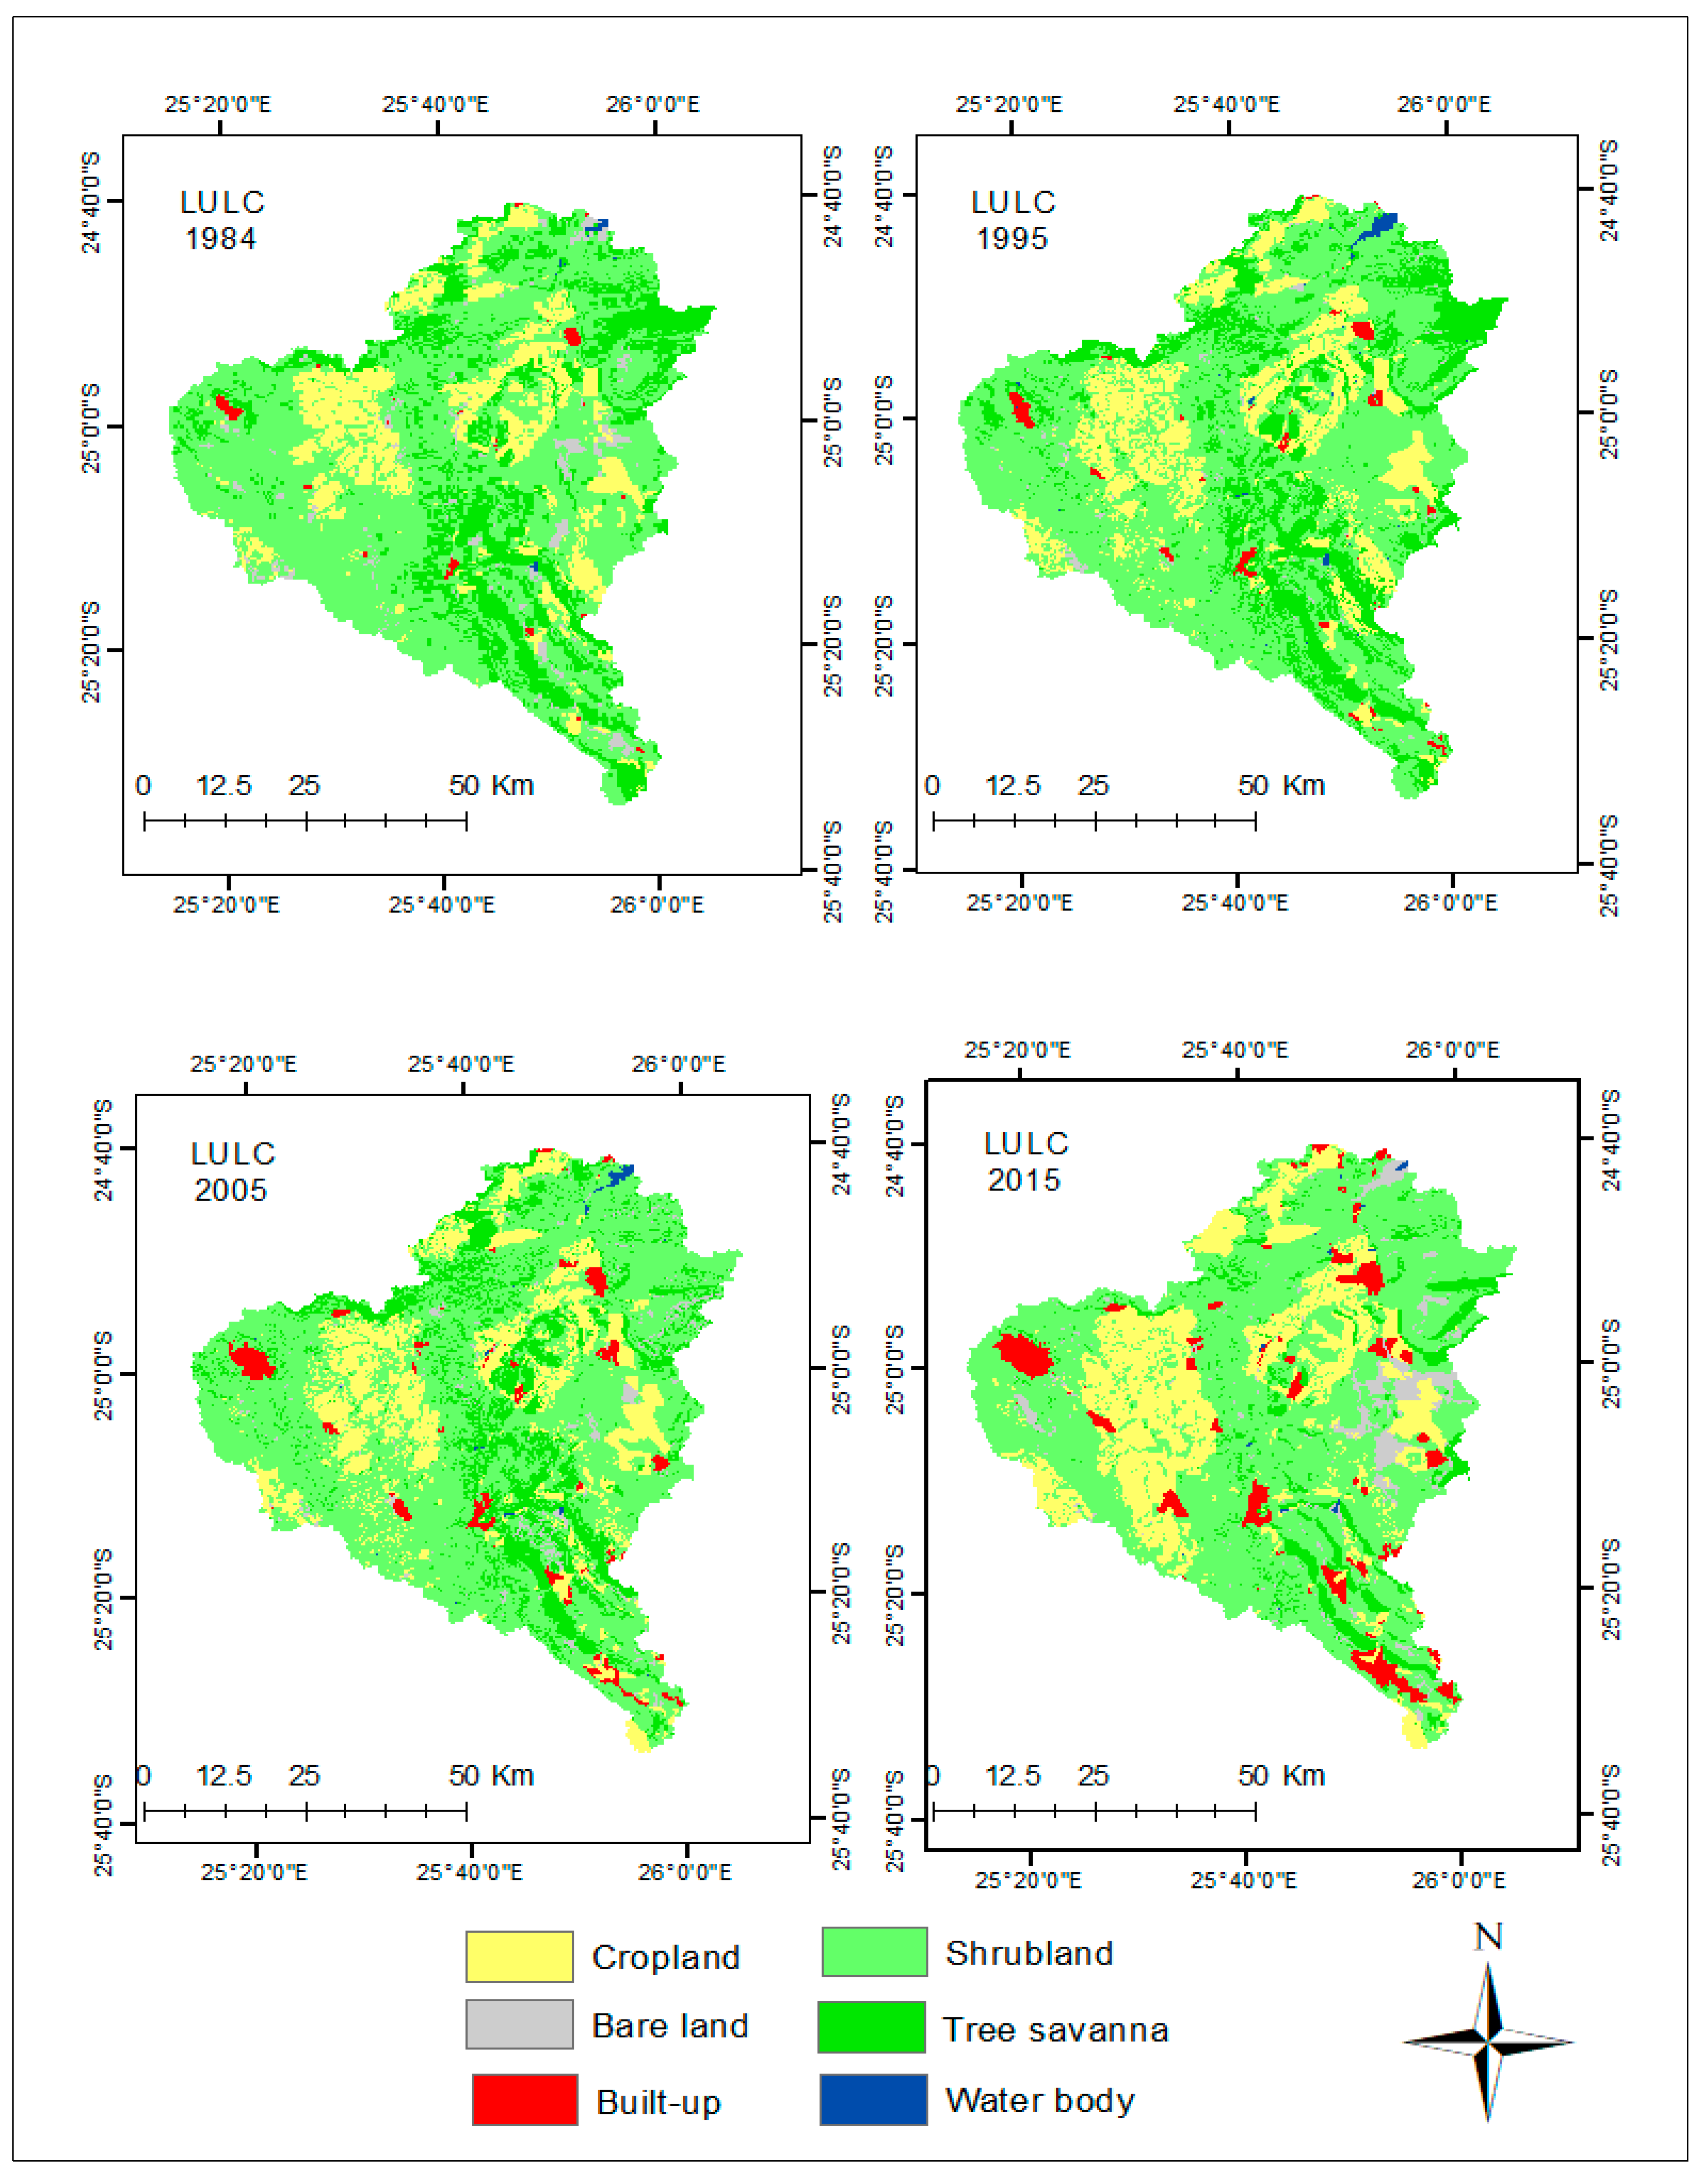
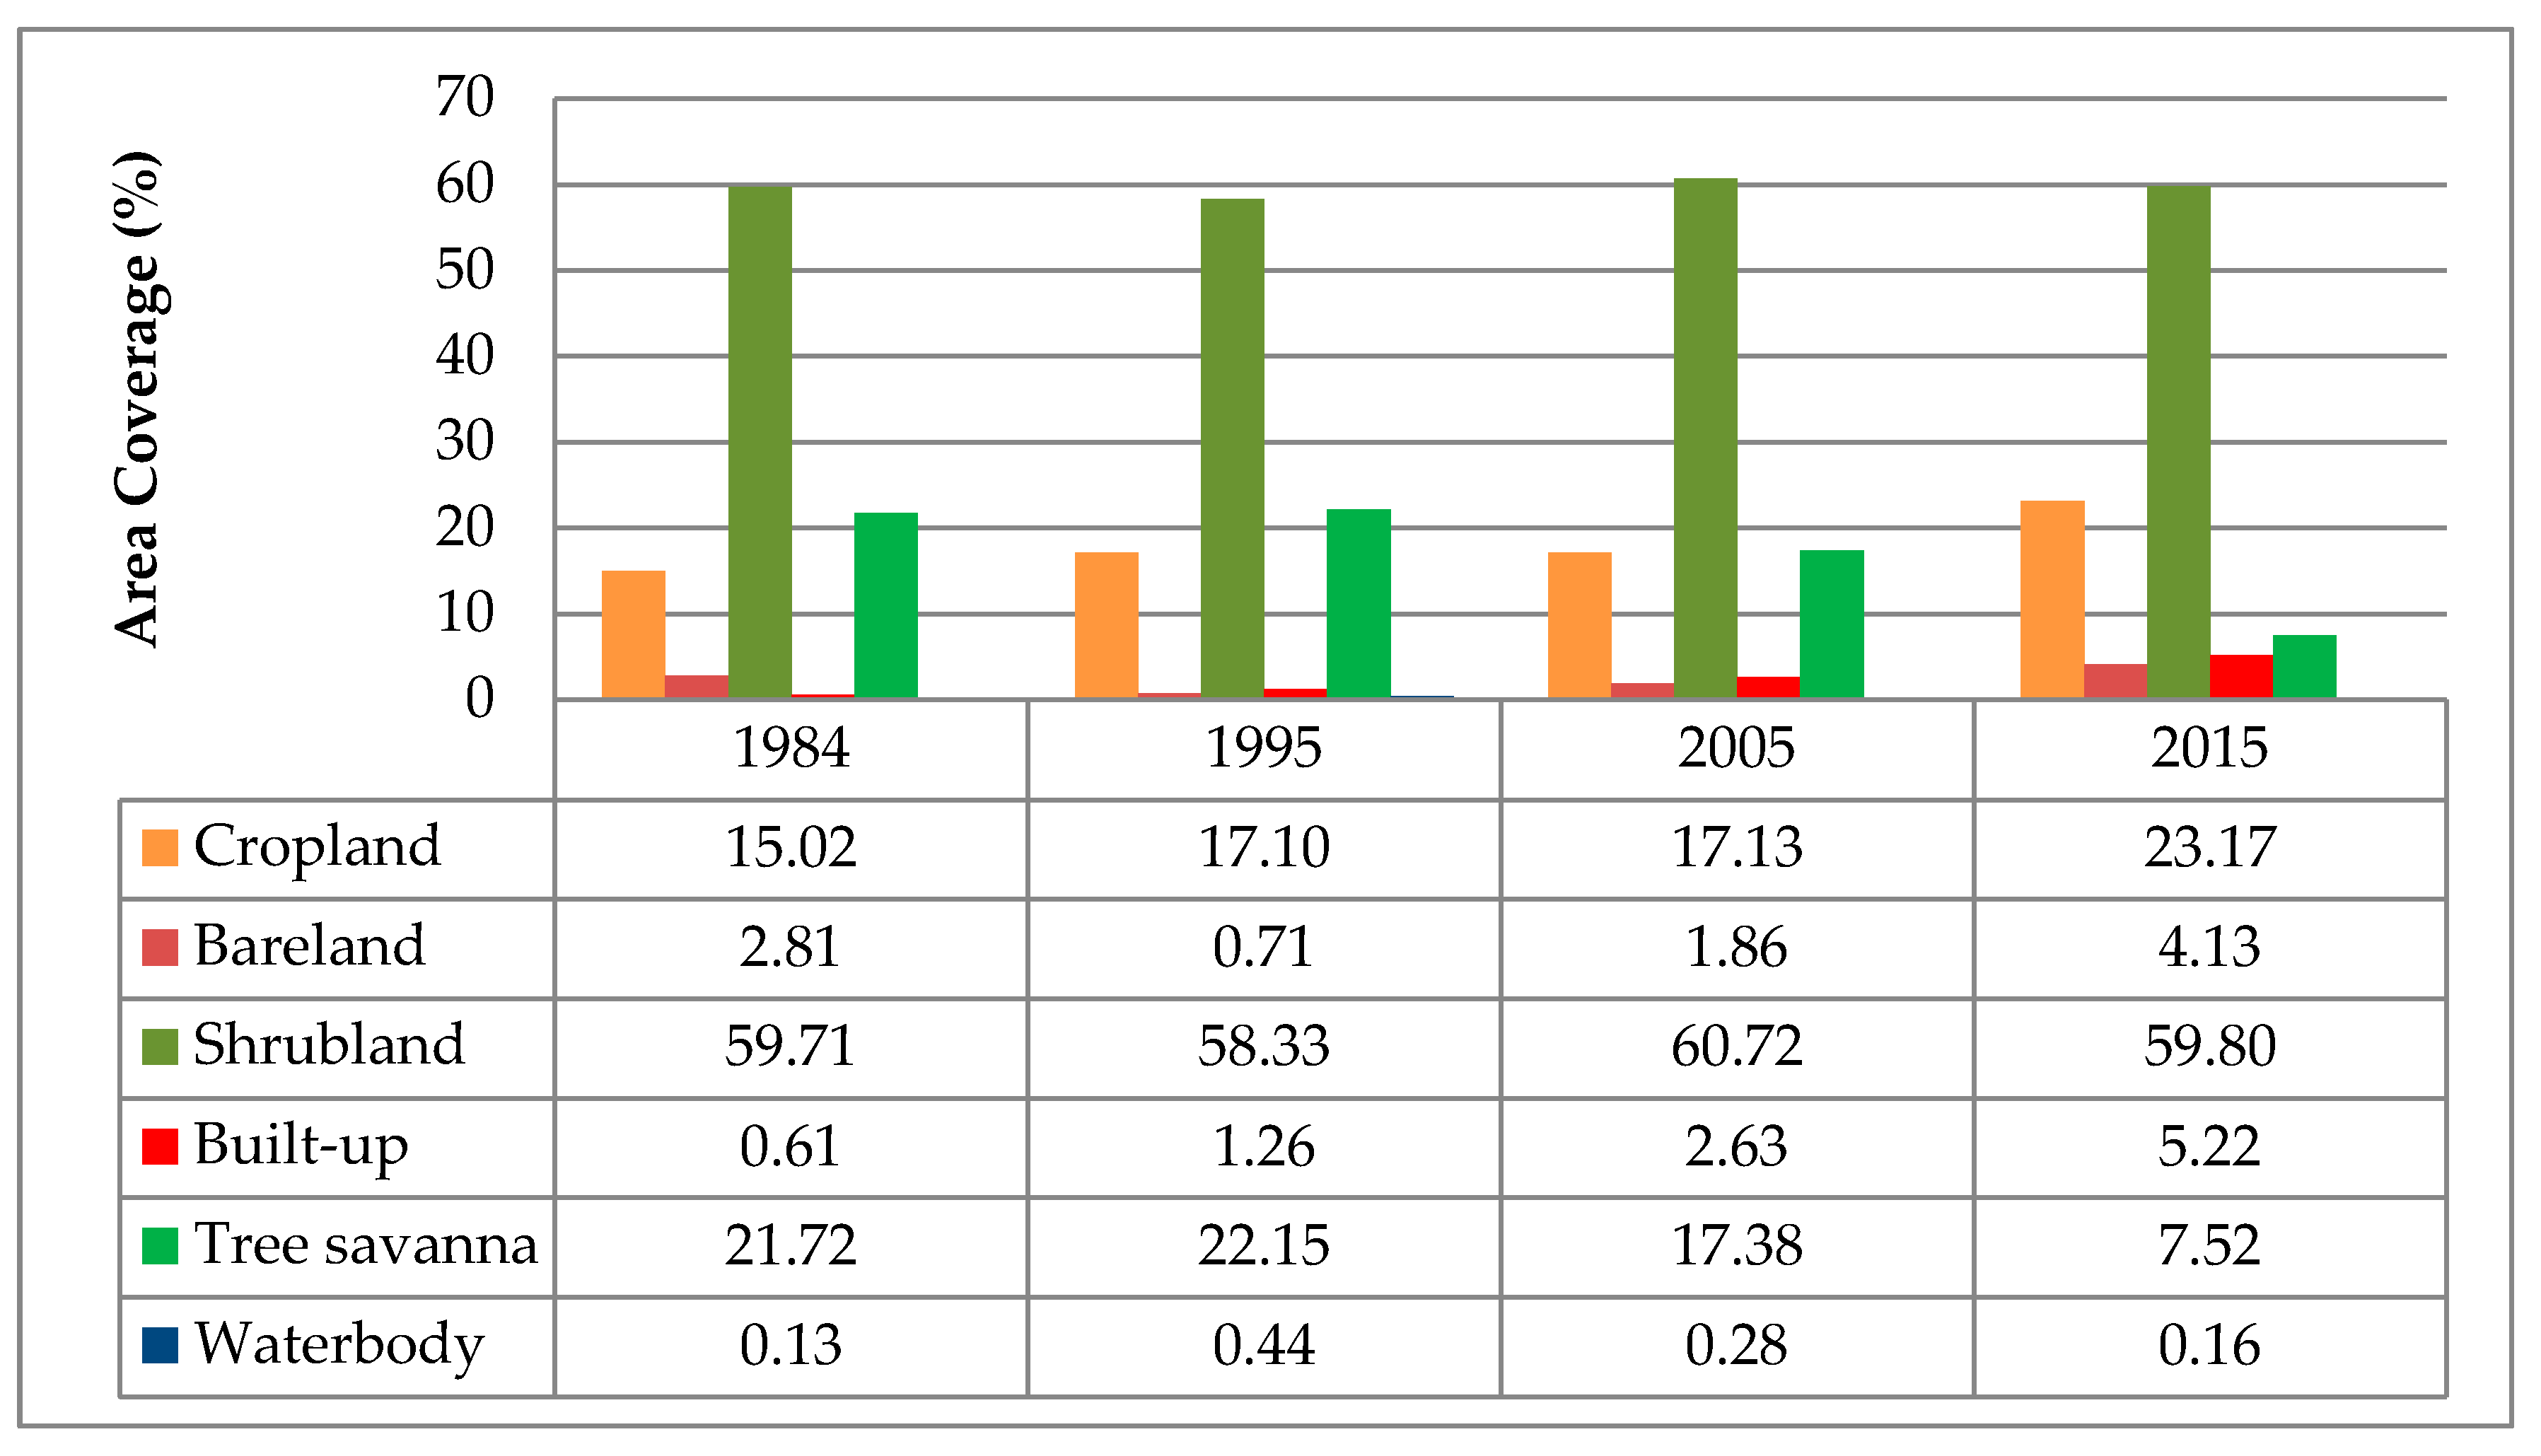
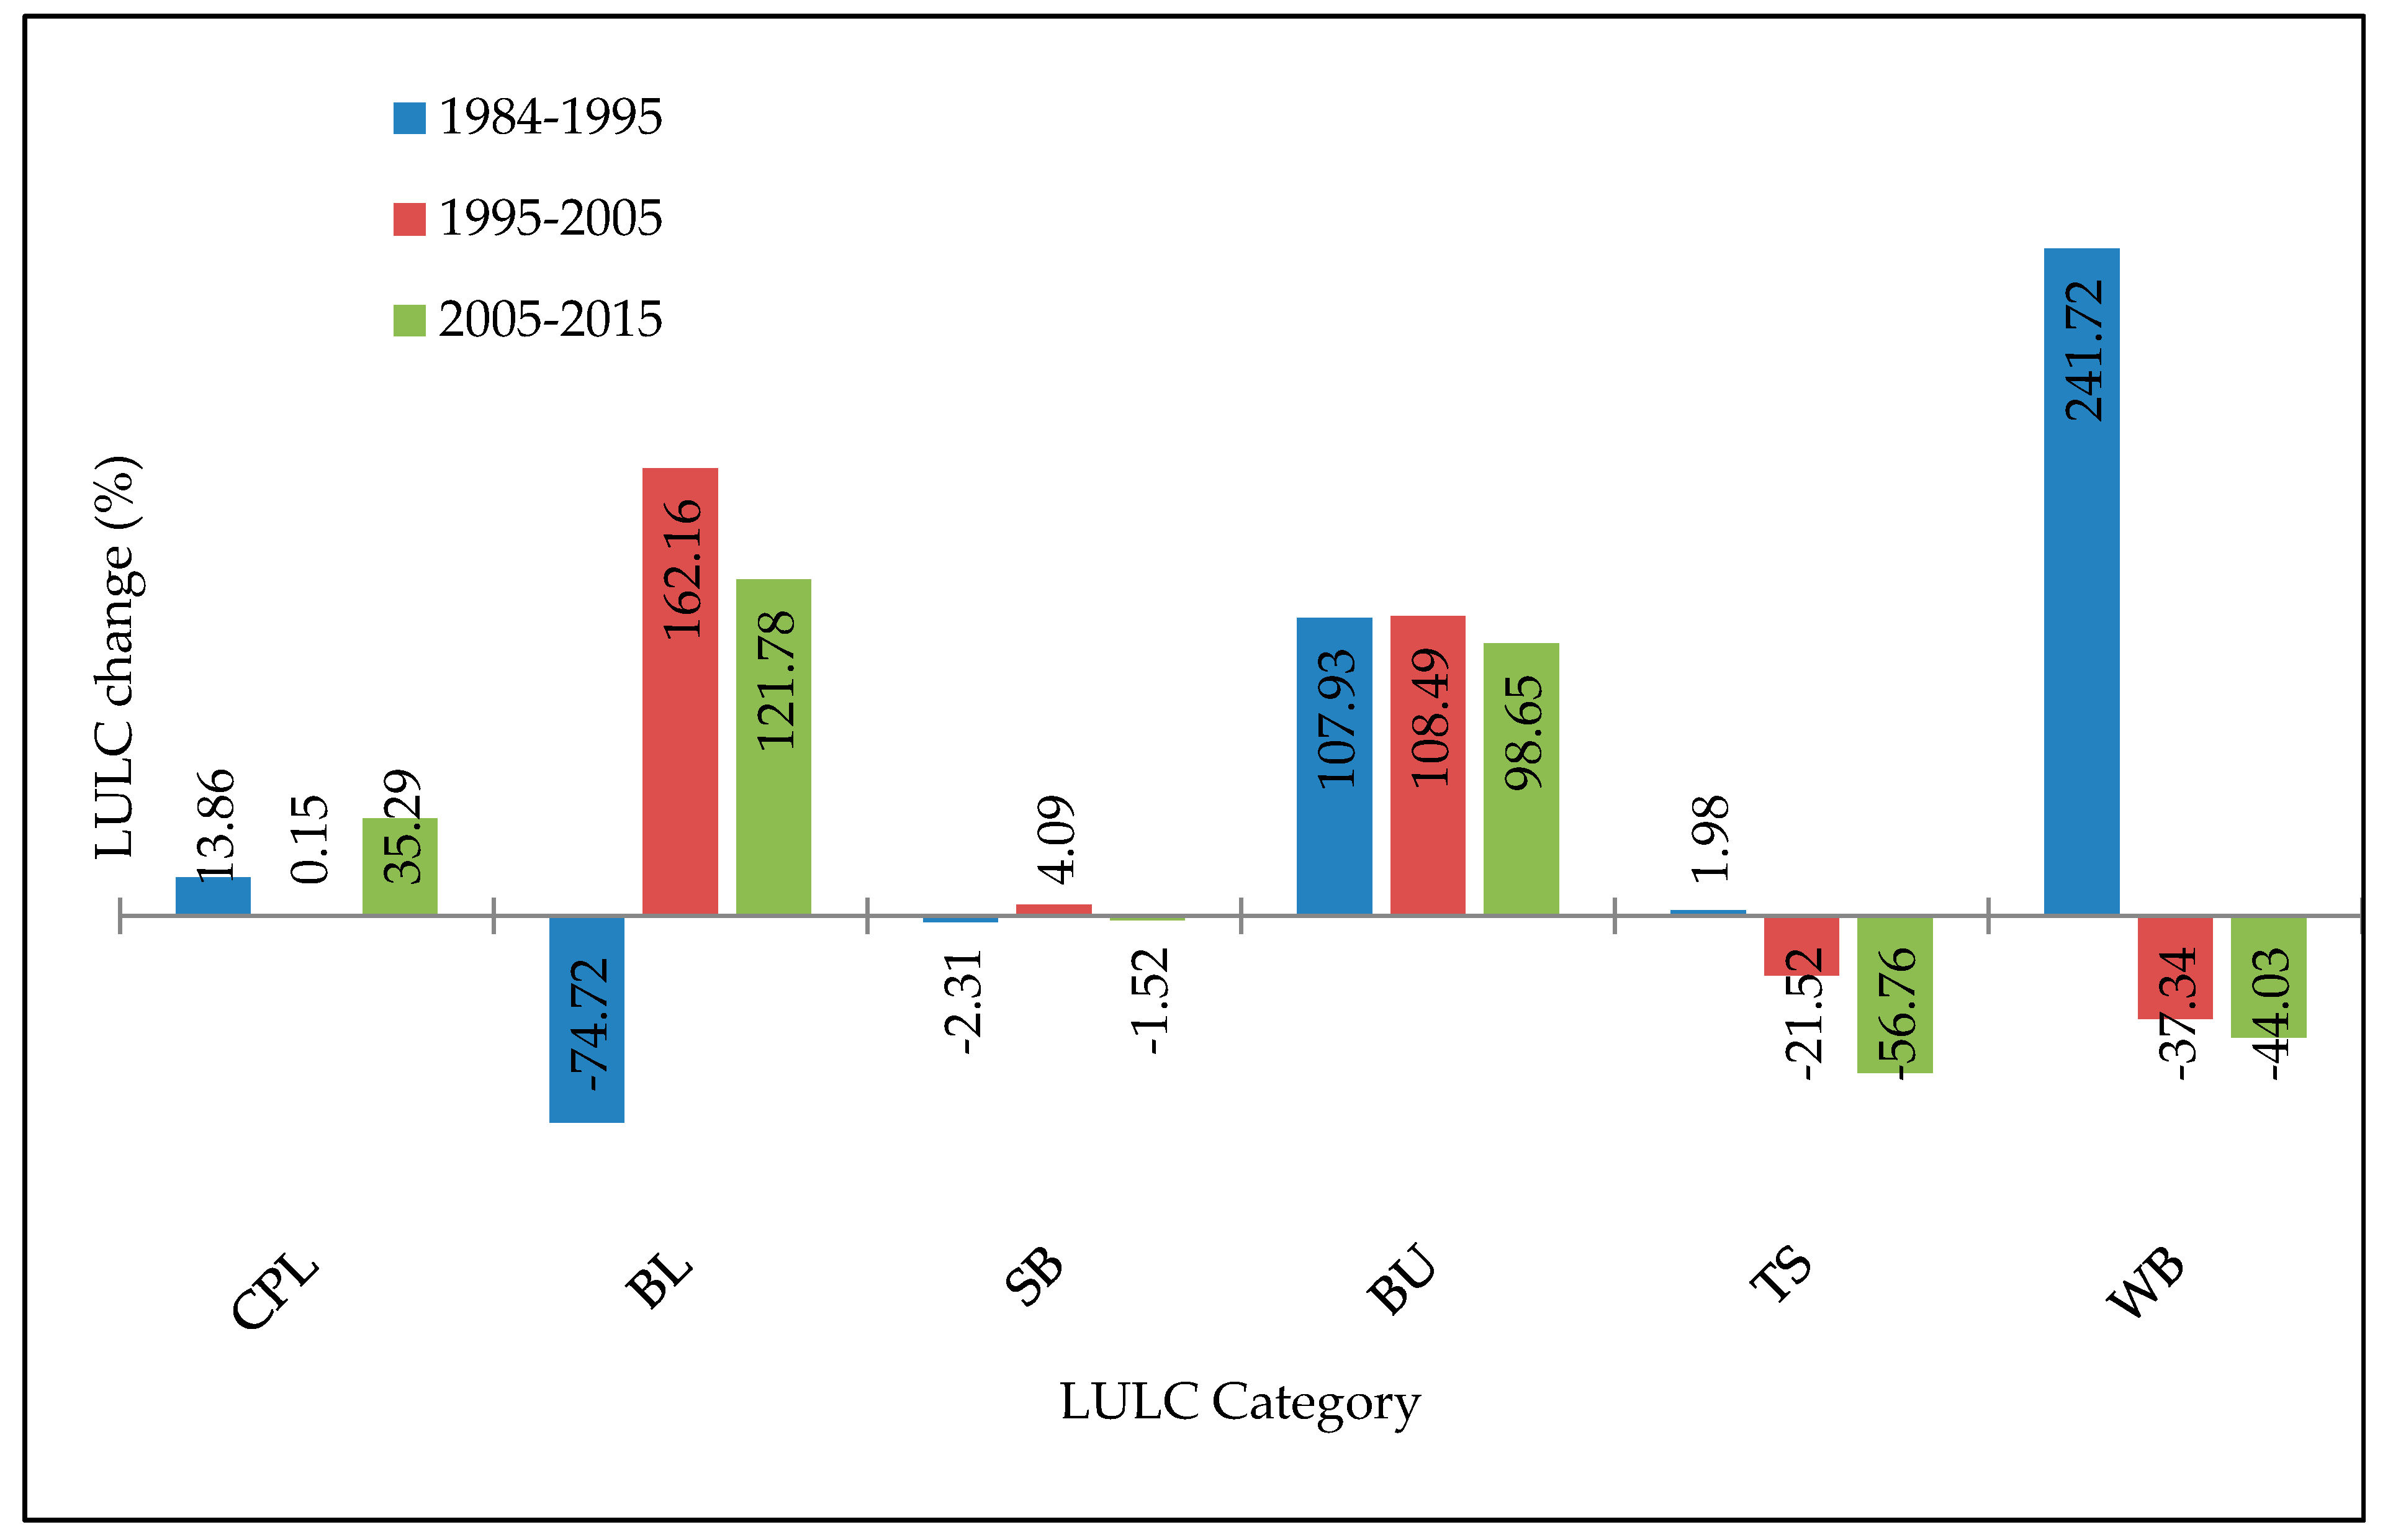
3.2. Past LULC Changes and Markovian Probability Transition Matrices
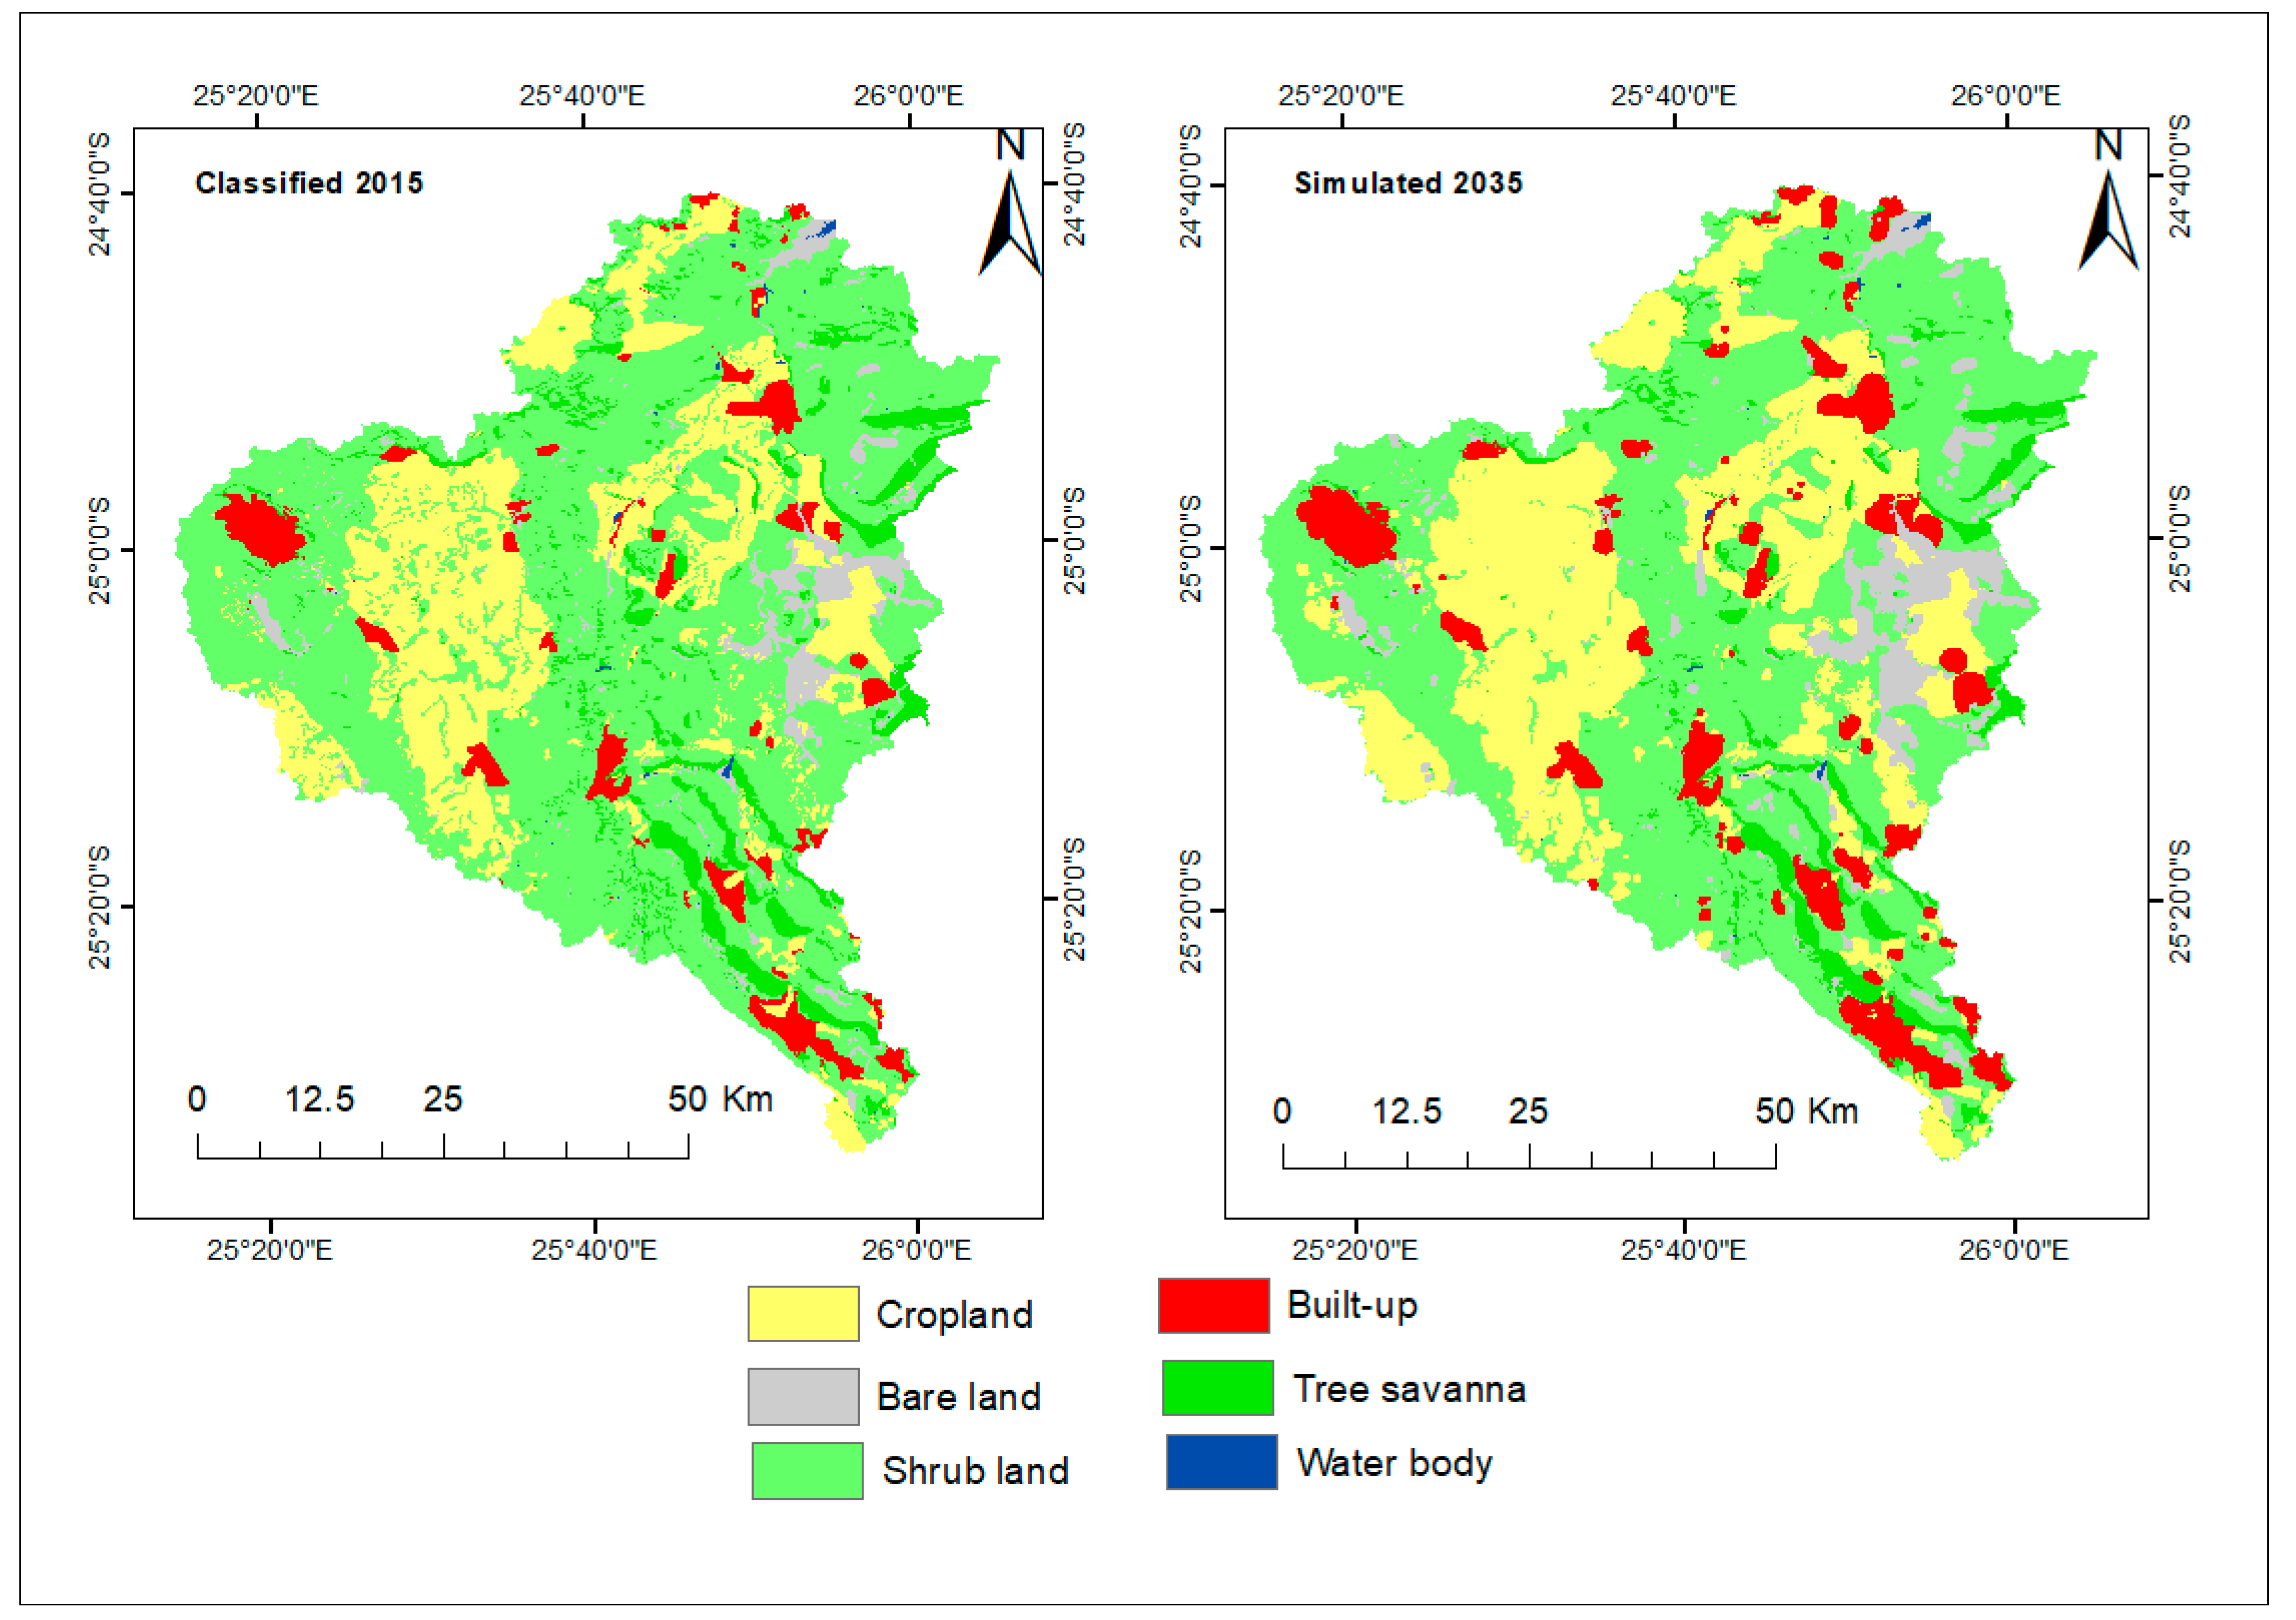
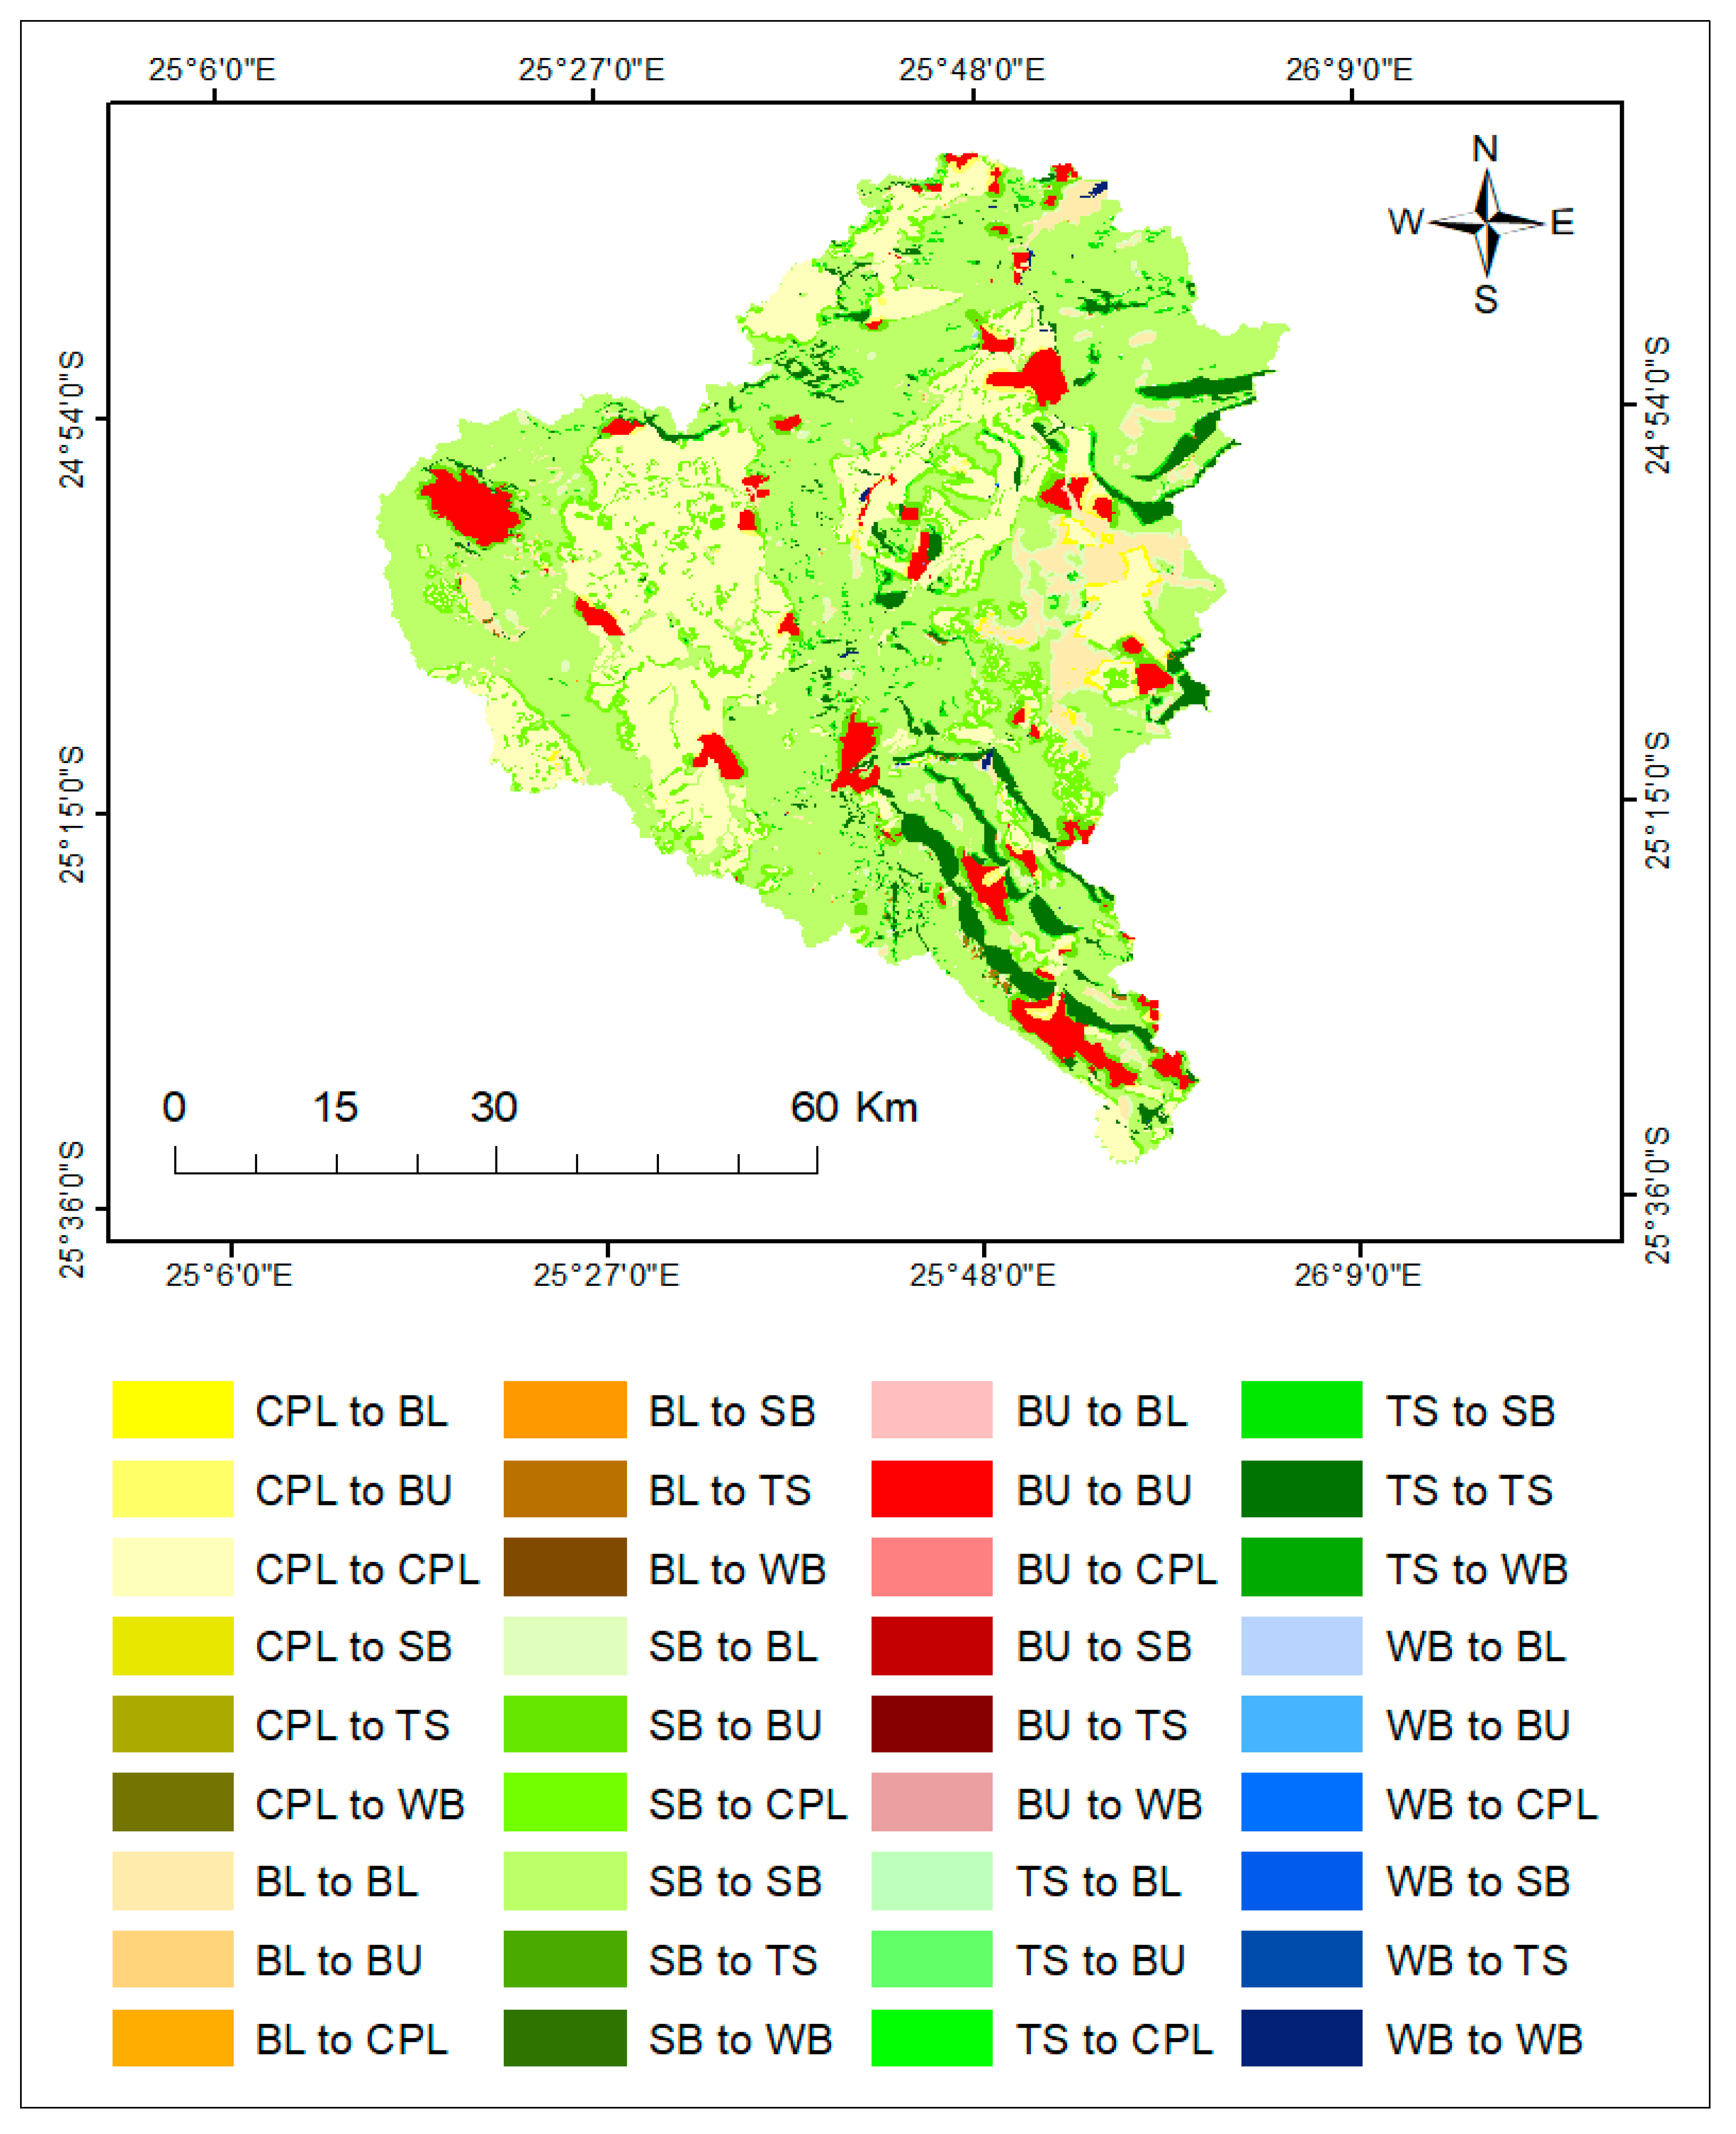
3.3. Simulation of LULC Changes for 2035
4. Discussion
4.1. CA-Markov Model Validation
4.2. Simulation of LULC Changes for 2035
4.3. Implications of LULC Changes on Water Resources
5. Conclusions
Author Contributions
Funding
Acknowledgments
Conflicts of Interest
References
- Karki, S.; Thandar, A.M.; Uddin, K.; Tun, S.; Aye, W.M.; Aryal, K.; Kandel, P.; Chettri, N. Impact of land use land cover change on ecosystem services: A comparative analysis on observed data and people’s perception in Inle Lake, Myanmar. Environ. Syst. Res. 2018, 7, 25. [Google Scholar] [CrossRef] [Green Version]
- Tolessa, T.; Senbeta, F.; Kidane, M. The impact of land use/land cover change on ecosystem services in the central highlands of Ethiopia. Ecosyst. Serv. 2017, 23, 47–54. [Google Scholar] [CrossRef]
- Benzer, N. Using the geographical information system and remote sensing techniques for soil erosion assessment. Pol. J. Environ. Stud. 2010, 19, 881–886. [Google Scholar]
- Permatasari, R.J.; Damayanti, A.; Indra, T.L.; Dimyati, M. Prediction of Land Cover Changes in Penajam Paser Utara Regency Using Cellular Automata and Markov Model. In Earth and Environmental Science; IOP Conference Series; IOP Publishing: Semarang, Indonesia, 2021. [Google Scholar]
- Hossain, F.; Moniruzzaman, M. Environmental Change Detection through Remote Sensing Technique: A Study of Rohingya Refugee Camp Area (Ukhia and Teknaf Sub-district), Cox’s Bazar, Bangladesh. Environ. Chall. 2021, 100024. [Google Scholar] [CrossRef]
- Sibanda, S.; Ahmed, F. Modelling historic and future land use/land cover changes and their impact on wetland area in Shashe sub-catchment, Zimbabwe. Model. Earth Syst. Environ. 2021, 7, 57–70. [Google Scholar] [CrossRef]
- Dibaba, W.T.; Demissie, T.A.; Miegel, K. Watershed Hydrological Response to Combined Land Use/Land Cover and Climate Change in Highland Ethiopia: Finchaa Catchment. Water 2020, 12, 1801. [Google Scholar] [CrossRef]
- Shi, Y.; Xiao, J.; Shen, Y.; Yamaguchi, Y. Quantifying the spatial differences of landscape change in the Hai River Basin, China, in the 1990s. Int. J. Remote. Sens. 2011, 33, 4482–4501. [Google Scholar] [CrossRef]
- Zhang, K.; Ruben, G.B.; Li, X.; Li, Z.; Yu, Z.; Xia, J.; Dong, Z. A comprehensive assessment framework for quantifying climatic and anthropogenic contributions to streamflow changes: A case study in a typical semi-arid North China basin. Environ. Model. Softw. 2020, 104704. [Google Scholar] [CrossRef]
- Armin, M.; Majidian, M.; Kheybari, V.G. Land Use/Land Cover Change Detection and Prediction in the Yasouj City Suburbs in Kohgiluyeh Va Boyerahmad Province in Iran. Arid. Ecosyst. 2020, 10, 203–210. [Google Scholar] [CrossRef]
- Brasil, J.B.; De Andrade, E.M.; Palácio, H.A.D.Q.; Medeiros, P.H.A.; Dos Santos, J.C.N. Characteristics of precipitation and the process of interception in a seasonally dry tropical forest. J. Hydrol. Reg. Stud. 2018, 19, 307–317. [Google Scholar] [CrossRef]
- Franchi, F.; Ahad, J.M.E.; Geris, J.; Jhowa, G.; Petros, A.K.; Comte, J.-C. Modern sediment records of hydroclimatic extremes and associated potential contaminant mobilization in semi-arid environments: Lessons learnt from recent flood-drought cycles in southern Botswana. J. Soils Sediments 2019, 20, 1632–1650. [Google Scholar] [CrossRef] [Green Version]
- Mohan, C.; Western, A.W.; Wei, Y.; Saft, M. Predicting groundwater recharge for varying land cover and climate conditions—A global meta-study. Hydrol. Earth Syst. Sci. 2018, 22, 2689–2703. [Google Scholar] [CrossRef] [Green Version]
- Mulungu, D.M.; Kashaigili, J.J. Dynamics of land use and land cover changes and implications on river flows in Simiyu River catchment, Lake Victoria Basin in Tanzania. Nile Basin Water Sci. Eng. J. 2012, 5, 23–35. [Google Scholar]
- Teklay, A.; Dile, Y.T.; Setegn, S.G.; Demissie, S.S.; Asfaw, D.H. Evaluation of static and dynamic land use data for watershed hydrologic process simulation: A case study in Gummara watershed, Ethiopia. Catena 2019, 172, 65–75. [Google Scholar] [CrossRef]
- Li, L.; Jiang, D.; Li, J.; Liang, L.; Zhang, L. Advances in hydrological response to land use/land cover change. J. Nat. Resour. 2007, 22, 211–224. [Google Scholar]
- Behera, M.D.; Borate, S.N.; Panda, S.N.; Behera, P.R.; Roy, P.S. Modelling and analyzing the watershed dynamics using Cellular Automata (CA)–Markov model—A geo-information based approach. J. Earth Syst. Sci. 2012, 121, 1011–1024. [Google Scholar] [CrossRef] [Green Version]
- Islam, M.S.; Ahmed, R. Land use change prediction in Dhaka city using GIS aided Markov chain modeling. J. Life Earth Sci. 2011, 6, 81–89. [Google Scholar] [CrossRef] [Green Version]
- Mosammam, H.M.; Nia, J.T.; Khani, H.; Teymouri, A.; Kazemi, M. Monitoring land use change and measuring urban sprawl based on its spatial forms: The case of Qom city. Egypt. J. Remote Sens. Space Sci. 2017, 20, 103–116. [Google Scholar]
- Munthali, M.; Mustak, S.; Adeola, A.; Botai, J.; Singh, S.; Davis, N. Modelling land use and land cover dynamics of Dedza district of Malawi using hybrid Cellular Automata and Markov model. Remote. Sens. Appl. Soc. Environ. 2020, 17, 100276. [Google Scholar] [CrossRef]
- Rahman, M.T.U.; Tabassum, F.; Rasheduzzaman, M.; Saba, H.; Sarkar, L.; Ferdous, J.; Uddin, S.Z.; Islam, A.Z. Temporal dynamics of land use/land cover change and its prediction using CA-ANN model for southwestern coastal Bangladesh. Environ. Monit. Assess. 2017, 189, 565. [Google Scholar] [CrossRef]
- Hewett, C.J.; Wilkinson, M.E.; Jonczyk, J.; Quinn, P.F. Catchment systems engineering: An holistic approach to catchment management. Wiley Interdiscip. Rev. Water 2020, 7, e1417. [Google Scholar] [CrossRef]
- Kotaridis, I.; Lazaridou, M. Environmental Change Detection Study in the Wider Area of Lignite Mines. Civil Eng. Archit. 2018, 6, 108–114. [Google Scholar] [CrossRef]
- Maviza, A.; Ahmed, F. Analysis of past and future multi-temporal land use and land cover changes in the semi-arid Upper-Mzingwane sub-catchment in the Matabeleland south province of Zimbabwe. Int. J. Remote Sens. 2020, 41, 5206–5227. [Google Scholar] [CrossRef]
- Hyandye, C.; Martz, L.W. A Markovian and cellular automata land-use change predictive model of the Usangu Catchment. Int. J. Remote. Sens. 2017, 38, 64–81. [Google Scholar] [CrossRef]
- Memarian, H.; Balasundram, S.K.; Talib, J.B.; Sung, C.T.B.; Sood, A.M.; Abbaspour, K. Validation of CA-Markov for simulation of land use and cover change in the Langat Basin, Malaysia. Sci. Res. 2012, 4, 542–554. [Google Scholar] [CrossRef] [Green Version]
- Singh, S.K.; Mustak, S.; Srivastava, P.K.; Szabó, S.; Islam, T. Predicting spatial and decadal LULC changes through cellular automata Markov chain models using earth observation datasets and geo-information. Environ. Process. 2015, 2, 61–78. [Google Scholar] [CrossRef] [Green Version]
- Zhang, L.; Walker, G.R.; Dawes, W.R. Water balance modelling: Concepts and applications. In Regional Water and Soil Assessment for Managing Sustainable Agriculture in China and Australia; ACIAR Monograph Series; ACIAR: Canberra, Australia, 2002; Volume 84, pp. 31–47. [Google Scholar]
- Weng, Q. Land use change analysis in the Zhujiang Delta of China using satellite remote sensing, GIS and stochastic modelling. J. Environ. Manag. 2002, 64, 273–284. [Google Scholar] [CrossRef] [PubMed] [Green Version]
- Naboureh, A.; Moghaddam, M.H.R.; Feizizadeh, B.; Blaschke, T. An integrated object-based image analysis and CA-Markov model approach for modeling land use/land cover trends in the Sarab plain. Arab. J. Geosci. 2017, 10, 259. [Google Scholar] [CrossRef]
- Regmi, R.R.; Saha, S.K.; Subedi, D.S. Geospatial Analysis of Land Use Land Cover Change Modeling in Phewa Lake Watershed of Nepal by Using GEOMOD Model. Himal. Phys. 2017, 6, 65–72. [Google Scholar] [CrossRef] [Green Version]
- Matlhodi, B.; Kenabatho, P.K.; Parida, B.P.; Maphanyane, J.G. Evaluating Land Use and Land Cover Change in the Gaborone Dam Catchment, Botswana, from 1984–2015 Using GIS and Remote Sensing. Sustainability 2019, 11, 5174. [Google Scholar] [CrossRef] [Green Version]
- WUC. Annual Report 2015/16; Water Utilities Corporation: Gaborone, Botswana, 2016. [Google Scholar]
- Halmy, M.W.A.; Gessler, P.E.; Hicke, J.A.; Salem, B.B. Land use/land cover change detection and prediction in the north-western coastal desert of Egypt using Markov-CA. Appl. Geogr. 2015, 63, 101–112. [Google Scholar] [CrossRef]
- Verburg, P.H.; Kok, K.; Pontius, R.G.; Veldkamp, A. Modeling Land-Use and Land-Cover Change, in Land-Use and Land-Cover Change; Springer: Berlin/Heidelberg, Germany, 2006; pp. 117–135. [Google Scholar]
- Alemaw, B.; Keaitse, E.; Chaoka, T. Management of water supply reservoirs under uncertainties in arid and urbanized environments. J. Water Resour. Prot. 2016, 8, 990. [Google Scholar] [CrossRef] [Green Version]
- Altchenko, Y.; Lefore, N.; Villholth, K.G.; Ebrahim, G.; Genco, A.; Pierce, K.; Woolf, R.; Mosetlhi, B.B.; Moyo, T.; Kenabatho, P. Resilience in the Limpopo Basin: The Potential Role of the Transboundary Ramotswa Aquifer-Baseline Report; USAID: Pretoria, Southern Africa, 2016. [Google Scholar]
- Statistics-Botswana. Botswana Population Projections 2011–2026; Government Printers: Gaborone, Botswana, 2015. [Google Scholar]
- FAO. Africover Land cover Classification. In Environment and Natural Resources Service; Organisation, F.a.A., Ed.; Food and Agriculture Organisation: Rome, Italy, 1997. [Google Scholar]
- Eastman, J.R. IDRISI Andes Guide to GIS and Image Processing; Clark University: Worcester, MA, USA, 2006; p. 328. [Google Scholar]
- Mishra, M.; Mishra, K.; Subudhi, A.; Phil, M. Urban sprawl mapping and land use change analysis using remote sensing and GIS: Case study of bhubaneswar city, orissa. In Proceedings of the Geo-Spatial World Forum, Hyderabad, India, 18–21 January 2011. [Google Scholar]
- Tavangar, S.; Moradi, H.; Bavani, A.M.; Gholamalifard, M. A futuristic survey of the effects of LU/LC change on stream flow by CA–Markov model: A case of the Nekarood watershed, Iran. Geocarto Int. 2019, 1–17. [Google Scholar] [CrossRef]
- Wu, L.; Shi, P.; Gao, H. State Estimation and Sliding-Mode Control of Markovian Jump Singular Systems. IEEE Trans. Autom. Control. 2010, 55, 1213–1219. [Google Scholar] [CrossRef]
- Yang, X.; Zheng, X.-Q.; Lv, L.-N. A spatiotemporal model of land use change based on ant colony optimization, Markov chain and cellular automata. Ecol. Model. 2012, 233, 11–19. [Google Scholar] [CrossRef]
- Guan, D.; Li, H.; Inohae, T.; Su, W.; Nagaie, T.; Hokao, K. Modeling urban land use change by the integration of cellular automaton and Markov model. Ecol. Model. 2011, 222, 3761–3772. [Google Scholar] [CrossRef]
- Yang, X.; Zheng, X.-Q.; Chen, R. A land use change model: Integrating landscape pattern indexes and Markov-CA. Ecol. Model. 2014, 283, 1–7. [Google Scholar] [CrossRef]
- Al-Sharif, A.A.A.; Pradhan, B. Monitoring and predicting land use change in Tripoli Metropolitan City using an integrated Markov chain and cellular automata models in GIS. Arab. J. Geosci. 2014, 7, 4291–4301. [Google Scholar] [CrossRef]
- Keshtkar, H.; Voigt, W. A spatiotemporal analysis of landscape change using an integrated Markov chain and cellular automata models. Model. Earth Syst. Environ. 2016, 2, 1–13. [Google Scholar] [CrossRef] [Green Version]
- Liang, X.; Liu, X.; Li, D.; Zhao, H.; Chen, G. Urban growth simulation by incorporating planning policies into a CA-based future land-use simulation model. Int. J. Geogr. Inf. Sci. 2018, 32, 2294–2316. [Google Scholar] [CrossRef]
- Liu, Z.; Verburg, P.H.; Wu, J.; He, C. Understanding Land System Change Through Scenario-Based Simulations: A Case Study from the Drylands in Northern China. Environ. Manag. 2016, 59, 440–454. [Google Scholar] [CrossRef]
- Ma, C.; Zhang, G.; Zhang, X.; Zhao, Y.; Li, H. Application of Markov model in wetland change dynamics in Tianjin Coastal Area, China. Procedia Environ. Sci. 2012, 13, 252–262. [Google Scholar] [CrossRef] [Green Version]
- Wang, Y.; Yu, X.; He, K.; Li, Q.; Zhang, Y.; Song, S. Dynamic simulation of land use change in Jihe watershed based on CA-Markov model. Trans. Chin. Soc. Agric. Eng. 2011, 27, 330–336. [Google Scholar]
- Sang, L.; Zhang, C.; Yang, J.; Zhu, D.; Yun, W. Simulation of land use spatial pattern of towns and villages based on CA–Markov model. Math. Comput. Model. 2011, 54, 938–943. [Google Scholar] [CrossRef]
- Berberoğlu, S.; Akın, A.; Clarke, K.C. Cellular automata modeling approaches to forecast urban growth for adana, Turkey: A comparative approach. Landsc. Urban Plan. 2016, 153, 11–27. [Google Scholar] [CrossRef]
- Eastman, J.R. IDRISI Taiga Guide to GIS and Image Processing; Clark Labs Clark University: Worcester, MA, USA, 2009. [Google Scholar]
- Mishra, V.; Rai, P.; Mohan, K. Prediction of land use changes based on land change modeler (LCM) using remote sensing: A case study of Muzaffarpur (Bihar), India. J. Geogr. Inst. Jovan Cvijic SASA 2014, 64, 111–127. [Google Scholar] [CrossRef]
- Gashaw, T.; Tulu, T.; Argaw, M.; Worqlul, A.W. Evaluation and prediction of land use/land cover changes in the Andassa watershed, Blue Nile Basin, Ethiopia. Environ. Syst. Res. 2017, 6, 17. [Google Scholar] [CrossRef] [Green Version]
- Ruben, G.B.; Zhang, K.; Dong, Z.; Xia, J. Analysis and Projection of Land-Use/Land-Cover Dynamics through Scenario-Based Simulations Using the CA-Markov Model: A Case Study in Guanting Reservoir Basin, China. Sustainability 2020, 12, 3747. [Google Scholar] [CrossRef]
- Malczewski, J. GIS-based multicriteria decision analysis: A survey of the literature. Int. J. Geogr. Inf. Sci. 2006, 20, 703–726. [Google Scholar] [CrossRef]
- Li, Z.; Deng, X.; Yin, F.; Yang, C. Analysis of Climate and Land Use Changes Impacts on Land Degradation in the North China Plain. Adv. Meteorol. 2015, 2015, 1–11. [Google Scholar] [CrossRef]
- Gidey, E.; Dikinya, O.; Sebego, R.; Segosebe, E.; Zenebe, A. Cellular automata and Markov Chain (CA_Markov) model-based predictions of future land use and land cover scenarios (2015–2033) in Raya, northern Ethiopia. Modeling Earth Syst. Environ. 2017, 3, 1245–1262. [Google Scholar] [CrossRef]
- Singh, S.K.; Laari, P.B.; Mustak, S.; Srivastava, P.K.; Szabó, S. Modelling of land use land cover change using earth observation data-sets of Tons River Basin, Madhya Pradesh, India. Geocarto Int. 2018, 33, 1202–1222. [Google Scholar] [CrossRef]
- Subedi, P.; Subedi, K.; Thapa, B. Application of a Hybrid Cellular Automaton—Markov (CA-Markov) Model in Land-Use Change Prediction: A Case Study of Saddle Creek Drainage Basin, Florida. Appl. Ecol. Environ. Sci. 2013, 1, 126–132. [Google Scholar] [CrossRef] [Green Version]
- Omar, N.Q.; Ahamad, M.S.S.; Hussin, W.M.A.W.; Samat, N.; Ahmad, S.Z.B. Markov CA, Multi Regression, and Multiple Decision Making for Modeling Historical Changes in Kirkuk City, Iraq. J. Indian Soc. Remote. Sens. 2013, 42, 165–178. [Google Scholar] [CrossRef]
- Pontius, G.J.; Schneider, L.C. Land-cover change model validation by an ROC method for the Ipswich watershed, Massachusetts, USA. Agric. Ecosyst. Environ. 2001, 85, 239–248. [Google Scholar] [CrossRef]
- Mashapa, C.; Gandiwa, E.; Muboko, N.; Mhuriro-Mashapa, P. Land Use and Land Cover Changes in a Human-Wildlife Mediated Landscape of Save Valley Conservancy, South-Eastern Lowveld of Zimbabwe. J. Anim. Plant Sci. 2021, 31. [Google Scholar] [CrossRef]
- McGill, B.M.; Altchenko, Y.; Hamilton, S.K.; Kenabatho, P.K.; Sylvester, S.R.; Villholth, K.G. Complex interactions between climate change, sanitation, and groundwater quality: A case study from Ramotswa, Botswana. Hydrogeol. J. 2019, 27, 997–1015. [Google Scholar] [CrossRef] [Green Version]
- Pontius, R.; Millones, M. Death to Kappa: Birth of quantity disagreement and allocation disagreement for accuracy assessment. Int. J. Remote Sens. 2011, 32, 4407–4429. [Google Scholar] [CrossRef]
- Yang, C.; Wu, G.; Chen, J.; Li, Q.; Ding, K.; Wang, G.; Zhang, C. Simulating and forecasting spatio-temporal characteristic of land-use/cover change with numerical model and remote sensing: A case study in Fuxian Lake Basin, China. Eur. J. Remote. Sens. 2019, 52, 374–384. [Google Scholar] [CrossRef] [Green Version]
- Motlhwa, G.; James, M.Y.; Yunxian, Y. Effects of Integrated Support Programme for Arable Agricultural Development (ISPAAD) on the Income of Sorghum Farmers: Evidence from Kweneng District, Botswana. Asian J. Agric. Ext. Econ. Sociol. 2019, 1–10. [Google Scholar] [CrossRef]
- Seleka, T.B.; Mmopelwa, D. Effects of Input Subsidies on Subsistence Crop Acreage Diversity in Botswana. In BIDPA Working Paper; Botswana Institute for Development and Policy Analysis (BIDPA): Gaborone, Botswana, 2018. [Google Scholar]
- Chagumaira, C.; Rurinda, J.; Nezomba, H.; Mtambanengwe, F.; Mapfumo, P. Use patterns of natural resources supporting livelihoods of smallholder communities and implications for climate change adaptation in Zimbabwe. Environ. Dev. Sustain. 2015, 18, 237–255. [Google Scholar] [CrossRef]
- Gandhi, G.M.; Parthiban, S.; Thummalu, N.; Christy, A. Ndvi: Vegetation Change Detection Using Remote Sensing and Gis—A Case Study of Vellore District. Procedia Comput. Sci. 2015, 57, 1199–1210. [Google Scholar] [CrossRef] [Green Version]
- Monteiro, J.A.; Kamali, B.; Srinivasan, R.; Abbaspour, K.; Gücker, B. Modelling the effect of riparian vegetation restoration on sediment transport in a human-impacted Brazilian catchment. Ecohydrology 2016, 9, 1289–1303. [Google Scholar] [CrossRef]
- Yang, Y.; Tian, F. Abrupt change of runoff and its major driving factors in Haihe River Catchment, China. J. Hydrol. 2009, 374, 373–383. [Google Scholar] [CrossRef]
- James, R.; Washington, R. Changes in African temperature and precipitation associated with degrees of global warming. Clim. Chang. 2012, 117, 859–872. [Google Scholar] [CrossRef]
- Kenabatho, P.; Parida, B.; Moalafhi, D. The value of large-scale climate variables in climate change assessment: The case of Botswana’s rainfall. Phys. Chem. Earth Parts A/B/C 2012, 50, 64–71. [Google Scholar] [CrossRef]
- Moise, A.F.; Hudson, D.A. Probabilistic predictions of climate change for Australia and southern Africa using the reliability ensemble average of IPCC CMIP3 model simulations. J. Geophys. Res. Space Phys. 2008, 113, 15. [Google Scholar] [CrossRef] [Green Version]
- Hassaballah, K.; Mohamed, Y.; Uhlenbrook, S.; Biro, K. Analysis of streamflow response to land use and land cover changes using satellite data and hydrological modelling: Case study of Dinder and Rahad tributaries of the Blue Nile (Ethiopia–Sudan). Hydrol. Earth Syst. Sci. 2017, 21, 5217–5242. [Google Scholar] [CrossRef] [Green Version]
- Obahoundje, S.; Ofosu, E.A.; Akpoti, K.; Kabo-Bah, A.T. Land Use and Land Cover Changes under Climate Uncertainty: Modelling the Impacts on Hydropower Production in Western Africa. Hydrology 2017, 4, 2. [Google Scholar] [CrossRef] [Green Version]
- Yan, B.; Fang, N.; Zhang, P.; Shi, Z. Impacts of land use change on watershed streamflow and sediment yield: An assessment using hydrologic modelling and partial least squares regression. J. Hydrol. 2013, 484, 26–37. [Google Scholar] [CrossRef]
- Huang, J.; Wu, P.; Zhao, X. Effects of rainfall intensity, underlying surface and slope gradient on soil infiltration under simulated rainfall experiments. Catena 2013, 104, 93–102. [Google Scholar] [CrossRef]
- Neal, B.; Nathan, R.J.; Schreider, S.; Jakeman, A.J. Identifying the Separate Impact of Farm Dams and Land Use Changes on Catchment Yield. Australas. J. Water Resour. 2002, 5, 165–176. [Google Scholar] [CrossRef]
- Thompson, J.C. Impact and Management of Small Farm Dams in Hawke’s Bay, New Zealand, in School of Geography, Environment and Earth Sciences 2012; Victoria University of Wellington: Wellington, New Zealand, 2012. [Google Scholar]
- DWA. A Study on the Impact of Small Dam Construction on Downstream Water Resources; Department of Water Affairs: Gaborone, Botswana, 1992. [Google Scholar]
- DWA. A Study on the Impact of Small Dam Construction on Downstream Water Resources (Updated); Department of Water Affairs: Gaborone, Botswana, 2014. [Google Scholar]
- Meigh, J. The impact of small farm reservoirs on urban water supplies in Botswana. Nat. Resour. Forum 1995, 19, 71–83. [Google Scholar] [CrossRef]
- Ranganai, R.T.; Gotlop-Bogatsu, Y.; Maphanyane, J.; Tladi, B. Hydrochemical and Geophysical evaluation of groundwater pollution in the Ramotswa wellfield, SE Botswana. BIE2001 Tech. Pap. 2001, 193–200. [Google Scholar]
- Vogel, H.; Keipeile, K.; Kgomanyane, J.; Zwikula, T.; Pontsho, M.; Mafa, B.; Matthes, L.; Staudt, M.; Beger, K.; Güth, T. Groundwater Quality Case Studies in Botswana; Groundwater Pollution in Africa; Taylor & Francis: London, UK, 2006; pp. 253–264. [Google Scholar]
- Adelana, S.; Xu, Y. Contamination and Protection of the Cape Flats Aquifer, South Africa. In Groundwater Pollution in Africa; Xu, U., Ed.; Taylor and Francis/Balkema: Leiden, The Netherlands, 2006; Volume 13, p. 978. [Google Scholar]
- Luo, G.; Amuti, T.; Zhu, L.; Mambetov, B.T.; Maisupova, B.; Zhang, C. Dynamics of landscape patterns in an inland river delta of Central Asia based on a cellular automata-Markov model. Reg. Environ. Chang. 2015, 15, 277–289. [Google Scholar] [CrossRef]


| Year | Sensor | Spatial Resolution | Path/Row | No. of Bands | Date of Aquisition | Source |
|---|---|---|---|---|---|---|
| 1984, 1995 and 2005 | TM | 30m | p172 and r077/078 | 7 | 6 July 1984 5 July 1995 5 June 2005 | USGS |
| 2015 | OLI | 30m | p172 and r077/078 | 11 | 12 July 2015 | USGS |
| Factors | Membership Function Shape | Membership Function | Control Points |
|---|---|---|---|
| Distance to road (m) | Monotonically increasing | Linear | a = 0, b = 4000 |
| Distance to river (m) | Monotonically increasing | Sigmoidal | a = 0, b = 4000 |
| Distance to built-up areas (m) | Symmetric | Linear | a = 1, b = 20 c = 30, d = 1700 |
| Elevation (m) | Monotonically decreasing | Sigmoidal | c = 1000, d = 1400 |
| Slope (°) | Monotonically decreasing | Linear | c = 0, d = 15 |
| Kappa Index | Definitions of the Kappa Index Agreement |
|---|---|
| Kno | Indicates the proportion classified correctly relative to the expected proportion classified correctly by simulation, with no ability to specify the quantity of location accurately |
| Klocation | Measures the validation between the classified maps and the simulated map based on a specified location |
| Kstandard | The proportion assigned correctly versus the proportion that is correct by chance |
| Classified LULC 2015 (km2) | Simulated LULC 2015 (km2) | LULC Differences (km2) | LULC Differences (%) | |
|---|---|---|---|---|
| Cropland | 1007.77 | 805.55 | −202.21 | −20.066 |
| Bare land | 179.79 | 136.67 | −43.11 | −23.981 |
| Shrubland | 2600.35 | 2505.80 | −94.55 | −3.636 |
| Built-up | 227.15 | 193.66 | −33.49 | −14.742 |
| Tree savanna | 326.85 | 699.99 | 373.14 | 114.164 |
| Water body | 6.77 | 6.99 | 0.23 | 3.344 |
| Total | 4348.66 | 4348.66 |
| Transition Years | Cropland | Bare Land | Shrubland | Built-Up | Tree Savanna | Water Body | |
|---|---|---|---|---|---|---|---|
| Cropland | 1984–1995 | 0.668 | 0.0053 | 0.2944 | 0.0042 | 0.028 | 0.0001 |
| 1995–2005 | 0.6242 | 0.0097 | 0.3345 | 0.0141 | 0.0175 | 0 | |
| 2005–2015 | 0.7085 | 0.0403 | 0.1821 | 0.0644 | 0.0039 | 0.0007 | |
| Bare land | 1984–1995 | 0.1288 | 0.0597 | 0.7106 | 0.0282 | 0.0091 | 0.0637 |
| 1995–2005 | 0.1222 | 0.2309 | 0.5912 | 0.0424 | 0.0132 | 0.0001 | |
| 2005–2015 | 0.0988 | 0.2531 | 0.5414 | 0.0484 | 0.0534 | 0.0048 | |
| Shrubland | 1984–1995 | 0.1265 | 0.0128 | 0.6795 | 0.0155 | 0.1629 | 0.0027 |
| 1995–2005 | 0.1211 | 0.0406 | 0.6858 | 0.0354 | 0.1168 | 0.0003 | |
| 2005–2015 | 0.1976 | 0.0695 | 0.6355 | 0.0446 | 0.0523 | 0.0005 | |
| Built-up | 1984–1995 | 0.039 | 0.0086 | 0.237 | 0.7069 | 0.0069 | 0.0015 |
| 1995–2005 | 0.0695 | 0.0034 | 0.1718 | 0.7474 | 0.0079 | 0 | |
| 2005–2015 | 0.0877 | 0.0442 | 0.046 | 0.8149 | 0.0071 | 0.0001 | |
| Tree savanna | 1984–1995 | 0.0074 | 0.0005 | 0.3661 | 0.0011 | 0.623 | 0.0019 |
| 1995–2005 | 0.0082 | 0.0045 | 0.4839 | 0.0034 | 0.4997 | 0.0002 | |
| 2005–2015 | 0.0269 | 0.0073 | 0.703 | 0.008 | 0.2545 | 0.0002 | |
| Water body | 1984–1995 | 0.0032 | 0 | 0.1323 | 0 | 0.0683 | 0.7962 |
| 1995–2005 | 0.0089 | 0.0876 | 0.3678 | 0.0016 | 0.0302 | 0.5038 | |
| 2005–2015 | 0.0065 | 0.5933 | 0.037 | 0.0028 | 0.0067 | 0.3538 |
| 2015 | 2035 | LULC Changes between 2015–2035 | ||||
|---|---|---|---|---|---|---|
| LULC Type | Area (km2) | Area (%) | Area (km2) | Area (%) | Area (km2) | Area (%) |
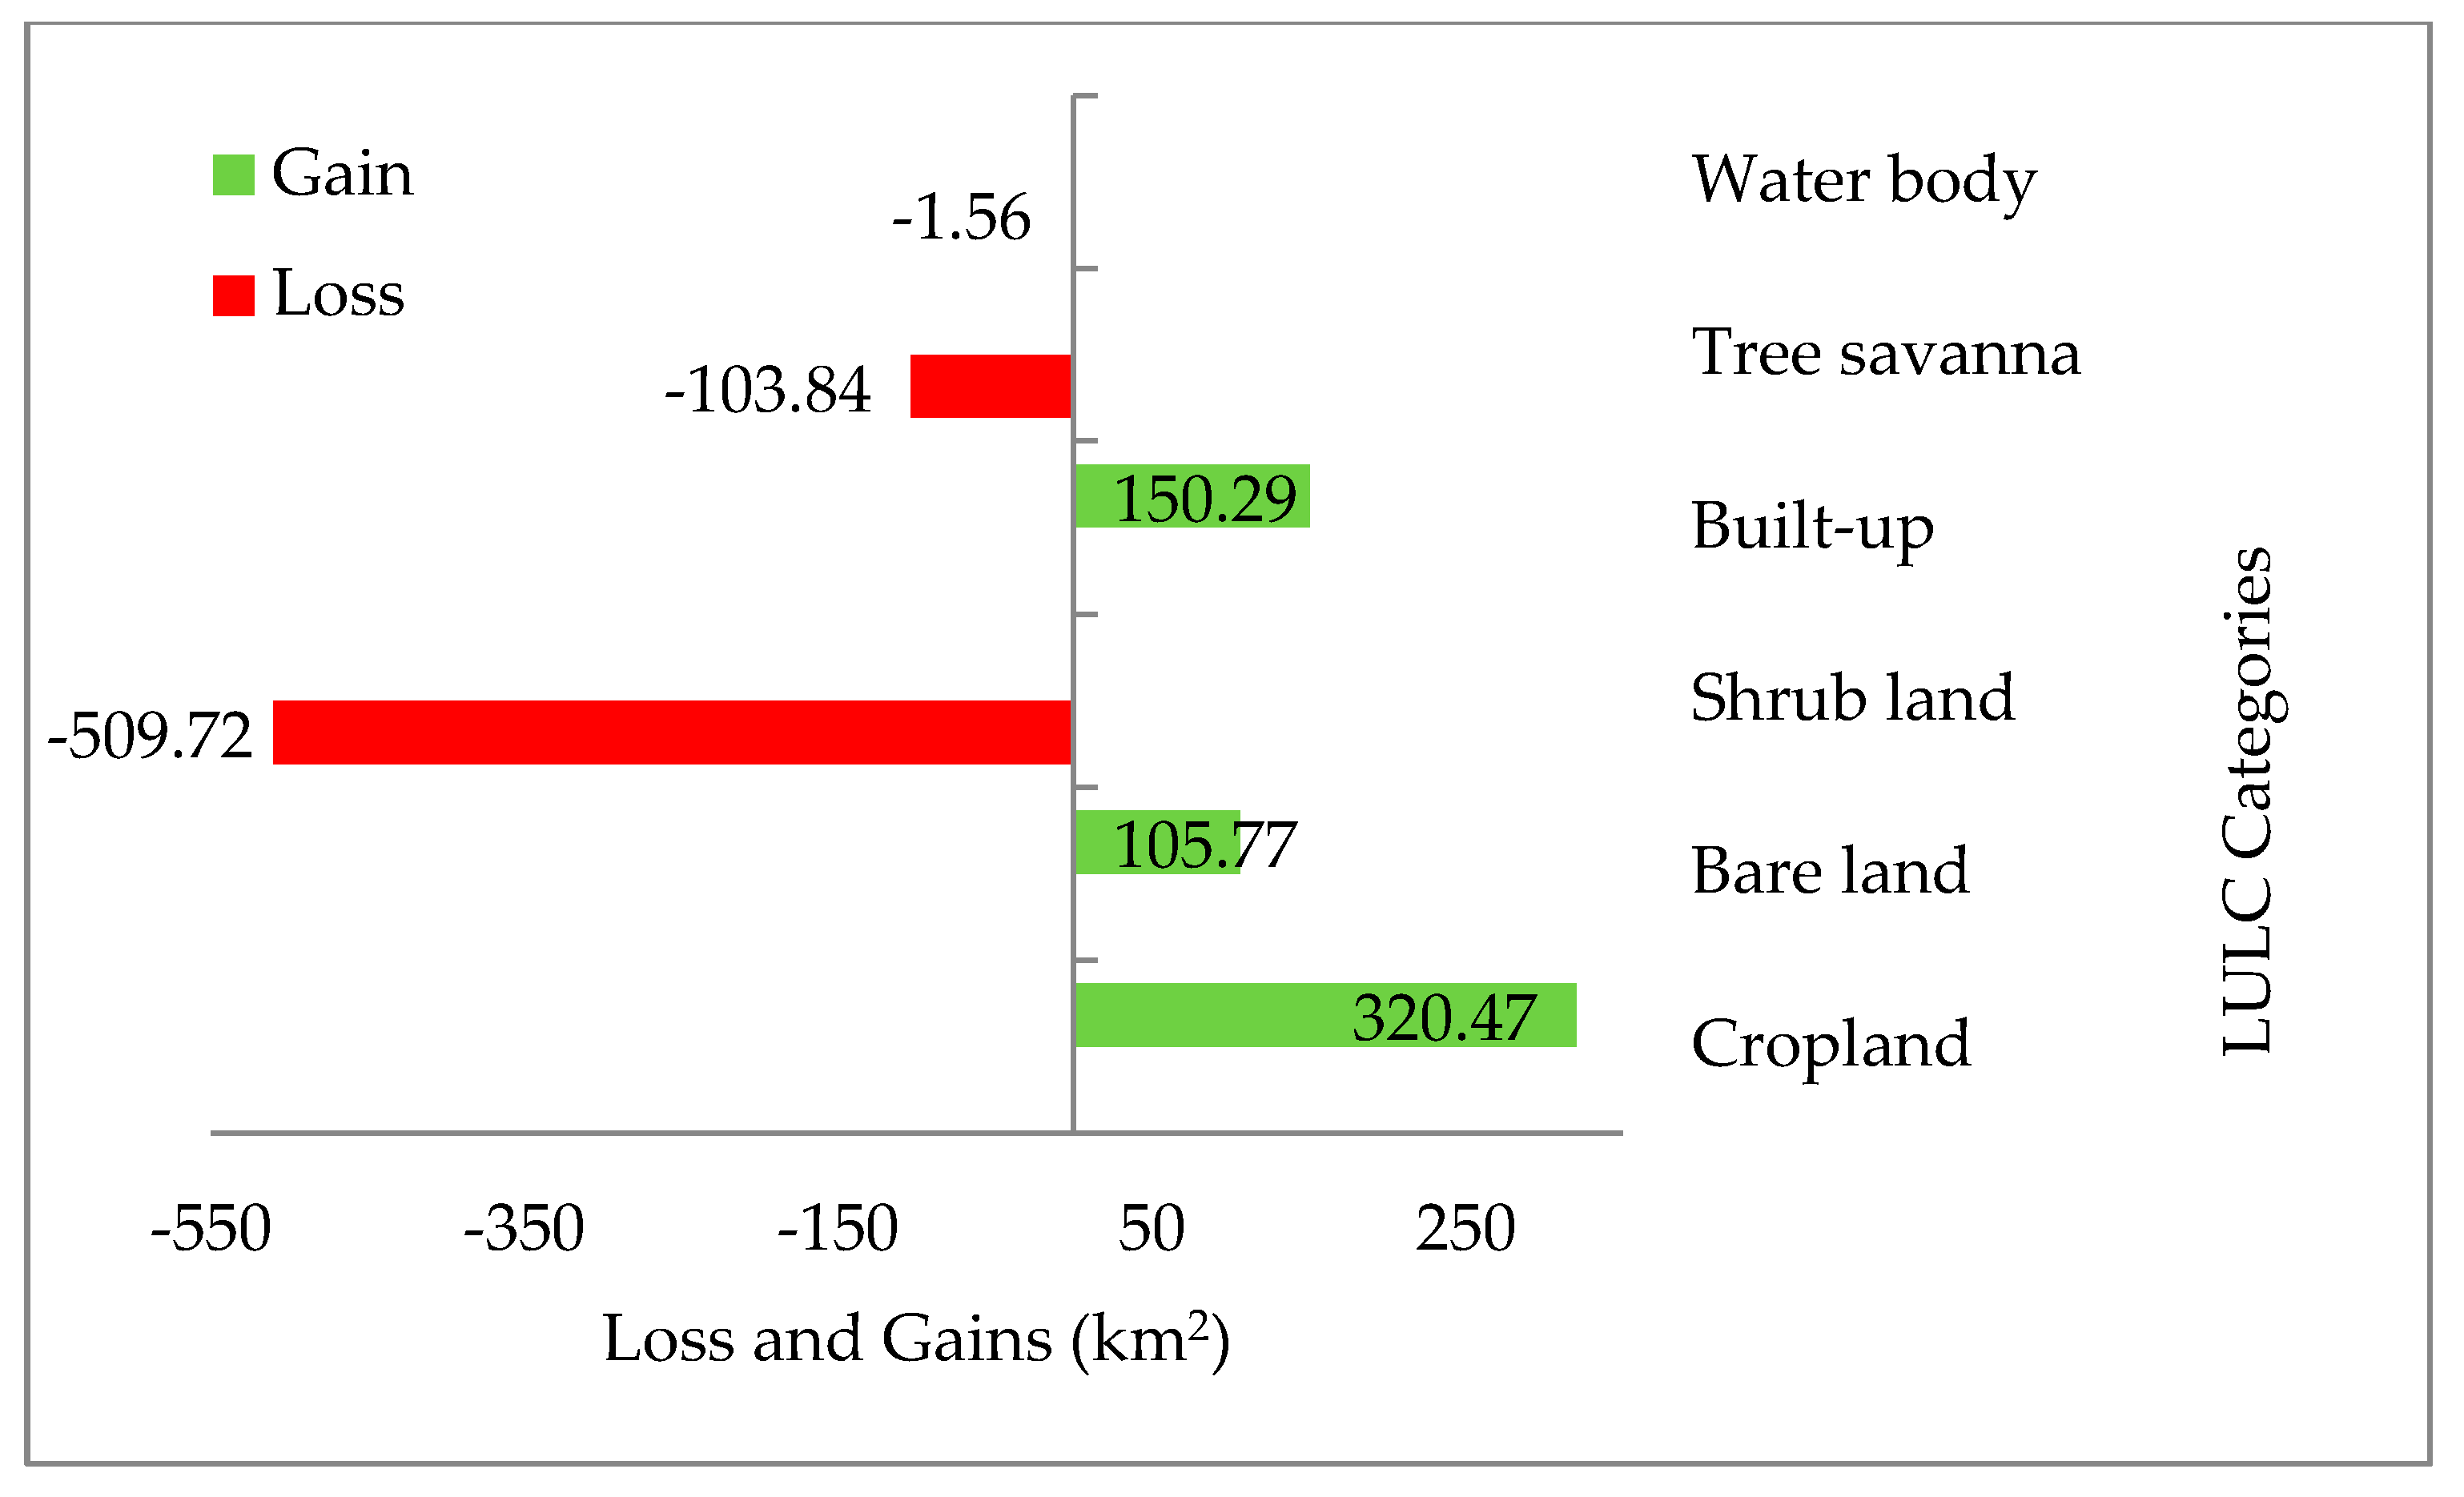
| Cropland | 1007.77 | 23.17 | 1270.67 | 29.22 | 262.91 | 26.09 |
| Bare land | 179.79 | 4.13 | 280.07 | 6.44 | 100.29 | 55.78 |
| Shrubland | 2600.35 | 59.80 | 2183.51 | 50.21 | −416.84 | −16.03 |
| Built-up | 227.15 | 5.22 | 376.29 | 8.65 | 149.13 | 65.65 |
| Tree savanna | 326.85 | 7.52 | 232.84 | 5.35 | −94.01 | −28.76 |
| Water body | 6.77 | 0.16 | 5.28 | 0.12 | −1.48 | −21.89 |
Publisher’s Note: MDPI stays neutral with regard to jurisdictional claims in published maps and institutional affiliations. |
© 2021 by the authors. Licensee MDPI, Basel, Switzerland. This article is an open access article distributed under the terms and conditions of the Creative Commons Attribution (CC BY) license (https://creativecommons.org/licenses/by/4.0/).
Share and Cite
Matlhodi, B.; Kenabatho, P.K.; Parida, B.P.; Maphanyane, J.G. Analysis of the Future Land Use Land Cover Changes in the Gaborone Dam Catchment Using CA-Markov Model: Implications on Water Resources. Remote Sens. 2021, 13, 2427. https://doi.org/10.3390/rs13132427
Matlhodi B, Kenabatho PK, Parida BP, Maphanyane JG. Analysis of the Future Land Use Land Cover Changes in the Gaborone Dam Catchment Using CA-Markov Model: Implications on Water Resources. Remote Sensing. 2021; 13(13):2427. https://doi.org/10.3390/rs13132427
Chicago/Turabian StyleMatlhodi, Botlhe, Piet K. Kenabatho, Bhagabat P. Parida, and Joyce G. Maphanyane. 2021. "Analysis of the Future Land Use Land Cover Changes in the Gaborone Dam Catchment Using CA-Markov Model: Implications on Water Resources" Remote Sensing 13, no. 13: 2427. https://doi.org/10.3390/rs13132427