
Wheat Fusarium Head Blight Detection Using UAV-Based Spectral and Texture Features in Optimal Window Size


1
Key Laboratory of Digital Earth Science, Aerospace Information Research Institute, Chinese Academy of Sciences, Beijing 100094, China
2
College of Resources and Environment, University of Chinese Academy of Sciences, Beijing 100190, China
3
State Key Laboratory of Remote Sensing Science, Aerospace Information Research Institute, Chinese Academy of Sciences, Beijing 100094, China
*
Author to whom correspondence should be addressed.
Remote Sens. 2021, 13(13), 2437; https://doi.org/10.3390/rs13132437
Submission received: 9 May 2021
/
Revised: 16 June 2021
/
Accepted: 17 June 2021
/
Published: 22 June 2021
Abstract
:By combining the spectral and texture features of images captured by unmanned aerial vehicles (UAVs), the accurate and timely detection of wheat Fusarium head blight (FHB) can be realized. This study presents a methodology to select the optimal window size of the gray-level co-occurrence matrix (GLCM) to extract texture features from UAV images for FHB detection. Host conditions and the disease distribution were combined to construct the model, and its overall accuracy, sensitivity, and generalization ability were evaluated. First, the sensitive spectral features and bands of the UAV-derived hyperspectral images were obtained, and then texture features were selected. Subsequently, spectral features and texture features extracted from windows of different sizes were input to classify the area of severe FHB. According to the model comparison, the optimal window size was obtained. With the collinearity between features eliminated, the best performance of the logistic model reached, with an accuracy, F1 score, and area under the receiver operating characteristic curve of 0.90, 0.79, and 0.79, respectively, when the window size of the GLCM was 5 × 5 pixels on May 3, and of 0.90, 0.83, and 0.82, respectively, when the size was 17 × 17 pixels on May 8. The results showed that the selection of an appropriate GLCM window size for texture feature extraction enabled more accurate disease detection.
1. Introduction
Fusarium head blight (FHB) of wheat (Triticumaestivum L.), caused mainly by the fungus Gibberella zeae (Schwein) Petch. has received increasing attention in wheat production. In recent years, the whole world witnessed the wide-spread breakout of FHB in both scope and severity [1]. FHB can be a devastating disease for all classes of wheat [2], and the mycotoxins produced during pathogenesis, particularly the trichothecenes deoxynivalenol (DON) and nivalenol (NIV), may be found unsafe for human or animal consumption [3]. Moreover, the infection of wheat FHB is rather rapid and irreversible. Therefore, the timely and precise detection of FHB is extremely important for providing management advice for wheat producers and valuable time for food operators and processors. According to the effect of this highly specific disease on crop physiology, the potential of using spectral technology to accurately detect FHB has been discovered. Zhang et al. evaluated the sensitivity of single bands and simple spectral vegetation indices to FHB, from hyperspectral images of wheat spikelets by partial least-squares regression and then proposed a specific FHB classification index (FCI) with an overall accuracy of 89.8% [4]. Ma et al. applied a continuous wavelet analysis to hyperspectral images of wheat for FHB identification, selected six wavelet features to train the Fisher linear model, and obtained an overall accuracy of 88.7% [5,6,7,8]. However, when utilizing high-resolution images for disease detection, especially images captured by unmanned aerial vehicles (UAVs) [9,10,11], the traditional method based on reflectance differences consider only host-condition changes and ignore the inherent spatial information contained in remote sensing images [12]. Texture, an effective feature used to describe the spatial distribution of brightness in adjacent pixels and thus the reflect spatial patterns of field-scale diseases, has been increasingly adopted for disease detection applications. Especially for diseases that occur in the upper parts of crops, filed-scale spatial patterns have become a crucial factor.
Currently, by comprehensively considering the diseases’ influences on host growth and their spatial patterns, researchers have combined spectral and texture features for timely and accurate disease detection [13,14,15,16]. For instance, based on the gray-level co-occurrence matrix (GLCM), Huang et al. utilized 12 characteristic wavelength variables (at 442, 491, 552, 675, 685, 693, 698, 706, 757, 767, 924, and 935 nm) to calculate the texture features of FHB and found that the correlation index of the GLCM was highly correlated with FHB [17]. Xie et al. extracted texture features from the 408, 535, 624, and 704 nm effective bands of hyperspectral images and compared the performances of K-nearest neighbor (KNN) and AdaBoost classification models to investigate both sensitive spectrum and texture features for detecting early blight disease on eggplant leaves. The classification rates of all models were over 88.46% [18]. Moreover, researchers have shown that the combination of spectral and texture features can significantly improve the disease identification accuracy, increasing the accuracy by 6.3% to 7.3% compared to that obtained when using only one kind of feature [19]. The authors discussed that such a method provided a basis for plant disease detection at the field scale from UAV-based hyperspectral images [10,17,19].
To extract texture features, the GLCM, a classic and universal method, can provide information on the direction, interval, and amplitude of gray change in a certain region of an image. The setting of the gray level of the image and the size, sliding step size, and moving direction of the window all affect the extraction results and hence change the disease information explained by the texture features [20,21,22]. For field-scale FHB, in the early stage, FHB-infected spikes occur mainly at random throughout a field [23], while as the average incidence increases, the spatial patterns of FHB become more aggregated [24]. Therefore, we further focused on the window size, a crucial parameter used to determine the scale of the target region from which the gray change is reflected, to illustrate the different patterns of FHB. The boundary of a homogeneous region corresponds to the gray change of textures, hence, analyzing the texture features in the appropriate window size can correctly identify the boundary [25,26,27,28,29]. When the window is small, although the disease information can be preserved, false recognition in the same texture may occur; when the window is too large, the accuracy of the required information may be weakened [30]. Therefore, we planned to find the optimal window size to calculate texture feature to detect field-FHB in different stages more accurately.
The effect of texture features in different window sizes on the accuracy of field-scale FHB detection in the early and late FHB stages was considered in our study. Combining spectral features and texture features in the optimal window size, we conducted FHB detection with hyperspectral data and other auxiliary data. First, sensitive narrow-band spectral features were selected to reflect the host conditions and disease stress of the plant. Then, the band images that contained more disease information were extracted. Subsequently, sensitive texture features were selected to illustrate the distribution patterns of the disease. Moreover, we calculated these texture features in different window sizes and then utilized each size group and the selected spectral features as inputs, to calculate the accuracy of the logistic model and compare the differences. Finally, we found the optimal window size to realize the detection of field-scale FHB in different stages and analyzed the performance of the logistic model for FHB detection. The optimal window size for the extraction of texture features was selected through its influence on the detection accuracy. The methods described herein can improve the detection accuracy of FHB, additionally, this analysis can serve as the basis for selecting spectral images with the appropriate resolution to reduce the storage space and processing time of the data.
2. Materials and Methods
2.1. Study Area and Field Investigation
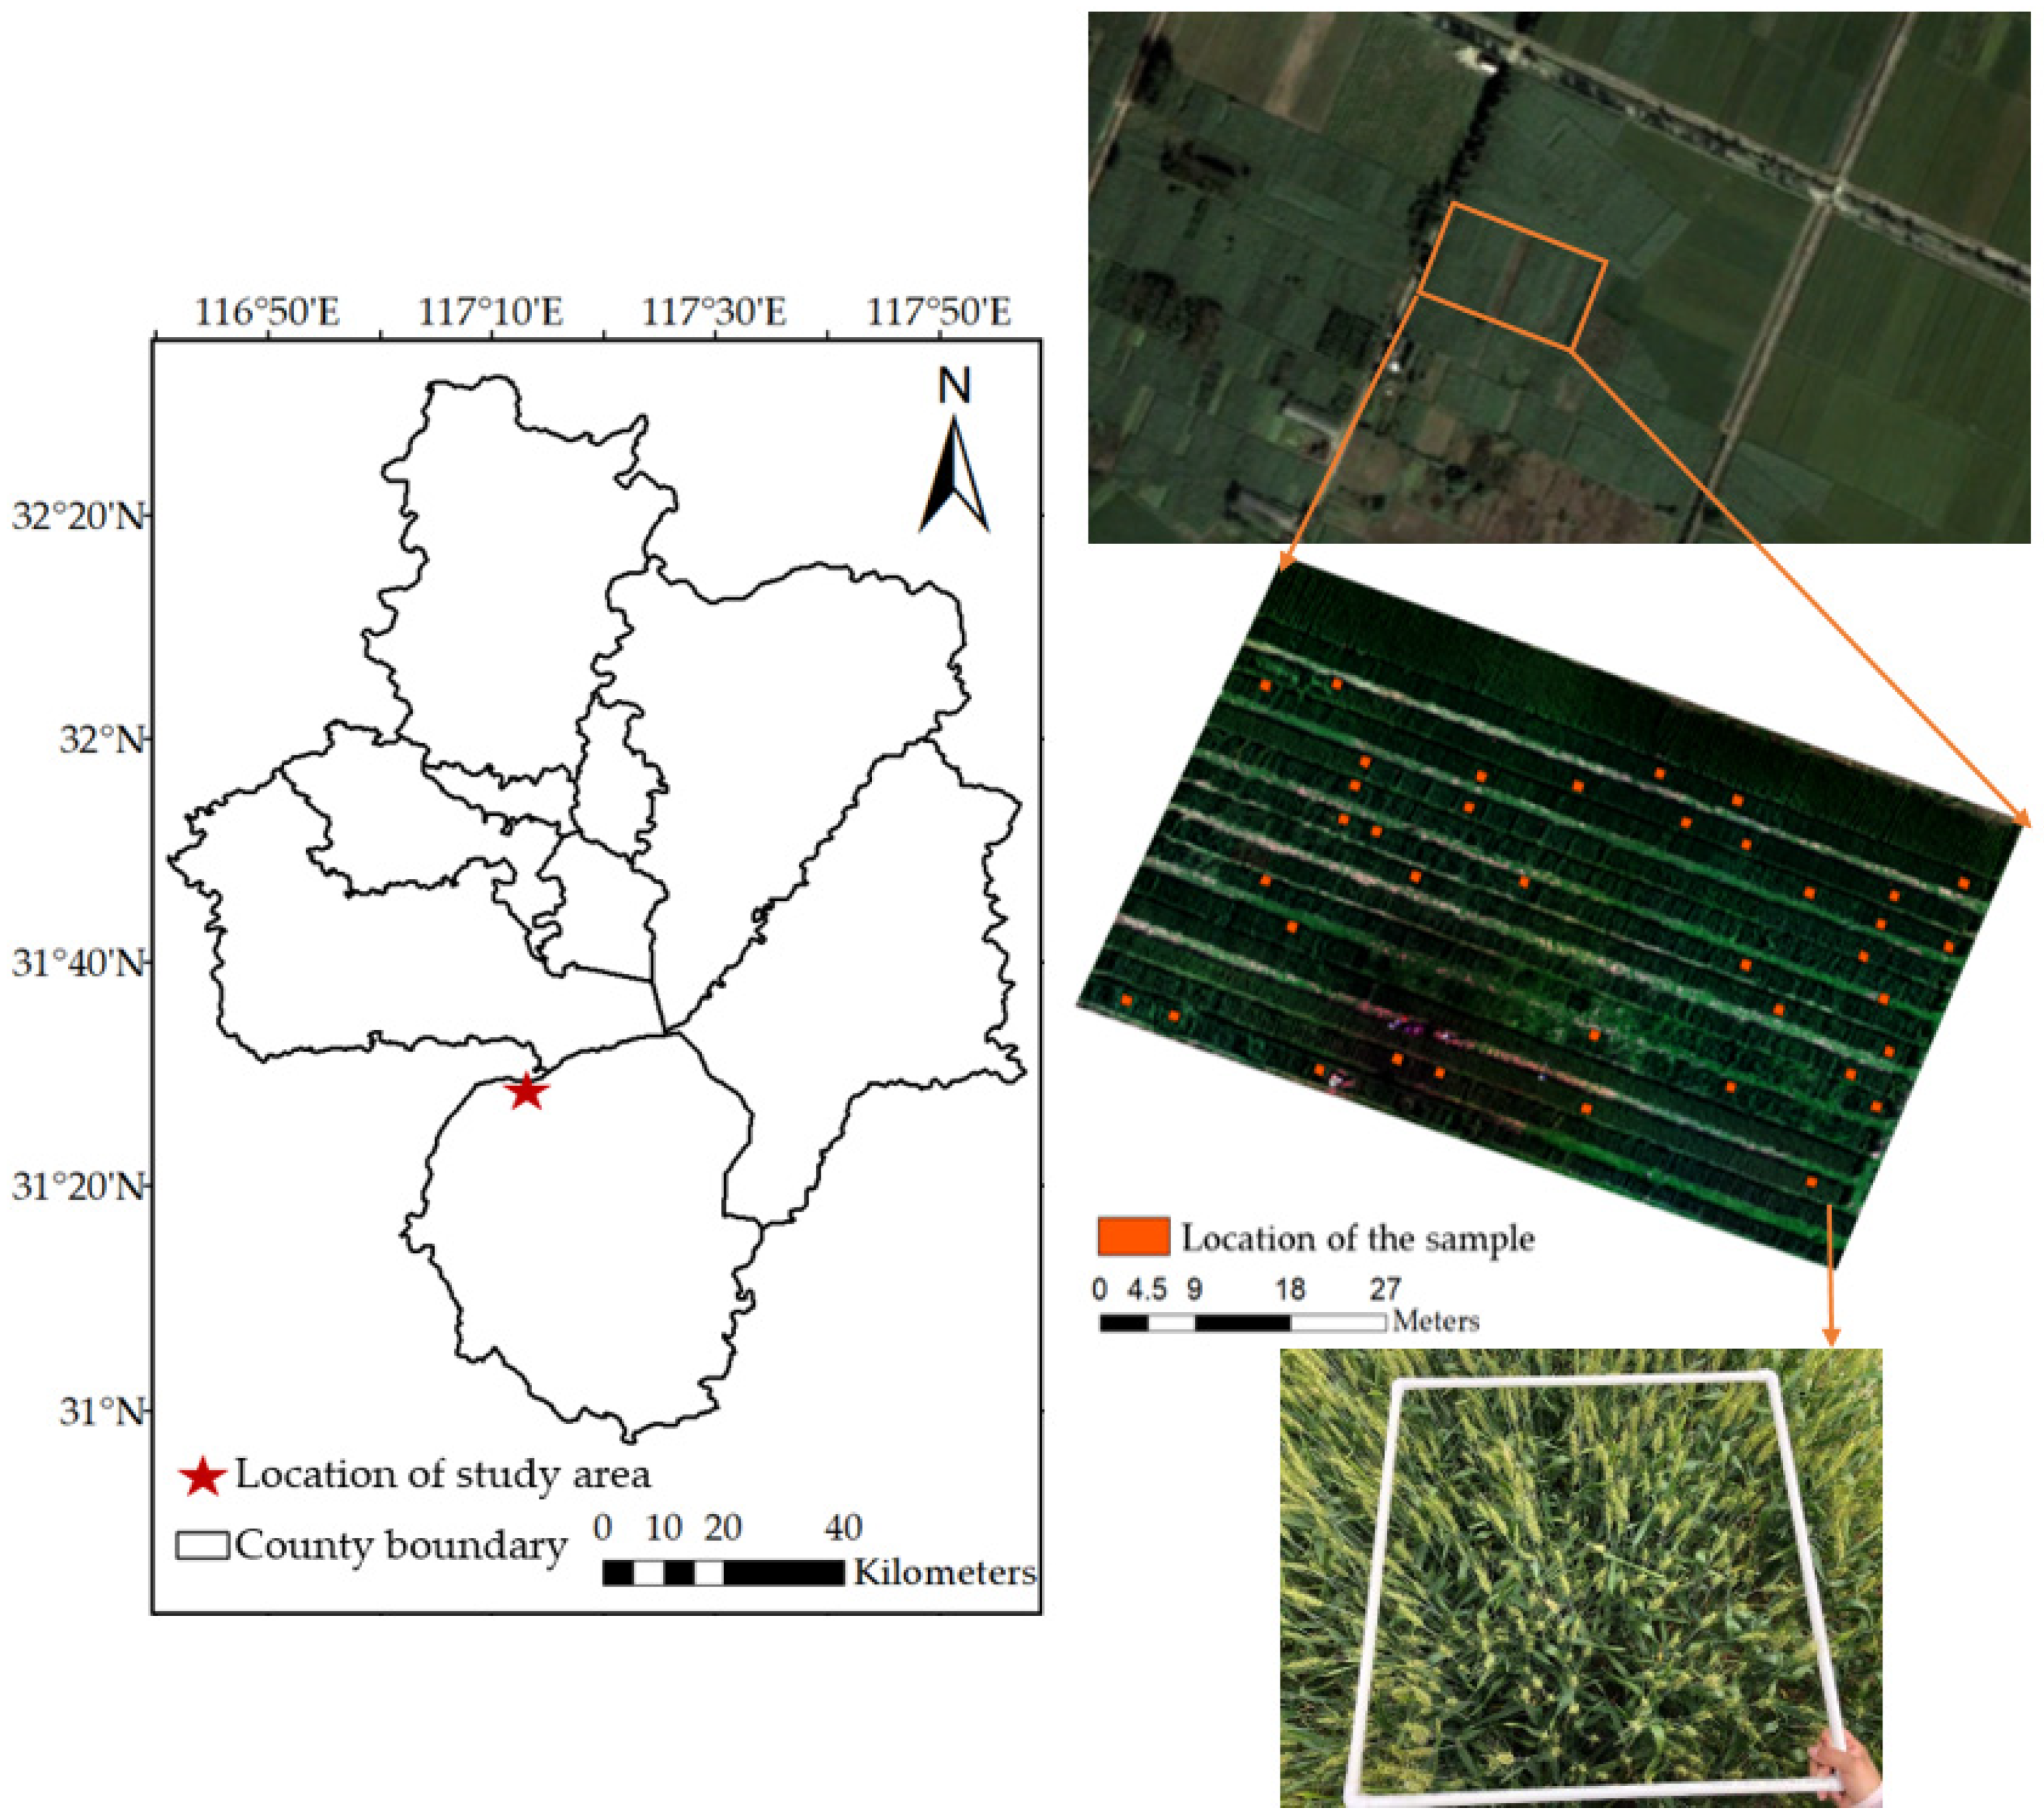
Our study area is located in Lujiang County, Anhui Province, China (117°13′12″E, 31°29′0″N). This region has a typical subtropical humid monsoon climate, with rainfall mainly occurring in spring and summer. The average temperature is 15.8 °C, and the annual average rainfall is approximately 1188 mm. Wheat is the main crop in this area, and the main variety is Yangmai 25, which is susceptible to FHB. The high wheat planting density, rich source of Gibberella, and suitable climate and soil conditions of the study area contribute to the widespread and rapid development of FHB [31], causing FHB to be a major wheat disease in this region. The location of the area is shown in Figure 1.
We obtained hyperspectral UAV images of the study area and conducted a field investigation. Experiments were carried out on 3 and 8 May 2019. The image acquisition period was from 11 a.m. to 1 p.m. when the sky was clear and cloudless, to ensure the consistent environmental conditions, especially illumination condition such that the real reflection characteristics of the target could be obtained. The planted wheat was at the grain filling stage on both days of study, this stage is the key period for FHB infection. The area of the research field was 0.5 ha, and the variety and crop management systems in this area were uniform under the guidance of the local government. In the studied region, FHB occurs seriously with no pesticides. The disease was in the early infection stage on May 3 and was spreading without effective management. The survey included 40 plots locations and the disease conditions at each plot; the area of each plot was 1 m2. First, a rectangular frame surrounded by UPVC tubes was used to delimit the sample range of 1 m × 1 m (Figure 1). To ensure the uniformity of wheat in the plot, each plot was located in the center of the field. Because the wheat was in the same stage throughout the field and the planting density was large, there were no obvious bare surfaces in the plot. Subsequently, 50 individual plants were randomly selected in each plot, and the number of plants with diseased spikelets was recorded. The disease rate was calculated by dividing the number of diseased spikelets by the number of all spikelets. According to the Chinese national standard 15796-2011 (rules for detection and forecast of the wheat Fusarium head blight), the plots with the disease rates lager than 75% were regarded as severely diseased samples, and the others were slightly diseased ones. The UAV used in our study was an M600 Pro aircraft of Daijang Innovations (DJI), and the hyperspectral imaging camera was a Cubert S185 FireflEYE SE with a spectral range of 450–950 nm and a spectral resolution of 4 nm, in which the bands that are sensitive to plant greenness, biomass, pigment content, and photochemical reaction ability are almost completely included [32]. Before capturing hyperspectral images, a reference panel was positioned approximately one meter above the ground to measure the incoming irradiance. Then, the absolute reflectance was obtained as a function of wavelength by multiplying the reflectance measurement obtained relative to the reference panel by the reflectance of the panel itself. In each capture, a high-spatial-resolution panchromatic image and a low-spatial-resolution hyperspectral cube image were obtained, and then fusion and stitching operations were carried out. As a result, the spatial resolution of the images was 4 cm. To enhance the comparability of the data between the two sampled days, eliminate the influence of the atmosphere and make the difference between the two groups of data mainly result from the development of disease, we calculated the relative reflectance of each image by dividing the image reflectance by the average reflectance of the same road in the image.
2.2. Optimal Window Selection of Texture Features for Wheat FHB Detection
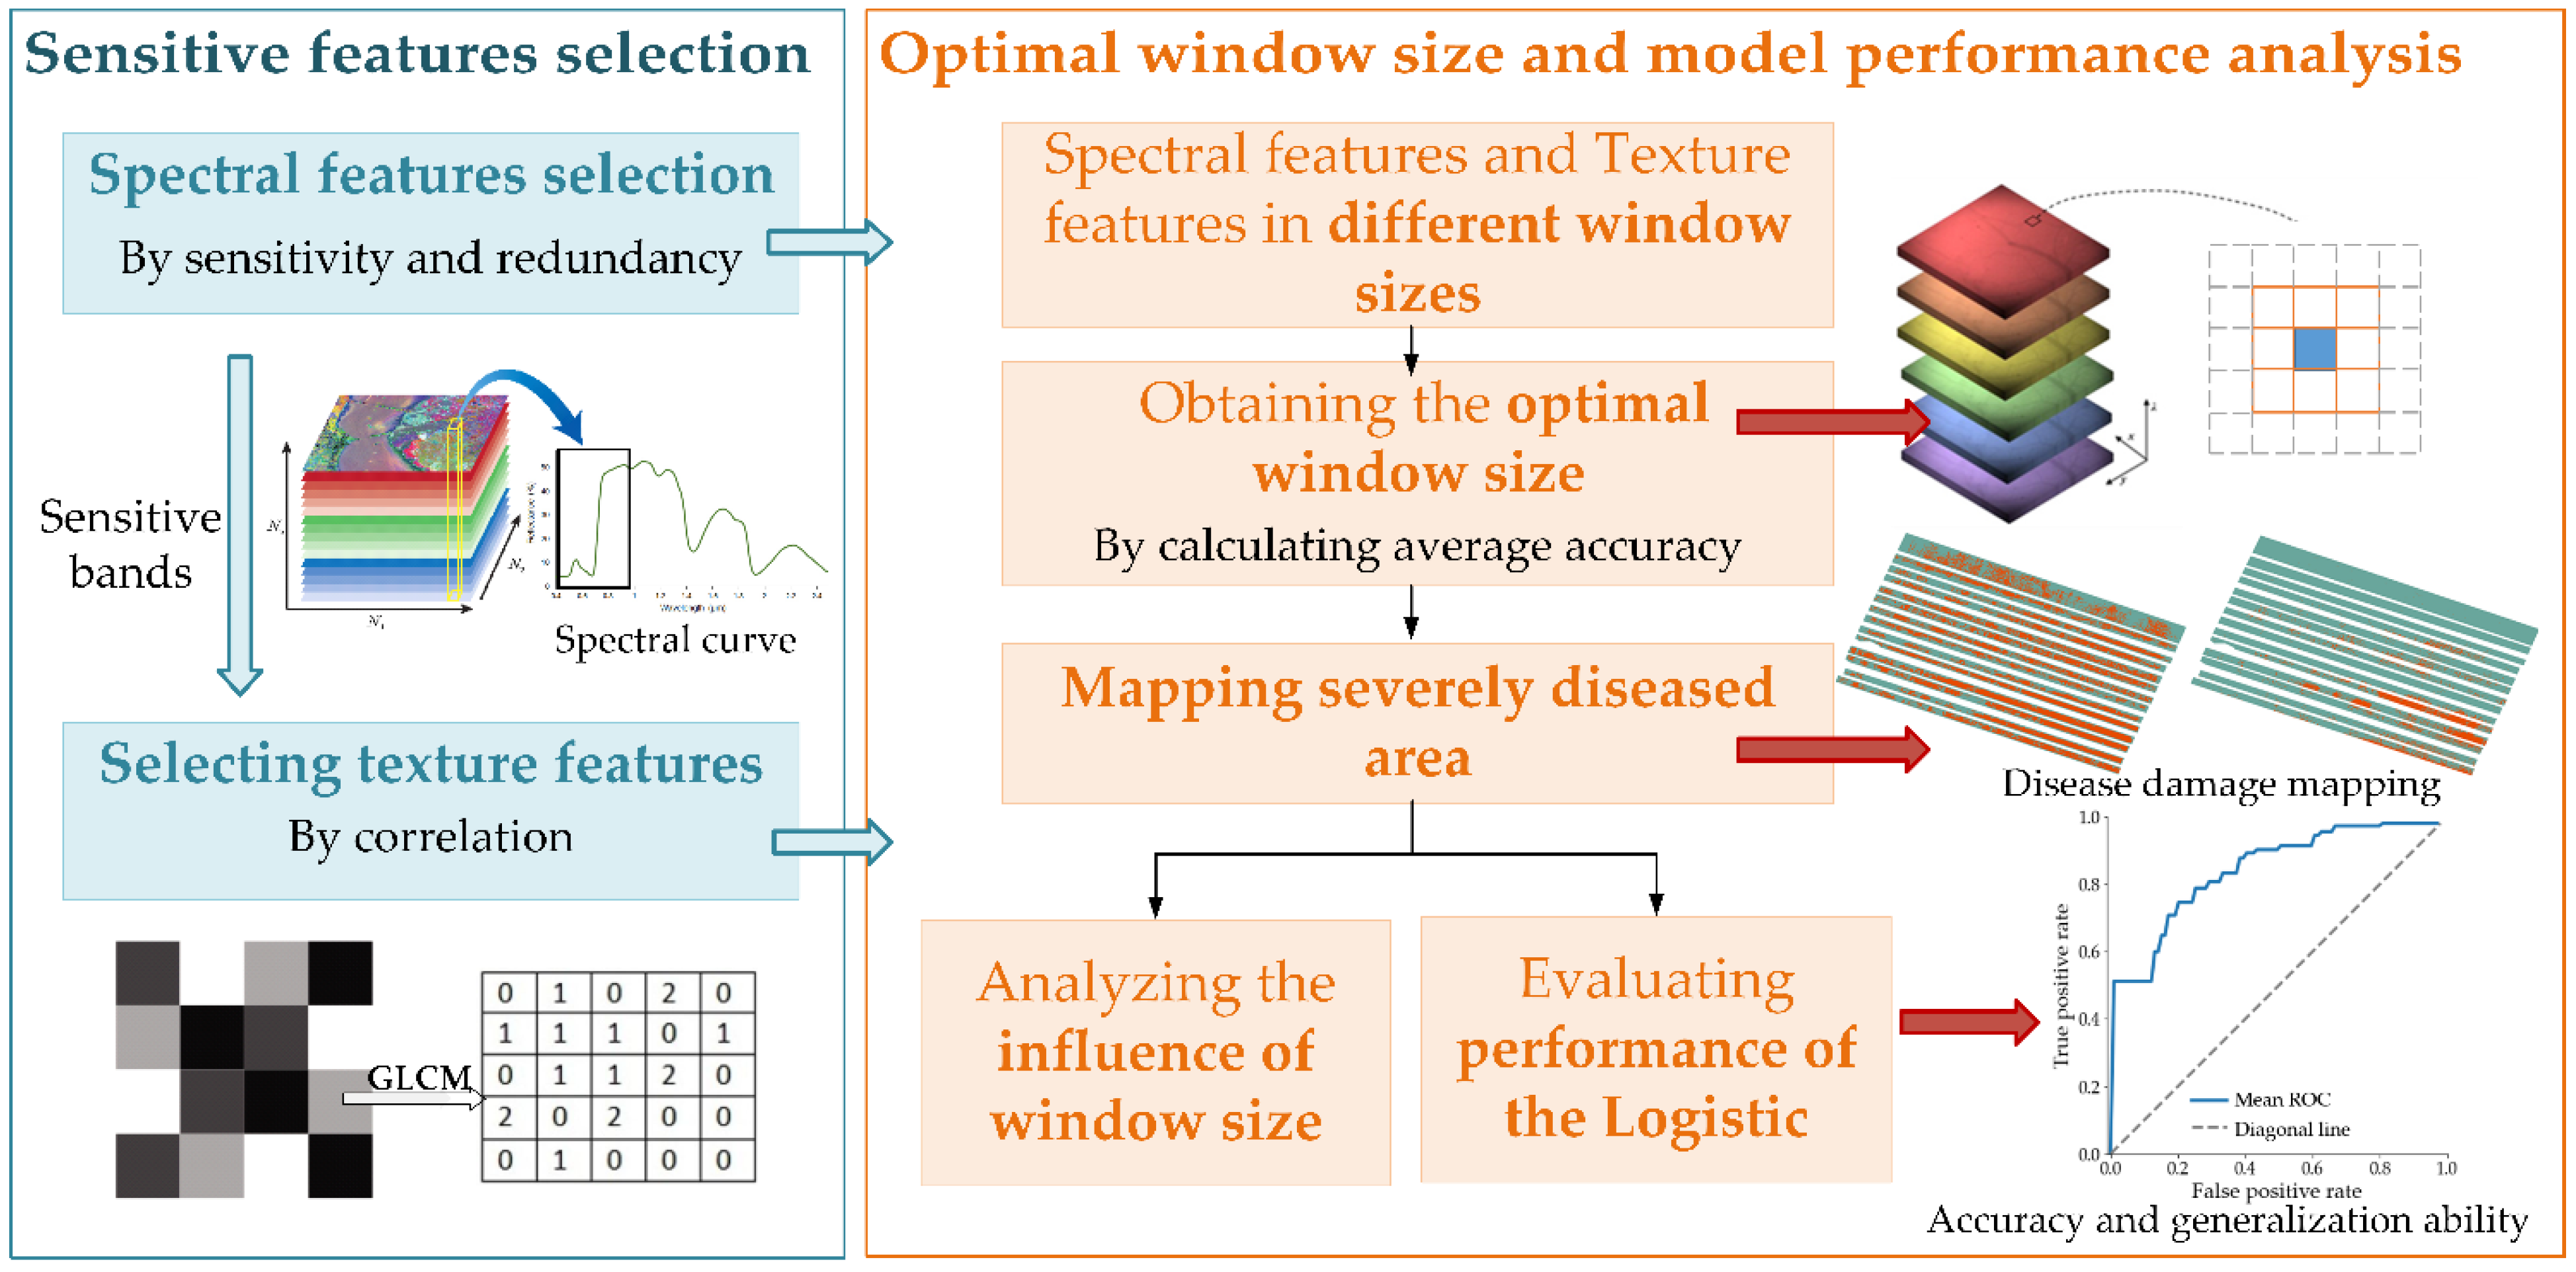
We aimed to combine texture features in the optimal window size and sensitive spectral features to realize the detection of wheat FHB in different time periods. The main steps are shown in Figure 2. In the beginning, according to the influence of FHB on wheat and the spectral response characteristics of wheat to FHB [33,34,35,36], the spectral features and bands that were sensitive to wheat FHB were selected through both correlation and redundancy evaluation, and texture features were extracted from the selected band images. Subsequently, texture features in different window sizes combined with the selected spectral features were used to detect the early-stage and late-stage wheat FHB in the studied field. According to the results, the influence of the window size of texture features on the detection accuracy and results was estimated, and therefore, the optimal window sizes in different periods were obtained.
2.2.1. Spectral and Texture Feature Extraction and Selection
The spectral features of images can illustrate the growth conditions of the host, while the texture features of images can reflect the spatial distribution of the disease. First, we calculated several popular and authoritative spectral indices and judged their correlations and sensitivities to the disease rate; thereby, the spectral features were selected. Accordingly, we screened out single-band images that were sensitive to wheat FHB; that is, we selected the bands that contained the most disease information. Finally, from these gray images, the texture indices under different window sizes were extracted. The sensitive texture features were obtained by analyzing the correlation of each index to FHB.
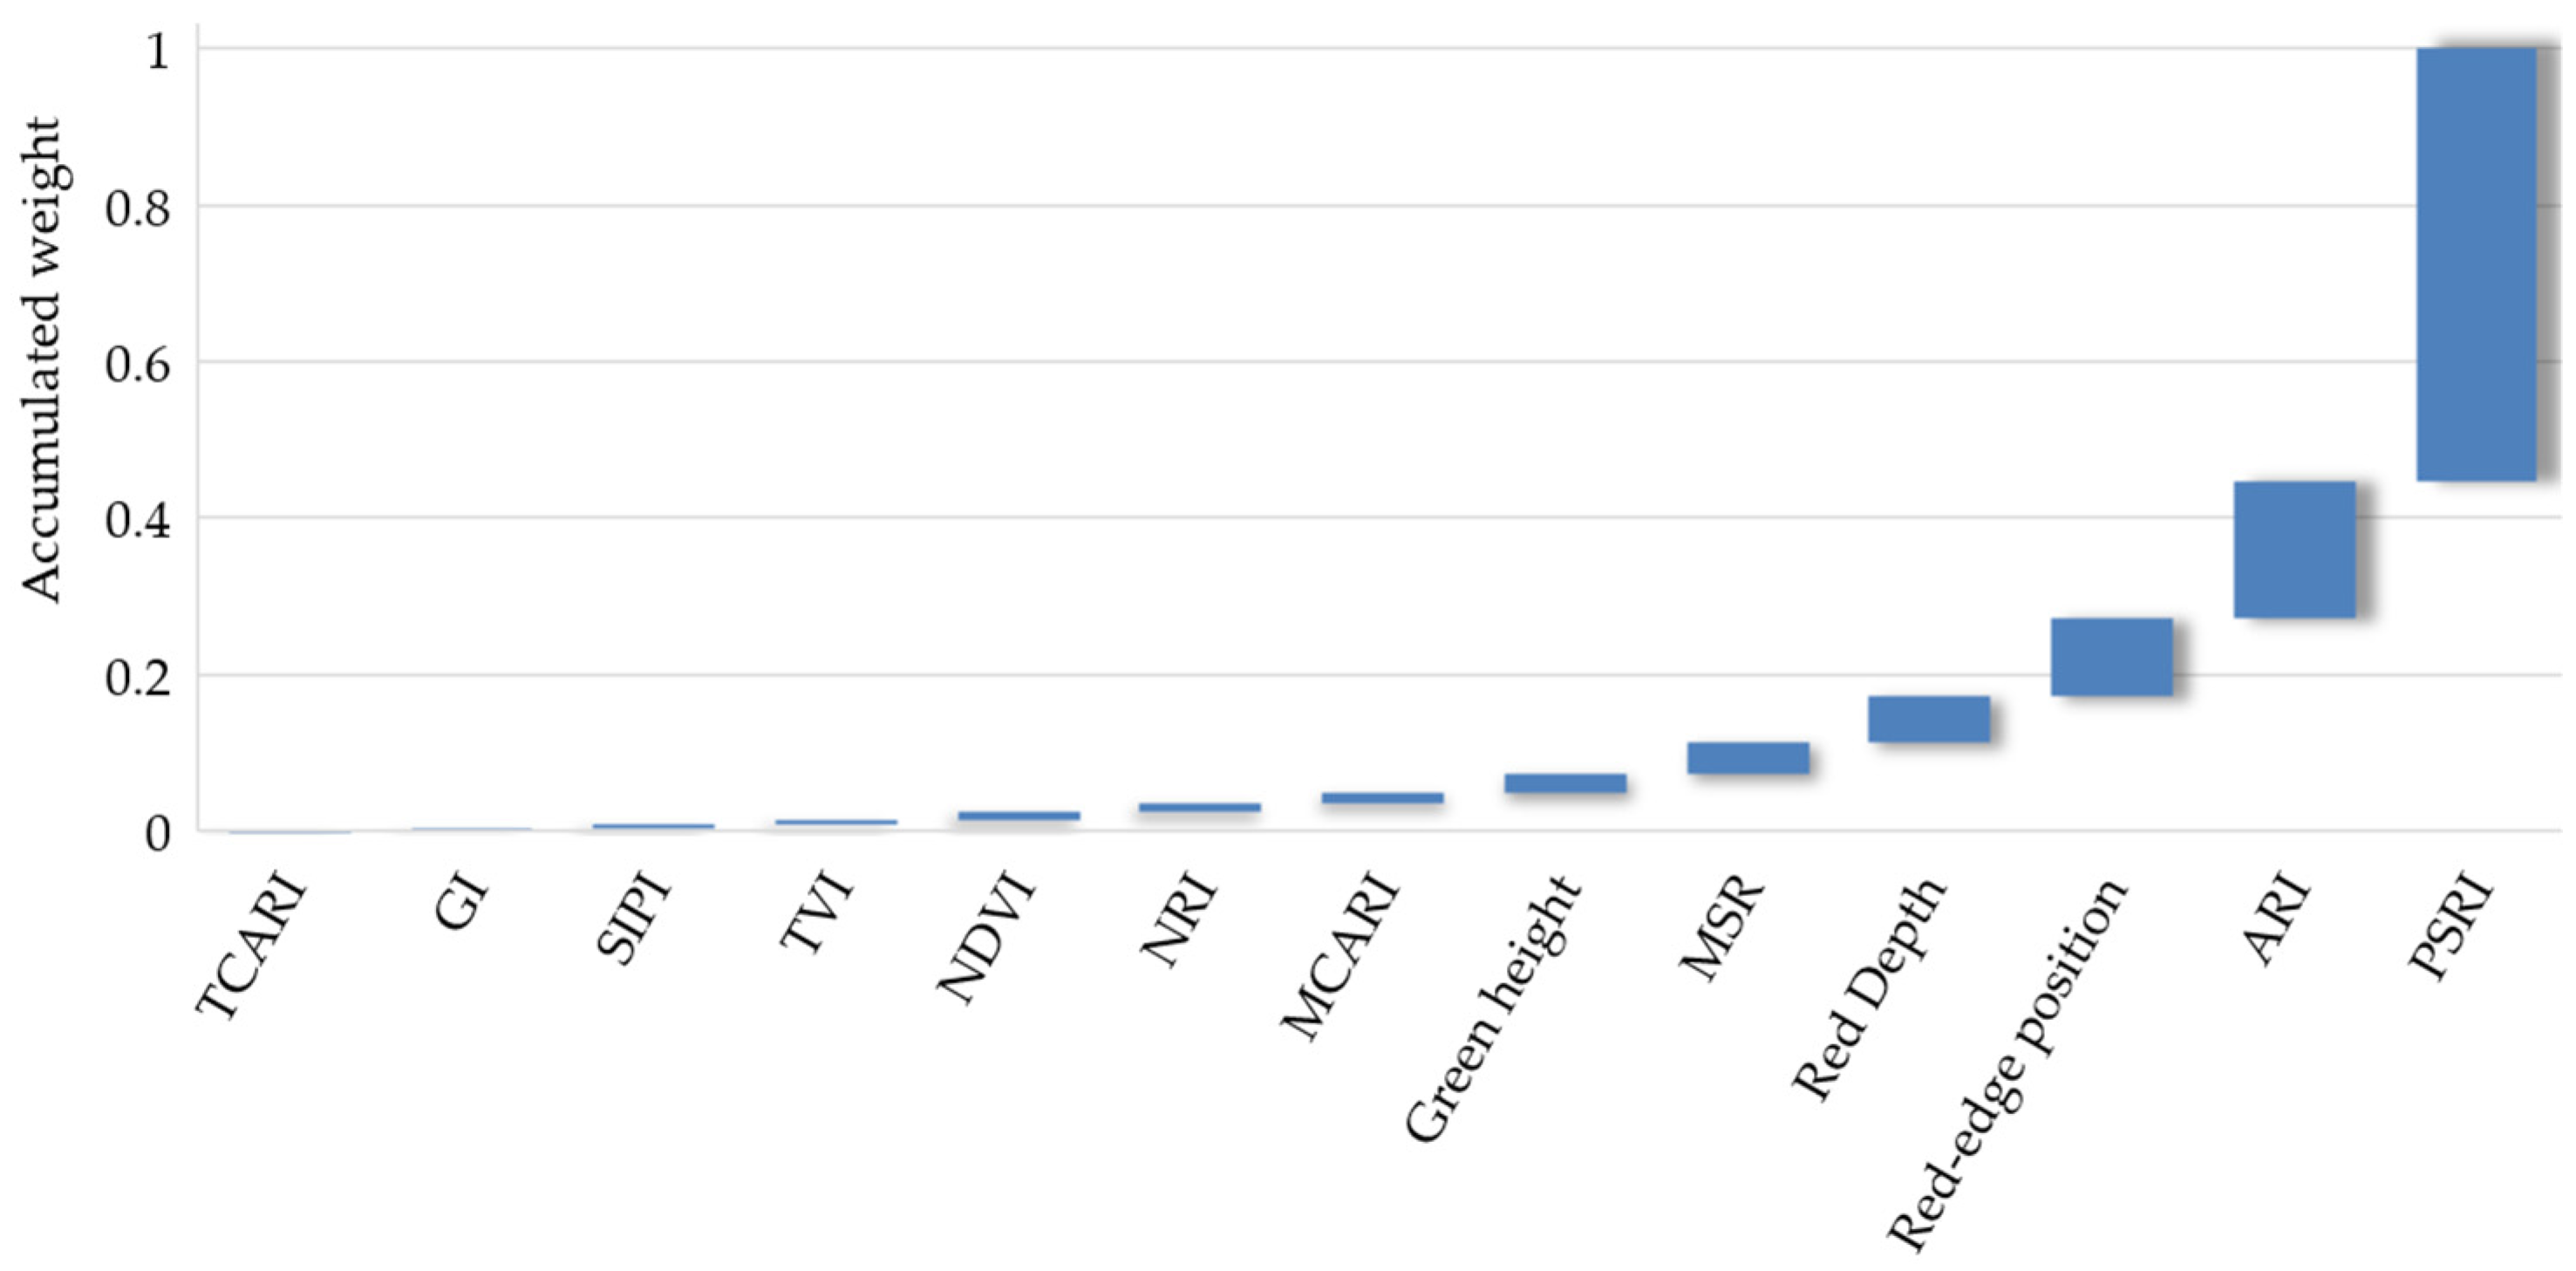
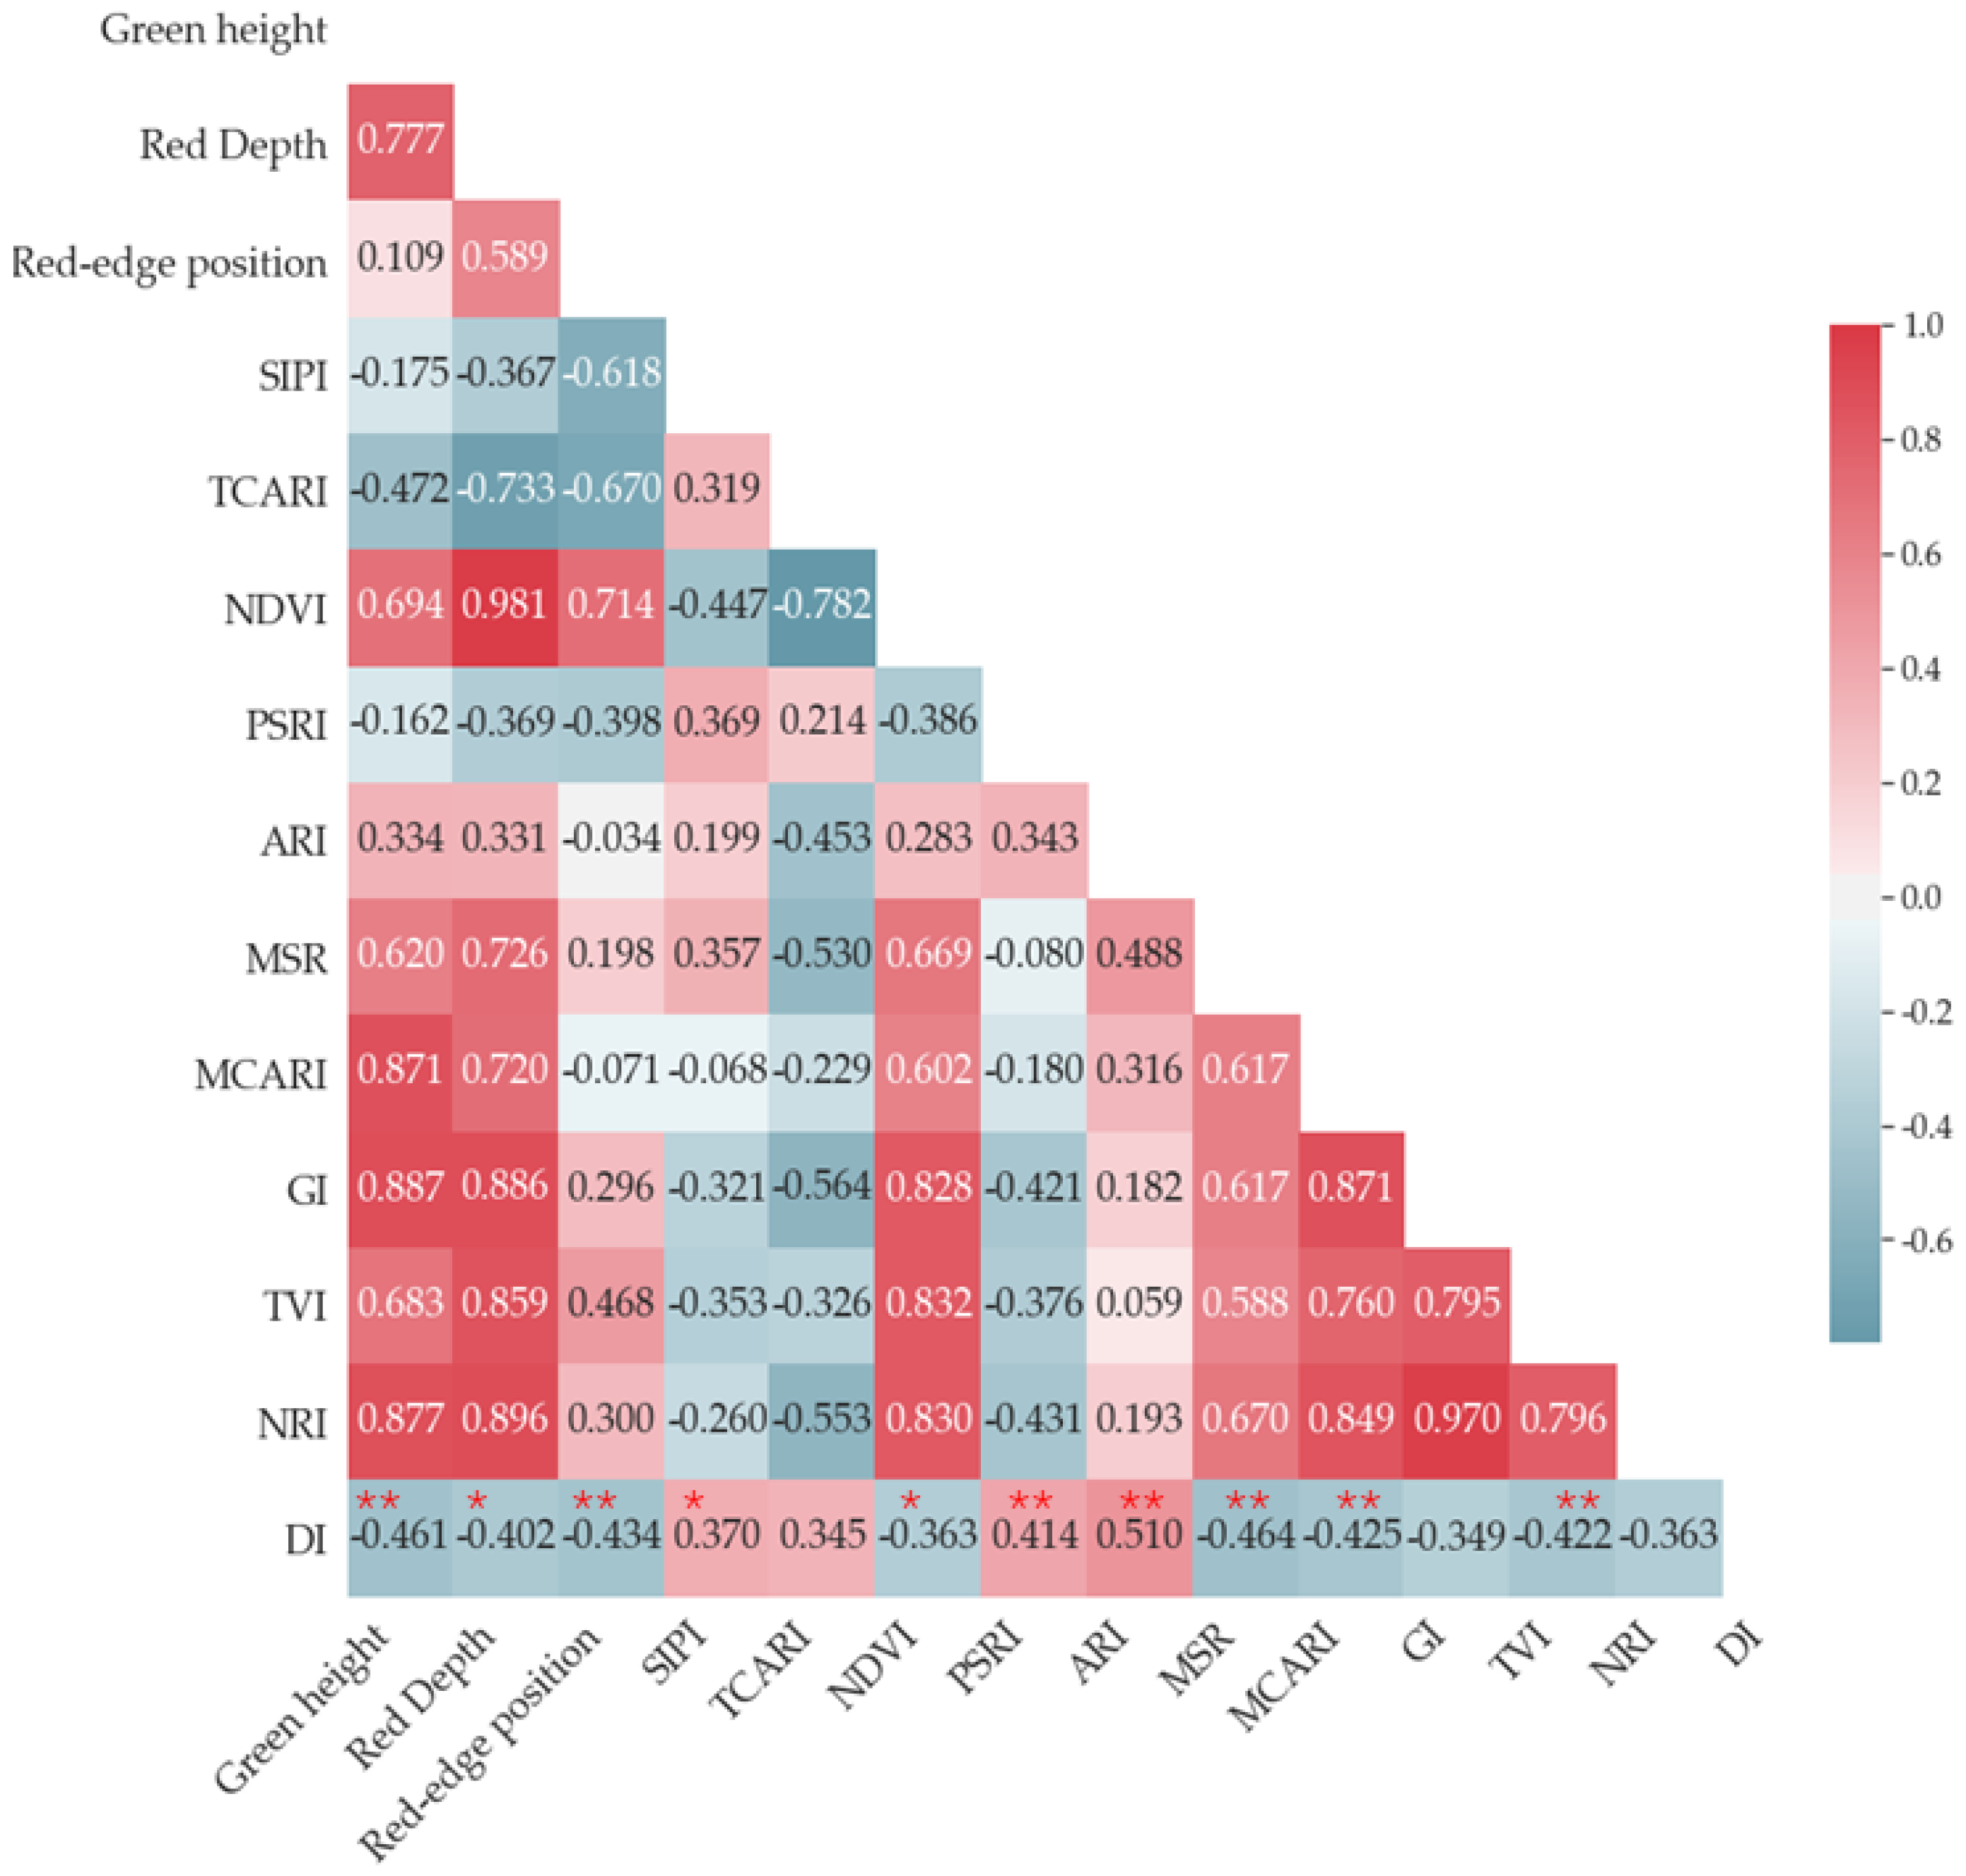
For the selection of spectral features, we first calculated some spectral indices through original band combinations or spectral curve characteristic extractions, to indicate different aspects of host growth [37,38]. For instance, vegetation pigment content includes chlorophyll and anthocyanin (considered by the Structure Insensitive Pigment Index (SIPI), Transformed Chlorophyll Absorption Reflectance Index (TCARI), Anthocyanin Reflectance Index (ARI), Red-edge Position, and Green Index (GI)), the leaf area index or biomass (considered by the Normalized Difference Vegetation Index (NDVI), Modified Simple Ratio Index (MSR)), and the crop growth or stress state (considered by the Plant Senescence Reflectance Index (PSRI), Modified Chlorophyll Absorption Ratio Index (MCARI), Triangular Vegetation Index (TVI), and Nitrogen Reflectance Index (NRI)). Then, the spectral features were obtained while considering two points, that is, the redundancies among the selected indices, and the sensitivity of each index to FHB. The Kendall correlation coefficient, a nonparametric method, was calculated to illustrate the correlations among the indices; and the correlations between the indices and the disease rate [39]. In addition, the Relief algorithm was used to acquire the explanatory weight of these indices to indicate their relative importance in discriminating the disease patterns [40]. The studied wheat was in the same growth period during the experiments conducted on May 3 and May 8 and the changes in its spectral features between the two sampling dates were mainly due to the development of diseases rather than the growth of the plants. Therefore, when selecting the sensitive spectral features and the bands containing the most disease information, the two-day experimental survey data, that is, the 80 groups of samples marked as characterizing severe disease or light disease were combined. Figure 3 shows both the actual relief weights of all spectral indices and their accumulated weights for distinguishing between severe and slightly diseased samples. Initially, when the accumulated weight was more than 0.9, four parameters, including the PSRI, ARI, Red-edge position, and Red Depth were selected. Then, according to the results of the Kendall correlation coefficients among the spectral indices (Figure 4), the correlation between the Red-edge position and Red Depth was approximately 0.6, indicating redundancy. Therefore, the PSRI, ARI, and Red-edge position were chosen to describe crop growth and disease stress.
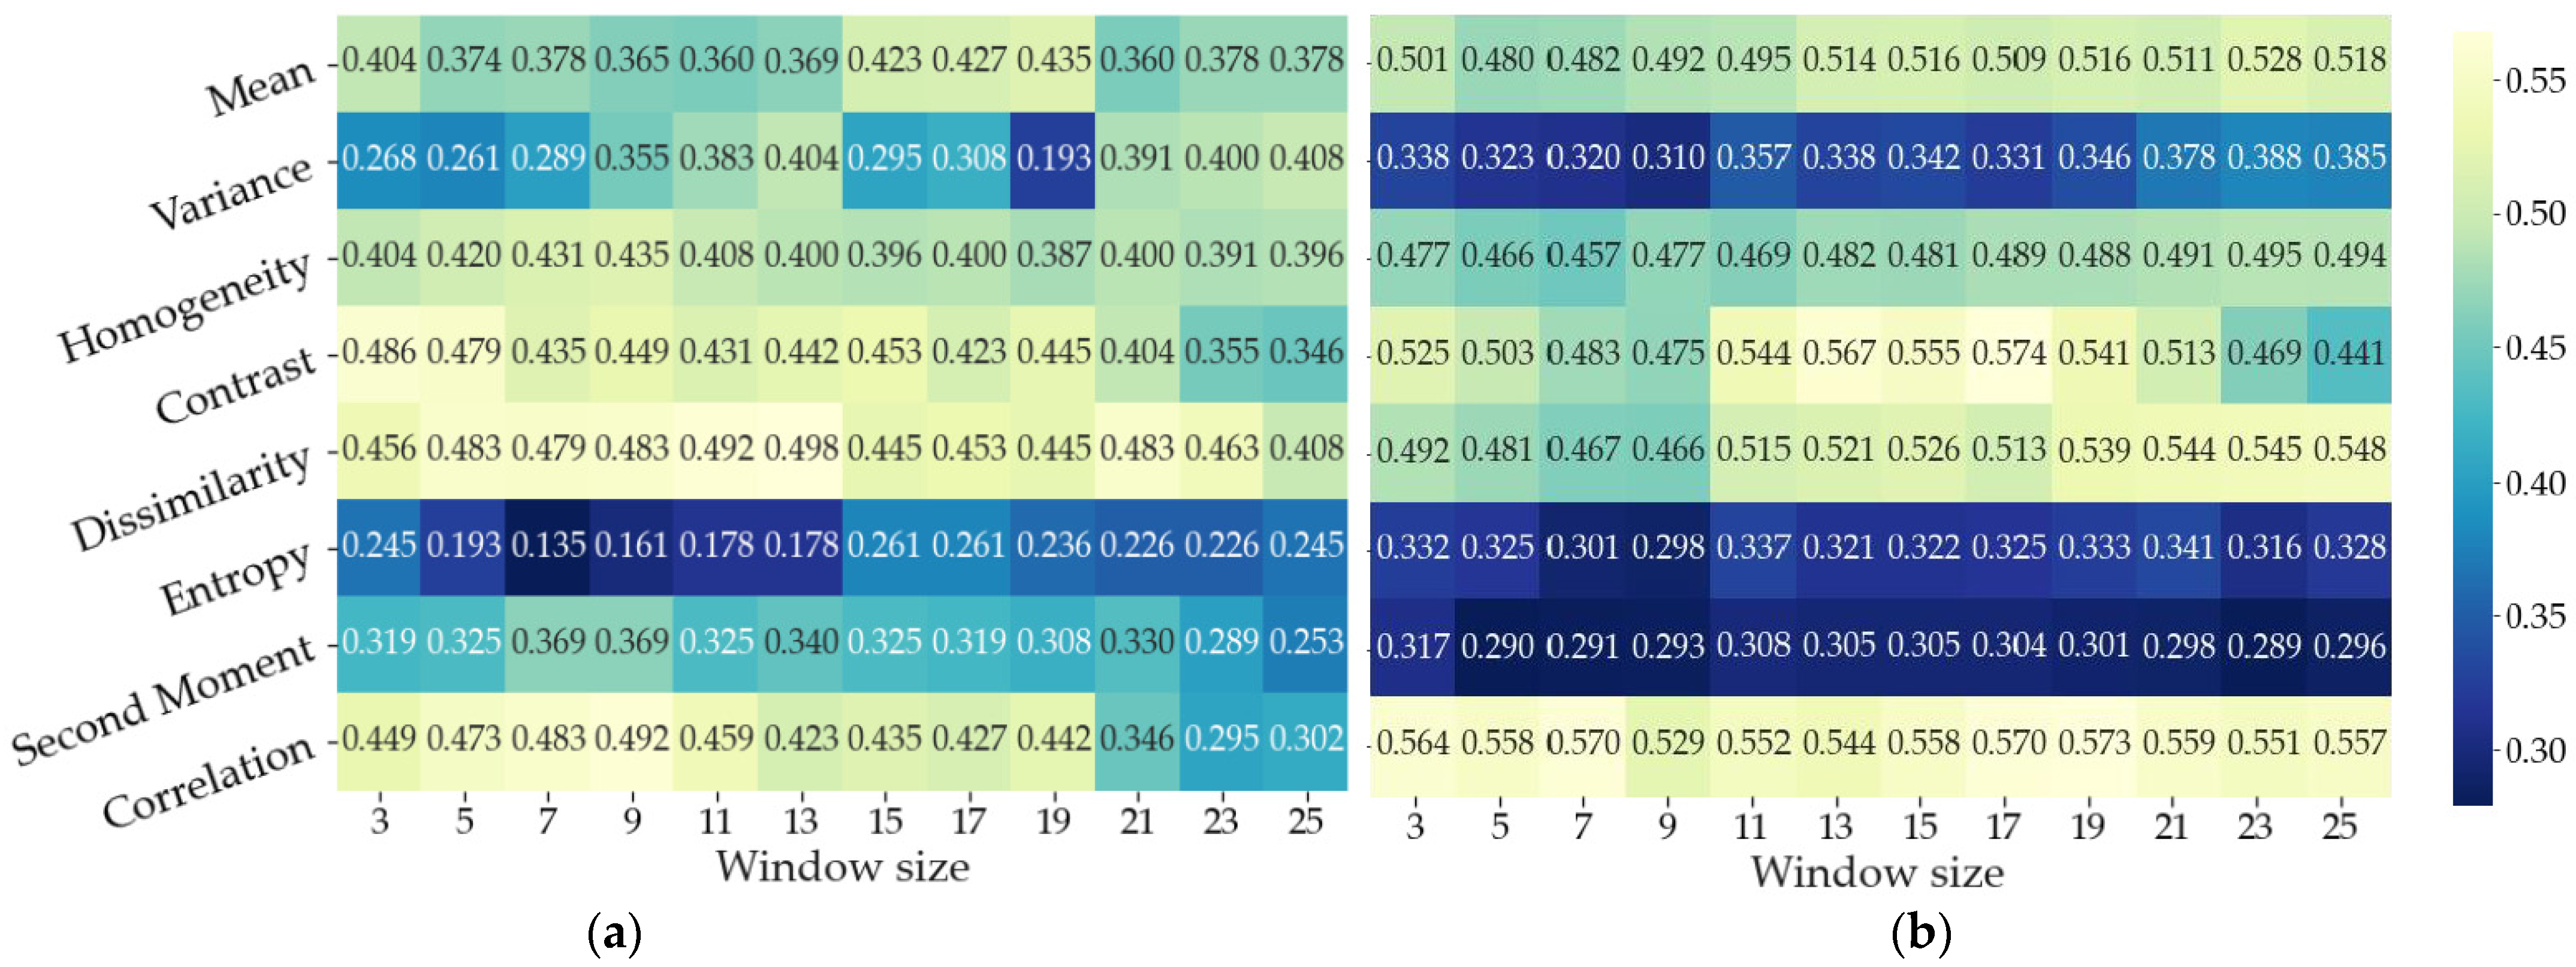
For the texture features, we utilized the GLCM to obtain the gray changes in different window sizes and then calculated various statistical parameters to describe the changes [41]. Two points need to be considered in the selection of texture features. First, we selected the gray images from which the texture features were extracted; these images included bands that were sensitive to FHB or contained more image information. Then, the texture indices were extracted from gray images, and the indices with high correlations with FHB were selected as texture features. We extracted these individual bands that participated in selected spectral features and evaluated their redundancy and correlation with the disease rate to obtain the bands that were the most sensitive to the spatial distribution of field-scale FHB. Based on the GLCM calculations in different window sizes (unit: pixel × pixel), the texture statistical attributes were quantitatively described, including the mean, variance, homogeneity, contrast, dissimilarity, entropy, second moment and correlation, to measure the similarity, contrast, uniformity, texture thickness or regularity of GLCMs in rows or columns. Then Kendall correlation was utilized to describe the correlation between each texture index and the disease rate, and the texture indices with the highest correlations were selected as the texture features.
2.2.2. Optimal Window Size Selection and Model Performance Analysis
By comprehensively considering the host growth and the spatial characteristics of the disease, we utilized the selected sensitive spectral features and texture features in different window sizes to evaluate the performance of these texture features on FHB detection in different periods and obtained the optimal window accordingly.
In the early and late stages of field-scale FHB, the samples with sensitive spectral and texture features in different windows were randomly divided into training sets and test sets according to a certain proportion. Each training set was used to train the logistic model, and to judge whether each pixel was severely diseased, and the detection results were mapped. In addition, the corresponding test set was utilized to assess the performance of the model from three aspects. Based on the confusion matrix, we evaluated the discriminant ability of the model, comprehensively examined the sensitivity and precision of the model, and then examined the generalization ability of the model.
The logistic model used in this study is a classical classification model that has been widely used in the field of agricultural remote sensing [11,42]. It has the features if rapid calculation, easy implementation, ability to provide a posteriori probability and insensitivity to collinearity between features [43]. The confusion matrix summarizes the classification results of the records in the data sets according to the actual and corresponding predicted categories in the form of a matrix, as shown in Table 1. First, the training sets covering different periods were used to train the logistic model; then the model was used to obtain the distribution of severe diseases in the field. Then, we used the corresponding test sets to calculate the accuracy of the model, averaged the accuracy acquired by considering texture features under different window sizes, and compared the performances. Considering the sensitivity (true positive rate, TPR) and specificity (true negative rate, TNR) of the model, the F1 score was calculated. The F1 score is generally used to seek a balance between precision and sensitivity under an even class distribution [44]. To evaluate the generalization ability of the model, cross-validation in the training sets was applied, and the average overall accuracy (AA) of the corresponding model was calculated. In addition, as class imbalances often occur, multiple training and test sets were utilized to obtain the false positive rate (FPR = 1 − TNR) and true positive rate (TPR) of the model under different classification thresholds, and then to obtain the average receiver operating characteristic curve (ROC) and the area under the ROC curve (AUC) [45]. The accuracy, F1 score and AUC values of the models trained by texture features obtained under different window sizes were compared, and the optimal window sizes of texture features in the early and late stages of FHB were obtained.
Combining the spatial distribution of the disease and the influence of FHB on the spectral features of wheat, the detection accuracy of high-spatial-resolution remote sensing images can be improved. Due to the spread of FHB, its spatial distribution pattern changes and the results are more accurate and convincing when obtained using texture features in different window sizes in distinct periods. The logistic model works better when removing features that are unrelated to the output variable as well as those that are very highly correlated to each other. These conditions also make the detection results more reliable. Therefore, using sensitive spectral features and texture features under the optimal window size, and using the logistic model, wheat FHB can be accurately detected.
3. Results
3.1. Sensitive Spectral and Texture Features Selection
The bands contained in the selected spectral features were extracted (Figure 5), and the Kendall correlation coefficients between the bands were calculated. To eliminate redundancy, we set the threshold of Kendall correlation to 0.7 to remove some bands. As a result, the 550, 670, 702, and 740 nm bands were selected. Utilizing the four gray images obtained on May 3 and May 8, the texture features in windows with sizes of 3 × 3, 5 × 5, 7 × 7, …, to 25 × 25 pixels were extracted. Because the planting of wheat in the study area was regular, the direction was set according to the planting direction, and the step size was one. Subsequently, the PC1s of the mean, variance, homogeneity, contrast, dissimilarity, entropy, second moment, and correlation extracted from the four gray images were obtained. Finally, the correlation between the corresponding PC1 of each texture index and the disease rate was calculated (Table 2). Five texture indices, including the mean, homogeneity, contrast, dissimilarity, and correlation, were selected as texture features to illustrate the spatial distribution information of diseases. According to Figure 5, it can be preliminarily judged that for the early stage of FHB (May 3, at which time the severe disease area was relatively sparse), the texture features in windows with pixel sizes smaller than 13 × 13 can better reflect the spatial distribution of gray differences caused by FHB, while for late-stage FHB (May 8, at which time a large number of severely diseased areas appeared), the optimal window size was larger than 17 × 17 pixels. When the window size is large, the obtained disease information may be weakened, especially when the disease presents a point distribution. When the window size is small, it may be difficult to reflect the texture of the aggregated disease distribution, leading to incorrect classifications.
3.2. FHB Detection with a Logistic Model and Its Performance Analysis
By combining the sensitive spectral and texture features, a logistic model was utilized to detect the severely diseased wheat areas on May 3 and May 8. The spectral features obtained with the PC1s of texture features in different windows were used as inputs to observe the influence of the window size on the accuracy of the model. The size corresponding to the highest accuracy was selected as the optimal size. In addition, the performance of the model and the detection results were compared when texture features with different window sizes were used as inputs.
3.2.1. FHB Detection with the Logistic Model Using Texture Features in Optimal Window Sizes and Spectral Features
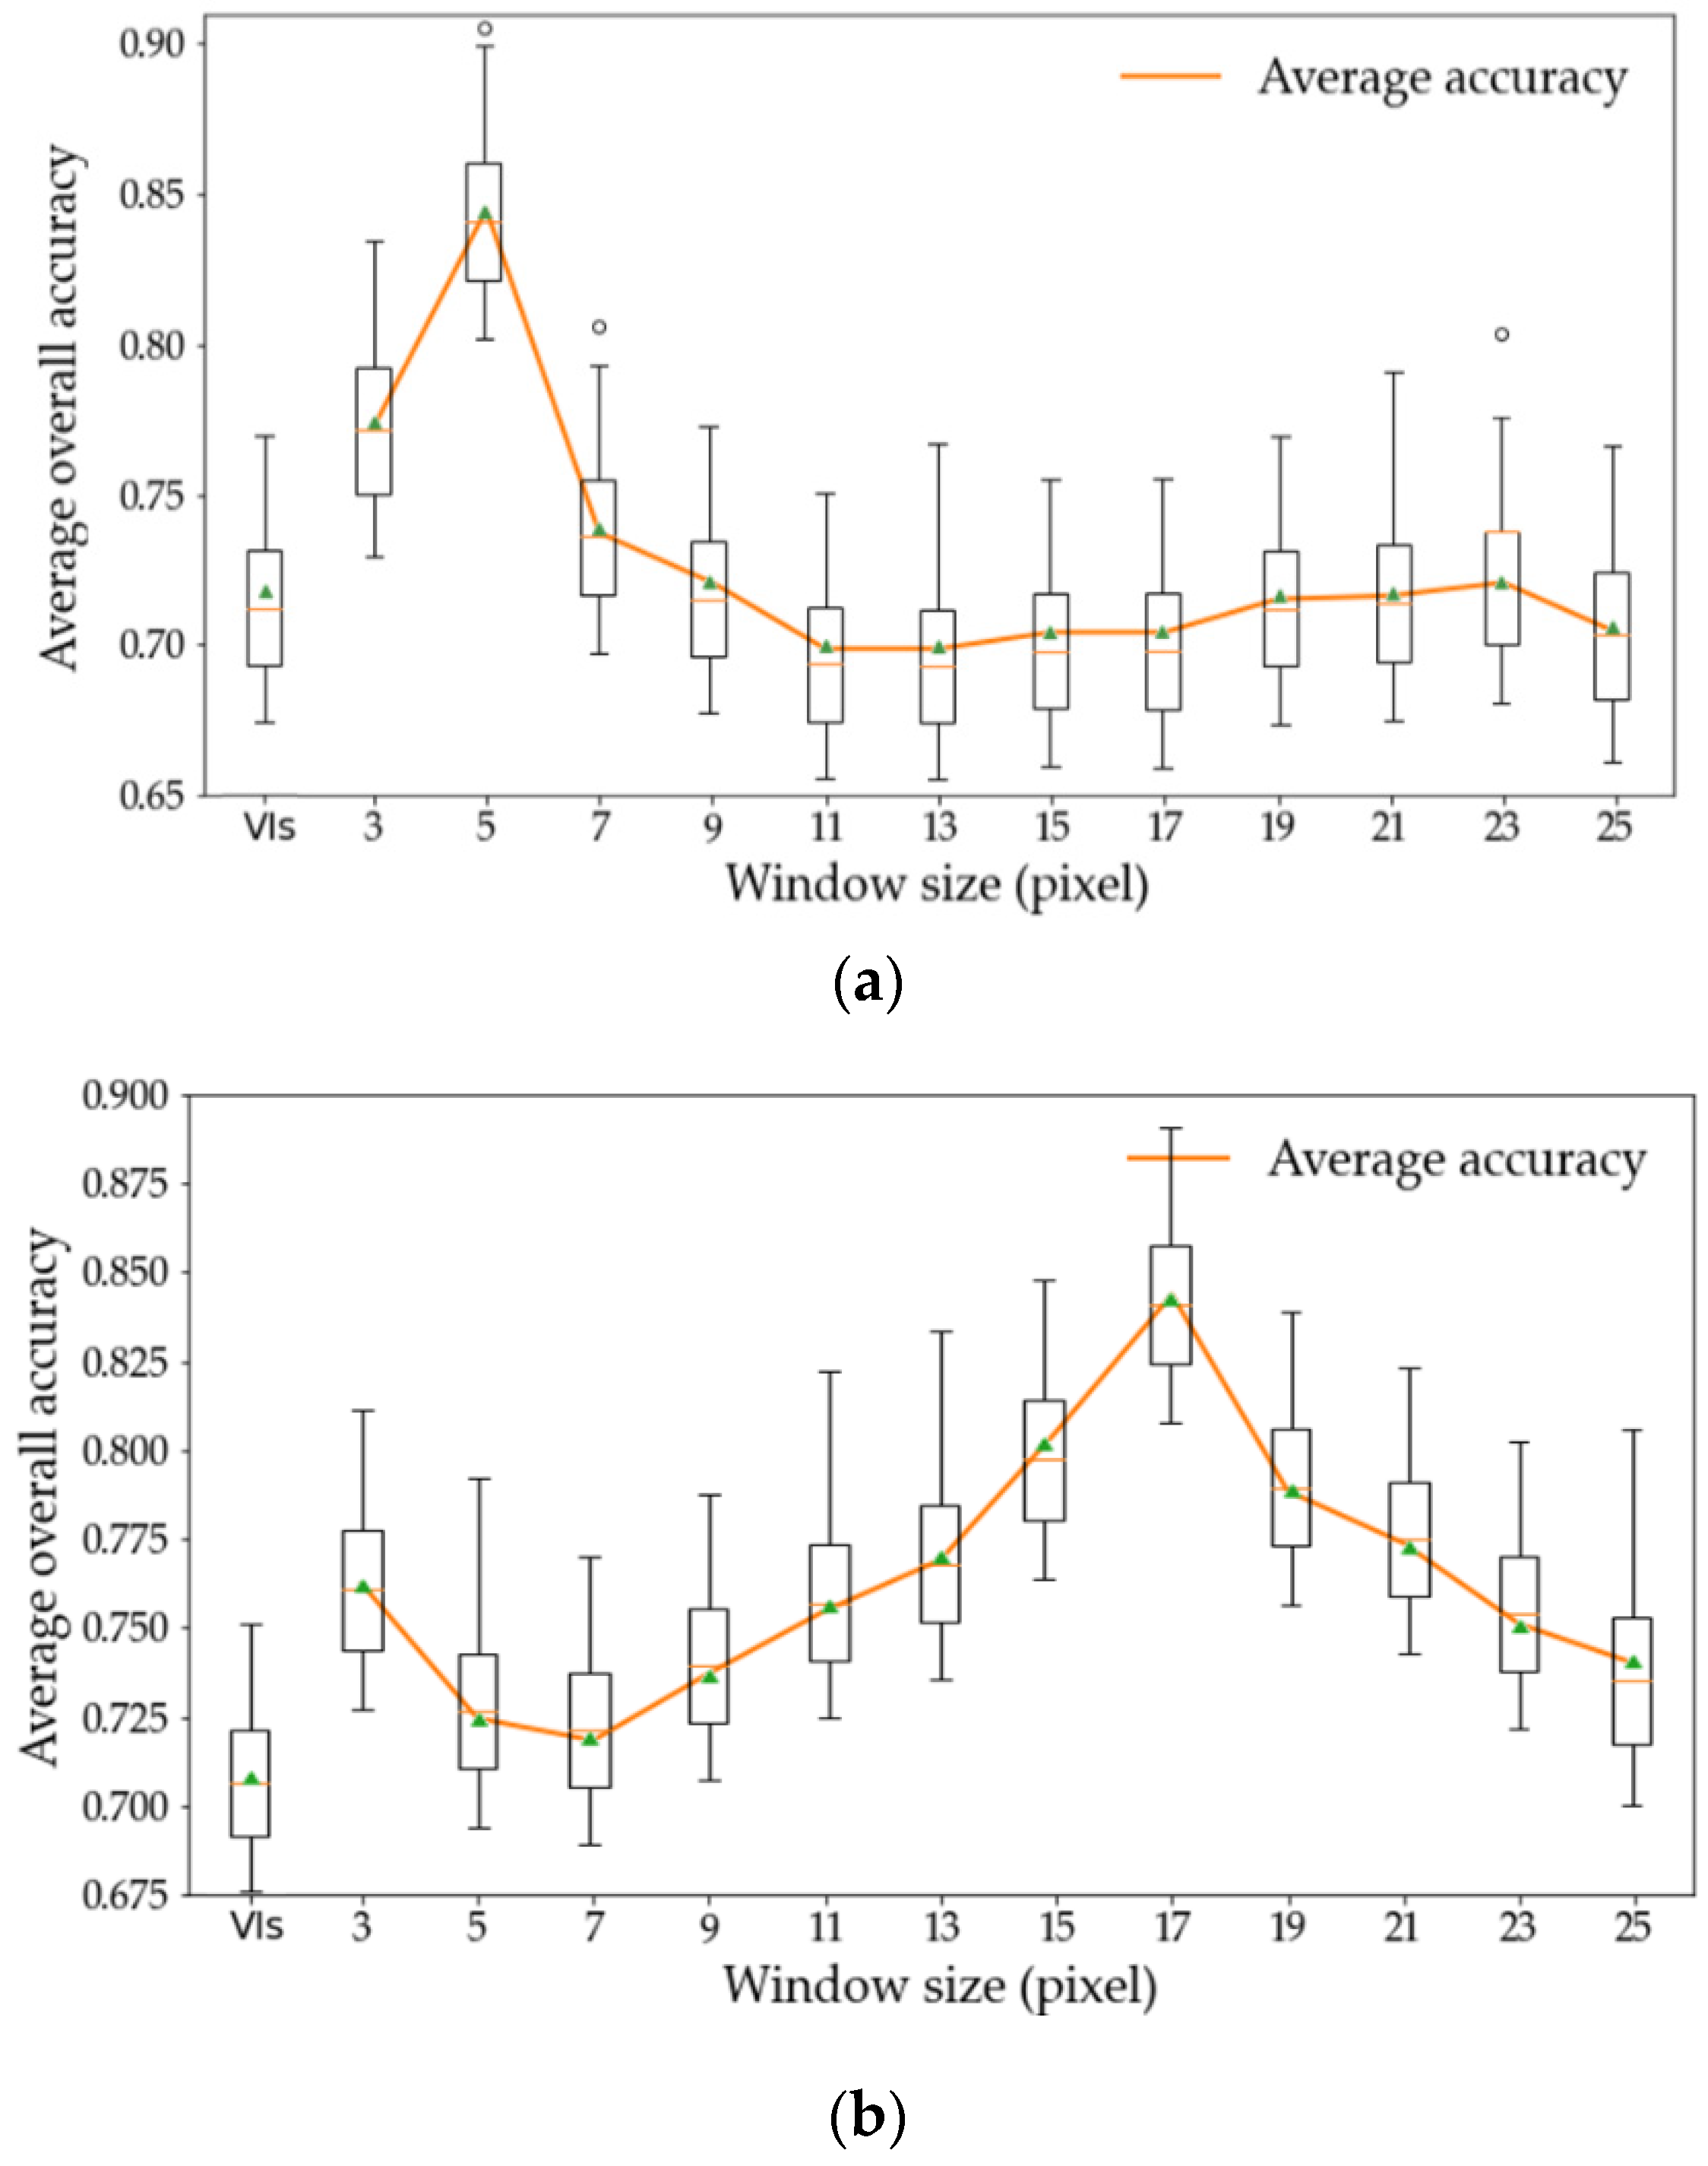
For the determination of the optimal window size, further investigation of the influence of texture features in windows with different sizes on the overall accuracy (OA) of the model in detecting severe disease was required. Therefore, we randomly divided the samples collected on May 3 and May 8 at a ratio of 7:3 into training sets and test sets, for 50 times. Then training sets were utilized to construct the logistic model, and test sets were used to calculate the overall accuracy. The accuracies of the models constructed by the texture features in windows with different sizes are shown in Figure 6.
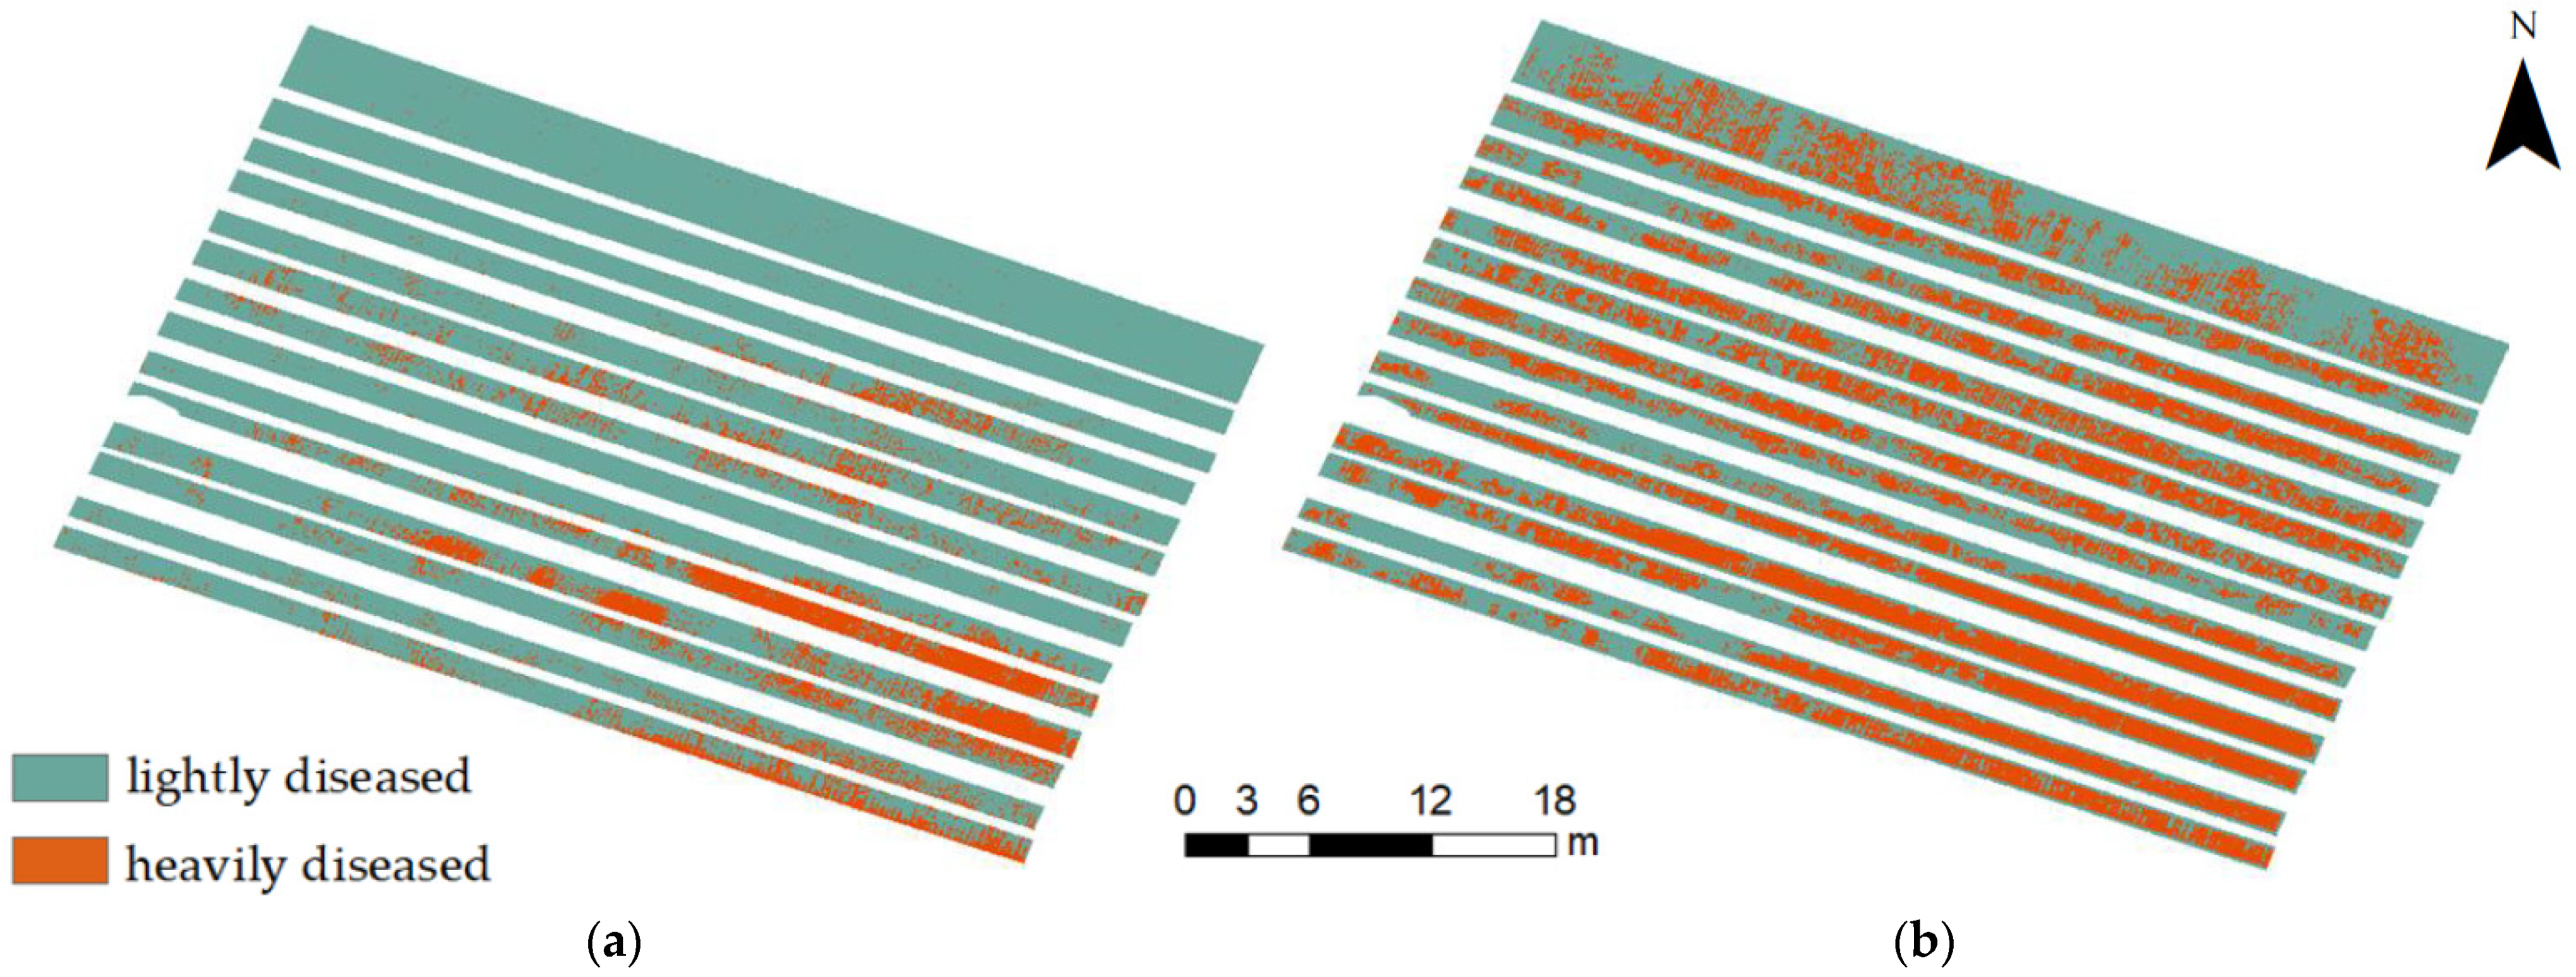
According to these results, the average accuracy of the model in detecting FHB on May 3 was highest when the window size was 5 × 5 pixels, while on May 8, the highest accuracy was obtained when the window size was 17 × 17 pixels. Figure 7 shows the results of the severely diseased area detections conducted on the two studied days by using sensitive spectral features and the texture features in the optimal window size. On May 3, the proportion of the severely diseased area was 14.9%, and except for the southeast area of the studied field, the severely diseased areas were relatively sparse. On May 8, the proportion rose to 77.8%, and the severely diseased area differed from its previous sporadic distribution and appeared in succession. This was consistent with the results of our field investigation and the infectious characteristics of FHB. Due to the absence of disease control measures, FHB spreads rapidly from the disease occurrence point throughout the study area, resulting in its aggregation in the studied field.
3.2.2. Comparison of Model Performance and Results among Texture Features in Different Window Sizes
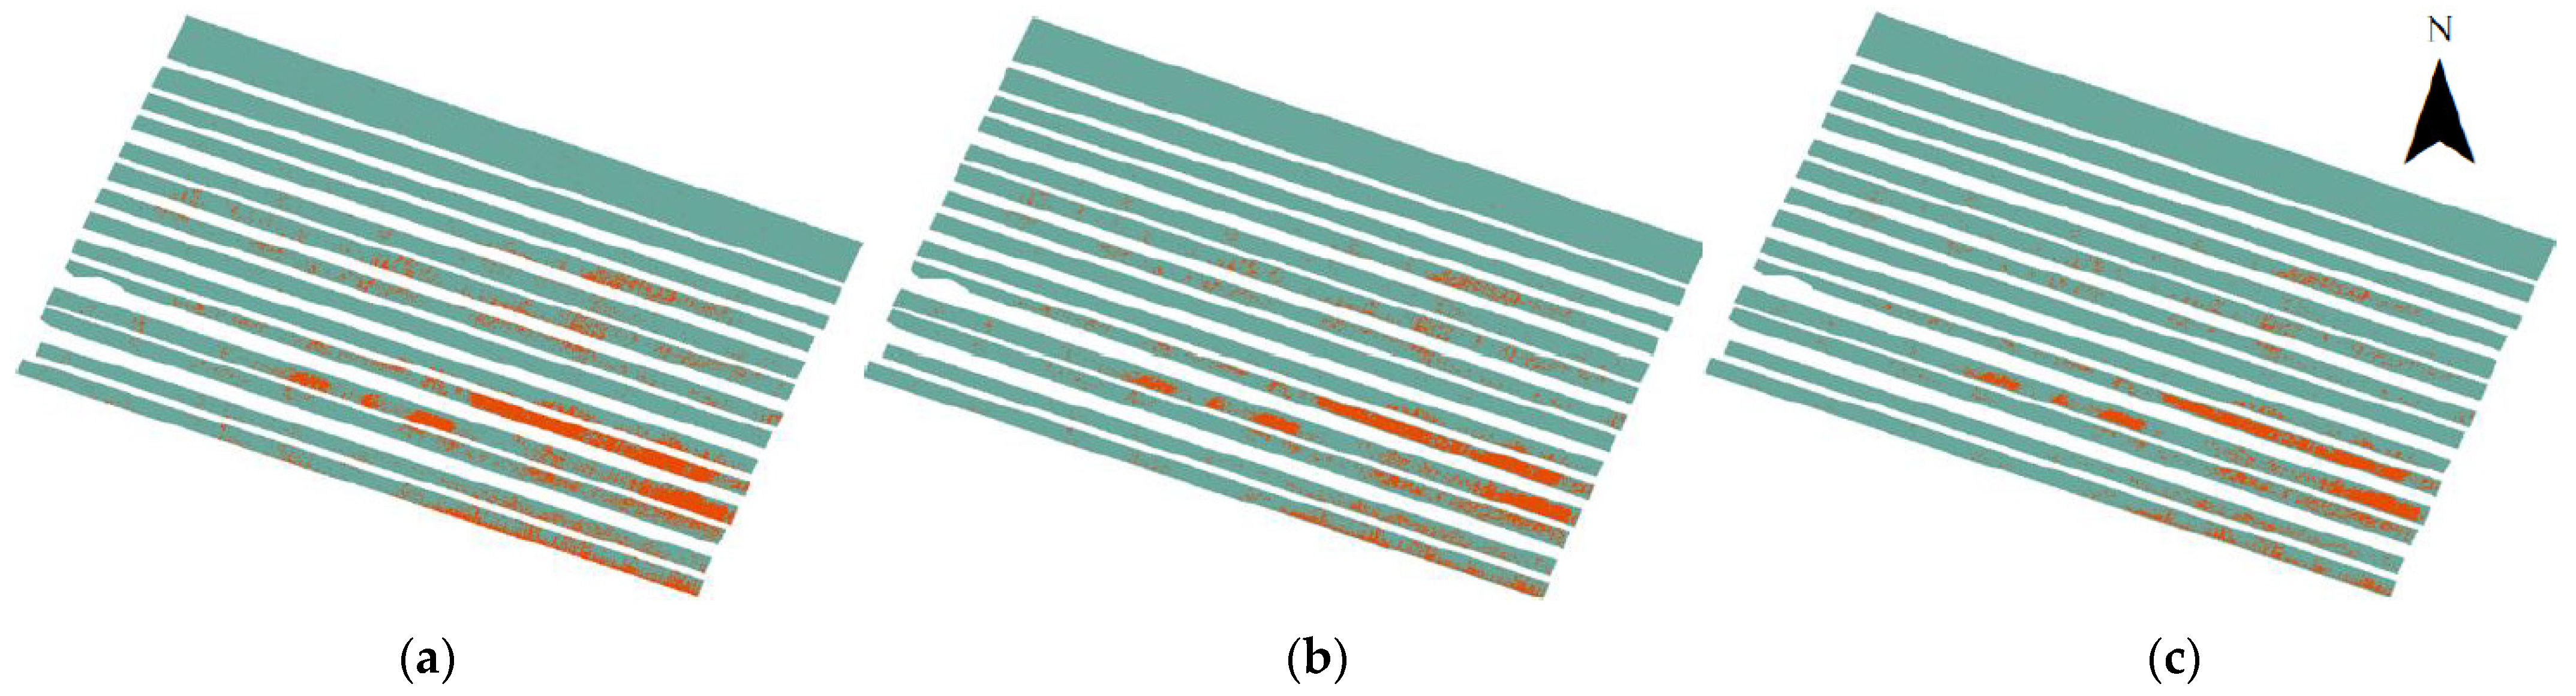
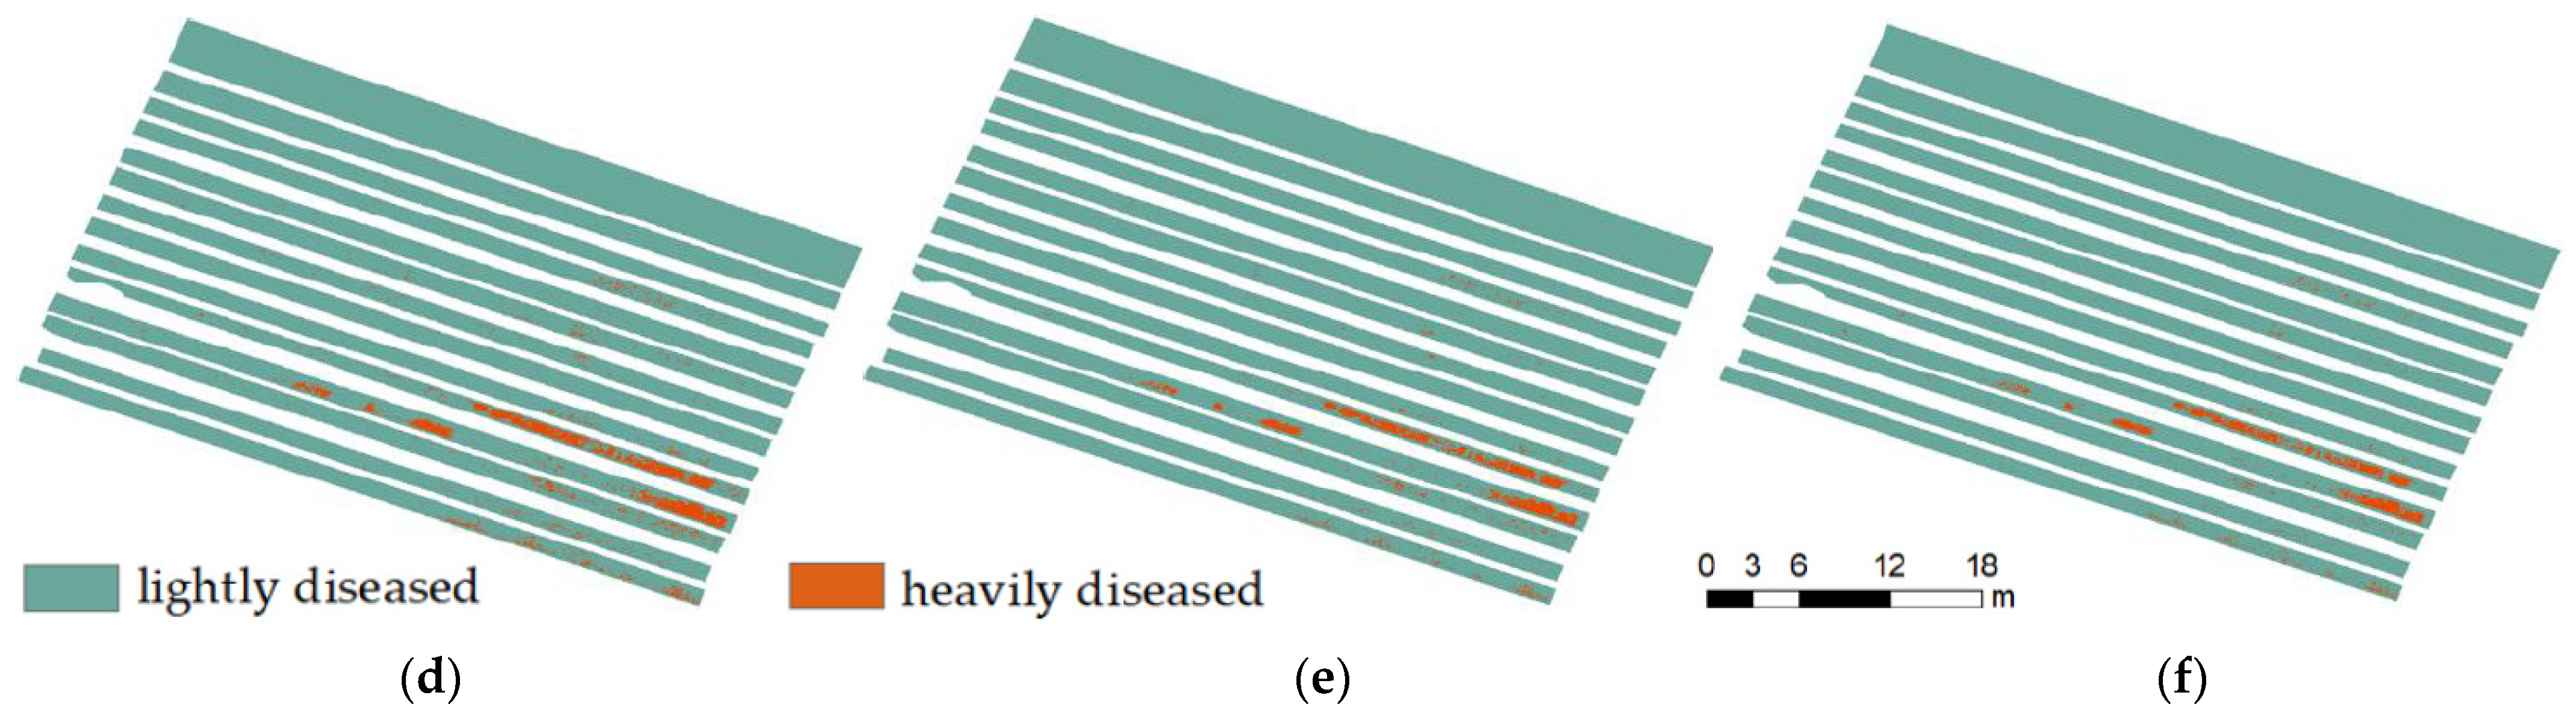
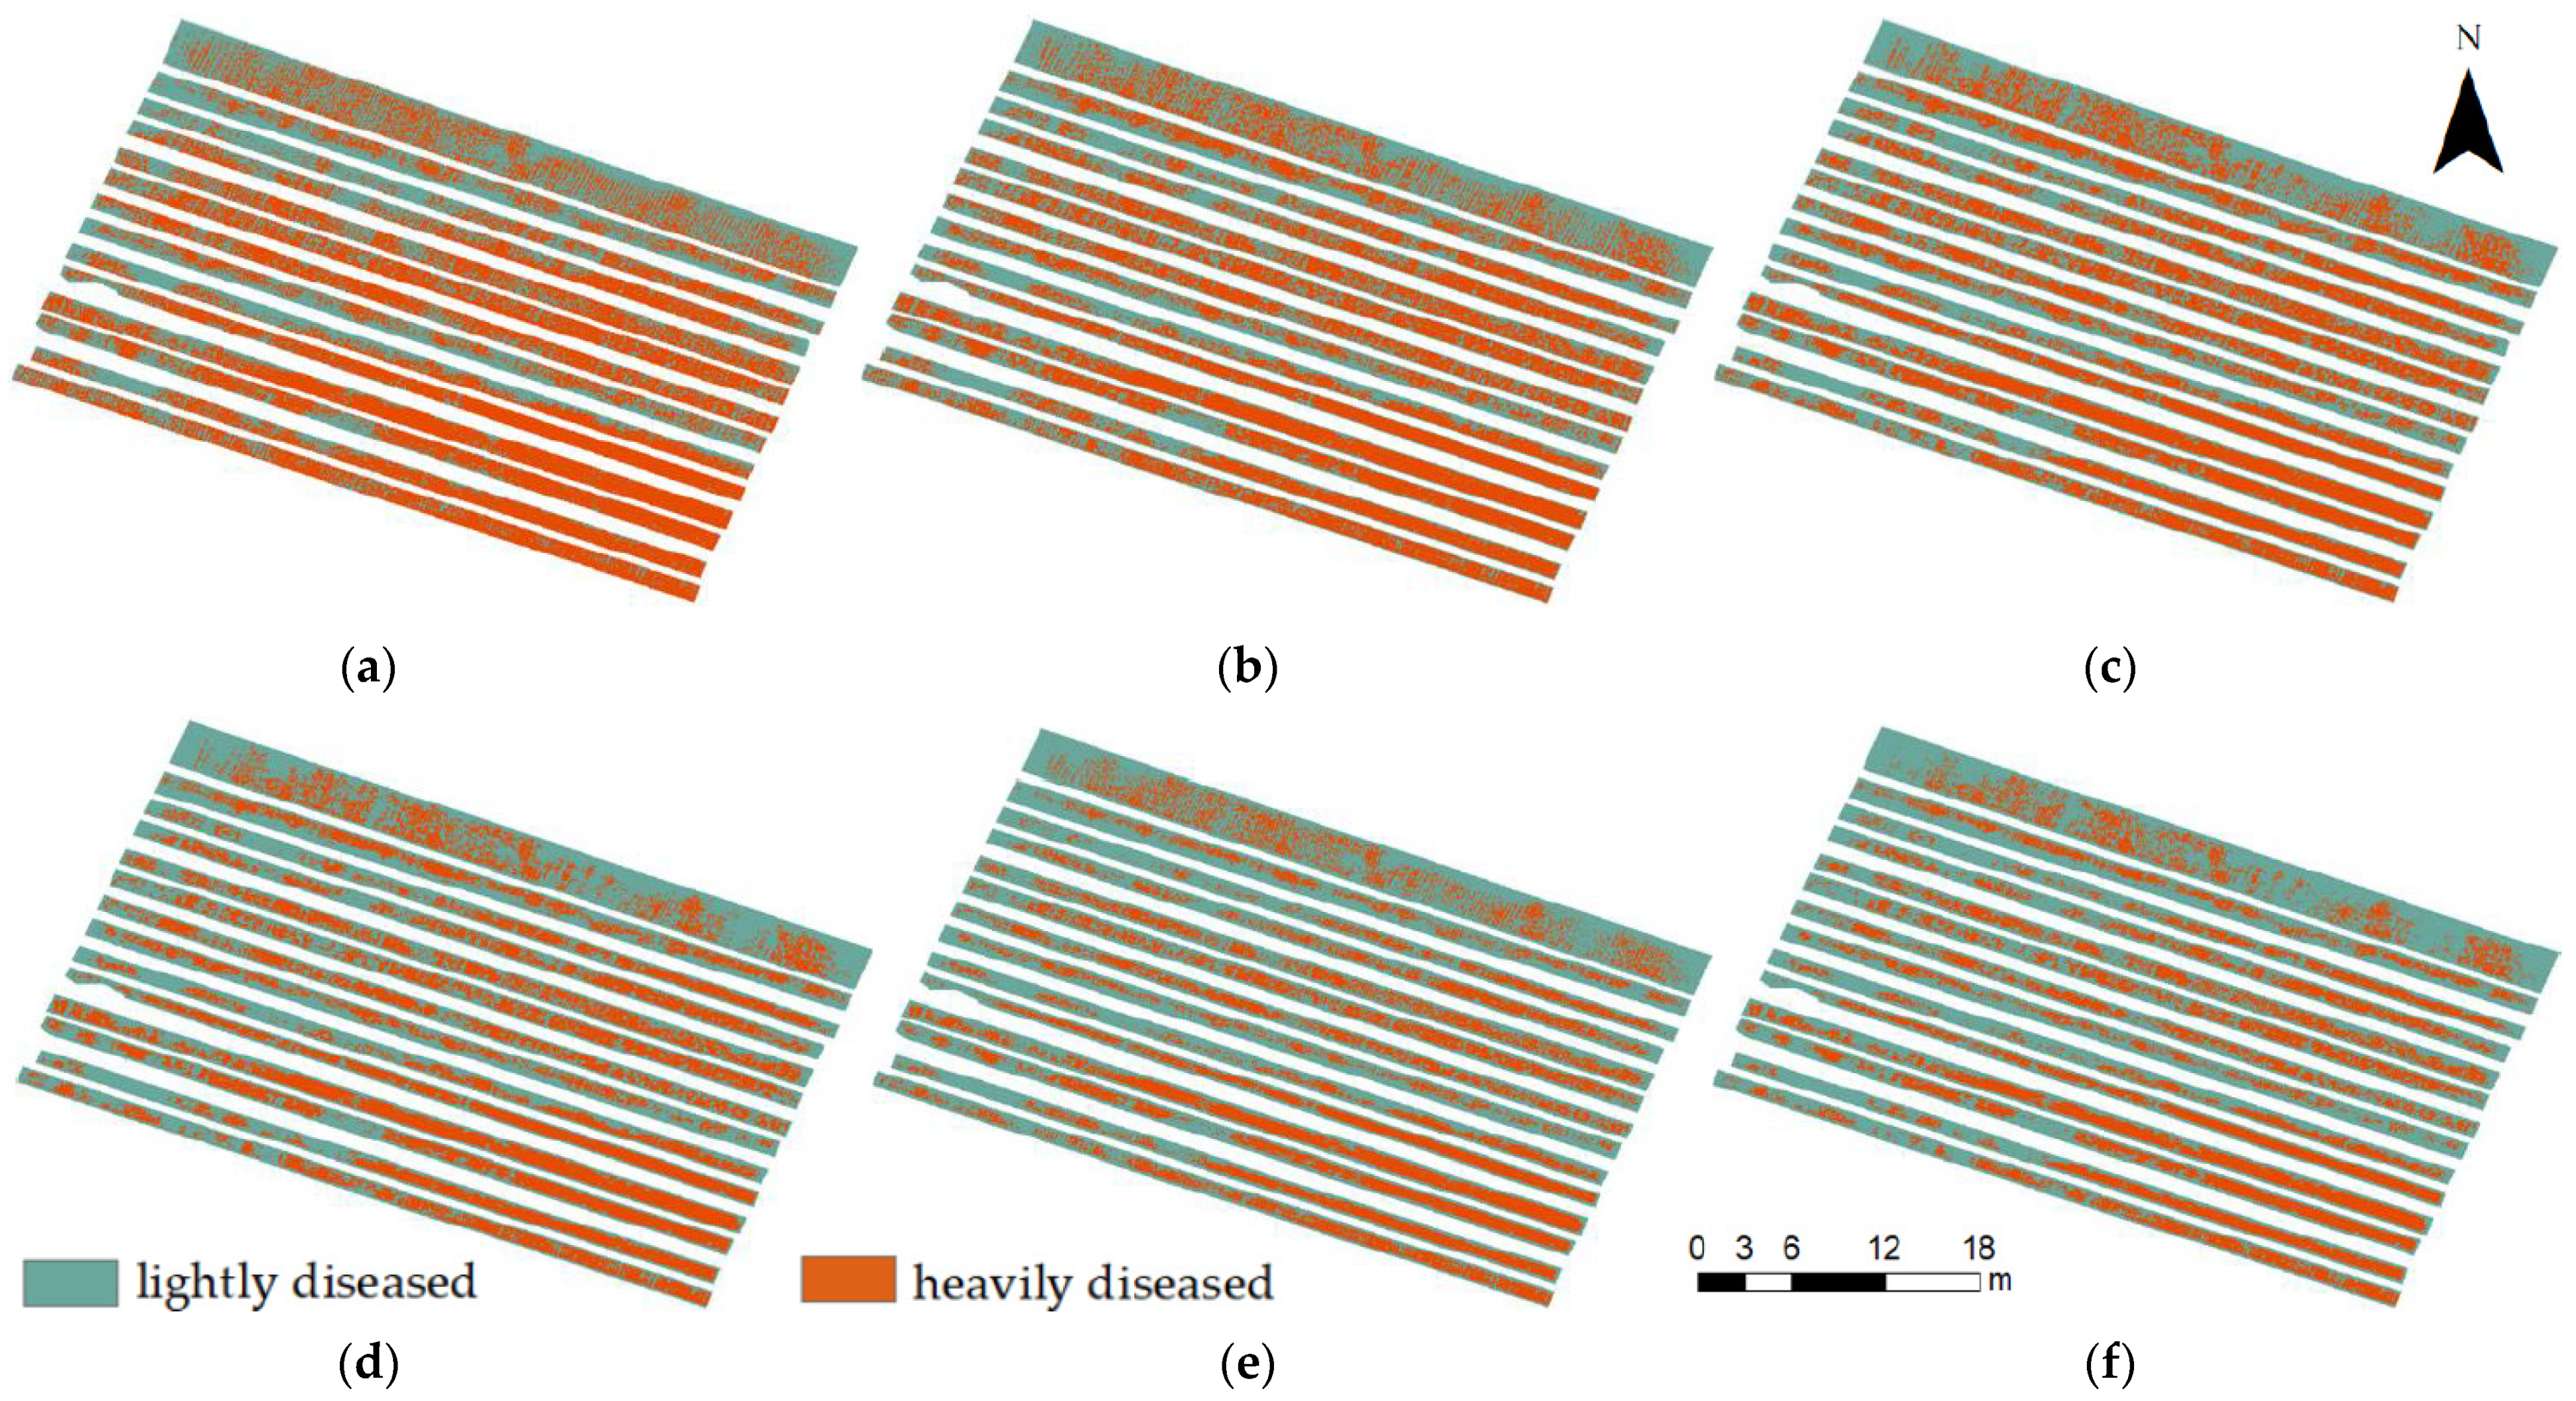
Furthermore, to explore the influence of texture features in different window sizes on the model performance and detection results, we used the texture features in windows with sizes of 5 × 5, 9 × 9, 13 × 13, 17 × 17, 21 × 21, and 25 × 25 pixels (4 cm for each pixel) to obtain the distributions of the severely diseased areas on May 3 and 8 (Figure 8 and Figure 9). From the mapping results, the larger the window from which texture features were extracted was, the less severe the FHB area was, regardless of whether the early or late stage was considered. Especially on May 3, when the window was larger than 13 × 13 pixels, less sporadic severe areas could be detected, and when the window was 25 × 25 pixels, the contiguous severe areas became broken. On May 8, when the window size was less than 13 × 13 pixels, the area changed little with the window size, and its distribution was very dense. When the window size was larger than 17 × 17 pixels, the area began to decrease, and the area also decreased significantly when the size was 25 × 25 pixels. The results showed that the texture features extracted from different window sizes impact the disease detection in the early and late stages, and selecting the appropriate size increases the accuracy of the results.
To evaluate the performance of the logistic model in detecting FHB, we trained the model by combining the spectral features and the texture features extracted from windows with sizes of 5 × 5, 9 × 9, 13 × 13, 17 × 17, 21 × 21, and 25 × 25 pixels. First, the classification threshold was set as 0.5, and the training sets and test sets defined for the two days were utilized. Then the overall accuracy (OA) and F1 score values of the model were calculated according to the confusion matrix (Table 3). In cases of overfitting and for a more persuasive model evaluation, we applied a five-fold cross-validation. That is, we randomly split the original dataset into five folds 50 times. In each five-fold group, four folds were used as the training set, and the remaining fold was used as the test set. Therefore, 50 groups of overall accuracies were obtained for the 50 test sets and then averaged (Table 3). The results showed that, on May 3rd, when the window size was 5 × 5 pixels, the performance of the model was better, and on May 8, the optimal window size was 17 × 17. Additionally, when the window size was closer to the optimal window size, the accuracy of the model was higher. The spatial distribution of the disease can be better explained when the window size is suitable.
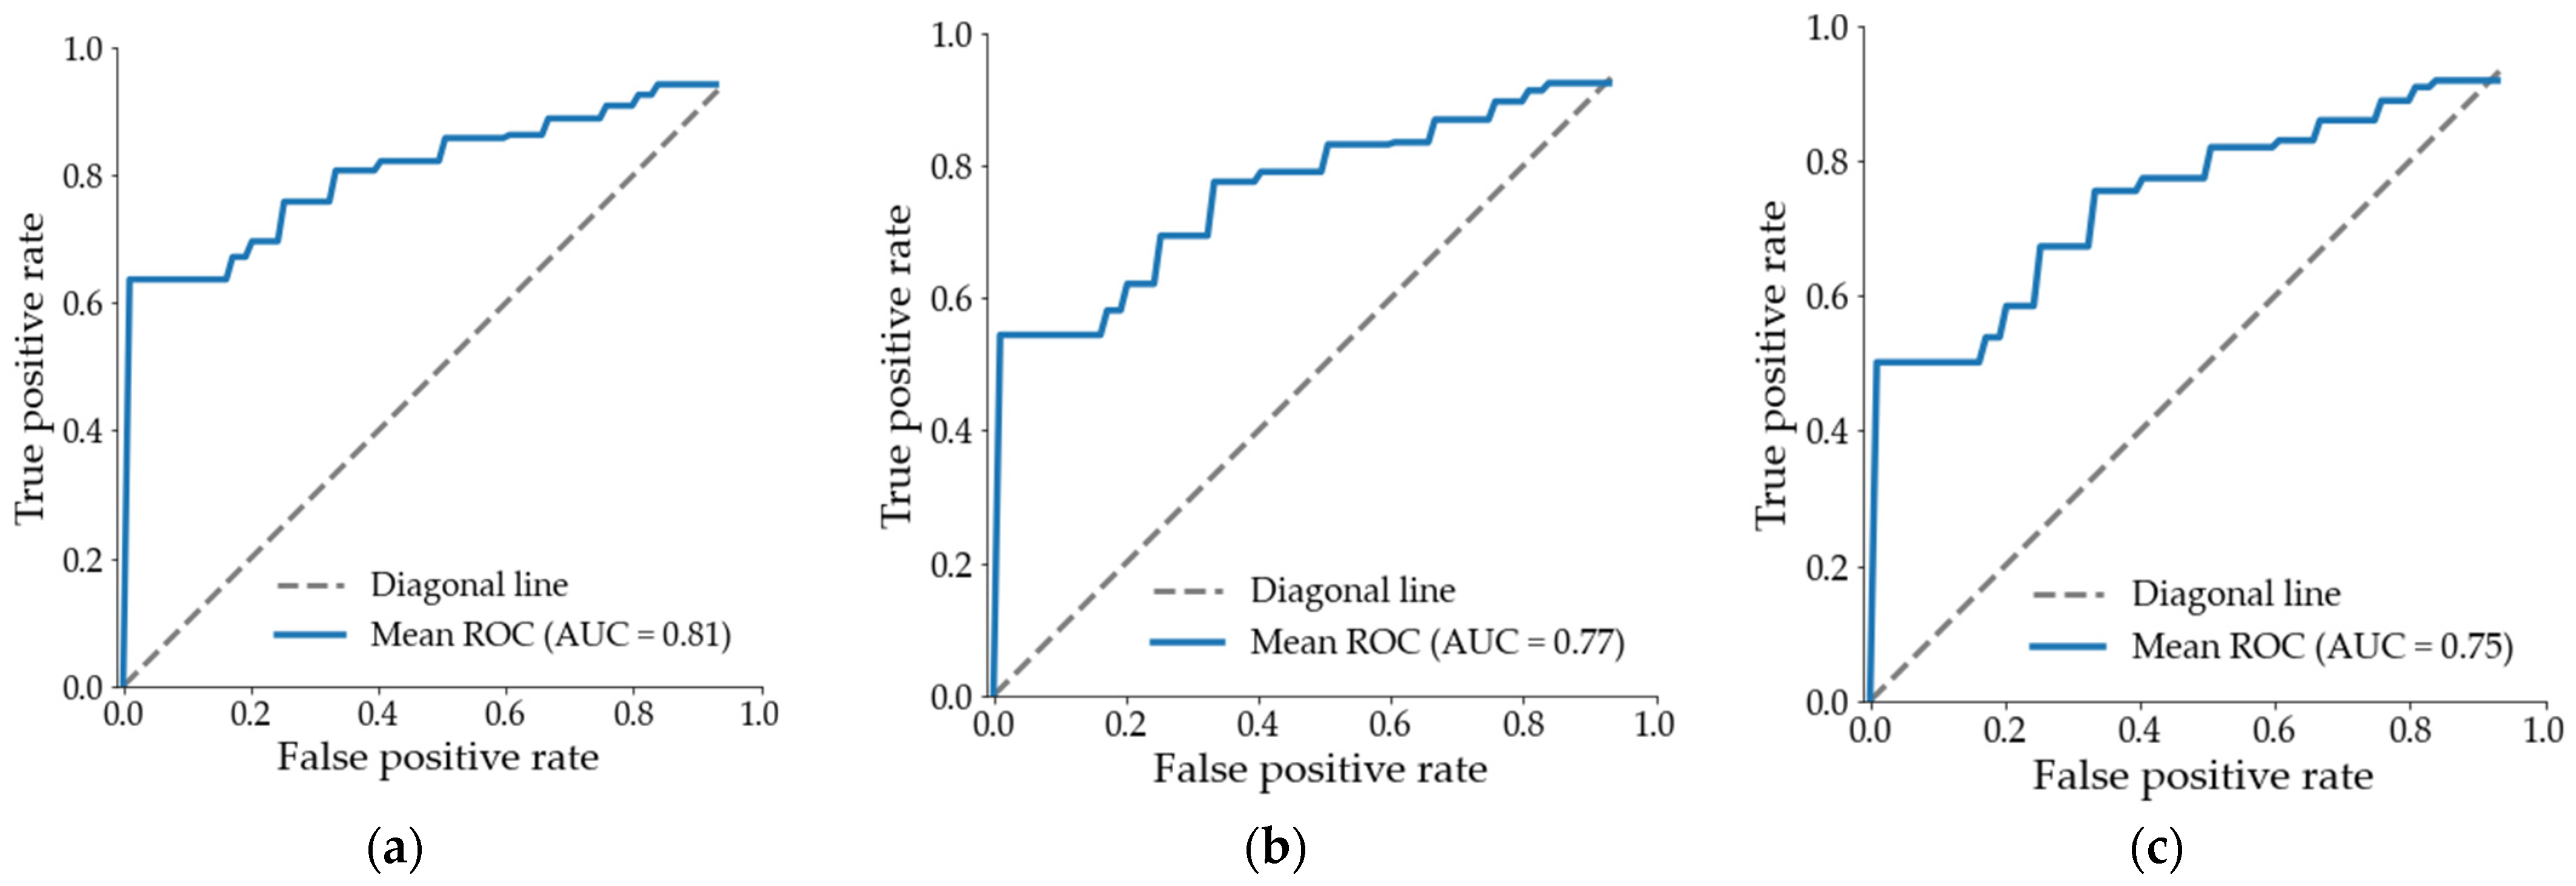
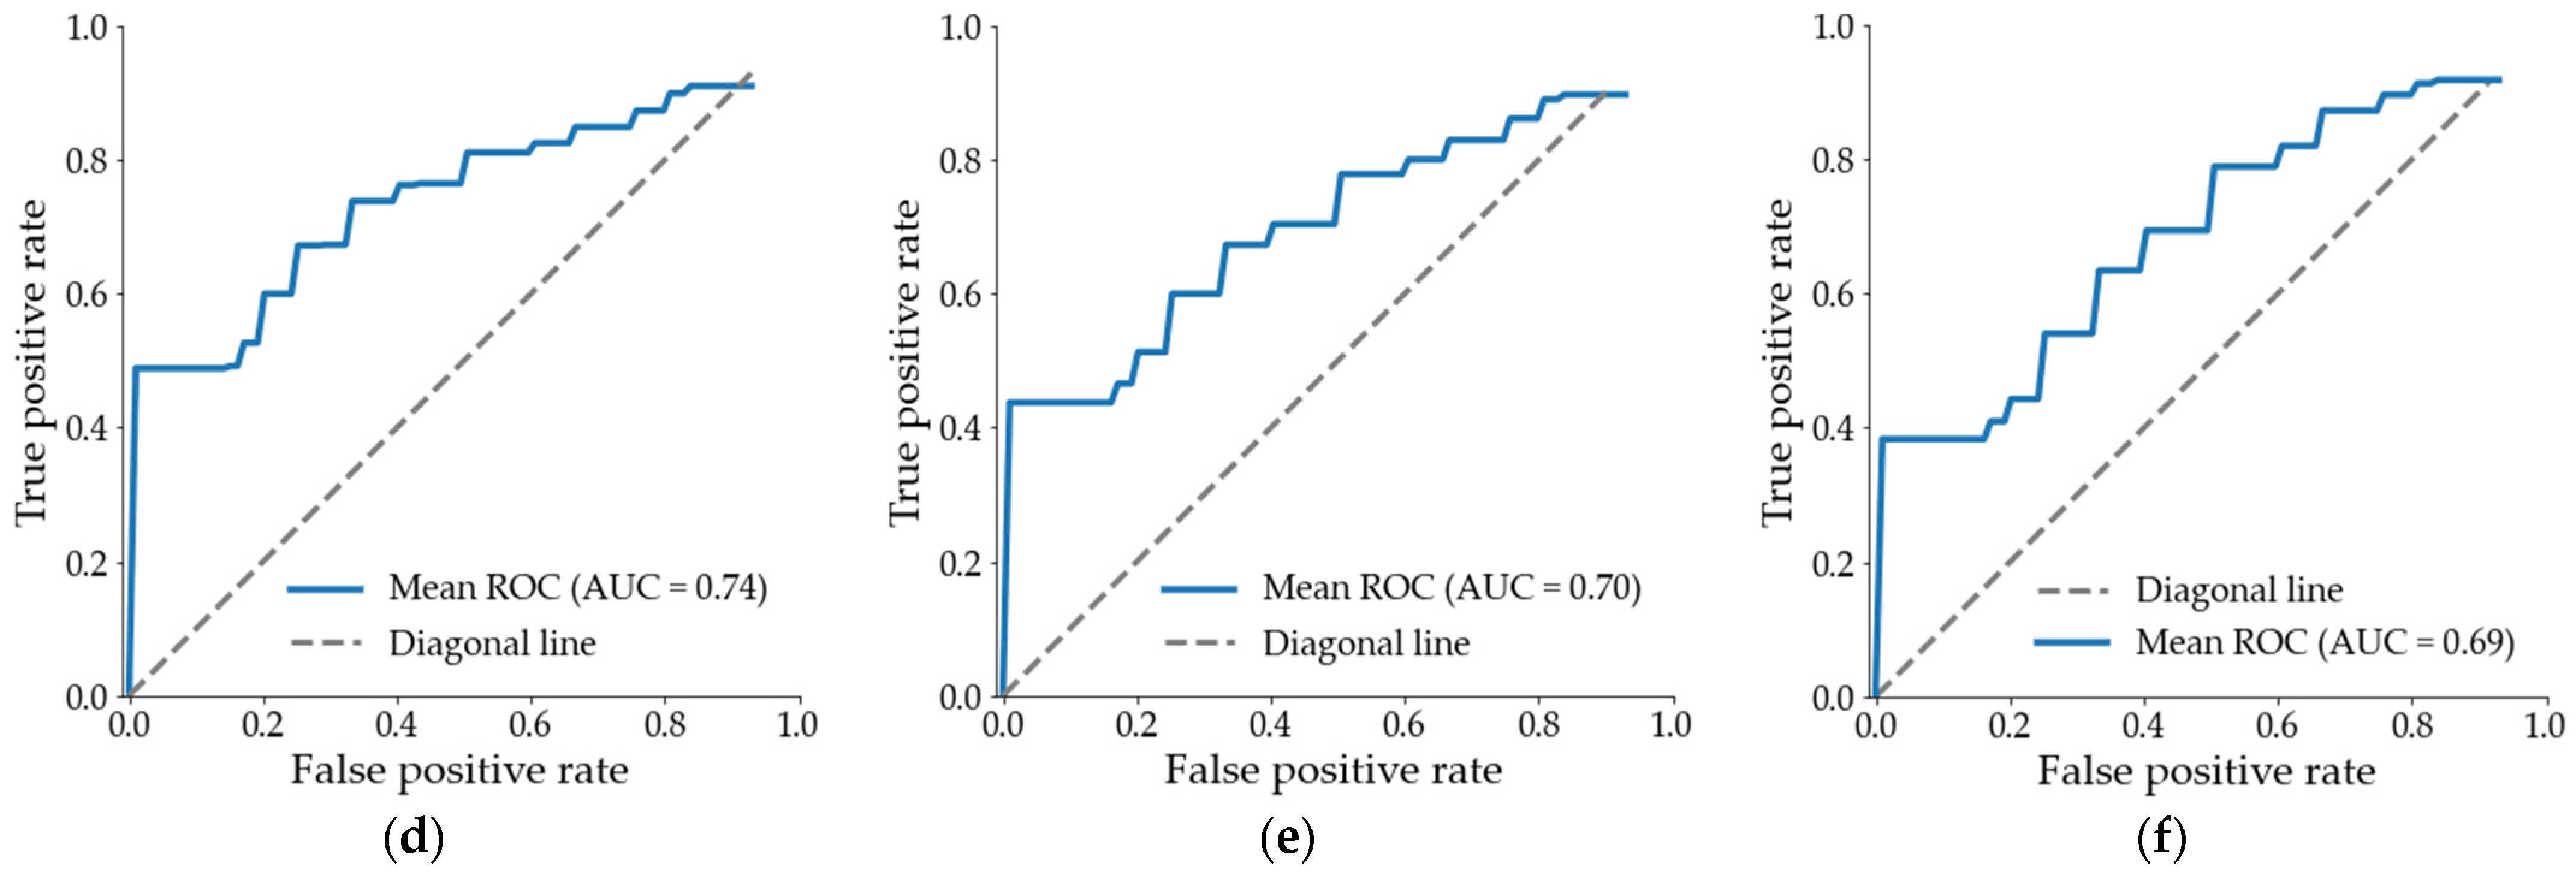
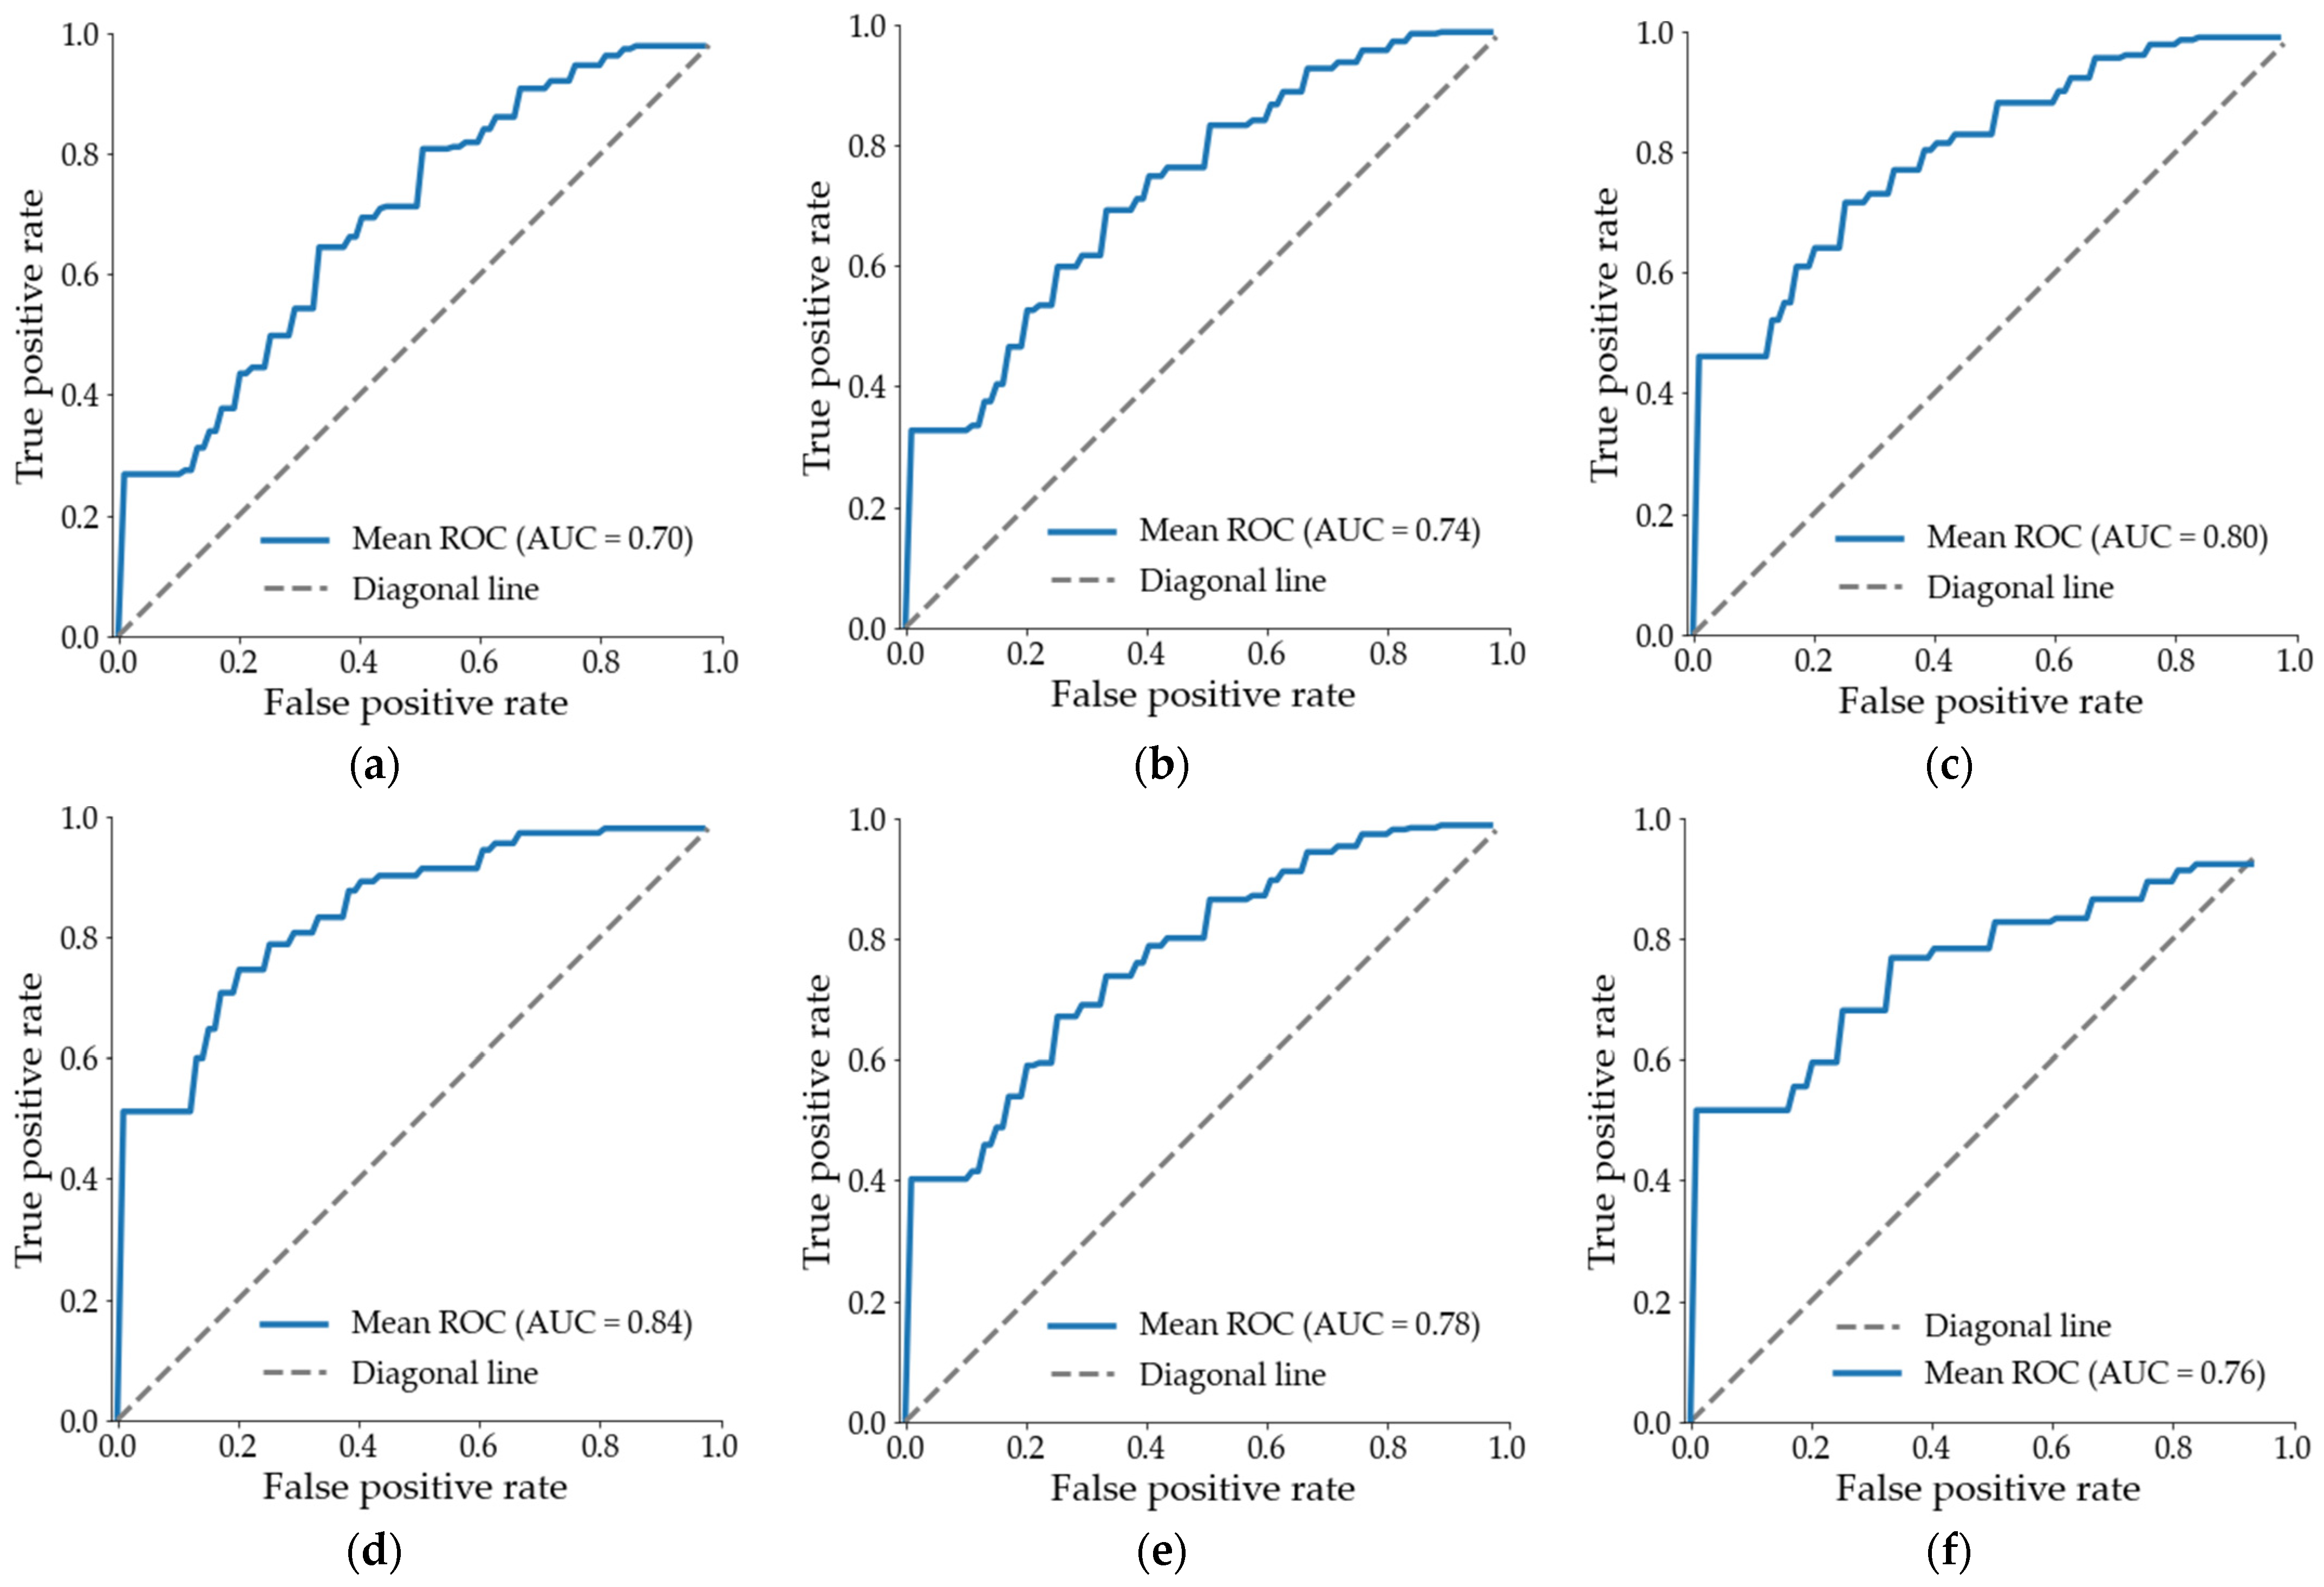
Moreover, the ROC curve was utilized to further estimate the generalization ability of the logistic model. The samples collected on May 3 and 8 were randomly divided into a training set and a test set 50 times. In the prediction results of each sample in a given test set, the posterior probability was selected as the threshold, the false positive rate (FPR = 1-TNP) and true positive rate (TPR) were calculated, and the results were averaged. The average ROC was obtained by analyzing the texture features extracted from different window sizes, and the AUC was calculated, as shown in Figure 10 and Figure 11. The results showed that the AUC was greater than 0.5, indicating that it was feasible to use the logistic model for FHB detection when considering the host conditions and spatial distribution of the disease, further the selected spectral and texture features could reflect the disease information. Furthermore, the AUC comparison results were consistent with the overall accuracy and F1 score values of the model, further confirming that the texture feature extracted from a window size of 5 × 5 pixels should be used on May 3, while a window size of 17 × 17 pixels was suitable on May 8.
4. Discussion
The main merit of our method is that the FHB area could be detected in the early and late stages by considering the differences in its spatial distribution patterns reflected by texture features extracted from different window sizes. Hyperspectral features including the PSRI, ARI, and Red-edge position were obtained. The bands sensitive to FHB including the 550, 670, 702, and 740 nm bands were selected for the texture feature calculations. Then, the selected spectral features and texture features extracted from different window sizes were used to train the logistic model. It was found that the model had the highest accuracies and generalization abilities when the window size was 5 × 5 pixels in the early stage of FHB, and when the window size was 17 × 17 pixels in the later stage.
The changes in pigment content, biomass and physiological structure caused by diseases may be reflected in changes in reflectance [8,46]. Wheat kernels, spikelets, or entire heads can be infected by Fusarium pathogens and then lose chlorophyll and become bleached [33,47]. Shahin et al. found that six wavebands, including the 484, 567, 684, 817, 900, and 950 nm bands can be utilized to detect FHB, and can achieve an accuracy similar to that obtained using the entire range of 450–950 nm [48]. In our study, the PSRI maximized the sensitivity of the ratio of carotenoids (such as α- and β-carotene) to chlorophyll [33]. The ARI is very sensitive to anthocyanins in leaves [34]. The Red-edge position is sensitive to the red-edge movement caused by changes in chlorophyll concentrations [35,36]. These three parameters are widely used to detect plant physiological stress, and they are related changes in crop pigments. Actually, as the FHB infection of wheat becomes more serious, the area of dry and white ears becomes increasingly large, resulting from changes in the water and pigment contents [49]. These changes also indicate that FHB will result in gray differences in some gray images of diseased fields, and the spatial distribution of FHB can be described by using texture features to describe the gray changes or differences [17,19].
Therefore, we adapted the GLCM to calculate texture features and study the gray level distribution of pairs of pixels. The method is a classic texture feature extraction method and is widely used to plant disease detections [50,51,52]. When applying the model, some researchers focus on the influence of different parameters of the GLCM on the detection results. Ye et al. used hyperspectral images to detect the bruised potatoes by calculating texture features based on the GLCM. To obtained the optimal parameters of the GLCM, they set different gray levels (L) and sliding step sizes (D), and the results showed that the best detection results were obtained when L was eight and D was eight; the accuracy reached 93.75% [22]. For high-spatial-resolution images, Guan et al. utilized texture features extracted from multispectral images captured by UAVs to detect maize lodging. The results showed that the optimal window size of the GLCM for lodging detection was 17, which was close to the measured area of single lodged maize, obtaining an average accuracy of 82.84% [30]. In our study area, the planting density and direction were uniform, while the size of the severely diseased area changed with FHB development. Therefore, the main parameter that contributed to the differences in texture features between slightly and severely diseased sites was the window size. A suitable window size for texture feature calculations can better illustrate the spatial distribution patterns in different stages and therefore provide more accurate and reliable detection results. Gray images were used to extract the mean, homogeneity, contrast, dissimilarity, and correlation of the GLCM results obtained with different window sizes. When inputting each group of features, we found that FHB can be more accurately detected by using a smaller window size in the early stage and a larger window size in the late stage, and higher accuracies were obtained when the window size was closer to the optimal window size. This result is consistent with the theory of the influence of the window size on the texture information when the GLCM is used [53].
However, there is still opportunity for improvement in our method. When selecting the spectral features, we considered the spectral characteristics of diseased plants in the grain-filling stage. According to Bauriegel et al., in the mid-grain stage, when the chlorophyll and water contents are still high, consideration of the visible range, especially the orange and red bands (600–750 nm), is helpful to detect FHB in wheat. In later stages of grain development, the near-infrared range, especially in the 1000–1400 nm wavelength range, has the potential to detect FHB in wheat [54]. Therefore, we will collect more data in our future work and try to select different spectral features, to realize accurate detection in different periods. Furthermore, feature selection played a critical role in spectral data mining. According to Kononenko, the Relief algorithm is susceptible to noise in the input dataset [55]. To screen out more universal spectral features, wrapper methods or embedded methods will be applied in the future [56]. Moreover, one of the drawbacks of the GLCM approach is the high dimensionality of the matrix, which results in the GLCM being very sensitive to the size of the utilized texture samples [20]. We will try more extraction methods and investigate the effectiveness of these texture features in FHB detection. Except for the host growth conditions and the spatial distribution of disease, numerous other elements that influence or reflect the occurrence of FHB cannot be ignored under certain circumstances. For instance, weather conditions are extremely crucial for FHB infection and development [57,58,59]. We have proven in our former study that meteorological conditions and the growth of crops comprehensively affect this disease [60]. In addition, different varieties of wheat will have diverse responses to the FHB stress, hence resulting in variances in their spectral features. In addition, mechanical operations, the use of chemical fertilizer and other treatments also affect the development of FHB. For example, nitrogen fertilization has been proven to influence FHB [61]. In our study area, no significant difference in these factors exist, and farmers manage crops according to the guidance provided by the local government. However, to extend our approach to a larger area, we will try to collect this information and give it full consideration in the future.
Different models have been applied to detect diseases, including support vector machines [17], random forests [7], linear discriminant analysis models [48], and AdaBoost classification models [18]. From the simple regression model to the complex deep learning model, the detection accuracies of these models are all higher than 80% when optimal features are input. In our study, the logistic model, a classic binary classification model, was used to obtain the distribution of severe FHB areas in the study area. Because collinearity between input features was eliminated as much as possible, the accuracy of the logistic model reached 0.9 when texture features were extracted from windows of optimal sizes and the F1 scores were above 0.8 in the two study periods. When the generalization ability of the logistic model was examined, the conclusion was similar, and when different texture features were input, the average overall accuracy of the five-fold cross-validation was approximately 0.7, while the AUC values also reached above 0.7, proving that the model can be applied for FHB detection. For the mapping results of the study area, we found that the larger the window from which texture features were extracted was, the less severe the FHB area was, regardless of whether the early or late stage was considered. Therefore, it is necessary to use texture features extracted from windows of different sizes in diverse periods. However, the temporal and spatial generalization abilities of our model remain to be verified, and further research with a deep learning model will be conducted to realize FHB real-time detection in different places and at different times [62].
5. Conclusions
For a disease occurring in the ears of crops, the severity of which can be detected through spectral features, and the spatial patterns of which can be reflected through texture features, we evaluated the effects of different window sizes from which texture features were extracted on FHB detection accuracies and results in different periods and obtained the optimal window sizes. The narrow-band spectral features, including the PSRI, ARI, and Red-edge position, reflected changes in the pigment contents of the studied crops due to FHB infection and thus reflected the situation of crops under disease stress. The texture features calculated from the sensitive single-band images reflected the similarity, contrast, uniformity, texture thickness and regularity of the gray-level distribution of a pair of windows. By inputting spectral features and texture features with different window sizes into the logistic model, the model was found to achieve the ideal accuracy and generalization ability. The performance of the logistic model reached the highest value when texture features were extracted from a window with an optimal size, with an accuracy, F1 score, average overall accuracy of a five-fold cross-validation, and AUC value of 0.90, 0.79, 0.804, and 0.81 on May 3, when the window size was 5 × 5 pixels, and of 0.90, 0.83, 0.823, and 0.84 on May 8 when the window size was 17 × 17 pixels. In addition, when the window size was closer to the optimal one, the accuracy was higher. Compared with traditional methods, this method improves the detection accuracy of wheat FHB. In addition, it provides a theoretical basis for disease detection using UAV hyperspectral remote sensing at the field scale. In the future research, more relevant factors will be considered, and the deep learning model will be used to better realize model migration at different times and places.
Author Contributions
Conceptualization, Y.D. and W.H.; methodology, Y.D. and Y.X.; software, Y.X.; validation, Y.D. and Y.X.; formal analysis, Y.D. and Y.X.; investigation, L.L. and H.M.; resources, Y.D. and W.H.; data curation, L.L. and H.M.; writing—original draft preparation, Y.X.; writing—review and editing, Y.D. and Y.X.; visualization, Y.X.; supervision, Y.D.; project administration, Y.D.; funding acquisition, Y.D. and W.H. All authors have read and agreed to the published version of the manuscript.
Funding
This research was funded by National Key R&D Program of China (2017YFE0122400), National Natural Science Foundation of China (42071423), National Natural Science Foundation of China (42071320), Beijing Nova Program of Science and Technology (Z191100001119089), and Youth Innovation Promotion Association CAS (2017085).
Conflicts of Interest
The authors declare no conflict of interest.
References
- Figueroa, M.; Hammond-Kosack, K.E.; Solomon, P.S. A review of wheat diseases-a field perspective. Mol. Plant Pathol. 2018, 19, 1523–1536. [Google Scholar] [CrossRef]
- Windels, C.E. Economic and Social Impacts of Fusarium Head Blight: Changing Farms and Rural Communities in the Northern Great Plains. Phytopathology 2000, 90, 17–21. [Google Scholar] [CrossRef] [Green Version]
- Dweba, C.C.; Figlan, S.; Shimelis, H.A.; Motaung, T.E.; Sydenham, S.; Mwadzingeni, L.; Tsilo, T.J. Fusarium head blight of wheat: Pathogenesis and control strategies. Crop Prot. 2017, 91, 114–122. [Google Scholar] [CrossRef]
- Zhang, N.; Pan, Y.; Feng, H.; Zhao, X.; Yang, X.; Ding, C.; Yang, G. Development of Fusarium head blight classification index using hyperspectral microscopy images of winter wheat spikelets. Biosyst. Eng. 2019, 186, 83–99. [Google Scholar] [CrossRef]
- Ma, H.; Huang, W.; Jing, Y.; Pignatti, S.; Laneve, G.; Dong, Y.; Ye, H.; Liu, L.; Guo, A.; Jiang, J. Identification of Fusarium Head Blight in Winter Wheat Ears Using Continuous Wavelet Analysis. Sensors 2019, 20, 20. [Google Scholar] [CrossRef] [PubMed] [Green Version]
- Zhang, J.; Pu, R.; Huang, W.; Yuan, L.; Luo, J.; Wang, J. Using in-situ hyperspectral data for detecting and discriminating yellow rust disease from nutrient stresses. Field Crops Res. 2012, 134, 165–174. [Google Scholar] [CrossRef]
- Chen, D.; Shi, Y.; Huang, W.; Zhang, J.; Wu, K. Mapping wheat rust based on high spatial resolution satellite imagery. Comput. Electron. Agric. 2018, 152, 109–116. [Google Scholar] [CrossRef]
- Simko, I.; Jimenez-Berni, J.A.; Sirault, X.R.R. Phenomic Approaches and Tools for Phytopathologists. Phytopathology 2017, 107, 6–17. [Google Scholar] [CrossRef] [Green Version]
- West, J.S.; Canning, G.G.; Perryman, S.A.; King, K. Novel Technologies for the detection of Fusarium head blight disease and airborne inoculum. Trop. Plant Pathol. 2017, 42, 203–209. [Google Scholar] [CrossRef] [Green Version]
- Guo, A.; Huang, W.; Dong, Y.; Ye, H.; Ma, H.; Liu, B.; Wu, W.; Ren, Y.; Ruan, C.; Geng, Y. Wheat Yellow Rust Detection Using UAV-Based Hyperspectral Technology. Remote Sens. 2021, 13, 123. [Google Scholar] [CrossRef]
- Ye, H.; Huang, W.; Huang, S.; Cui, B.; Dong, Y.; Guo, A.; Ren, Y.; Jin, Y. Recognition of banana fusarium wilt based on UAV remote sensing. Remote Sens. 2020, 12, 938. [Google Scholar] [CrossRef] [Green Version]
- Jain, A.K.; Murty, M.N.; Flynn, P.J. Data clustering: A review. ACM Comput. Surv. 1999, 31, 264–323. [Google Scholar] [CrossRef]
- Sandhu, G.K.; Kaur, R. Plant Disease Detection Techniques: A Review. In Proceedings of the 2019 International Conference on Automation, Computational and Technology Management (ICACTM), London, UK, 24–26 April 2019; Institute of Electrical and Electronics Engineers (IEEE): New York, NY, USA, 2019; pp. 34–38. [Google Scholar]
- Patil, P.; Yaligar, N.; Meena, S. Comparison of Performance of Classifiers—SVM, RF and ANN in Potato Blight Disease Detection Using Leaf Images. In Proceedings of the 2017 IEEE International Conference on Computational Intelligence and Computing Research (ICCIC), Tamil Nadu, India, 14–16 December 2017; Institute of Electrical and Electronics Engineers (IEEE): New York, NY, USA, 2017; pp. 1–5. [Google Scholar]
- Prajapati, H.B.; Shah, J.P.; Dabhi, V.K. Detection and classification of rice plant diseases. Intell. Decis. Technol. 2017, 11, 357–373. [Google Scholar] [CrossRef]
- Huang, H.; Deng, J.; Lan, Y.; Yang, A.; Zhang, L.; Wen, S.; Zhang, H.; Zhang, Y.; Deng, Y. Detection of Helminthosporium Leaf Blotch Disease Based on UAV Imagery. Appl. Sci. 2019, 9, 558. [Google Scholar] [CrossRef] [Green Version]
- Huang, L.; Li, T.; Ding, C.; Zhao, J.; Zhang, D.; Yang, G. Diagnosis of the Severity of Fusarium Head Blight of Wheat Ears on the Basis of Image and Spectral Feature Fusion. Sensors 2020, 20, 2887. [Google Scholar] [CrossRef] [PubMed]
- Xie, C.; He, Y. Spectrum and Image Texture Features Analysis for Early Blight Disease Detection on Eggplant Leaves. Sensors 2016, 16, 676. [Google Scholar] [CrossRef] [Green Version]
- Guo, A.; Huang, W.; Ye, H.; Dong, Y.; Ma, H.; Ren, Y.; Ruan, C. Identification of Wheat Yellow Rust Using Spectral and Texture Features of Hyperspectral Images. Remote Sens. 2020, 12, 1419. [Google Scholar] [CrossRef]
- Humeau-Heurtier, A. Texture Feature Extraction Methods: A Survey. IEEE Access 2019, 7, 8975–9000. [Google Scholar] [CrossRef]
- Singh, S.; Srivastava, D.; Agarwal, S. GLCM and its application in pattern recognition. In Proceedings of the 2017 5th International Symposium on Computational and Business Intelligence (ISCBI), Dubai, United Arab Emirates, 11–14 August 2017; IEEE Publishing: New York, NY, USA, 2017; pp. 20–25. [Google Scholar]
- Ye, D.; Sun, L.; Yang, Z.; Che, W.; Tan, W. Determination of bruised potatoes by GLCM based on hyperspectral imaging technique. In Proceedings of the 2017 International Conference on Service Systems and Service Management, Dalian, China, 16–18 June 2017; Institute of Electrical and Electronics Engineers (IEEE): New York, NY, USA, 2017; pp. 1–6. [Google Scholar]
- Spolti, P.; Shah, D.A.; Fernandes, J.M.C.; Bergstrom, G.C.; Del Ponte, E.M. Disease Risk, Spatial Patterns, and Incidence-Severity Relationships of Fusarium Head Blight in No-till Spring Wheat Following Maize or Soybean. Plant Dis. 2015, 99, 1360–1366. [Google Scholar] [CrossRef]
- Del Ponte, E.M.; Shah, D.A.; Bergstrom, G.C. Spatial Patterns of Fusarium Head Blight in New York Wheat Fields Suggest Role of Airborne Inoculum. Plant Health Prog. 2003, 4, 6. [Google Scholar] [CrossRef] [Green Version]
- Aghav, A.S.; Narkhede, P.J.I.J.E.T. Application-oriented approach to texture feature extraction using grey level Co-occurrence matrix (GLCM). Int. Res. J. Eng. Technol. 2017, 4, 3498–3503. [Google Scholar]
- Zhou, J.; Guo, R.Y.; Sun, M.; Di, T.T.; Wang, S.; Zhai, J.; Zhao, Z. The Effects of GLCM parameters on LAI estimation using texture values from Quickbird Satellite Imagery. Sci. Rep. 2017, 7, 1–12. [Google Scholar] [CrossRef]
- Franklin, S.E.; Wulder, M.A.; Lavigne, M.B. Automated derivation of geographic window sizes for use in remote sensing digital image texture analysis. Comput. Geosci. 1996, 22, 665–673. [Google Scholar] [CrossRef]
- He, D.C.; Wang, L. Texture unit, texture spectrum, and texture analysis. IEEE Trans. Geosci. Remote Sens. 1990, 28, 509–512. [Google Scholar]
- Lan, Z.; Liu, Y. Study on multi-scale window determination for GLCM texture description in high-resolution remote sensing image geo-analysis supported by GIS and domain knowledge. ISPRS Int. J. Geo-Informat. 2018, 7, 175. [Google Scholar] [CrossRef] [Green Version]
- Guan, H.; Liu, H.; Meng, X.; Luo, C.; Bao, Y.; Ma, Y.; Yu, Z.; Zhang, X. A Quantitative Monitoring Method for Determining Maize Lodging in Different Growth Stages. Remote Sens. 2020, 12, 3149. [Google Scholar] [CrossRef]
- Koch, H.-J.; Pringas, C.; Maerlaender, B. Evaluation of environmental and management effects on Fusarium head blight infection and deoxynivalenol concentration in the grain of winter wheat. Eur. J. Agron. 2006, 24, 357–366. [Google Scholar] [CrossRef]
- Zhang, J.; Huang, Y.; Pu, R. Monitoring plant diseases and pests through remote sensing technology: A review. Comput. Electron. Agric. 2019, 165, 104943. [Google Scholar] [CrossRef]
- Mahlein, A.K. Plant Disease Detection by Imaging Sensors—Parallels and Specific Demands for Precision Agriculture and Plant Phenotyping. Plant Dis. 2016, 100, 241–251. [Google Scholar] [CrossRef] [PubMed] [Green Version]
- Zheng, Q.; Huang, W.; Cui, X.; Dong, Y.; Shi, Y.; Ma, H.; Liu, L. Identification of wheat yellow rust using optimal three-band spectral indices in different growth stages. Sensors 2019, 19, 35. [Google Scholar] [CrossRef] [Green Version]
- Filella, I.; Penuelas, J. The red edge position and shape as indicators of plant chlorophyll content, biomass and hydric status. Int. J. Remote Sens. 1994, 15, 1459–1470. [Google Scholar] [CrossRef]
- Fu, Y.; Yang, G.; Wang, J.; Song, X.; Feng, H. Winter wheat biomass estimation based on spectral indices, band depth analysis and partial least squares regression using hyperspectral measurements. Comput. Electron. Agric. 2014, 100, 51–59. [Google Scholar] [CrossRef]
- Bannari, A.; Morin, D.; Bonn, F.; Huete, A.R. A review of vegetation indices. Remote Sens. Rev. 1995, 13, 95–120. [Google Scholar] [CrossRef]
- Xue, J.; Su, J. Significant remote sensing vegetation indices: A review of developments and applications. J. Sens. 2017, 1, 1–17. [Google Scholar] [CrossRef] [Green Version]
- Kendall, M.G. Rank Correlation Methods, 4th ed.; Griffin: London, UK, 1948. [Google Scholar]
- Kira, K.; Rendell, L.A. The feature selection problem: Traditional methods and a new algorithm. In Proceedings of the AAAI’1992 10th National Conference on Artificial Intelligence, San Jose, CA, USA, 12–16 July 1992; AAAI Press: Menlo Park, CA, USA, 1992; pp. 129–134. [Google Scholar]
- Haralick, R.M.; Shanmugam, K.; Dinstein, I.H. Textural features for image classification. IEEE Trans. Syst. Man Cybern. 1973, 6, 610–621. [Google Scholar] [CrossRef] [Green Version]
- Prabhakar, M.; Prasad, Y.G.; Desai, S.; Thirupathi, M.; Gopika, K.; Rao, G.R.; Venkateswarlu, B. Hyperspectral remote sensing of yellow mosaic severity and associated pigment losses in Vigna mungo using multinomial logistic regression models. Crop Prot. 2013, 45, 132–140. [Google Scholar] [CrossRef]
- Hosmer, D.W., Jr.; Lemeshow, S.; Sturdivant, R.X. Applied Logistic Regression; John Wiley & Sons: Hoboken, NJ, USA, 2013; Volume 398. [Google Scholar]
- Visa, S.; Ramsay, B.; Ralescu, A.L.; Van Der Knaap, E. Confusion Matrix-based Feature Selection. MAICS 2011, 710, 120–127. [Google Scholar]
- Hripcsak, G.; Rothschild, A.S. Agreement, the f-measure, and reliability in information retrieval. J. Am. Med. Inform. Associat. 2005, 12, 296–298. [Google Scholar] [CrossRef]
- Hanley, J.A.; McNeil, B.J. The meaning and use of the area under a receiver operating characteristic (ROC) curve. Radiology 1982, 143, 29–36. [Google Scholar] [CrossRef] [PubMed] [Green Version]
- Fernando, W.D.; Oghenekaro, A.O.; Tucker, J.R.; Badea, A. Building on a foundation: Advances in epidemiology, resistance breeding, and forecasting research for reducing the impact of fusarium head blight in wheat and barley. Can. J. Plant Pathol. 2021, 1–32. [Google Scholar] [CrossRef]
- Shahin, M.A.; Symons, S.J. Detection of Fusarium damaged kernels in Canada Western Red Spring wheat using visible/near-infrared hyperspectral imaging and principal component analysis. Comput. Electron. Agric. 2011, 75, 107–112. [Google Scholar] [CrossRef]
- Torres, A.M.; Palacios, S.A.; Yerkovich, N.; Palazzini, J.M.; Battilani, P.; Leslie, J.F.; Logrieco, A.F.; Chulze, S.N. Fusarium head blight and mycotoxins in wheat: Prevention and control strategies across the food chain. World Mycotoxin J. 2019, 12, 333–355. [Google Scholar] [CrossRef]
- Han, L.; Haleem, M.S.; Taylor, M. Automatic Detection and Severity Assessment of Crop Diseases Using Image Pattern Recognition. In Econometrics for Financial Applications; Springer Science and Business Media LLC: Berlin, Germany, 2016; pp. 283–300. [Google Scholar]
- Waqas, M.; Fukushima, N. Comparison of Image Features Descriptions for Diagnosis of Leaf Diseases. In Proceedings of the 2020 Asia-Pacific Signal and Information Processing Association Annual Summit and Conference (APSIPA ASC), Virtual Conference, Auckland, New Zealand, 7–10 December 2020; IEEE Publishing: Piscataway, NJ, USA, 2020; pp. 934–938. [Google Scholar]
- Das, S.; Sengupta, S. Feature Extraction and Disease Prediction from Paddy Crops Using Data Mining Techniques. In Advances in Intelligent Systems and Computing; Springer Science and Business Media LLC: New York, NY, USA, 2020; pp. 155–163. [Google Scholar]
- Puissant, A.; Hirsch, J.; Weber, C. The utility of texture analysis to improve per-pixel classification for high to very high spatial resolution imagery. Int. J. Remote Sens. 2005, 26, 733–745. [Google Scholar] [CrossRef]
- Bauriegel, E.; Herppich, W.B. Hyperspectral and Chlorophyll Fluorescence Imaging for Early Detection of Plant Diseases, with Special Reference to Fusarium spec. Infections on Wheat. Agriculture 2014, 4, 32–57. [Google Scholar] [CrossRef] [Green Version]
- Kononenko, I. Estimating Attributes: Analysis and Extensions of RELIEF. In European Conference on Machine Learning; Springer: Berlin, Germany, 1994; pp. 171–182. [Google Scholar]
- Urbanowicz, R.J.; Meeker, M.; La Cava, W.; Olson, R.S.; Moore, J.H. Relief-based feature selection: Introduction and review. J. Biomed. Inform. 2018, 85, 189–203. [Google Scholar] [CrossRef] [PubMed]
- El Jarroudi, M.; Kouadio, L.; El Jarroudi, M.; Junk, J.; Bock, C.; Diouf, A.A.; Delfosse, P. Improving fungal disease forecasts in winter wheat: A critical role of intra-day variations of meteorological conditions in the development of Septoria leaf blotch. Field Crops Res. 2017, 213, 12–20. [Google Scholar] [CrossRef]
- Gilbert, J.; Haber, S. Overview of some recent research developments in fusarium head blight of wheat. Can. J. Plant Pathol. 2013, 35, 149–174. [Google Scholar] [CrossRef]
- Shah, D.A.; De Wolf, E.D.; Paul, P.A.; Madden, L.V. Functional Data Analysis of Weather Variables Linked to Fusarium Head Blight Epidemics in the United States. Phytopathology 2019, 109, 96–110. [Google Scholar] [CrossRef] [Green Version]
- Xiao, Y.; Dong, Y.; Huang, W.; Liu, L.; Ma, H.; Ye, H.; Wang, K. Dynamic Remote Sensing Prediction for Wheat Fusarium Head Blight by Combining Host and Habitat Conditions. Remote Sens. 2020, 12, 3046. [Google Scholar] [CrossRef]
- Hofer, K.; Barmeier, G.; Schmidhalter, U.; Habler, K.; Rychlik, M.; Hückelhoven, R.; Hess, M. Effect of nitrogen fertilization on Fusarium head blight in spring barley. Crop Prot. 2016, 88, 18–27. [Google Scholar] [CrossRef]
- Golhani, K.; Balasundram, S.K.; Vadamalai, G.; Pradhan, B. A review of neural networks in plant disease detection using hyperspectral data. Inf. Process. Agric. 2018, 5, 354–371. [Google Scholar] [CrossRef]
Figure 1.
Location of the study area and samples. The red rectangle in the map on the top right marks the boundary of the experimental field. The center-right map is a UAV multispectral image captured on May 5th. The photo on the bottom right shows the range of the sample.
Figure 1.
Location of the study area and samples. The red rectangle in the map on the top right marks the boundary of the experimental field. The center-right map is a UAV multispectral image captured on May 5th. The photo on the bottom right shows the range of the sample.

Figure 2.
Methodological framework. A portion of the image material comes from Giannoni et al. (https://www.nireos.com, accessed on 20 December 2018).
Figure 2.
Methodological framework. A portion of the image material comes from Giannoni et al. (https://www.nireos.com, accessed on 20 December 2018).

Figure 3.
The relief weights of the spectral indices in the severely and slightly diseased categories. The height of each bar is the actual weight of the corresponding index, and the accumulated weight is denoted by the top of the bar.
Figure 3.
The relief weights of the spectral indices in the severely and slightly diseased categories. The height of each bar is the actual weight of the corresponding index, and the accumulated weight is denoted by the top of the bar.

Figure 4.
Kendall results among the spectral indices and between each spectral index and disease rate (the last line). The middle part is the Kendall correlation coefficient between the spectral indices of the corresponding row and column. The Kendall and T-test results for the disease rate and each spectral index in the corresponding column are shown in the last row, in which “*” corresponds to the 90% confidence interval and “**” corresponds to the 95% confidence interval.

Figure 5.
Kendall correlation coefficients between the PC1s of texture features and the disease rates on May 3 (a) and May 8 (b).
Figure 5.
Kendall correlation coefficients between the PC1s of texture features and the disease rates on May 3 (a) and May 8 (b).

Figure 6.
The average values and a box map of the model accuracies. Obtained utilizing only spectral features (the leftmost) and combined spectral features and texture features in windows of different sizes (right), on May 3 (a) and May 8 (b).
Figure 6.
The average values and a box map of the model accuracies. Obtained utilizing only spectral features (the leftmost) and combined spectral features and texture features in windows of different sizes (right), on May 3 (a) and May 8 (b).

Figure 7.
Severely diseased area detection performed by using selected spectral features and the texture features in the optimal window size. (a) The results on May 3, when the optimal window size was 5 × 5 pixels; (b) the results on May 8, when the optimal window size was 17 × 17 pixels.
Figure 7.
Severely diseased area detection performed by using selected spectral features and the texture features in the optimal window size. (a) The results on May 3, when the optimal window size was 5 × 5 pixels; (b) the results on May 8, when the optimal window size was 17 × 17 pixels.

Figure 8.
Detection results on May 3 (a) window size = 5 × 5, (b) window size = 9 × 9, (c) window size = 13 × 13, (d) window size = 17 × 17, (e) window size = 21 × 21, and (f) window size = 25 × 25.
Figure 8.
Detection results on May 3 (a) window size = 5 × 5, (b) window size = 9 × 9, (c) window size = 13 × 13, (d) window size = 17 × 17, (e) window size = 21 × 21, and (f) window size = 25 × 25.


Figure 9.
Detection results on May 8 (a) window size = 5 × 5, (b) window size = 9 × 9, (c) window size = 13 × 13, (d) window size = 17 × 17, (e) window size = 21 × 21, and (f) window size = 25 × 25.
Figure 9.
Detection results on May 8 (a) window size = 5 × 5, (b) window size = 9 × 9, (c) window size = 13 × 13, (d) window size = 17 × 17, (e) window size = 21 × 21, and (f) window size = 25 × 25.

Figure 10.
The average ROCs of the logistic models on May 3. (a–f) The average ROCs of models with spectral features and texture features extracted from window sizes of 5 × 5, 9 × 9, 13 × 13, 17 × 17, 21 × 21, and 25 × 25 pixels.
Figure 10.
The average ROCs of the logistic models on May 3. (a–f) The average ROCs of models with spectral features and texture features extracted from window sizes of 5 × 5, 9 × 9, 13 × 13, 17 × 17, 21 × 21, and 25 × 25 pixels.


Figure 11.
The average ROCs of logistic models on May 8. (a–f) The average ROCs of models with spectral features and texture features extracted from window sizes of 5 × 5, 9 × 9, 13 × 13, 17 × 17, 21 × 21, and 25 × 25 pixels.
Figure 11.
The average ROCs of logistic models on May 8. (a–f) The average ROCs of models with spectral features and texture features extracted from window sizes of 5 × 5, 9 × 9, 13 × 13, 17 × 17, 21 × 21, and 25 × 25 pixels.


Table 1.
The basic composition of the confusion matrix.
| Predicted Class | |||
|---|---|---|---|
| Severely Diseased | Slightly Diseased | ||
| Actual Class | Severely Diseased | True Positive (TP) | False Negative (FN) |
| Slightly Diseased | False Positive (FP) | True Negative (TN) | |
Derivations: , .
Table 2.
Sensitive spectral features.
| Spectral Features | Formulation | Correlation |
|---|---|---|
| PSRI | Plant stress | |
| ARI | Anthocyanin | |
| Red-edge position | Pigment |
R500, R550, R670, R700, R740, R750, and R780 correspond to the reflectance of the subscript wavelength.
Table 3.
Overall accuracy (OA), F1-score (F1), and average OA values obtained in the five-fold cross-validation (AA_5) of the two models on different dates.
Table 3.
Overall accuracy (OA), F1-score (F1), and average OA values obtained in the five-fold cross-validation (AA_5) of the two models on different dates.
| Date | Index Type | Window Size | |||||
|---|---|---|---|---|---|---|---|
| 5 | 9 | 13 | 17 | 21 | 25 | ||
| May 3rd | OA | 0.90 | 0.90 | 0.81 | 0.73 | 0.73 | 0.63 |
| F1 | 0.79 | 0.74 | 0.70 | 0.70 | 0.65 | 0.55 | |
| AA_5 | 0.804 | 0.789 | 0.730 | 0.723 | 0.699 | 0.679 | |
| May 8th | OA | 0.81 | 0.73 | 0.90 | 0.90 | 0.90 | 0.73 |
| F1 | 0.74 | 0.70 | 0.79 | 0.83 | 0.79 | 0.70 | |
| AA_5 | 0.774 | 0.767 | 0.806 | 0.823 | 0.783 | 0.745 | |
Publisher’s Note: MDPI stays neutral with regard to jurisdictional claims in published maps and institutional affiliations. |
© 2021 by the authors. Licensee MDPI, Basel, Switzerland. This article is an open access article distributed under the terms and conditions of the Creative Commons Attribution (CC BY) license (https://creativecommons.org/licenses/by/4.0/).
Share and Cite
MDPI and ACS Style
Xiao, Y.; Dong, Y.; Huang, W.; Liu, L.; Ma, H. Wheat Fusarium Head Blight Detection Using UAV-Based Spectral and Texture Features in Optimal Window Size. Remote Sens. 2021, 13, 2437. https://doi.org/10.3390/rs13132437
AMA Style
Xiao Y, Dong Y, Huang W, Liu L, Ma H. Wheat Fusarium Head Blight Detection Using UAV-Based Spectral and Texture Features in Optimal Window Size. Remote Sensing. 2021; 13(13):2437. https://doi.org/10.3390/rs13132437
Chicago/Turabian StyleXiao, Yingxin, Yingying Dong, Wenjiang Huang, Linyi Liu, and Huiqin Ma. 2021. "Wheat Fusarium Head Blight Detection Using UAV-Based Spectral and Texture Features in Optimal Window Size" Remote Sensing 13, no. 13: 2437. https://doi.org/10.3390/rs13132437
Note that from the first issue of 2016, this journal uses article numbers instead of page numbers. See further details here.