A Novel Estimation of Unobserved Pig Growth Traits for the Purposes of Precision Feeding Methods
 Maciej M. Misiura1*
  Joao A. N. Filipe
 Ilias Kyriazakis
- 1Newcastle University, Newcastle upon Tyne, United Kingdom
- 2Biomathematics & Statistics Scotland, Rowett Institute of Nutrition and Health, University of Aberdeen, Aberdeen, United Kingdom
- 3Biological Sciences Building, Queen's University Belfast, Belfast, United Kingdom
Recent technological advances make it possible to deliver feeding strategies that can be tailored to the needs of individual pigs in order to optimise the allocation of nutrient resources and contribute toward reducing excess nutrient excretion. However, these efforts are currently hampered by the challenges associated with: (1) estimation of unobserved traits from the available data on bodyweight and feed consumption; and (2) characterisation of the distributions and correlations of these unobserved traits to generate accurate estimates of individual level variation among pigs. Here, alternative quantitative approaches to these challenges, based on the principles of inverse modelling and separately inferring individual level distributions within a Bayesian context were developed and incorporated in a proposed precision feeding modelling framework. The objectives were to: (i) determine the average and distribution of individual traits characterising growth potential and body composition in an empirical population of growing-finishing barrows and gilts; (ii) simulate the growth and excretion of nitrogen and phosphorus of the average pig offered either a commercial two-phase feeding plan, or a precision feeding plan with daily adjustments; and (iii) simulate the growth and excretion of nitrogen and phosphorus across the pig population under two scenarios: a two-phase feeding plan formulated to meet the nutrient requirements of the average pig or a precision feeding plan with daily adjustments for each and every animal in the population. The distributions of mature bodyweight and ratio of lipid to protein weights at maturity had median (IQR) values of 203 (47.8) kg and 2.23 (0.814) kg/kg, respectively; these estimates were obtained without any prior assumptions concerning correlations between the traits. Overall, it was found that a proposed precision feeding strategy could result in considerable reductions in excretion of nitrogen and phosphorus (average pig: 8.07 and 9.17% reduction, respectively; heterogenous pig population: 22.5 and 22.9% reduction, respectively) during the growing-finishing period from 35 to 120 kg bodyweight. This precision feeding modelling framework is anticipated to be a starting point toward more accurate estimation of individual level nutrient requirements, with the general aim of improving the economic and environmental sustainability of future pig production systems.
Introduction
To address economic and environmental concerns about standard feeding practises in commercial pig production (1–3), precision feeding strategies have been suggested as a way forward (4–6). Precision feeding strategies aim to accurately match nutrient supply to the demand of animals by formulating feeds that account for the dynamic changes in nutrient requirements, preferably at the individual level (7, 8). This is in contrast to standard feeding practises, which typically neglect variation in nutrient requirements among individuals, as they involve formulating feeds that satisfy the estimated nutrient requirements of a nominal average pig in a population, at a given static reference point specified by bodyweight (BW) or age (9). Initial evaluations of precision feeding strategies against standard population level feeding regimes in growing-finishing pigs have been encouraging based on reports of considerable reduction in excretion of nitrogen (N) and phosphorus (P), without any apparent loss in growth performance (10–12).
A successful implementation of precision feeding requires the development of methods for estimating the nutrient requirements of individual pigs, which in turn requires estimating their growth potential and body composition. There are notable issues associated with this challenge, which concern: (1) estimation of unobserved traits from data; and (2) characterisation of the distributions and correlations of these unobserved traits. Regarding the first issue, while body composition is a major determinant of nutrient requirements, real-time data on e.g., protein or lipid retention are either rare or unavailable due to technological and logistical limitations (13–15), and consist of tissue scan proxies with limited correlation to body amounts (16). Consequently, these traits are often estimated from data on BW and feed consumption by making assumptions whose validity could be restrictive. This limits the ability to formulate optimal feeding rations. For example, a typical approach to obtain information on lean tissue growth and requirements for precision feeding of growing pigs assumes an isometric relationship relating protein retention and BW gain, and that the isometric parameters are the same across pigs (5). However, this approach neglects individual variation in protein growth among animals as well as the non-proportionality between these variables during growth (17, 18). Alternative models, including a polynomial regression relating body protein weight to BW have been recently developed (19), but their validity is still largely unascertained.
Regarding the issue of the distributions and correlations of the unobserved traits of individuals, a typical approach relies on an explicit specification of their multivariate distribution (20–26). Within this setting, it is necessary to either assume or estimate multiple mean and variance-covariance parameters from data, which carries uncertainty (27) and can be challenging in practise (9). To avoid these challenges, a potential alternative approach to model trait variation, based on separately inferring individual level distributions within a Bayesian framework, has been recently suggested by Filipe and Kyriazakis (27). This framework is yet to be comprehensively tested in the context of the estimation of traits that are typically required for precision feeding purposes.
The aims of this chapter were to develop alternative data-driven approaches to estimate uncertain traits in individual pigs and incorporate this information in a proposed precision feeding modelling framework. This modelling framework was applied to evaluate feeding strategies in their effectiveness to minimise excess excretion of N and P when compared to standard feeding practises. These evaluations were conducted by considering the average of the individual responses in a population and the response of the average pig in the population, to gain a better insight into possible impacts of phenotypic heterogeneity on nutrient excretion. The specific objectives were to: (1) determine the empirical average and distribution of individual traits characterising growth potential and body composition in a pig population; (2) simulate the growth and excretion of N and P of the average pig offered either a commercial two-phase feeding plan, or a precision feeding plan with daily adjustments; and (3) simulate the growth and excretion of N and P across the pig population under two scenarios: a two-phase feeding plan formulated to meet the nutrient requirements of the average pig or a precision feeding plan with daily adjustments for each and every animal in the population.
Materials and Methods
There was no requirement for ethical approval, since the data used originated from a previous experiment, which was granted ethical approval on behalf of the original trial investigators.
Data
Empirical sequential data on individual daily feed intake DFIt (kg/d) and BWt (kg), at ages t (d), of 32 barrows and gilts [(Large White × Landrace) × Pietrain] were obtained from a trial conducted by the INRAE at the UE3P unit (Pig Physiology and Phenotyping Experimental Facility, https://doi.org/10.15454/1.5573932732039927E12), Saint Gilles, France. Pigs were kept in near-commercial conditions (ad-libitum access to water and feeds, group housing, ambient room temperature of 20–24°C) for a period of 81 d from an initial mean BW of 35.2 (SD: 4.70) kg until a final mean BW of 118 (SD: 8.87) kg. The pigs were given access to two feeds in succession formulated to meet or exceed the expected population level average nutritional requirements. The change in feeds occurred when animals reached ~65.0 kg.
Approach to Estimate Individual Level Variation in Growth Potential and Body Composition
Model Description
The Gompertz growth model (28), comprehensively reviewed by Filipe et al. (29), was used to describe the evolution of BWt of each individual pig over time:
where t and t0 were the current and initial times (d), BWin (kg) was the observed initial bodyweight at the start of the data collection period, and BWm (kg) and B (d) were unknown parameters (traits) estimated for each pig. The unknown model traits correspond to the weight at maturity and the inverse of the growth rate controlling how fast the weight at maturity is reached.
After accounting for gut fill to derive the empty BW, eBWt (30), this eBWt was expressed as a sum of the four main body chemical components (31): protein [N* = 6.25 × × N, where N is nitrogen (kg)], lipid (L) (kg), water (W) (kg) and ash (Ash) (kg):
where α was assumed to be a constant proportion over the growth period under consideration, equal to 95% of BWt (32, 33) and to be the same across animals.
The growth of these four body chemical components was represented by the following allometric relationships (29, 34–36):
where and Lm are mature weights, and and Lin are initial weights of protein and lipid, respectively; these traits were unknown in advance and had to be estimated from individual data from each pig in the population.
Fitting to the Data
To estimate the traits characterising each individual pig in the population, Equations (1.1–1.6) describing the dynamic evolution of BWt,and Asht were fitted to the data of each individual pig one at a time.
To account for the uncertainty and correlations between individual trait estimates, a Bayesian inference approach was utilised, which outputs estimated distributions rather than point estimates of the traits (37). Samples of trait estimates were obtained using the Markov Chain Monte Carlo (MCMC) methods (38) and more specifically, the Metropolis-Hastings algorithm (39). The posterior inferences on the traits were based on samples generated using the MCMC engine rjags (40). Prior distributions for the traits are given in the Supplementary Material, together with a justification for their choice. Four independent MCMC chains, each containing 100,000 samples and initialised with different random starting parameter values, were generated, from which the first ten percent samples were discarded as burn-in (41, 42). The posterior inferences were carried out on the remaining 90,000 samples from each chain; no thinning was applied (43). Four MCMC chains, rather than one, were used as a way of assessing differences among the sampled trait distributions and thus, was a first convergence diagnostic (44). The convergence of each sample chain was also assessed by investigating trace plots (after burn-in) for each trait and by calculating the potential scale reduction factor, (45, 46). Values of . > 1.01 were considered to indicate poor convergence (47). The posterior distribution of sampled traits used for inference comprised every chain that converged; for example, when the four chains converged, it comprised Ns = 4 × 90,000 = 360,000 sampled trait values.
Data-Based Estimation of the Average Pig in the Population
The average pig in the population was estimated by minimising the following metric across the pigs in the population:
Where Ŷij are obtained estimates of the traits and Lm for pig i (i = 1, …, 32) in the population, and Ŷj are the median values of these trait estimates calculated across the population. The pig whose set of estimates Ŷj had the lowest value of D was chosen to characterise the average pig as its traits were regarded as central in the population. This specific approach to multidimensional estimation of the average pig was chosen because it preserves the individual level correlations between traits which were estimated jointly for each animal in the population (27).
Estimation of Nutrient Requirements
Daily requirements for N*, P and energy of the estimated average pig and of each pig in the pig population (whose individual traits were estimated) were expressed as a sum of requirements for maintenance and growth using the equations in Table 1; inputs to these equations were the data-driven trait estimates that are the parameters of Equations (1.1–1.6).
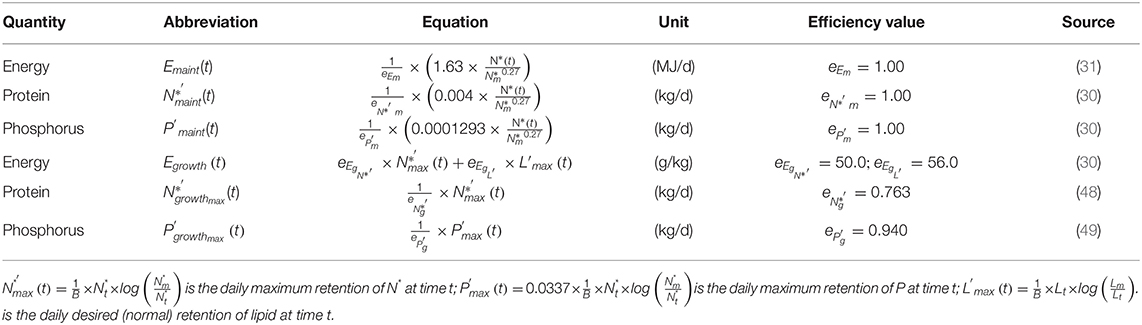
Table 1. Equations to estimate individual daily requirements for maintenance and growth in terms of effective energy (E), digestible protein (N*) and digestible phosphorus (P).
Maintenance requirements for N*, P and energy at t were related to the estimated and , rather than BWt and BWm, to account for any potential variation in these requirements due to differences in body composition among animals (30). It was assumed that there were no inefficiencies in utilising these nutrients for maintenance purposes (48, 49).
Growth requirements for N*, P and energy at t were related to the maximum daily retention of N* (kg/d) and P (kg/d) and to the desired (normal) retention of L (kg/d), which were estimated as:
To calculate growth requirements, equations (1.8–1.10) were multiplied by coefficients that account for the metabolic inefficiencies in the utilisation of nutrients for retention processes (50–52) and thus, to derive requirements expressed on digestible N* (30) (kg/d), digestible P (kg/d) (49) and effective energy basis (MJ/d), which is the difference between digestible energy and losses associated with feed consumption (53).
Simulated Feeding Scenarios
Four feeding scenarios were considered to quantify the effects on N and P excretion of the within- and between- animal variation in growth potential and body composition. The first two scenarios were designed to predict differences in growth performance, and N and P excretion of the average pig offered either a “static” feeding strategy that targeted its nutrient requirements at pre-specified reference points, or a precision feeding strategy that adapted to the dynamic evolution of the performance of this animal. These two scenarios are equivalent to investigating responses of the homogeneous pig population. The remaining two scenarios were designed to quantify differences in growth performance, and in N and P excretion across the heterogenous pig population offered either a “static” feeding strategy that targeted nutrient requirements of the average animal or a precision feeding strategy that adapted to real-time performance of each individual pig within the population.
Scenario 1: Two-Phase Feeding Strategy for the Average Pig
The first scenario (S1) simulated the growth of the average pig from 35.0 to 120 kg when given ad-libitum access to two feeds (Feed 1 and Feed 2), offered in succession with a switch from Feed 1 to Feed 2 at ~65.0 kg. The nutritional composition of Feed 1 and Feed 2, in terms of crude N* (g/kg), digestible N* (g/kg), total P (g/kg), digestible P (g/kg), and effective energy (MJ/kg) were inputs into the growth model. The following contents were calculated by dividing the estimated nutrient requirements for maintenance and growth of the average pig at reference points ti by the median DFIt at the same point from the collected data across the thirty-two pigs (section Data):
where X= [digestible N*, digestible P, effective energy] and ti = (1,2) are the reference points where BWt1 = 50.0 kg (Feed 1) or BWt2 = 92.5 kg (Feed 2), which are based on Symeou et al. (54). Crude N* contents were calculated according to Wellock et al. (55) by dividing digestible N* contents in each feed by the product of the digestibility coefficient, 0.800, and the biological value [a common measure of N* quality in the feed (56)], 0.750, reflective of typical commercial feeds (57). Total P contents were calculated by dividing digestible P contents in each feed by the digestibility coefficient, equal to 0.500 (58) to derive total P values consistent with the typical commercial feeds (26). As nutrient requirements for the average pig were conditional on the estimates under section Estimation of nutrient requirements, estimated nutritional composition of Feed 1 and Feed 2 is given in section Estimation of nutrient requirements and feed composition.
Scenario 2: Precision Feeding Strategy for the Average Pig
The second scenario (S2) simulated the growth of the average pig given ad-libitum access to feeds adjusted daily for a time period (d) equal to the length of S1. Daily adjustments to the nutritional composition of the feeds, in terms of digestible N*, digestible P and effective energy were calculated as the ratio of the estimated daily nutrient requirements for maintenance and growth of the average pig to the estimated target DFIt of this pig. The target DFIt was estimated using:
where CG is the cumulative gain, θ1 and θ2 are parameters estimated from the animal's past BW and feed consumption. Crude N* feed contents were calculated according to Wellock et al. (55) by dividing digestible N* contents in each feed by the product of the digestibility coefficient, equal to 0.800 and the biological value, equal to 0.750. Total P contents in Feed 1 and Feed 2 were calculated by dividing digestible P contents in each feed by the digestibility coefficient, equal to 0.500 to derive total P values. It is assumed that the usual practise of blending high-nutrient and low-nutrient basal feeds would not alter nutrient composition of these feeds. However, blend feeding was not explicitly considered in this study.
Scenario 3: Two-Phase Feeding Strategy for the Heterogenous Pig Population
The third scenario (S3) extended S1 to the heterogenous pig population by simulating the growth of each pig in the population for a time period from the population average BW of 35.0–120 kg. Each pig in the population was given ad-libitum access to Feed 1 and Feed 2, with a change in feeds when the population average BW reached 65.0 kg.
Scenario 4: Precision Feeding Strategy for the Heterogenous Pig Population
The fourth scenario (S4) extended S2 in the context of the heterogenous pig population. This scenario simulated the growth of each pig in the population offered ad-libitum access to the individualised precision feeding plan, adjusted daily to adapt to real-time performance of each pig, for a time period equal to the length of S3. For each pig, daily adjustments to the nutritional composition of the feeds were calculated using the approach described in section Scenario 2: precision feeding strategy for the average pig but accounting for the individualised daily nutrient requirements for maintenance and growth, and target DFIt.
Estimation of Growth and Nutrient Excretion
In S1 and S3, which described the commercial two-phase feeding strategy, Feed 1 and Feed 2 were assumed to result in periods of nutrient under-supplementation or over-supplementation for a number of pigs (54). When undersupplied with nutrients, pigs were assumed to consume excess amounts of feeds when either N*or energy was the most deficient (20, 59), as an attempt to eat for the first limiting feed resource in the feed, but not when P was the most deficient (49, 60). In the cases of P deficiencies, feed intake was assumed to be controlled only by the energy needed to support the potential growth. In S2 and S4, which described the precision feeding strategy, the individualised feeds were assumed to provide the precise quantities of nutrients to support maintenance and growth requirements of each pig.
Daily feed consumption, DFIt was predicted using the following equation:
where terms in the numerator of this equation are given in Table 1, and Efeed and are effective energy feed content (MJ/kg) and digestible N* (g/kg), respectively. There were no additional constraints (such as bulkiness of the feed) imposed on the actual feed consumption and pigs were assumed to be kept in a thermoneutral housing environment (61). The predicted DFIt was utilised to inform the actual growth, which could differ from the potential growth. The actual retention of protein (N*′(t)) and retention of P (P′(t)) were determined by the actual DFIt function used but these quantities were assumed to not exceed or , respectively. Any excess N* consumed was assumed to be deaminated and excreted as urea (53); any excess energy was assumed to be retained as excess L (62). The actual L retention was calculated as follows:
where EN and EL are the energy used (and expressed in effective energy scale) per kg of N* and L retained, respectively. The retention of Ash and W were related to N*′ and implemented as in Wellock et al. (30) and Symeou et al. (49).
Daily excretion of N (Nout(t)) (kg/d) and P (Pout(t)) (kg/d) were calculated as follows:
where crude N* and total P denote the feed levels of these quantities per kg of feed.
Simulated Outputs
The following outputs were generated to assess growth performance and nutrient excretion of either the average pig (S1 and S2) or of the heterogenous pig population (S3 and S4): (1) average daily feed intake (ADFI; kg/d/pig); (2) average daily gain (ADG; kg/d/pig); (3) feed conversion ratio (FCR; kg/kg/pig); (4) average daily N* retention (kg/d/pig); (5) average daily L retention (kg/d/pig); (6) final N* weight at end of each simulation (kg/pig); (7) final L weight at end of each simulation (kg/pig); (8) cumulative N and P balances [intake, retention, excretion (kg/pig)]. For S1 and S2, the outputs were expressed in terms of mean values; for S3 and S4 the outputs were expressed in terms of mean (SD) values.
Results
Data-Based Estimation of the Average Pig and the Heterogenous Pig Population
Estimated traits for each pig in the heterogenous population are visualised in Figure 1 and are summarised by the descriptive statistics calculated across the individuals in Table 2. Within the population: (1) BWm ranged from 124 to 580 kg; (2) B ranged from 50.1 to 127 d; (3) ranged from 0.683 to 4.41 (kg/kg); (4) ranged from 16.6 to 93.5 kg; (5) Lm ranged from 35.7 to 184 kg; (6) ranged from 3.86 to 8.24 kg; (7) Lin ranged from 2.17 to 5.72 kg. There were three pigs that were notably different from the remaining animals in the population, namely: (i) two pigs were notably larger at maturity than the rest, with the estimated BWm exceeding 400 kg (Figure 1A); (ii) one pig was notably leaner than the rest, with the estimated below one (Figure 1B). Despite these differences, these three potential outlier pigs were kept in further analyses as their inclusion or exclusion did not influence the overall comparisons of different feeding strategies (see Supplementary Material for results produced in the context of pig population which excluded the three aforementioned pigs). Estimated traits of the average pig in the population were: BWm = 205 kg; B = 65.0 days;(kg/kg); kg; Lm = 71.6 kg; kg; Lin = 3.34 kg.
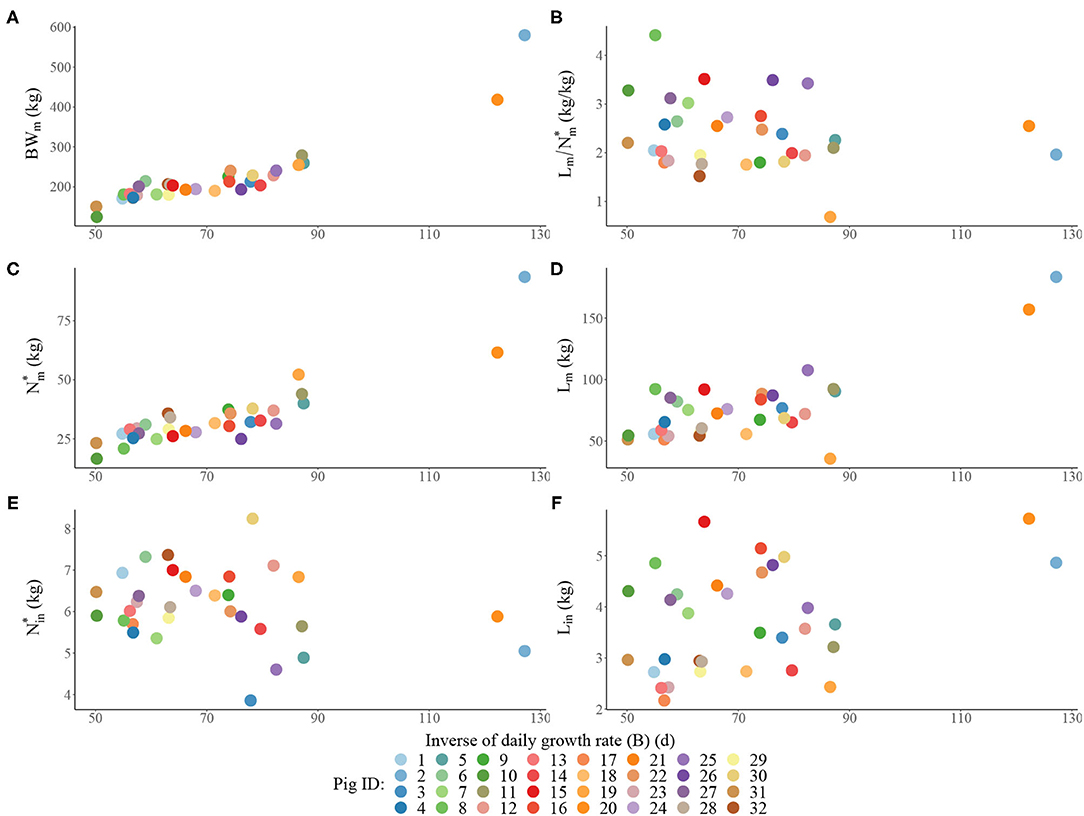
Figure 1. Scatterplots of the estimated traits for each individual pig in the population: (A) mature bodyweight (BWm) vs. inverse of daily growth rate BB; (B) ratio of lipid to protein weights at maturity vs. B; (C) mature protein weight () vs. B; (D) mature lipid weight (Lm) vs. B; (E) initial protein weight () vs. B; (F) initial lipid weight (Lin) vs. B.
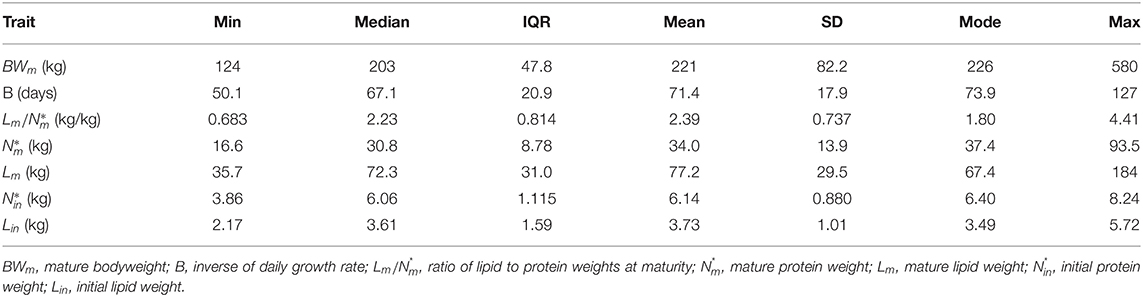
Table 2. Summary statistics of the estimated traits across the thirty-two pigs in the population.
Estimation of Nutrient Requirements and Feed Composition
For the two-phase feeding strategies under consideration (S1 and S3), the kg of Feed 1 was estimated to contain 181 g of crude N*, 109 g of digestible N*, 6.01 g of total P, 3.01 g of digestible P and 11.8 MJ of effective energy, in order to meet precisely the requirements of this pig at the mid-point of the period under consideration. Subsequently, the kg of Feed 2 was estimated to contain 122 g of crude N*, 72.9 g of digestible N*, 4.06 g of total P, 2.03 g of digestible P and 11.8 MJ of effective energy.
Estimated nutritional composition of the feeds (in terms of digestible N*, digestible P and effective energy) in S1 and S2, together with the accompanying estimated daily nutrient requirements for maintenance and growth of the average pig is given in Figure 2. In the context of the average pig, the precision feeding strategy (S2) resulted in gradual decreases in digestible N* and digestible P feed contents over time; the effective energy content of the feeds remained largely unchanged over time. On the first day of S2, the kg of feed was estimated to contain 205 g of crude N*, 123 g of digestible N*, 6.78 g of total P, 3.39 g of digestible P and 11.9 MJ of effective energy. On the last day, the kg of feed was estimated to contain 96.3 g of crude N*, 57.8 g of digestible N*, 3.25 g of total P, 1.62 g of digestible P and 11.8 MJ of effective energy.
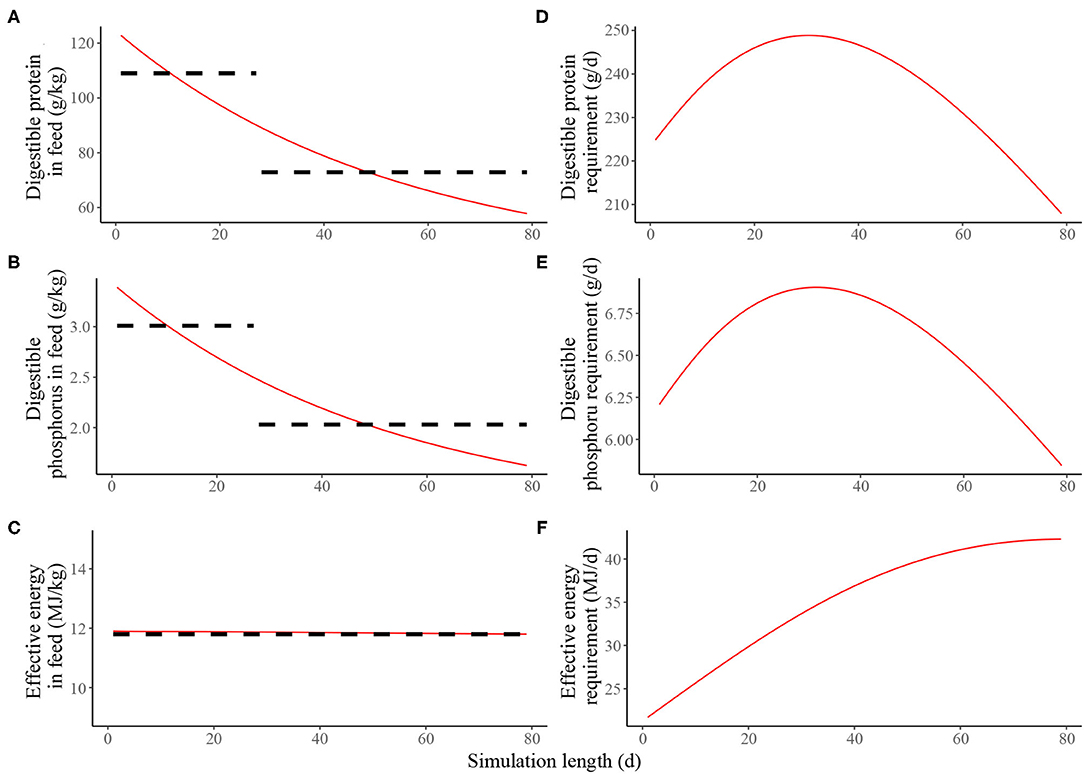
Figure 2. Estimated nutritional composition of the feeds in either two-phase feeding strategy (dashed black line, Scenario 1) or precision feeding strategy (solid red line; Scenario 2) offered to the average pig in terms of: (A) digestible protein (g/kg); (B) digestible phosphorus (g/kg); (C) effective energy (MJ/kg); estimated daily nutrient requirement for maintenance and growth of the average pig in terms of: (D) digestible protein (g/d); (E) digestible phosphorus (g/d); (F) effective energy (MJ/d). For a detailed description of the simulated scenarios, see section Simulated Feeding Scenarios.
Estimated nutritional composition of the feeds in S3 and S4 (in terms of digestible N*, digestible P and effective energy), together with accompanying estimated daily nutrients requirements for maintenance and growth of each pig in the heterogenous population is given in Figure 3. In the context of the pig population, the precision feeding strategy (S4) also resulted in gradual decreases in digestible N* and digestible P feed contents over time for each pig; the effective energy content also remained largely unchanged over time for each pig. There were notable differences in nutrient requirements of individual pigs, which were reflected in the differences in the estimated nutritional composition of the individualised feeds. For example, on the first day, the kg of feed offered to the pig with the lowest nutrient requirements was estimated to contain 145 g of crude N*, 86.7 of digestible N*, 4.78 g of total P, 2.39 g of digestible P and 11.2 MJ of effective energy, while the kg of feed offered to the pig with the highest nutrient requirements pig was estimated to contain 271 g of crude N*, 162 of digestible N*, 8.96 g of total P, 4.48 g of digestible P and 13.0 MJ of effective energy.
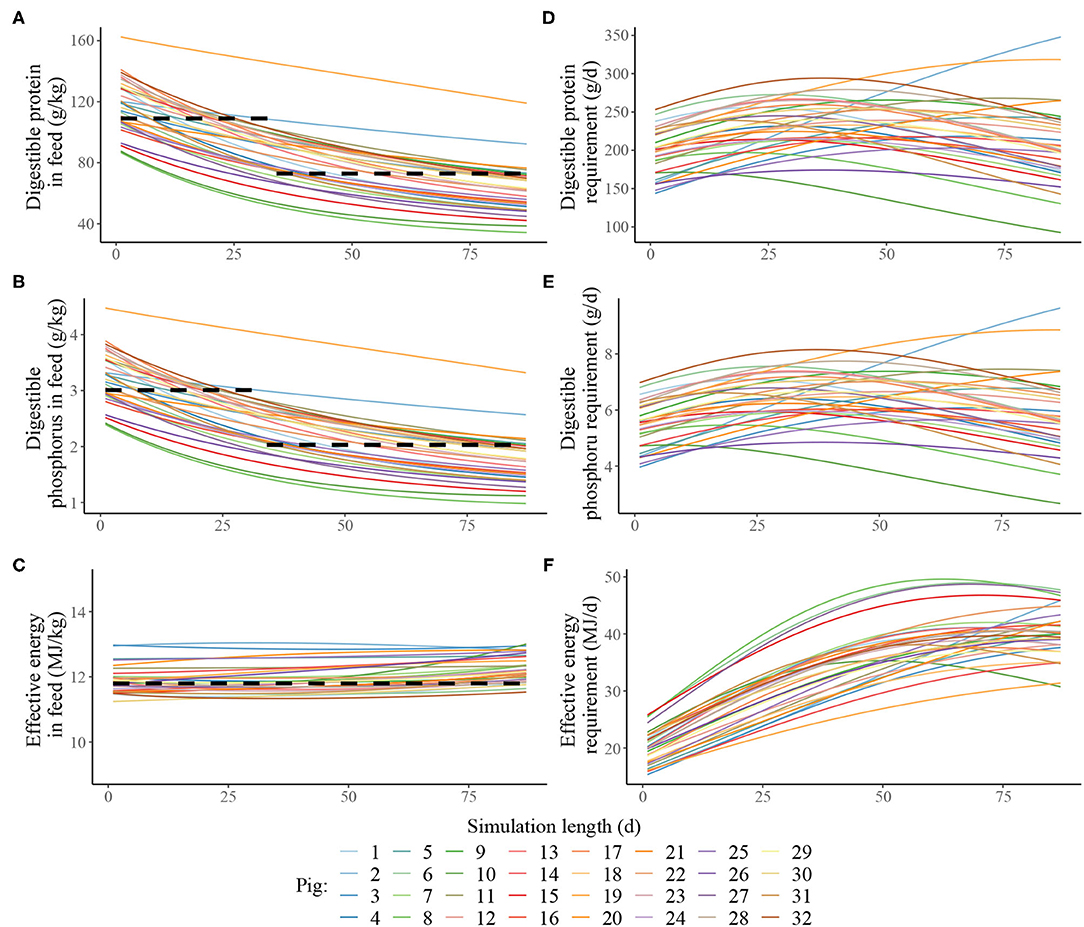
Figure 3. Estimated nutritional composition of the feeds in either two-phase feeding strategy (dashed black line, Scenario 3) or precision feeding strategy (solid lines; Scenario 4) given to a pig population in terms of: (A) digestible protein (g/kg); (B) digestible phosphorus (g/kg); (C) effective energy (MJ/kg); estimated daily nutrient requirement for maintenance and growth of each of the thirty-two pigs in the population in terms of: (D) digestible protein (g/d); (E) digestible phosphorus (g/d); (F) effective energy (MJ/d). For a detailed description of the simulated scenarios, see section Simulated Feeding Scenarios.
Comparison of Growth Performance and Nutrient Excretion
A summary of the growth performance indicators calculated in the context of S1–S4 is given in Table 3. Relative to S1, S2 resulted in: 0.270% decrease in ADFI; 0.570% increase in ADG; 0.834% decrease in FCR; 1.19% increase in average daily N* retention; 0.964% decrease in daily L retention; 0.902% increase in final N* weight; and 0.949% decrease in final L weight. Relative to S3, S4 resulted in [mean (SD)]: 1.31 (3.38)% decrease in ADFI; 1.76 (3.32)% increase in ADG; 3.64 (7.04)% decrease in FCR; 3.12 (5.36)% increase in average daily N* retention; 2.43 (4.54)% decrease in daily L retention; 2.13 (3.80)% increase in final N* weight; and 2.19 (3.91)% decrease in final L weight.
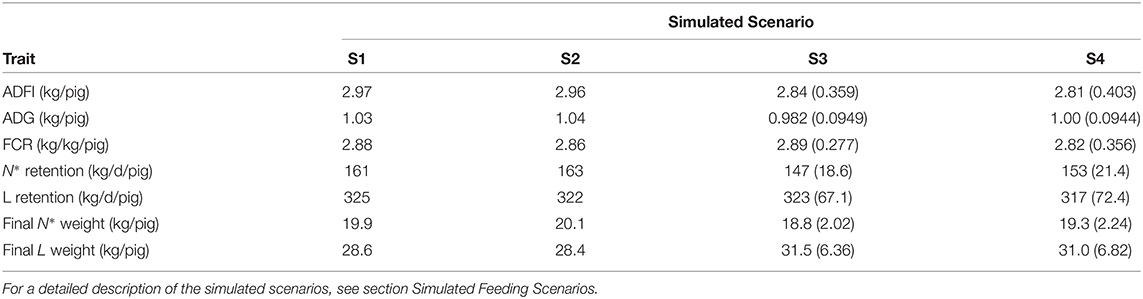
Table 3. Summary statistics of average daily feed intake (ADFI); average daily gain (ADG); feed conversion ratio (FCR); protein (N*) retention; lipid (L) retention; final protein (N*) weight; and final lipid (L) weight in each of the four simulated scenarios in terms of mean values (S1 and S2 for the average pig) and mean (SD) values (S3 and S4 for the population of pigs).
Summary of the daily excretion of N and P over time for pigs considered in S1–S4 is given in Figure 4. Cumulative N and P balances calculated in the context of S1–S4 are given in Table 4. Relative to S1, S2 resulted in: 4.04% decrease in N intake; 0.858% increase in N retention; 8.25% decrease in N excretion; 3.93% decrease in total P intake; 1.04% increase in P retention; and 9.17% decrease in total P excretion. Relative to S3, S4 resulted in [mean (SD)]: 10.3 (23.9)% decrease in N intake; 2.98 (5.05)% increase in N retention; 22.5 (42.6)% decrease in N excretion; 10.0 (23.6)% decrease in total P intake; 4.35 (7.65)% increase in P retention; and 22.9 (40.2)% decrease in total P excretion.
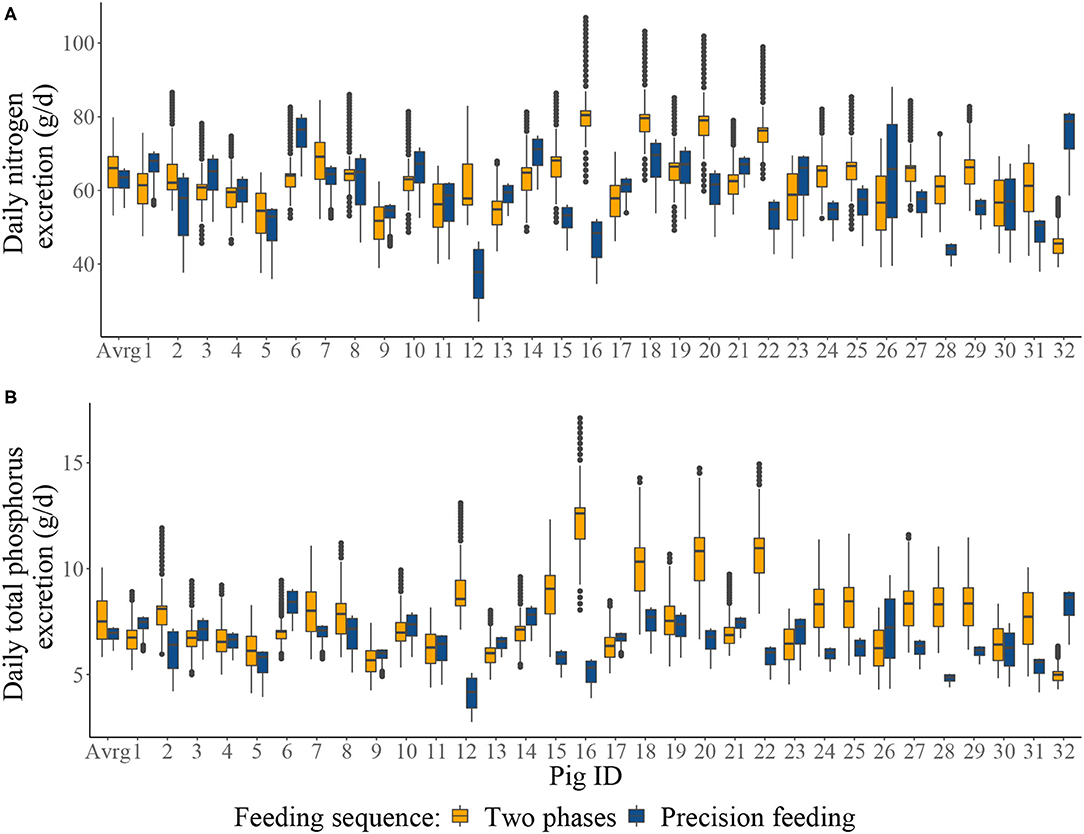
Figure 4. Boxplots of: (A) the individual daily nitrogen excretion (g/d); and (B) the individual daily total phosphorus excretion from two-phase feeding strategy or precision feeding strategy offered either to the average pig (Avrg) or each of the thirty-two pigs in the population (1–32). For a detailed description of the simulated scenarios, see section Simulated Feeding Scenarios.
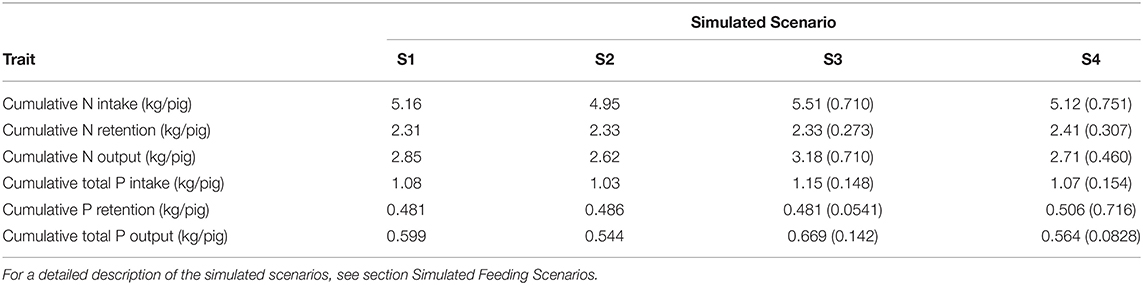
Table 4. Calculated nitrogen (N) and phosphorus (P) balances in each of the four simulated scenarios in terms of mean values (S1 and S2 for the average pig) and mean (SD) values (S3 and S4 for the population of pigs).
Discussion
Estimation of the Unobserved Traits From Data
In practise, it is not possible to collect individual sequential measurements of the traits that determine growth potential and body composition, such as the growth of protein or lipid in growing-finishing pig systems (13–15). Yet, estimates of these traits are required to accurately estimate individual nutrient requirements (63). In this context, there is substantial research interest in developing mathematical models that utilise sequential data on individual bodyweight and feed consumption from electronic feeding and weighing stations to estimate these unobserved traits (4, 8, 64). To date, approaches to estimate the growth of protein have been developed, but the growth of the remaining main body chemical components (i.e., lipid, water, ash) has been largely overlooked, which could impact the estimation of the nutrient requirements needed to deliver tailored feeding strategies. In this chapter, an inferential approach utilising the concepts of inverse modelling (13, 65) was developed to estimate altogether the growth of the four main body chemical components (protein, water, lipid, and ash) from sequential bodyweight data that is typically available for precision feeding purposes. Joint estimation is preferred, as it ensures that all parameters that estimated traits are mutually consistent with the observed individual data (29). Accordingly, the estimates obtained via this approach could be used to formulate data-driven feeding strategies that more optimally match nutrient supply to the demand of pigs.
One of the main building blocks of the developed approach concerned a mathematical description of the relationship between protein weight and bodyweight, which consequently informs protein deposition. There is a considerable body of evidence suggesting that the relationship between these traits is approximately allometric (66–72). In light of this empirical evidence, the allometric model was chosen to describe the relationship between protein weight and bodyweight. This is in contrast with previous precision feeding studies, which suggest alternative ways of relating these traits, including isometric, quadratic and Gompertz relationships (5, 19). However, these models are inconsistent with the aforementioned empirical evidence and thus, were not considered further in this chapter. The remaining body elements were related to protein, based on similar well-established allometric scaling rules supported by the view that lipid-free dry matter is considered to be one of the best indicators of the growth progress (29, 34–36). While these rules seem plausible for pigs kept in high-standard livestock production systems, modifications to the allometric body composition models could be needed if there is evidence suggesting that the data originated from pigs faced with severe limitations in the availability of nutrient resources.
Characterisation of the Distributions and Correlations of Unobserved Traits
In the context of pig production data, population and individual level trait estimation is typically carried out within a framework based on hierarchical regression models (19, 73). Under this framework, the overall quality of inferences could be negatively impacted by having to directly estimate multiple variance-covariance parameters (27), which can be challenging due to data limitations (9). The technical difficulties associated with this estimation procedure are the main reason why several studies make various working assumptions that neglect trait correlations (20, 54, 61). However, as highlighted by Pomar et al. (22), this is undesirable as it could lead to an overestimation of the trait variation in a population. In an attempt to alleviate these concerns, the developed approach to estimate population and individual level traits described in this paper, shifted away from hierarchical regression modelling in favour of an alternative framework based on separately inferring individual level trait distributions, which were then scaled up to obtain population level traits. This alternative framework does not necessitate an explicit specification of the aforementioned variance-covariance parameters (27). Thus, reducing the number of assumptions and the number of parameters that need to be estimated should increase the ability to adequately characterise the traits of individual pigs, which should lead to a greater understanding of the impact of such differences on the estimation of population averages (74).
Overall, the developed approach to characterise unobserved traits from bodyweight data on growing (Large White × Landrace) × Pietrain barrows and gilts converged to biologically plausible estimates for most pigs in the population (65, 75). There was considerable variation in the estimated traits among pigs, but very few individuals were identified as potential outliers. However, it is difficult to ascertain if these potential outliers are a result of genetics, environment, feeding and management practises, a combination of some of these factors (76), or data limitations (27). Moreover, it is also important to note that since the parameters on body composition were estimated conditional on the bodyweight parameter estimates and without any additional data, some of these estimates could carry increased uncertainty and have limited biological interpretability (29).
As highlighted by Gauthier et al. (77), mathematical models applied in the context of precision feeding should be able to process both more extensive “historical” data, covering longer timescales and less extensive “real-time” data, covering shorter timescales. When dealing with the latter type of data, it is likely that there will be additional uncertainty in the estimates of body composition and thus, in the estimates of nutrient requirements. The purpose of the current study was to hindcast the nutrient excretion of growing-finishing pigs under differing hypothesised feeding strategies to quantify the differences in the nutrient excretion between these different feeding strategies. Consequently, the developed approach was not tested in the context of “real-time” data, but such evaluations could be an area of future research.
Mechanism of Feed Intake Regulation and Consequences on Nutrient Intake
Recent advances in engineering enable the delivery of feeds, that can be tailored to the needs of individual pigs at a particular point in time (78, 79). It is expected that there would be improvement in feed and nutrient utilisation efficiency if such individualised, data-driven feeding strategies are implemented. In this study, simulation modelling was utilised to illustrate how the estimated variation in individual growth potential and body composition traits could be incorporated in a proposed precision feeding strategy. Specifically, simulations were carried out to assess growth performance and nutrient excretion in the context of a precision feeding plan with daily adjustments and a commercial two-phase feeding plan that did not adapt to real-time animal performance. However, before describing the outcomes of these simulations, it is important to highlight some of the key assumptions concerning how growth was simulated, as these assumptions predetermine the consequent assessments.
In the simulations, the actual growth of pigs was allowed to differ from the estimated potential growth. These differences were largely conditional upon feed composition. Specifically, it was assumed that when the feeds were deficient in either energy or protein, the pigs would attempt to increase their feed consumption according with the previous empirical evidence (59, 80–83). For the purposes of this study, no constraint was assumed to prevent the pigs from meeting their requirements for these two nutrient resources. In reality, however, it is likely that some constraints would operate and prevent the animals from achieving these goals (84, 85). This potential compensatory feed consumption was assumed to be absent in cases when P was the most deficient nutrient to reflect the current knowledge of feed intake regulation in the context of this nutrient (49, 60). In those cases, it was assumed that feed intake could be predicted solely from the estimated energy requirements and energy content of feeds. If the nutritional deficiency triggers attempts to eat for the most deficient nutrient resource, then a possible consequence of this feed intake mechanism would be the excess consumption of the remaining nutrients, leading to their excess excretion (62). In scenarios when feeds were no longer deficient, there was no attempt to correct for any potential imbalances in the body composition as a result of uncertainty surrounding the phenomenon of compensatory growth, especially in relation to the correction of the lipid to protein ratio in the body (86–88).
Comparison of Feeding Strategies Regarding Growth Performance and Nutrient Excretion
The aforementioned simulations were structured to assess the potential advantages (or disadvantages) of precision feeding strategies as measured by the average of individual responses in a population and by the response of an assumed average pig in a population, as it is appreciated that there could be notable differences between these two responses (20). These differences are conditional upon the levels of heterogeneity in the population (24). Note that the present simulations serve mainly as an illustration of the developed approach to estimate individual level variation in unobserved traits and assess deviations from the population average. Additional simulations could be carried out as sensitivity analysis or to evaluate different feeding scenarios.
In scenarios simulating the average pig in the population, which would only represent a population if it were homogenous, the precision feeding strategy led to an approximate ten percent decrease in N and P excretion compared to the typical two-phase feeding strategy. In this case, the higher nutrient excretion from the typical two-phase feeding strategy could be attributed to periods of over-supplementation. Extending the comparisons to the heterogeneous pig population demonstrated an even greater decrease in N and P excretion in the precision feeding strategy compared to the two-phase feeding strategy that targeted nutrient requirements of the average animal (~20% reduction). These estimates are consistent with previous studies evaluating precision feeding strategies, which reported an average reduction in N and P excretion ranging from approximately ten to forty percent (10, 12, 89), although those studies focussed on evaluating individualised feeding strategies against three-phase feeding sequences. The additional decrease in nutrient excretion observed in the context of the heterogenous pig population could be explained by what happens to the pigs whose nutrient requirements differed from those of the average pig. When offered the phase feeding strategy, the pigs with lower nutrient requirements were oversupplied, leading to notable periods of excess excretion that was mitigated by the precision feeding strategy. The converse was also true implying that the pigs with higher nutrient requirements were excreting more nutrients when offered the precision feeding strategy due to the inefficiencies associated with higher nutrient intakes. Both feeding strategies resulted in comparable growth performance, which is consistent with the previous literature (10, 12, 89). However, there were some differences between growth performance in the context of the two feeding strategies under consideration. Specifically, the precision feeding strategy led to small increases in average daily gain and protein retention, and small decreases in average daily feed intake, feed conversion ratio and lipid retention when compared to the typical two-phase feeding strategy. Again, these differences were magnified in the context of the heterogenous pig population due to the individual level variation in nutrient requirements, which led to more severe periods of both under-supplementation and over-supplementation for some animals.
Note that in the precision feeding strategies under consideration, two feed components (protein and phosphorus) were subject to considerable adjustments over time. It was assumed that the current practise of blending high-nutrient and low-nutrient basal feeds would be largely compatible with such adjustments, although this is not fully guaranteed. To ensure universality, blending three basal feeds is likely to be needed (90).
Conclusions
Alternative data-driven approaches to estimate individual level variation in unobserved traits using the available data on BW were developed. The key advantages of these alternative approaches relate to the improvements made in terms of characterisation of the traits of individual pigs, which should also lead to a greater understanding of the impact of such differences on the estimation of population averages. This was achieved through: (1) a more comprehensive description of the growth potential and body composition; and (2) a reduction in the number of parameters needed to be estimated compared to the typical hierarchical regression models. Consequently, these alternatives approaches were incorporated in a proposed precision feeding modelling framework to quantify the differences in the nutrient excretion between individualised feeding strategies and standard feeding strategies. It was found that the implementation of individualised feeding strategies could notably reduce nutrient excretion in pig populations, which supports the earlier findings by other researchers. The main outstanding challenge relates to whether the developed approaches are applicable in the context of ‘real-time' data on bodyweight of pigs that has been collected over shorter periods of time, than those examined in this study which covered the entire growing-finishing phase of growth. Overall, the outcomes of this study should increase the ability to accurately match nutrient supply to the demand of animals by building a more comprehensive picture of their individual nutrient requirements. Moreover, the proposed methodology could also be relevant in the context of selective breeding focussing on improving feed efficiency, such as in the case of residual feed intake-based genetic selection.
Data Availability Statement
The data analysed in this study was obtained from the National Research Institute for Agriculture, Food and Environment (INRAE) Pig Physiology and Phenotyping Experimental Facility (UE3P) in Saint-Gilles (France) (https://doi.org/10.15454/1.5573932732039927E12). Requests to access these datasets should be directed to Dr Ludovic Brossard, ludic.brossard@inrae.fr.
Ethics Statement
Ethical review and approval was not required for the animal study because the empirical data used in this paper were not generated in this study. The data originated from animals treated under normal husbandry procedures and for this reason no Institutional or other relevant ethics board approval was required for its collection.
Author Contributions
MM led the development and implementation of the approaches in R and drafted the first version of the manuscript. JF conceptualised the algorithms for the estimation of unobserved traits. IK managed both the BBSRC and Feed-a-Gene projects which supported financially the paper development and MM studies. This paper is a part of MM doctoral thesis. All authors contributed equally to the inception of the study, its development, interpretation and conclusions, and contributed equally to the development and finalisation of the manuscript.
Funding
This study was funded in part by the Biotechnology and Biological Sciences Research Council (BBSRC) in collaboration with AB Vista in the form of a postgraduate studentship to MM. This paper is a part of MM doctoral thesis. JF and IK were supported by the Feed-a-Gene project. Feed-a-Gene received funding from the European Commission under the European Union Framework Programme for Research and Innovation Horizon 2020 under grant agreement no. 633531. JF was also partially supported by The Scottish Government's Rural and Environment Science and Analytical Services Division (RESAS).
Conflict of Interest
The authors declare that the research was conducted in the absence of any commercial or financial relationships that could be construed as a potential conflict of interest.
Publisher's Note
All claims expressed in this article are solely those of the authors and do not necessarily represent those of their affiliated organizations, or those of the publisher, the editors and the reviewers. Any product that may be evaluated in this article, or claim that may be made by its manufacturer, is not guaranteed or endorsed by the publisher.
Acknowledgments
The authors would like to thank Dr. Ludovic Brossard for providing access to data.
Supplementary Material
The Supplementary Material for this article can be found online at: https://www.frontiersin.org/articles/10.3389/fvets.2021.689206/full#supplementary-material
References
1. Cole D, Todd L, Wing S. Concentrated swine feeding operations and public health: a review of occupational and community health effects. Environ. Health Perspect. (2000) 108:685–99. doi: 10.1289/ehp.00108685
2. Moran D, Wall E. Livestock production and greenhouse gas emissions: defining the problem and specifying solutions. Anim Front. (2011) 1:19–25. doi: 10.2527/af.2011-0012
3. Garcia-Launay F, Van Der Werf HMG, Nguyen TTH, Le Tutour L, Dourmad JY. Evaluation of the environmental implications of the incorporation of feed-use amino acids in pig production using life cycle assessment. Livest Sci. (2014) 161:158–75. doi: 10.1016/j.livsci.2013.11.027
4. Pomar C, Hauschild L, Zhang GH, Pomar J, Lovatto PA. Applying precision feeding techniques in growing-finishing pig operations. R Bras Zootec. (2009) 38:226–37. doi: 10.1590/S1516-35982009001300023
5. Hauschild L, Lovatto PA, Pomar J, Pomar C. Development of sustainable precision farming systems for swine: estimating realtime individual amino acid requirements in growing-finishing pigs. J Anim Sci. (2012) 90:2255–63. doi: 10.2527/jas.2011-4252
6. Zuidhof MJ. Precision livestock feeding: matching nutrient supply with nutrient requirements of individual animals. J Appl Poult Res. (2020) 29:11–4. doi: 10.1016/j.japr.2019.12.009
7. Pomar C, Remus A. Precision pig feeding: a breakthrough toward sustainability. Anim Front. (2019) 9:52–9. doi: 10.1093/af/vfz006
8. Pomar C, Van Milgen J, Remus A. Precision livestock feeding, principle and practice. In: Hendriks WH. Verstegen MWA, Babinszky L, editors. Poultry And Pig Nutrition: Challenges Of The 21st Century. Wageningen: Wageningen Academic Publishers (2019). doi: 10.3920/978-90-8686-884-1_18
9. Brossard L, Dourmad JY, Garcia-Launay F, Van Milgen J. Modelling nutrient requirements for pigs to optimize feed efficiency. Achieving Sustainable Production of Pig Meat. Cambridge: Burleigh Dodds Science Publishing Limited (2017).
10. Andretta I, Pomar C, Rivest J, Pomar J, Lovatto PA, Radünz Neto J. The impact of feeding growing–finishing pigs with daily tailored diets using precision feeding techniques on animal performance, nutrient utilization, and body and carcass composition1. J Anim Sci. (2014) 92:3925–36. doi: 10.2527/jas.2014-7643
11. Pomar C, Pomar J, Dubeau F, Joannopoulos E, Dussault JP. The impact of daily multiphase feeding on animal performance, body composition, nitrogen and phosphorus excretions, and feed costs in growing–finishing pigs. Animal. (2014) 8:704–13. doi: 10.1017/S1751731114000408
12. Andretta I, Pomar C, Rivest J, Pomar J, Radünz J. Precision feeding can significantly reduce lysine intake and nitrogen excretion without compromising the performance of growing pigs. Animal. (2016) 10:1137–47. doi: 10.1017/S1751731115003067
13. Knap PW, Roehe R, Kolstad K, Pomar C, Luiting P. Characterization of pig genotypes for growth modeling. J Anim Sci. (2003) 81:E187–95. doi: 10.2527/2003.8114_suppl_2E187x
14. Scholz AM, Bünger L, Kongsro J, Baulain U, Mitchell AD. Non-Invasive methods for the determination of body and carcass composition in livestock: dual-energy x-ray absorptiometry, computed tomography, magnetic resonance imaging and ultrasound: invited review. Animal. (2015) 9:1250–64. doi: 10.1017/S1751731115000336
15. Fernandes AFA, Dórea JRR, Valente BD, Fitzgerald R, Herring W, Rosa GJM. Comparison of data analytics strategies in computer vision systems to predict pig body composition traits from 3d images. J Anim Sci. (2020) 98:178. doi: 10.1093/jas/skaa278.327
16. Quiniou N, Noblet J. Prediction of tissular body composition from protein and lipid deposition in growing pigs. J Anim Sci. (1995) 73:1567–75. doi: 10.2527/1995.7361567x
17. Cloutier L, Pomar C, Létourneau Montminy MP, Bernier JF, Pomar J. Evaluation of a method estimating real-time individual lysine requirements in two lines of growing–finishing pigs. Animal. (2014) 9:561–8. doi: 10.1017/S1751731114003073
18. Remus A, Hauschild L, Corrent E, Létourneau-Montminy MP, Pomar C. Pigs receiving daily tailored diets using precision-feeding techniques have different threonine requirements than pigs fed in conventional phase-feeding systems. J Anim Sci Biotechnol. (2019) 10:16. doi: 10.1186/s40104-019-0328-7
19. Remus A, Hauschild L, Methot S, Pomar C. Precision livestock farming: real-time estimation of daily protein deposition in growing–finishing pigs. Animal. (2020) 14:S360–70. doi: 10.1017/S1751731120001469
20. Ferguson NS, Gous RM, Emmans GC. Predicting the effects of animal variation on growth and food intake in growing pigs using simulation modelling. Anim Sci. (1997) 64:513–22. doi: 10.1017/S1357729800016143
21. Knap PW. Variation in Maintenance Requirements Of Growing Pigs in Relation to Body Composition: A Simulation Study. Ph.D. Thesis (Doctoral Thesis), Wageningen University and Research (2000).
22. Pomar C, Kyriazakis I, Emmans GC, Knap PW. Modeling stochasticity: dealing with populations rather than individual pigs. J Anim Sci. (2003) 81:E178–86. doi: 10.2527/2003.8114_suppl_2E178x
23. Wellock IJ, Emmans GC, Kyriazakis I. Modeling the effects of stressors on the performance of populations of pigs. J Anim Sci. (2004) 82:2442–50. doi: 10.2527/2004.8282442x
24. Brossard L, Dourmad JY, Rivest J, Van Milgen J. Modelling the variation in performance of a population of growing pig as affected by lysine supply and feeding strategy. Animal. (2009) 3:1114–23. doi: 10.1017/S1751731109004546
25. Morel PCH, Alexander DLJ, Sherriff RL, Sirisatien D, Wood GR. A new development in pig growth modelling. In: Sauvant D, Van Milgen J, Faverdin Friggens PN, editors Modelling Nutrient Digestion And Utilisation in Farm Animals. Wageningen: Wageningen Academic Publishers (2011).
26. Symeou V, Leinonen I, Kyriazakis I. The consequences of introducing stochasticity in nutrient utilisation models: the case of phosphorus utilisation by pigs. Brit J Nutr. (2015) 115:389–98. doi: 10.1017/S0007114515004523
27. Filipe JAN, Kyriazakis I. Bayesian, likelihood-free modelling of phenotypic plasticity and variability in individuals and populations. Front. Genet. (2019) 10:727. doi: 10.3389/fgene.2019.00727
28. Winsor CP. The gompertz curve as a growth curve. Proc Natl Acad Sci USA. (1932) 18:1. doi: 10.1073/pnas.18.1.1
29. Filipe JAN, Leinonen I, Kyriazakis I. The quantitative principles of animal growth. In: Moughan PJ. Hendriks WH, editors. Feed Evaluation Science, 1 Edn. Wageningen: Wageningen Academic Publishers (2018).
30. Wellock IJ, Emmans GC, Kyriazakis I. Modelling the effects of thermal environment and dietary composition on pig performance: model logic and concepts. Anim Sci. (2003) 77:255–66. doi: 10.1017/S1357729800058999
31. Emmans GC, Fisher C. Problems in nutritional theory. In: Emmans, Fisher GC, editors. Nutrient Requirements of Poultry and Nutritional Research. London: Butterworths and Co (Publishers) Ltd. (1986).
32. Moughan PJ, Smith WC, Pearson G. Description and validation of a model simulating growth in the pig (20–90 kg liveweight). New Zeal J Agr Res. (1987) 30:481–9. doi: 10.1080/00288233.1987.10417960
33. Whittemore EC, Emmans GC, Kyriazakis I. The problem of predicting food intake during the period of adaptation to a new food: a model. Br J Nutr. (2003) 89:383–99. doi: 10.1079/BJN2002781
34. Emmans GC, Kyriazakis I. A general method for predicting the weight of water in the empty bodies of pigs. Animal Sci. (1995) 61:103–8. doi: 10.1017/S1357729800013576
35. Emmans GC. A method to predict the food intake of domestic animals from birth to maturity as a function of time. J Theor Biol. (1997) 186:189–99. doi: 10.1006/jtbi.1996.0357
36. Emmans GC, Kyriazakis I. Models of pig growth: problems and proposed solutions. Livest Prod Sci. (1997) 51:119–29. doi: 10.1016/S0301-6226(97)00061-4
37. Gelman A, Carlin JB, Stern HS, Dunson DB, Vehtari A, Rubin DB. Bayesian Data Analysis. Boca Raton, FL: Crc Press (2013). doi: 10.1201/b16018
38. Gamerman D, Lopes HF. Markov Chain Monte Carlo: Stochastic Simulation for Bayesian Inference, Boca Raton, Us: Chapman And Hall/Crc (2006). doi: 10.1201/9781482296426
39. Chib S, Greenberg E. Understanding the metropolis-hastings algorithm. Am Stat. (1995) 49:327–35. doi: 10.1080/00031305.1995.10476177
40. Plummer M, Stukalov A, Denwood M. Rjags: Bayesian Graphical Models Using Mcmc. 4–10 Edn. Vienna, Austria (2019).
41. Raftery AE, Lewis SM. Implementing Mcmc. In: Gilks WR. Richardson, Spiegelhalter SD J, editors. Markov Chain Monte Carlo In Practice. Boca Raton, Us: Chapman and Hall/Crc (1996).
42. Plummer M, Best N, Cowles K, Vines K. Coda: convergence diagnosis and output analysis for Mcmc. R News. (2006) 6:7–11. Available online at: http://cran.r-project.org/doc/Rnews/Rnews_2006-1.pdf#page=7
43. Link WA, Eaton MJ. On thinning of chains in MCMC. Methods Ecol Evol. (2012) 3:112–5. doi: 10.1111/j.2041-210X.2011.00131.x
44. Toft N, Innocent GT, Gettinby G, Reid SWJ. Assessing the convergence of markov chain monte carlo methods: an example from evaluation of diagnostic tests in absence of a gold standard. Prev Vet Med. (2007) 79:244–56. doi: 10.1016/j.prevetmed.2007.01.003
45. Gelman A, Rubin DB. Inference from iterative simulation using multiple sequences. Stat Sci. (1992) 7:457–72. doi: 10.1214/ss/1177011136
46. Brooks SP, Gelman A. General methods for monitoring convergence of iterative simulations. J Comput Graph Stat. (1998) 7:434–55. doi: 10.1080/10618600.1998.10474787
47. Vehtari A, Gelman A, Simpson D, Carpenter B, Bürkner PC. Rank-Normalization, Folding, and Localization: An Improved R ∧ for Assessing Convergence of MCMC. (2020). p. 1–26. doi: 10.1214/20-BA1221
48. Sandberg FB, Emmans GC, Kyriazakis I. Partitioning of limiting protein and energy in the growing pig: testing quantitative rules against experimental data. Br J Nutr. (2005) 93:213–24. doi: 10.1079/BJN20041322
49. Symeou V, Leinonen I, Kyriazakis I. Modelling phosphorus intake, digestion, retention and excretion in growing and finishing pigs: model description. Animal. (2014) 8:1612–21. doi: 10.1017/S1751731114001402
50. Kyriazakis I, Dotas D, Emmans GC. The effect of breed on the relationship between feed composition and the efficiency of protein utilization in pigs. Br J Nutr. (1994) 71:849–59. doi: 10.1079/BJN19940191
51. Van Milgen J, Dourmad JY. Concept and application of ideal protein for pigs. J Anim Sci Biotechnol. (2015) 6:15. doi: 10.1186/s40104-015-0016-1
52. Van Milgen J, Noblet J. Partitioning of energy intake to heat, protein, and fat in growing pigs. J Anim Sci. (2003) 81:E86–93. doi: 10.2527/2003.8114_suppl_2E86x
53. Emmans GC. Effective energy: a concept of energy utilization applied across species. Br J Nutr. (1994) 71:801–21. doi: 10.1079/BJN19940188
54. Symeou V, Leinonen I, Kyriazakis I. Quantifying the consequences of nutritional strategies aimed at decreasing phosphorus excretion from pig populations: a modeling approach. Animal. (2015) 10:578–91. doi: 10.1017/S1751731115002293
55. Wellock IJ, Emmans GC, Kyriazakis I. Modelling the effects of thermal environment and dietary composition on pig performance: model testing and evaluation. Anim Sci. (2003) 77:267–76. doi: 10.1017/S1357729800059002
57. Boisen S, Hvelplund T, Weisbjerg MR. Ideal amino acid profiles as a basis for feed protein evaluation. Livest Prod Sci. (2000) 64:239–51. doi: 10.1016/S0301-6226(99)00146-3
58. Fan MZ, Archbold T, Sauer WC, Lackeyram D, Rideout T, Gao Y, et al. Novel methodology allows simultaneous measurement of true phosphorus digestibility and the gastrointestinal endogenous phosphorus outputs in studies with pigs. J Nutr. (2001) 131:2388–96. doi: 10.1093/jn/131.9.2388
59. Schiavon S, Dalla Bona M, Carcò G, Carraro L, Bunger L, Gallo L. Effects of feed allowance and indispensable amino acid reduction on feed intake, growth performance and carcass characteristics of growing pigs. PLoS ONE. (2018) 13:E0195645. doi: 10.1371/journal.pone.0195645
60. Misiura MM, Filipe JAN, Walk CL, Kyriazakis I. How do pigs deal with dietary phosphorus deficiency? Br J Nutr. (2020) 124:256–72. doi: 10.1017/S0007114520000975
61. Wellock IJ. Modelling the Effects of Enviornmental Stressors on Pig Perfromance. Ph.D. Thesis (Doctoral Thesis), Edinburgh University (2003).
62. Ferguson NS, Gous RM, Emmans GC. Preferred components for the construction of a new simulation model of growth, feed intake and nutrient requirements of growing pigs. S Afr J Anim Sci. (1994) 24:10–17.
63. Remus A, Hauschild L, Pomar C. Simulated amino acid requirements of growing pigs differ between current factorial methods. Animal. (2020) 14:725–30. doi: 10.1017/S1751731119002660
64. Gaillard C, Brossard L, Dourmad JY. Improvement of feed and nutrient efficiency in pig production through precision feeding. Anim Feed Sci Technol. (2020) 268:114611. doi: 10.1016/j.anifeedsci.2020.114611
65. Doeschl-Wilson AB, Knap PW, Kinghorn BP, Van Der Steen HAM. Using mechanistic animal growth models to estimate genetic parameters of biological traits. Animal. (2007) 1:489–99. doi: 10.1017/S1751731107691848
66. Needham J. Heterogony and the chemical ground-plan of animal growth. Nature. (1932) 130:845–6. doi: 10.1038/130845b0
67. Fortin A, Simpfendorfer S, Reid JT, Ayala HJ, Anrique R, Kertz AF. Effect of level of energy intake and influence of breed and sex on the chemical composition of cattle. J Anim Sci. (1980) 51:604–14. doi: 10.2527/jas1980.513604x
68. Whittemore CT, Tullis JB, Emmans GC. Protein growth in pigs. Anim Prod. (1988) 46:437–45. doi: 10.1017/S0003356100019048
69. Moughan PJ, Smith WC, Stevens EVJ. Allometric growth of chemical body components and several organs in the pig (20–90 kg liveweight). N Z J Agric Res. (1990) 33:77–84. doi: 10.1080/00288233.1990.10430663
70. Landgraf S, Susenbeth A, Knap PW, Looft H, Plastow GS, Kalm E, et al. Developments of carcass cuts, organs, body tissues and chemical body composition during growth of pigs. Anim Sci. (2007) 82:889–99. doi: 10.1017/ASC2006097
71. Schinckel AP, Mahan DC, Wiseman TG, Einstein ME. Growth of protein, moisture, lipid, and ash of two genetic lines of barrows and gilts from twenty to one hundred twenty-five kilograms of body weight. J Anim Sci. (2008) 86:460–71. doi: 10.2527/jas.2007-0625
72. Nieto R, Lara L, Barea R, García-Valverde R, Aguinaga MA, Conde-Aguilera JA, et al. Response analysis of the iberian pig growing from birth to 150 kg body weight to changes in protein and energy supply. J Anim Sci. (2012) 90:3809–20. doi: 10.2527/jas.2011-5027
73. Strathe AB, Danfær A, Sørensen H, Kebreab E. A multilevel nonlinear mixed-effects approach to model growth in pigs. J Anim Sci. (2010) 88:638–49. doi: 10.2527/jas.2009-1822
74. Vincenzi S, Mangel M, Crivelli AJ, Munch S, Skaug HJ. Determining individual variation in growth and its implication for life-history and population processes using the empirical bayes method. Plos Comput Biol. (2014) 10:E1003828. doi: 10.1371/journal.pcbi.1003828
75. Ferguson NS. Basic concepts describing animal growth and feed intake. In: Gous R, Morris, Fisher TC, editors. Mechanistic Modelling in Pig and Poultry Production. Trowbridge: Cabi (2006). p. 22–53.
76. Magowan E, Mccann MEE, Beattie VE, Mccracken KJ, Henry W, Smyth S, et al. Investigation of growth rate variation between commercial pig herds. Animal. (2007) 1:1219–26. doi: 10.1017/S1751731107000572
77. Gauthier R, Largouët C, Gaillard C, Cloutier L, Guay F, Dourmad JY. Dynamic modeling of nutrient use and individual requirements of lactating sows. J Anim Sci. (2019) 97:2822–36. doi: 10.1093/jas/skz167
78. Pomar J, López V, Pomar C. Agent-based simulation framework for virtual prototyping of advanced livestock precision feeding systems. Comput Electron Agric. (2011) 78:88–97. doi: 10.1016/j.compag.2011.06.004
79. Zuidhof MJ, Fedorak MV, Kirchen CC, Lou EHM, Ouellette CA, Wenger II. System and Method for Feeding Animals. USA Patent Application Us15/283 (2019).
80. Henry Y. Dietary factors involved in feed intake regulation in growing pigs: a review. Livest Prod Sci. (1985) 12:339–54. doi: 10.1016/0301-6226(85)90133-2
81. Bradford MMV, Gous RM. The response of growing pigs to a choice of diets differing in protein content. Anim Sci. (1991) 52:185–92. doi: 10.1017/S0003356100005821
82. Kyriazakis I, Emmans GC, Whittemore CT. The ability of pigs to control their protein intake when fed in three different ways. Physiol Behav. (1991) 50:1197–203. doi: 10.1016/0031-9384(91)90582-9
83. Ferguson NS, Gous RM. The influence of heat production on voluntary food intake in growing pigs given protein-deficient diets. Anim Sci. (1997) 64:365–78. doi: 10.1017/S1357729800015939
84. Kyriazakis I, Emmans GC. The voluntary feed intake of pigs given feeds based on wheat bran, dried citrus pulp and grass meal, in relation to measurements of feed bulk. Br J Nutr. (1995) 73:191–207. doi: 10.1079/BJN19950023
85. Kyriazakis I, Tolkamp BJ, Emmans GC. Diet selection and animal state: an integrative framework. Proc Nutr Soc. (1999) 58:765–72. doi: 10.1017/S0029665199001044
86. Kyriazakis I, Emmans GC. The growth of mammals following a period of nutritional limitation. J Theor Biol. (1992) 156:485–98. doi: 10.1016/S0022-5193(05)80639-3
87. Skiba G. Physiological aspects of compensatory growth in pigs. J Anim Feed Sci. (2005) 14:191–203. doi: 10.22358/jafs/70362/2005
88. Menegat MB, Dritz SS, Tokach MD, Woodworth JC, Derouchey JM, Goodband RD. A review of compensatory growth following lysine restriction in grow-finish pigs. Transl Anim Sci. (2020) 4:531–47. doi: 10.1093/tas/txaa014
89. Pomar C, Hauschild L, Zhang GH, Pomar J, Lovatto PA. Precision feeding can significantly reduce feeding cost and nutrient excretion in growing animals. In: Sauvant D, Van Milgen J, Faverdin, Friggens PN, editors. Modelling Nutrient Digestion And Utilisation In Farm Animals. Wageningen: Wageningen Academic Publishers (2011). p. 327–34. doi: 10.3920/978-90-8686-712-7_36
Keywords: Bayesian inference, body composifion, individual traits, nitrogen excretion, phosphorus excretion, precision feeding, pigs
Citation: Misiura MM, Filipe JAN and Kyriazakis I (2021) A Novel Estimation of Unobserved Pig Growth Traits for the Purposes of Precision Feeding Methods. Front. Vet. Sci. 8:689206. doi: 10.3389/fvets.2021.689206
Received: 31 March 2021; Accepted: 21 June 2021;
Published: 29 July 2021.
Edited by:
Luciano Hauschild, São Paulo State University, BrazilReviewed by:
Robert Gous, University of KwaZulu-Natal, South AfricaArtabandhu Sahoo, Indian Council of Agricultural Research (ICAR), India
Ines Andretta, Federal University of Rio Grande do Sul, Brazil
Copyright © 2021 Misiura, Filipe and Kyriazakis. This is an open-access article distributed under the terms of the Creative Commons Attribution License (CC BY). The use, distribution or reproduction in other forums is permitted, provided the original author(s) and the copyright owner(s) are credited and that the original publication in this journal is cited, in accordance with accepted academic practice. No use, distribution or reproduction is permitted which does not comply with these terms.
*Correspondence: Maciej M. Misiura, m.m.misiura@ncl.ac.uk