Sources, Distribution and Paleoenvironmental Application of Fatty Acids in Speleothem Deposits From Krem Mawmluh, Northeast India
 M. S. Kalpana
 Joyanto Routh
 Susanne Fietz
 Mahjoor A. Lone
 Augusto Mangini6
- 1CSIR-National Geophysical Research Institute, Hyderabad, India
- 2Department of Thematic Studies-Environmental Change, Linköping University, Linköping, Sweden
- 3Department of Earth Sciences, Stellenbosch University, Stellenbosch, South Africa
- 4Department of Geosciences, National Taiwan University, Taipei, Taiwan
- 5Research Center for Future Earth, National Taiwan University, Taipei, Taiwan
- 6Institut für Umweltphysik, INF 229, Heidelberg, Germany
Integrated multiproxy geochemical studies are essential to reconstruct the paleoenvironment through different time scales. Pristine terrestrial archives such as speleothems provide an excellent opportunity to study these changes by measuring the stable isotope and biomarker trends preserved in these records. Here, we investigated fatty acids in drip water, moonmilk, and a stalagmite (KM-1) retrieved from Krem Mawmluh in northeast India to constrain the sources and distribution of these compounds. Besides, we tested their compatibility with established glycerol dialkyl glycerol tetraethers and stable isotope proxies in KM-1 to probe the use of fatty acid-derived proxies for paleoclimate reconstruction. We observe a similar composition of fatty acids in drip water as well as the cave deposits with significantly higher concentrations of fatty acids in drip water (10.6–124 μg/L) and moonmilk (1.32–16.5 μg/g) compared to the stalagmite (0.67–2.09 μg/g). In KM-1 stalagmite, fatty acids and the presence of azelaic acid transported from surface soils indicate that these compounds are derived from bacterial activity both within the cave and the overlying soil cover. The branched C15 fatty acid index (iso+anteiso C15/nC15) increases during the Holocene, suggesting enhanced microbial production under warm/wet conditions. Fluctuations in the fatty acid indices coincide with abrupt shifts in the TEX86 and BIT proxies reflecting the warm/wet Holocene and cold/dry Late Pleistocene. These trends imply the potential use of fatty acids for reconstructing past climate changes in speleothems but need more analytical reference points to provide statistical data.
Introduction
Stalagmites are promising terrestrial archives for past climate reconstructions. They are undisturbed by human activities, can be precisely dated, and record environmental information on the decadal, centennial, or millennial scales (Fleitmann et al., 2003; McDermott, 2004; Lachniet 2009). Stable oxygen isotope (δ18O) and trace element records in stalagmites from around the globe have been studied for climate reconstruction at very high temporal resolution (e.g., Fleitmann et al., 2003; Fairchild and Treble, 2009; Cheng et al., 2012; Dutt et al., 2015). As outcomes of these global efforts, large databases of oxygen and carbon isotope records have been created to provide detailed information to climate researchers (Atsawawaranunt et al., 2018; Comas-Bru et al., 2020).
Stalagmite based oxygen isotope investigations have been particularly successful in gaining new insights on climate variability in Southeast Asia and adjoining regions where monsoons play a dominant role (Lone et al., 2014; Dutt et al., 2015; Sinha et al., 2015; Band et al., 2018; Gautam et al., 2019). The δ18O based climate signals recorded in stalagmites are, however, prone to alteration due to many interrelated factors such as continental effect, moisture source(s), air mass history, temperature, rainout, altitude, orographic effects, evaporation, and mixing of source waters (Lachniet 2009; Cheng et al., 2016). The actual impact of these effects on δ18O trends is highly site-specific and shows varying sensitivities to global vs. local scale changes. Therefore, climate records generated using stalagmites must not be predominantly based on a single or few inter-dependent proxies. Instead, researchers should expand the scope by incorporating multiple independent proxies to make the emergent climate signals far more reliable (Blyth et al., 2008; Blyth et al., 2011; Apaéstegui et al., 2014).
The study of bulk and molecular organic proxies preserved in speleothems has gained momentum over the last 2 decades to infer spatiotemporal changes in the environment (Rousseau et al., 1995; McGarry and Baker, 2000; Xie et al., 2003; Blyth et al., 2007; Rushdi et al., 2011; Yang et al., 2011; Blyth and Schouten, 2013; Blyth et al., 2014; Blyth et al., 2016; Heidke et al., 2018; Baker et al., 2019). In particular, the application of various molecular organic proxies (lipids derived from microorganisms or transported from soil zone) in speleothems have shown promising outcomes (Blyth et al., 2016). This inference is based on the premise that microbial communities adapt to changing environmental conditions leaving distinct organic signatures. These communities inhabit either inside the caves or the overlying soil and epikarst zones. Researchers have focused on the optimization of various sample preparation methods that significantly improved the temporal resolution as well as yields of the targeted lipids to interpret more nuanced source changes (Blyth et al., 2006; Blyth et al., 2007; Huang et al., 2008; Wang et al., 2012; Bosle et al., 2014). Hence, regardless of the low abundance of organic matter (0.01–0.30% of total carbon) and large sample requirement, multiple organic molecular markers, viz. n-alkanes, n-alkanols, fatty acids, n-alkan-2-ones, lignin, and tetraether membrane lipids (glycerol dialkyl glycerol tetraethers; GDGT), have been analyzed in stalagmites and applied to understand the source signals and reconstruct past climatic and environmental changes (Blyth et al., 2016; Heidke et al., 2018).
Xie et al. (2003) were the first to assess the lipid biomarker variations in a stalagmite from the Heshang Cave (HS2 stalagmite) in southern China. They compared the biomarker variation with alkenone-derived sea surface temperatures spanning from 21 to 10 ka BP. They observed that the high molecular weight (HMW) n-alkanols and n-alkan-2-ones originated from the surrounding vegetation, while the low molecular weight (LMW) n-alkanols and n-alkan-2-ones originated from soil organisms. The distinct shifts in the LMW/HMW lipid ratio in the source signal followed the sea surface temperature records indicating a local soil ecosystem response to global climate patterns. Xie et al. (2005) subsequently reported fatty acids derived from various source organisms from the same stalagmite. They indicated recognizing short-scale events such as the cold North Atlantic Heinrich event 1 in the fatty acid composition, e.g., by observing reduced degradation of monounsaturated fatty acids. This event coincided with elevated monounsaturated to saturated C16:1/C16:0 and C18:1/C18:0 ratios and low microbial activity (Xie et al., 2005). Their findings implied a temperature-dependent imprint in the paleo-lipid biomarker composition. Consistent with this idea, monitoring modern drip water from the Heshang Cave revealed a temperature-dependent signal in the ratio of C16:1/C16:0 and C18:1/C18:0 fatty acids (Li et al., 2011).
Yang et al. (2011) reported the distribution of GDGTs in soil, drip water, and stalagmites from the same cave. This study established that most GDGTs in stalagmites are derived from in situ microbial communities within the cave or vadose zone. They indicated a predominance of the isoprenoid GDGT crenarchaeol in stalagmites and weathered rock surfaces, whereas branched GDGTs were more abundant in the overlying soils. The results implied that source and depositional signals could be disentangled based on the distinct GDGT signals that were so far difficult to resolve with confidence. Recently, Huguet et al. (2018) applied GDGT based proxies in combination with high-resolution stable isotope data in stalagmite KM-1 (same stalagmite studied in the present work) from Krem Mawmluh in northeast India. They reconstructed the precipitation pattern resulting from the Indian Summer Monsoon activity in response to paleo-temperature changes from 22 to 6 ka BP. The outcome was a reliable temperature and precipitation reconstruction in KM-1 against which other biomarker proxies could be tested in the same stalagmite as in the present study.
Fatty acids are the dominant and most commonly occurring lipid biomarkers reported in stalagmites (Blyth et al., 2006; Huang et al., 2008; Xie et al., 2003; Xie et al., 2005). In particular, the unsaturated and branched LMW fatty acids have been used to reconstruct past temperature changes (Xie et al., 2005; Blyth et al., 2011). These LMW fatty acids thought to be derived from bacteria, plants, and fungi, can be transported from the overlying soil cover. Bacteria, however, not only produce fatty acids in the cave and soil but also control their degradation. Hence, the distribution of fatty acids may be influenced by temperature or moisture content in the soil zone and inside the cave (Blyth et al., 2011). Consequently, fatty acids have not been pursued widely as robust environmental proxies compared to the more source-specific biomarkers viz., n-alkanes, n-alkanols, n-alkan-2-ones. This study reports for the first time fatty acids examined in an array of samples collected from a karst environment such as drip water, moonmilk, and a stalagmite (KM-1) retrieved from Krem Mawmluh. Further, we traced the compositional changes, distribution, and source(s) of these compounds in the speleothems. We related this information to the paleotemperature and paleohydrological changes inferred earlier based on the GDGT, δ18O, and δ13C signals in the stalagmite KM-1 (Huguet et al., 2018) to provide insights into the complex environmental changes since the Late Pleistocene.
Study Area
Some of the longest and deepest cave systems in the Indian sub-continent are located in Meghalaya in northeast India. Nearly 1,000 caves have developed in a 300 km long narrow belt of diverse sedimentary rocks along the state’s southern and south-eastern borders (Daly, 2006). Krem Mawmluh (Krem means cave in the local Khasi language) located in the Khasi Hills (25°07″; 25°41″N and 91°21″; 92°09″E, altitude 1,290 m) is one of these caves, which is ∼7.1 km long and is listed as the fourth longest cave in India (Figure 1). The cave has been subject to many investigations in recent years (Baskar et al., 2011; Berkelhammer et al., 2012; Breitenbach et al., 2015; Dutt et al., 2015).
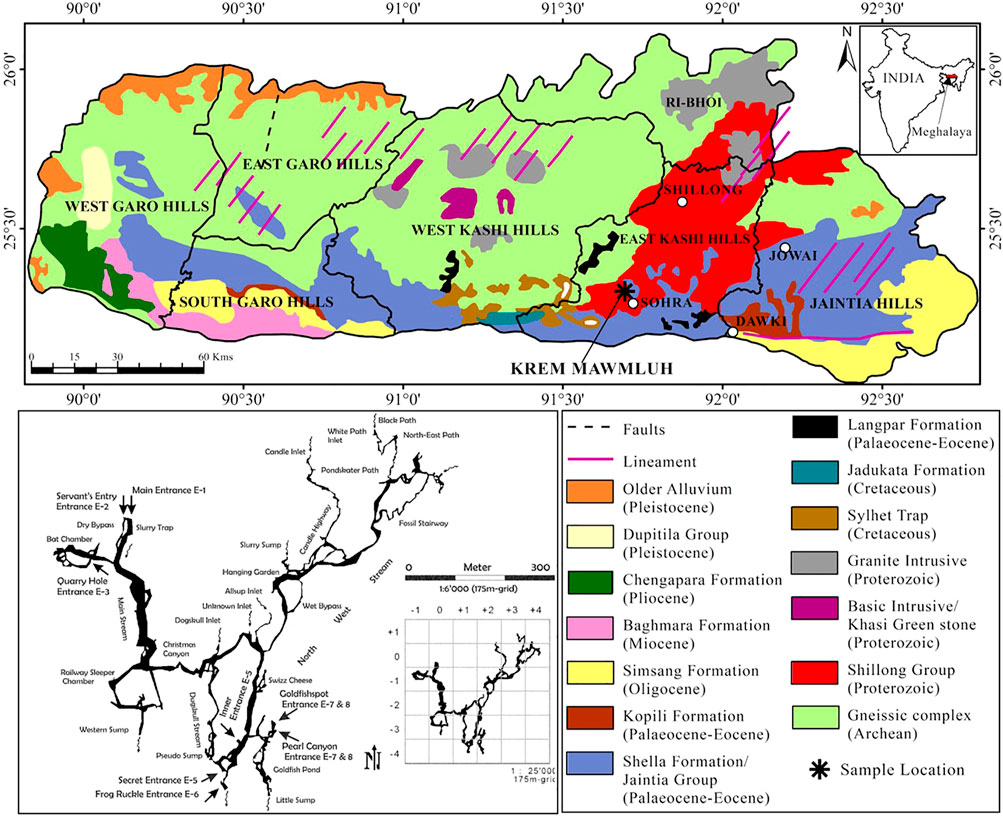
FIGURE 1. Geological map showing the sampling location of KM-1 stalagmite and a sketch of Krem Mawmluh passageways inside the cave in Khasi Hills, Meghalaya (modified after the National Bureau of Soil Survey and Land Use Planning, 1996; Daly 2006).
Lithologically, the Khasi Hills in Meghalaya consists of sandstone and conglomerate of the Jadukata formation (known for its rich uranium deposits) overlying the feldspathic sandstone of the Mahadek formation. The Sylhet limestone belt of the fossiliferous Eocene Shella formation (30–100 m thick) hosts Krem Mawmluh (Figure 1), overlain by a thin soil cover of 5–15 cm in thickness. The cave is overlain by 30–100 m thick and heavily karstified host rock consisting of limestone, sandstone, and a 40–100 cm thick coal layer. Krem Mawmluh is located near Sohra (Cherrapunji; Figure 1), the wettest place on Earth. The dominance of the Indian Summer Monsoon (ISM) characterizes this tropical region, receiving abundant rainfall (∼12,000 mm) from June to September (Murata et al., 2007). The orographic rain results from clouds originating in the Bay of Bengal that drifts towards the Bangladesh plains. These clouds collide with the Khasi Hills and rise to the upper atmosphere to cool down and precipitate. Despite the heavy summer rainfall in Sohra, this region suffers from water shortage during most parts of the year, and precipitation in recent decades has decreased to 8,000–9,000 mm yr−1 (Bhaumik, 2009).
Krem Mawmluh has multiple entrances that lead inside the cave. The cave has beautiful ornamentation with many stalagmites and stalactite-filled hallways developed as a maze of sub-horizontal passageways. The secret entrance E-5 (Figure 1) offers a more accessible and safe path leading into a large chamber above the Goldfish Pond and remains isolated from floodwaters that fill large sections of the cave during heavy rainfall. In this large chamber, we retrieved the 87-cm long KM-1 stalagmite. Drip water seeps through the cracks or stalactites. A notable feature in the cave is the occurrence of sheer moonmilk and cave pearls, which are microcrystalline secondary mineral deposits found on the cave floor in isolated pockets (Baskar et al., 2011). Microbial analysis and scanning electron microscopy in KM moonmilk deposits indicated abundant bacterial population and calcified microbial filaments supporting the biogenic source of these deposits (ibid.). The cave also presents a unique habitat for bats, amphibians, insects, and plants (in the twilight zone). However, blasting of dynamite and pollution associated with intensive limestone mining by the cement factories near Krem Mawmluh have damaged several sections inside the cave (including the main entrance) and other nearby caves in Khasi Hills. Consequently, many of these caves and the unique and fragile ecosystems they support are very vulnerable to irreparable damage (Biswas, 2009).
Materials and Methods
Sampling
We collected drip water samples in acid rinsed glass bottles from four locations on the way to the cave’s inner chamber (near the Goldfish pond, Figure 1), representing both fast and slow drip rates. We made multiple trips to the cave within 1 week to transport speleothem samples and large volumes of water needed for lipid extraction. The total volume of drip water collected from the sites was 25 L in 3 days at S1, 24 L in 7 days at S2 and S4, and the total volume of water collected from site S3 was 2 L in 1 day. We also collected two moonmilk samples (MM-1 and MM-2) from the inner chamber where KM-1 was found and along the passageway leading into the Goldfish pond (Figure 1). The moonmilk slurry was collected with disposable gloves and forceps and then placed into sterilized 250 ml Schott Duran bottles in an icebox and transported to the lab. We stored the moonmilk samples at 4°C in the laboratory until analysis.
The stalagmite KM-1 was split along the growth axis from its center using a diamond drill. A detailed description of the stalagmite chronology and stable isotope analysis is reported in Huguet et al. (2018). Briefly, the U-Th dating of the sample was carried out by drilling samples at various intervals along its growth axis and analyzed on a Finnigan MAT 262 RPQ mass spectrometer. For stable C and O isotope analyses, samples were drilled at every 0.5 cm interval using a Proxxon dental drill and analyzed on a Delta Plus Advantage Isotope Ratio Mass Spectrometer coupled with a Kiel IV automatic carbonate device. The δ18O and δ13C values are reported in standard delta notation as per mil relative to the Vienna Pee Dee Belemnite (V-PDB) standard.
Lipid Extraction
Drip water: The water samples were processed the same day after returning from the cave. We used ENVI™–18 DSK Solid Phase Disk (glass fiber embedded with surface-modified silica (C18 bonded phase from Supelco) to extract lipid biomarkers from drip water samples. The disks were conditioned with dichloromethane (DCM) and ultra-pure water before passing the drip water. After passing the drip water, the ENVI™ disks were wrapped in aluminum foil and refrigerated at 4°C until further extraction. Within 2 weeks after all samples were taken to Sweden, the disks with organic matter sorbed to them were extracted with a mixture of DCM and methanol (9:1 v/v) using an automated solvent extractor (Dionex ASE 300) maintained at 1,000 psi and 100°C in the course of three extraction cycles. We then used the Buchi Syncore Solid Phase Extraction (SPE) module and Sigma Aldrich cartridges packed with 500 mg of aminopropyl stationary phase covered on the top and bottom with a PTFE frit (Russell and Werne, 2007) to separate the total lipid extracts (TLE) into neutral and acid fractions. The cartridges were pre-conditioned with four column volumes of 2:1 DCM: isopropanol mixture. After pre-conditioning, the TLE in DCM: isopropanol solution was loaded onto the cartridge and eluted with 15 ml of DCM: isopropanol (2:1 v/v) and 15 ml of 2% acetic acid in diethyl ether for extracting the neutral and fatty acids, respectively. The neutral and fatty acid fractions were reduced under a gentle stream of nitrogen to dryness.
Moonmilk: We freeze-dried the moonmilk samples, and about 4 g of the sample was taken in the glass culture tubes to extract lipids following the Bligh and Dyer (BD) method (Bligh and Dyer, 1959). A mixture of 5 ml of chloroform, 10 ml methanol, and 4 ml deionized distilled water in the ratio of 1:2:0.8 was added and sonicated for 45 min. After sonication, the sample was centrifuged at 3,000 rpm for 5 min. The organic phase was pipetted into a fresh tube. Two more extractions were performed, and to the resultant extract, equal volumes of chloroform and water (5 ml) were added to separate the aqueous and organic phases. After removing the organic phase, the aqueous phase was extracted twice with 5 ml of chloroform. The organic phase containing the TLE was reduced under a gentle stream of nitrogen. Once the TLE was dry, it was re-dissolved in DCM and activated copper, and left overnight to remove elemental sulfur. The extract was transferred to a fresh vial, and the copper powder was rinsed with additional DCM to ensure that the TLE was recovered completely. After the lipid extraction, calcite was dissolved with 3 M HCl, and the dissolved lipids were extracted using 30 ml of DCM (30 ml × 5 times). The organic solvent in the lipid extract was concentrated by evaporation under reduced pressure using the Buchi Syncore concentrator. The lipids from dissolving the calcite and the TLE from the BD method were combined and further reduced under a nitrogen stream. The extract was fractionated using aminopropyl cartridges as described earlier for the drip water.
Stalagmite: The stalagmite was thoroughly cleaned in deionized filtered water followed by DCM to remove any surface contaminants. The samples for lipid analysis were drilled from the stalagmite along the growth axis using a Proxxon dental drill. We extracted the TLE from ∼10 g of powdered sample drilled from 17 spots along the growth axis. The stalagmite powder was spiked with 20 µl of 500 mg/L deuterated-hexatriacontane as recovery standard, digested with 3 M HCl (70 ml), and reflux heated (see Blyth et al., 2006). After cooling, the total lipids were extracted in a separating funnel using 30 ml of DCM (30 ml × 5 times). The solvent evaporation was performed under reduced pressure using the Buchi Syncore concentrator.
Derivatisation and Quantification
The fatty acid fraction from drip waters and moonmilk and the TLE from stalagmite was reduced to 1 ml and methylated with 3 ml of 14% BF3-methanol at 70°C for 2 h to convert the carboxylic groups to fatty acid methyl esters. After cooling overnight at room temperature and destruction of excessive BF3 complex with ultra-pure deionized water (3 ml), the methylated solution was extracted with hexane (2 ml × 6 times). The hexane extract was reduced to near dryness under a high-grade nitrogen stream. The extract was then derivatized by heating at 70°C for 2 h in a sealed reaction vial with 30 µl of BSTFA (N, O-bis trimethylsilyl trifluoroacetamide) and left overnight (Blyth et al., 2006). The derivatized extract was reduced to dryness under nitrogen and reconstituted in 150 µl of DCM, spiked with deuterated-tetracosane and deuterated-eicosanoic acid methyl ester before analysis. The two procedural blanks and a CaCO3 blank (from Merck) showed minor contamination from short-chain, mainly C16 and C18 fatty acids (Supplementary Figure S3). The average concentrations of C16 and C18 fatty acids in procedural blanks were 0.32 µg/g and 0.13 µg/g, respectively, and similar to the values reported by Blyth et al. (2006) and Huang et al. (2008). The CaCO3 blanks indicated lower values of C16 and C18 fatty acids (0.02 µg/g and 0.01 µ/g, respectively).
Chronology
The age model for stalagmite KM-1 that was derived from twelve 230Th data in stratigraphic sequence published previously in Huguet et al. (2018) is adopted here.
GCMS Analysis
We analyzed the biomarkers on an Agilent 6890N GC coupled to a 5,973 inert mass selective detector. The GC was equipped with a J&W DB-5 (5% phenyl, 95% dimethyl polysiloxane) fused silica capillary column (30 m length × 0.25 mm inner diameter × 0.25 μm film thickness). One microliter of the sample was injected in splitless mode using helium as a carrier gas; the injector temperature was set at 300°C. The operating conditions in the GC oven were as follows: the initial temperature was at 35°C with 1 min hold time followed by ramping from 35 to 130°C at 20°C/min; ramping from 130 to 320°C was at 4°C/min with 15 min hold time. The mass detector was operated in full scan mode with a mass range (m/z) of 50–600 Da under electron impact ionization. The ionization energy was set at 70 eV, source temperature at 230°C, quadrupole temperature at 150°C, and interface temperature at 310°C (Baker et al., 2016). The individual lipid compounds were identified based on their retention times using a standard mixture of fatty acid methyl esters from Sigma Aldrich and matching the mass spectra with the NIST and AOCS Lipid Library. Quantification of fatty acids was based on the GCMS response and comparison of peak areas with known quantities of deuterated eicosanoic acid methyl ester added to the samples before GCMS analysis.
The distribution of fatty acids was used to 1) differentiate the source inputs for organic matter derived from overlying vegetation, algae, as well as microbes including bacteria and fungi within the soil or cave (Ruess et al., 2002; Ouyang et al., 2015; Wang et al., 2019), and 2) reconstruct paleoenvironmental conditions such as temperature and precipitation (Table 1).
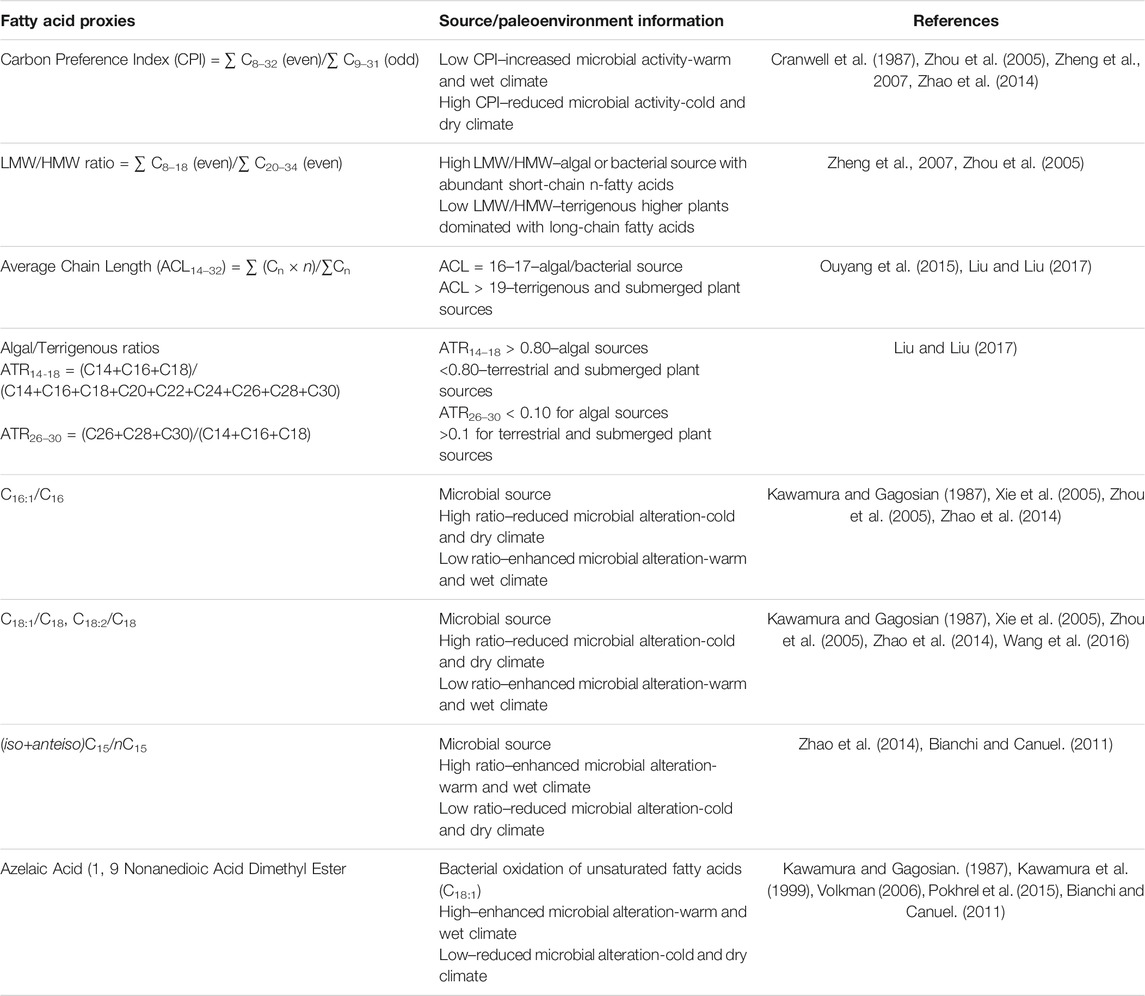
TABLE 1. Fatty acid proxies and interpretation about organic matter sources and paleoenvironment conditions.
Results and Discussion
Distribution and Sources of Fatty Acids
Drip Water
The total fatty acid concentration in drip water samples S1, S2, and S4 range from 10.6–14.6 μg/L. In contrast, S3 shows an anomalously high concentration of 123 μg/L (Table 2). Notably, concentrations of fatty acids in the Krem Mawmluh drip water S1, S2, and S4 are similar to the fatty acid concentrations previously reported for the Heshang cave (∑C12–C20 13.8 μg/L; Li et al., 2011) and Herbstlabyrinth-Adventhöhle Cave System (∑C12–C20 13.7 μg/L; Bosle et al., 2014) during November and January, respectively. The LMW fatty acids (<C20) constitute 91–95% of the total fatty acid pool (Table 2). These LMW compounds are dominated by n-C16 and C18 fatty acids (Supplementary Figure S1). The total concentration of the LMW fatty acids is an order of magnitude higher than all HMW fatty acids (>C20) in S2 and S4. In samples S1 and S3, LMW fatty acids concentration is two orders of magnitude higher than HMW fatty acids (Table 2).
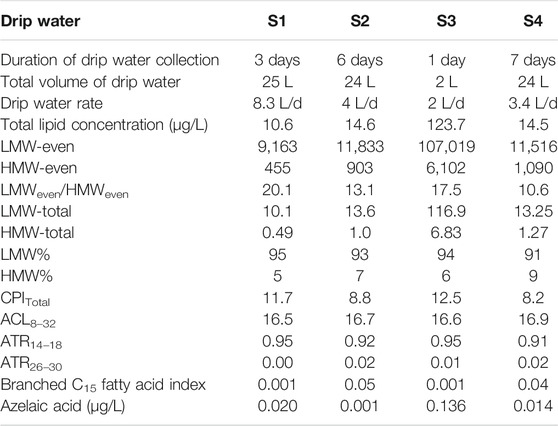
TABLE 2. Total fatty acid concentrations (μg/L) and molecular indices of fatty acids in Krem Mawmluh Drip Water.
We attribute the difference in concentration and composition of fatty acids in drip water to water flow (rate of discharge) at the sampling point. Rushdi et al. (2011) reported that slow infiltration of drip water (long duration) increases the residence time and microbial activity in the overlying soil cover resulting in higher input of soil organic matter indicated by the high concentrations of HMW and LMW fatty acids. Estimated drip rates in Krem Mawmluh are 2 L/d in S3, which increased to 3.4 L/d in S4, 4L/d in S2, and 8.3 L/d in S1 (Table 2). The slowest drip rate (S3) yielded the highest total fatty acid concentration, whereas the fastest drip rate (S1) produced the lowest total fatty acid concentration in Krem Mawmluh. The drip rate may also explain the abundance of regular n-C15 (843 ng/L, 871 ng/L) and n-C15 branched fatty acids (39 ng/L, 32 ng/L; Supplementary Table S2) in samples S2 and S4 (moderate drip rates) that are higher than in S1 (fastest drip rate), but lower than in S3 (slowest drip rate).
While the fatty acid concentration arguably results from infiltration rates, microbial activity during infiltration is also possible. For example, the regular n-C15 fatty acids and their branched homologs are derived from bacterial sources (Bianchi and Canuel, 2011; Zhao et al., 2014), and the microbial activity is expressed as the n-C15 fatty acid index, i.e., branched C15 fatty acid (cf. (iso+anteiso)C15/n-C15). This index shows higher values for S2 and S4 samples (0.05 and 0.04) than S1 and S3, suggesting higher microbial activity. In addition, certain n-alkanedioic acids point to a link between infiltration rate and microbial activity. The n-alkanedioic acids consist of suberic, azelaic, sebacic, and undecanedioic acids with a higher abundance of azelaic acid in S1 (20.0 ng/L) compared to S2 (0.60 ng/L) and S4 (13.9 ng/L) (Table 2). In particular, the high concentrations of azelaic acid and C18:1 in S1 (Table 2) imply a short residence time for infiltrating water due to the fast drip rate, which results in low microbial activity and rapid transport of azelaic acid from the epikarst zones or surface soils. Admittedly, this reasoning does not apply to the high azelaic acid (136 ng/L) and C18:1 (8.9 ng/L) concentration observed in sample S3 (Table 2) that has the slowest drip rate. It appears that in S3, the azelaic acid and C18:1 concentrations remain high (mostly undegraded) despite a relatively long residence time in the epikarst or surface soil.
The distribution and chain length of fatty acids can trace organic matter sources from a wide range such as bacteria, algae, and terrestrial higher plants in lakes and other aquatic environments (Ouyang et al., 2015; Liu and Liu 2017). An algal origin is less likely in speleothems, and the two main end-members for LMW fatty acids are microbes and higher plants (Wang et al., 2019). Due to lack of information, we could not differentiate bacterial vs. fungal sources of LMW fatty acids in the speleothems. Therefore, we refer to these compounds as having a microbial origin. We have included the values of different fatty acid indices in drip water samples in Table 2. In all four drip water samples, the carbon preference index (CPI; ranges between 8 and 12) and LMW/HMW ratio (ranges between 10 and 20) providing the first indication of dominant inputs of microbial fatty acids. The indices varied again between S1/S3 and S2/S4 samples, revealing possible links with the infiltration rate and organisms producing fatty acids. The CPI and LMW/HMW ratios in S2 and S4 (CPI: 8.2–8.8; LMW/HMW: 10.6–13.1) are low compared to S1 (CPI: 11.7; LMW/HMW: 20.1; Table 2) drip water samples. The primary sources of short chain LMW fatty acids in drip water are most likely from in situ microbial production in the percolating surface/groundwater and soil zone, while the longer chain HMW fatty acids are mainly derived from surface vegetation (Blyth et al., 2016). Thus the low CPI and LMW/HMW ratios imply enhanced soil microbial activity and higher inputs of HMW fatty acids from the surface (Cranwell et al., 1987, Zheng et al., 2007), reflecting the slow drip rate and longer residence time at S2 and S4 sites. However, the high CPI and LMW/HMW ratio in the S3 sample (CPI: 12.5; LMW/HMW: 17.5; Table 2), which has the slowest drip rate, is puzzling and points to a differentiated link between source area, microorganisms, and residence time in this particular site.
In addition to the CPI and LMW/HMW ratio indices, we used the ratios ACL14–32, ATR14–18, and ATR26–30 (Table 1) to constrain fatty acids derived from surface algae relative to those from terrigenous higher plants. This differentiation will support our assessment of the source environment. In drip water samples, the values of ACL14–32, ATR14–18, and ATR26–30 range from 16.5 to 17.0, 0.91–0.95, and 0–0.02, respectively (Table 2). If the ATR14–18 and ATR26–30 values are >0.80 and <0.10, respectively, along with low ACL14–32 ratios, they indicate algal-derived organic matter in percolating drip water in Krem Mawmluh. Because algae need sunlight for photosynthesis and this cave is primarily aphotic, we postulate that the algal-derived fatty acids originated at the soil surface and percolated through the soil veneer and fractured limestone. The comparison of fatty acid profiles in the soil cover and drip water would have shed some light on the source of these compounds. However, access to soil profiles near the cave was limited because of the topographic barrier and issues with accessibility near Krem Mawmluh.
In summary, the drip water samples reflect that the organic matter is 1) mainly derived from microorganisms and added during the infiltration process, 2) partially derived from microorganisms at the photic surface, and 3) from surface vegetation. The amount of ex situ material (total lipid concentration) transported with drip water varies about an order of magnitude.
Moonmilk
A previous geomicrobiological study of moonmilk and moonmilk pool waters in Krem Mawmluh indicated many isolated bacterial strains that precipitate carbonates (Baskar et al., 2011). The microorganisms species identified in the moonmilk deposits belong to Bacillus and Actinomycetes, and the richness of species indicates a diverse microbial community inside the cave (ibid). The lipids in both our moonmilk samples (MM1 and MM2; Supplementary Table S3) are predominantly composed of fatty acids, consisting of ∼89% LMW and 11% HMW fatty acids (Table 3). The samples are dominated by n-C16, C18, and C24 fatty acids (Supplementary Figure S2). The total lipid abundances are 16.5 μg/g and 1.3 μg/g in samples MM2 and MM1, respectively (Table 3), including the LMW suberic and azelaic acids (Table 3). Lipid biomarker abundances in Krem Mawmluh moonmilk are lower than the concentrations reported from moonmilk samples analyzed from other caves, such as the Paganella Massif in northeastern Italy (40–88 μg/g; Blyth et al., 2008), implying different biological and chemical processes in their genesis. The lipid biomarker indices (e.g., CPI, ACL, ATR14–18, and ATR26–30) in the Krem Mawmluh moonmilk samples show a substantial similarity with drip water (Table 2). Drip water constrained by various physical and chemical parameters inside the cave can play a fundamental role in speleogenesis. The similarity between moonmilk and drip water in biomarker indices supports an important subaerial provenance of these compounds eventually incorporated in the modern speleothems (besides in situ production) in Krem Mawmluh.
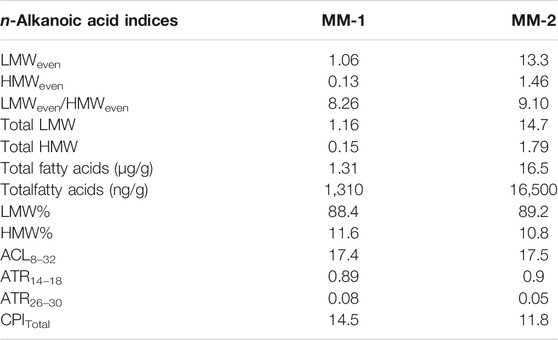
TABLE 3. Molecular indices of fatty acids in Krem Mawmluh moonmilk.
Stalagmite
Modeled 230Th dates indicated the age of stalagmite KM-1 extending from 22.7 ka B.P. (Last Glacial Maximum) to 6.6 ka B.P. (mid-Holocene), covering a period of ∼16,000 years BP (Huguet et al., 2018). The modeled ages reveal a drastic change in growth rate with the onset of the Holocene interglacial climate (Huguet et al., 2018).
The total lipid concentrations in the moonmilk samples are one order of magnitude higher than in KM-1 (Tables 3, 4). The internal standard added to the stalagmite samples indicated a recovery of ∼85%; this suggests that the loss of lipid biomarkers during extraction was minimal. The total fatty acid contents observed in KM-1 (0.67–2.09 μg/g; Table 4) are similar to the total lipid contents in stalagmites from high-altitude caves in northeast Italy (<10 μg/g; Blyth et al., 2008), but low compared to the tropical Heshang Cave (>10 μg/g; Huang et al., 2008).
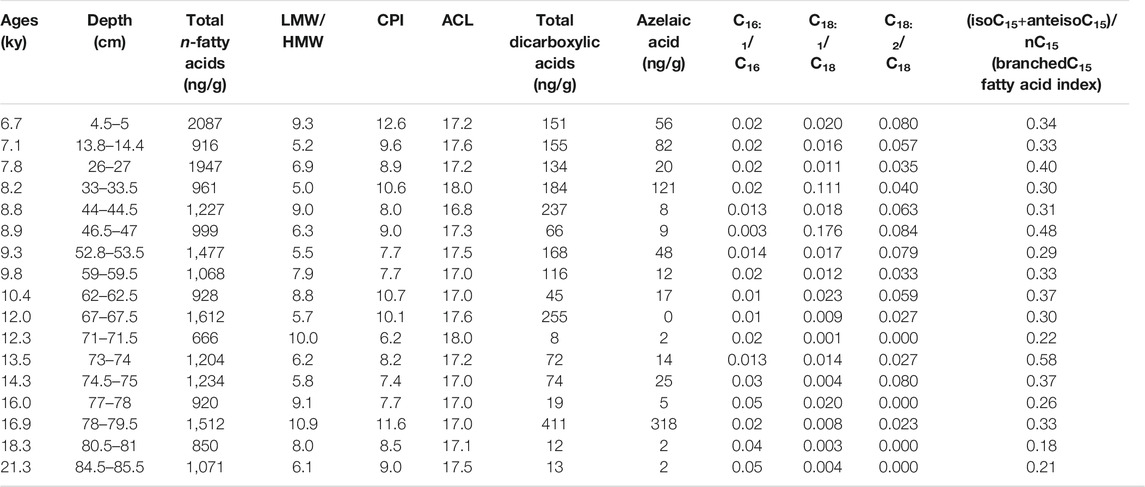
TABLE 4. Total n-alkanoic acid concentrations (ng/g) and different molecular indices in KM-1 stalagmite.
The distribution of lipids also differed in the different sample types. This change in lipid composition reflects provenance changes that are further illustrated and discussed below. Here, we first report the lipid composition in KM-1 contrasted with stalagmite lipid composition worldwide. The total lipid extracts from KM-1 mainly consist of monocarboxylic acids (Supplementary Table S4; Supplementary Figure S4) and dicarboxylic acids (Supplementary Table S5), along with traces of n-alkanes, alcohols, and sterols (data not shown). Similar observations of high concentrations of fatty acids vs. low concentrations or the complete absence of n-alkanes have been reported in other caves, e.g., stalagmites retrieved from the Oregon Caves National Monument (Rushdi et al., 2011) and the Heshang Cave (Huang et al., 2008). Other lipids, such as the n-alkan-2-ones, reported as major lipid components by Xie et al. (2003) in the Heshang cave, were absent in KM-1. The KM-1 samples were also devoid of 3-hydroxy and 2-hydroxy fatty acids that have been reported in stalagmites from Ethiopia, China, and Scotland (Blyth et al., 2006; Wang et al., 2012; Wang et al., 2018).
Short-chain (C8 to C19) LMW n-alkanoic and n-alkanedioic acids, including monounsaturated (C14–C18) and branched (iso- and anteiso-C15 and C17) fatty acids account for ∼88% of total fatty acids, whereas long-chain (C20–C30) HMW fatty acids and n-alkanedioic acids account for ∼12% (Supplementary Table S4; Table 4). The LMW n-alkanoic acid concentrations in KM-1 (0.68–1.75 μg/g) are similar to the abundance of LMW compounds in stalagmites from the Herbstlabyrinth-Adventhöhle cave system in Germany (0.002–1.35 μg/g; Bosle et al., 2014). The ubiquitous palmitic (C16) and stearic (C18) acids dominate the LMW fractions, and C24 dominate the HMW fractions (Supplementary Figure S4). Consequently, the LMW/HMW ratios range from 5.0 to 11 in KM-1, and the CPI and ACL14–32 vary from 6 to 13 and 17–18, respectively (Figure 2).
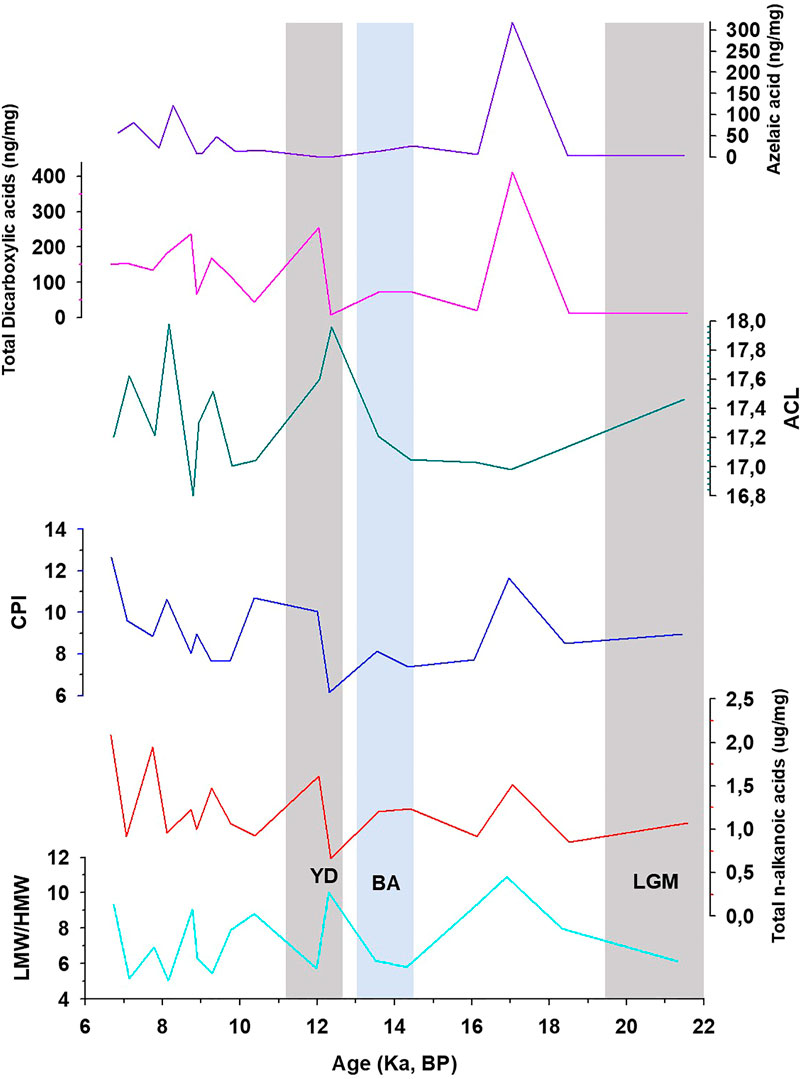
FIGURE 2. Variation of low to high molecular weight ratio (LMW/HMW), total fatty acids Carbon Preference Index (CPI), Average Chain Length (ACL), total concentration of dicarboxylic acids, and azelaic acid in KM-1. LGM, Last Glacial Maximum; BA, Bolling-AllerØd; YD, Younger Dryas.
Biomarker Provenance in Stalagmites
The distribution and composition of fatty acids in KM-1 stalagmite and their comparison with drip water and moonmilk and previously published studies help interpret their sources. Below we discuss whether these compounds in the stalagmite are derived from 1) bacteria, fungi, cyanobacteria, algae, or higher plants, 2) in situ microbial production, or 3) ex-situ production that is transported from the overlying soil cover via drip water.
Source Organisms
The long-chain fatty acids (>C20) are typically derived from higher plant waxes, whereas short-chain fatty acids (<C20) are produced by multiple sources, including algae, fungi, and bacteria (Meyers and Ishiwatari, 1993; Logan and Eglinton, 1994; Blyth et al., 2006; Liu and Liu 2017). The low ACL and ATR14–18 > 0.80 in KM-1 (Table 4) suggest a predominantly bacterial and/or algal source. ATR20–24 ≈ 0.1 in few samples from KM-1 imply minor inputs from higher plant-derived organic matter. To further constrain the sources as bacteria vs. algal-derived matter, we focus on the 3-hydroxy fatty acids. The 3-hydroxy fatty acids are derived from lipopolysaccharides present in cell walls of gram-negative bacteria, and 2-hydroxy fatty acids are derived from lipopolysaccharides in the cell walls of algae and cyanobacteria (Edlund et al., 1985; Mendoza et al., 1987; Wakeham, 1999). The absence of hydroxy acids in the KM-1 stalagmite is consistent with earlier suggestions of low occurrence or absence of gram-negative bacteria (Baskar et al., 2011). Besides, the KM-1 stalagmite was retrieved from the aphotic deep interior (Figure 1), making in situ production by photosynthetic organisms very unlikely. Further, we postulate the fatty acids (iso- and anteiso-C15) identified in KM-1 (Figure 3) are most likely derived from bacterial sources based on the geomicrobiological analysis of KM moonmilk and moonmilk pool waters that have shown high microbial counts with many of the isolated strains precipitating carbonate mineral. The bacteria identified in these deposits belonged to Bacillus spp. and Actinomycetes (Baskar et al., 2011). Based on these trends, we conclude the abundance of palmitic acid (16:0) and stearic acid (18:0), presence of branched fatty acids, and low concentrations of HMW fatty acids in KM-1 stalagmite indicate a predominantly microbial signal. Detailed genetic fingerprinting can likely confirm the microbial diversity of the fatty acids in the future.
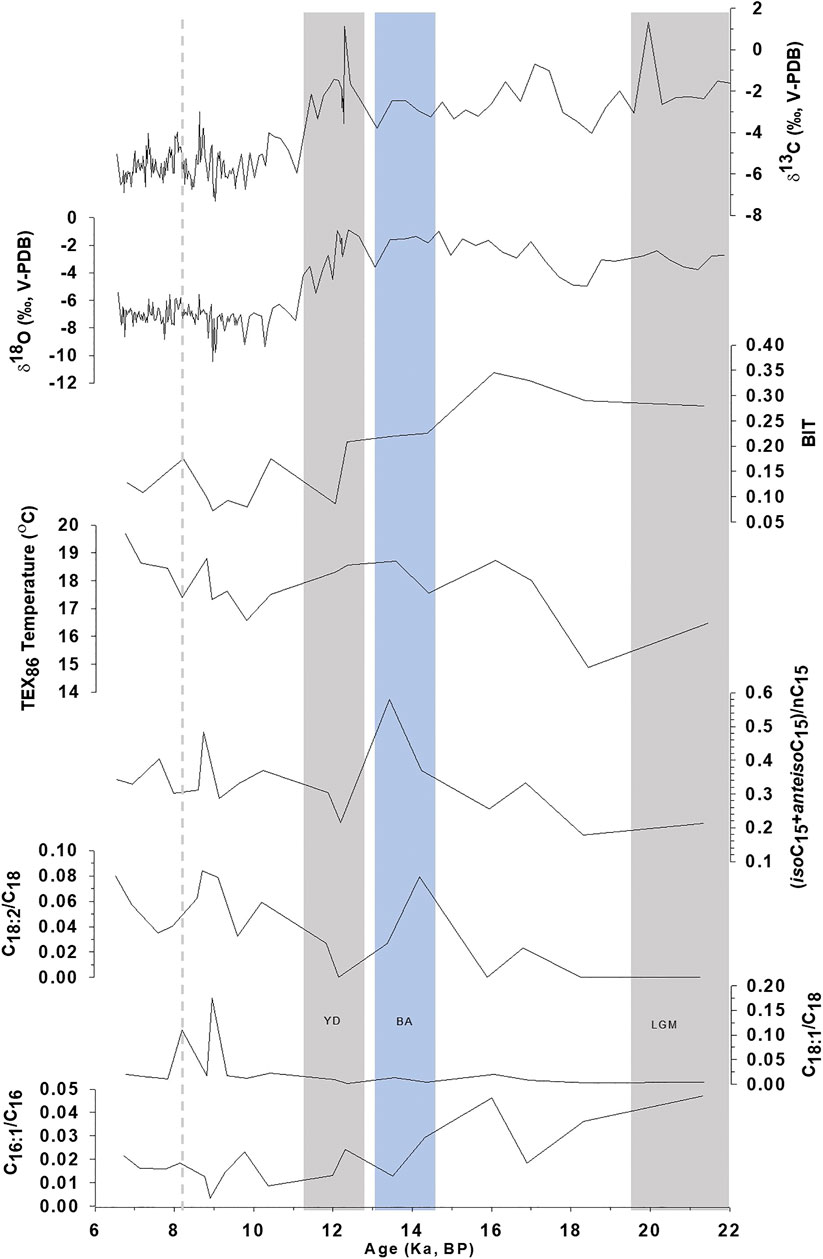
FIGURE 3. Comparison of C16:1/C16:0, C18:1/C18:0, C18:2/C18:0, and Branched-nC15index (iso+anteisoC15/nC15) in KM-1 stalagmite with TEX86, BIT, δ18O, and δ13C records from Huguet et al. (2018).
In-Cave Versus Out of Cave Biomarker Sources
The provenance of lipids in KM-1 is from microbes inhabiting the surface soils, percolating drip water, or compounds produced inside the cave. The lack of input for diagnostic vegetation markers in percolating drip water in the KM-1 samples indicates a predominant microbial origin. This assumption is reflected in the absence of n-alkanes and n-alkan-2-ones in KM-1, arguably due to their absence or low abundance in drip water samples from Krem Mawmluh. A filtration effect is likely to remove large colloidal organic matter seeping through the soil veneer and karst terrain or bind them with the soil matrix in the vadose zone. Perhaps this contributes to some of the loss, but this cannot be assessed in the present study.
Supporting evidence for the ex situ microbial origins of certain lipids in this study is provided by the similar distribution of fatty acids in moonmilk deposits and drip water. Notably, the occurrence of LMW dicarboxylic acids in KM-1, drip water, and moonmilk samples is characterized by the abundance of azelaic acid (C9). Azelaic acid is derived from the photochemical oxidation of unsaturated fatty acids (C18:1) that predominantly have a double bond at the C9 position (Kawamura and Gagosian, 1987). Krem Mawmluh, however, is a deep aphotic cave system with hardly any natural light. Therefore an in situ provenance of azelaic acid resulting from photochemical oxidation of unsaturated fatty acids seems unlikely. Instead, the production of these compounds in the overlying soil zone or pore waters is the most likely source. Thus, varying concentrations of azelaic acid in KM-1 may provide insights into local/regional hydrological changes or flow paths of the percolating rainwater around Krem Mawmluh. A significant concentration of sebacic acid (C10, 26%) and undecanoic acid (C11, 9%; Supplementary Figure S4) also occur in KM-1. These short-chain dicarboxylic acids along with azelaic acid have been reported in marine sediments, ice cores, and aerosols (Kawamura et al., 1999; Pokhrel et al., 2015), and their occurrence is attributed to the oxidative degradation of double bonds in unsaturated fatty acids (Volkman, 2006). The n-alkanedioic acids in KM-1 stalagmite most likely resulted from bacterial oxidation of lipids (Bianchi and Canuel, 2011) in soils that underwent further diagenetic changes before and during the transport of these lipids into the cave.
We compared the fatty acid trends with other proxies to constrain the variation in biomarker sources over time, especially in the stalagmite. Huguet et al. (2018) used isoprenoid and branched GDGTs in KM-1 to indicate a change in regional hydrological conditions. The GDGT-based indication of increasing moisture and in-cave over soil-derived signal during deglaciation is similar to the observed shifts in the fatty acids, particularly in azelaic acid. High concentrations of azelaic acid (360 ng/g; Figure 2) are recorded during the late glacial period (before 12 ka), which indicates that due to the weak monsoon, the drier conditions led to slow percolating waters, which increased the total lipid and azelaic acid levels in drip water. As a result, KM-1 is marked by less in situ production and more surface production, and a higher contribution of lipids from the overlying soils. This dynamic shifts to more vigorous monsoons, faster-percolating waters, and a decrease in total lipid and azelaic acid levels in the drip water occur during the deglacial. As a result, similar to the GDGT-based findings, the deglacial KM-1 is marked by stronger in situ production over the contribution of lipids from the overlying soils. Subsequently, another sharp increase in the concentration of azelaic acid (121 ng/g) occurs at c. 8.2 ka, which is again a dry period and reflects a higher contribution of soil-derived azelaic acid. In summary, the fatty acids 1) support the change in hydrological conditions derived from the GDGT-based proxies in Huguet et al. (2018), and 2) the primary source of these compounds in KM-1 appears to be subaerial pre-12 ka (and subsequent dry events), shifting to a primary in situ organic matter source signal during the wetter Holocene.
Fatty Acid Records in KM-1
C16 and C18 Unsaturation-Based Indices
Despite the low sampling frequency of the biomarker record in KM-1, some distinct variations can be related to paleoclimate changes (Figure 2). The average concentrations of fatty acids are 1.2 μg/g, with the maximum and minimum concentrations recorded during the mid-Holocene ∼6.7 ka (2.1 μg/g) and the Younger Dryas ∼12.3 ka (0.67 μg/g). The high concentrations indicate an increase in microbial activity during warm, wet conditions, while the low concentrations indicate a decrease in microbial activity during cold, dry periods. However, the molecular distribution of CPI and LMW/HMW ratios fluctuates within a narrow range. They do not seem to record explicitly the changes that follow known major climate patterns (e.g., the Last Glacial Maximum, Bolling-AllerØd, or Younger Dryas). In contrast, more distinct changes have been observed in the ratios of unsaturated vs. saturated fatty acids. In this context, the ratios C16:1/C16:0, C18:2/C18:0, and C18:1/C18:0 are sensitive to temperature changes and are considered more promising (Kawamura and Gagosian, 1987; Xie et al., 2005; Zhou et al., 2005; Zhao et al., 2014). For example, Wang et al. (2016) related the abrupt shifts (increase) in the sedimentary C18:2/C18:0 ratios ∼4,400 years BP to climate change (cooling) and prehistoric cultural transition in Yuchisi, China. The unsaturation results from acclimation to ensure cell membrane stability and flexibility (Suutari and Laakso, 1994), but changes influence these trends during degradation or preservation. In KM-1, the C16:1/C16:0 ratio decreases from 0.05 to <0.01 through the glacial-interglacial continuum (Figure 3). The higher C16:1/C16:0 ratios before 12 ka indicate cell membrane acclimation and reduced degradation of the unsaturated acids consistent with the cold and dry conditions during the LGM. In contrast, lower C16:1/C16:0 ratios suggest cell membrane acclimation and increased microbial degradation at times of warmer and wetter conditions during the Holocene. In contrast to the decreasing trend in the C16:1/C16:0 ratios, the C18:1/C18:0 and C18:2/C18:0 ratios increase slightly from the late glacial (<0.01) to the Holocene (0.18). The C18 ratios experience sharp increases in C18:1/C18:0–8.9 ka (0.18) and 8.2 ka (0.11) and C18:2/C18:0–14.3 ka (0.08). These changes do not occur in the C16 ratio (Figure 3). These apparent contradictory trends are similar to the study by Blyth et al. (2011), whereby not all three unsaturated isomers show similar variation.
One reason for the observed mismatch in the fatty acid trends might be the source signal. From the drip water data, it is evident that the S1 sample with a fast drip rate shows C18:1 (0.34 μg/g), but C16:1 is absent or below the detection limit. In contrast, samples S2 and S4 with a slow drip rate indicate that C16:1 occurs in appreciable concentration (3.80 μg/g and 3.20 μg/g, respectively), but C18:1 is absent or below the detection limit. In the moon milk sample MM3, C18:1 and C18:2 are present in large concentrations, but C16:1 is absent or below the detection limit. Based on these observations, it is assumed that the higher values of C18:2/C18:0 in KM-1 during the Holocene and in drip water sample S1 could be related to the fast inflow of drip water during the high monsoon season resulting in lower residence time and a decrease in surface production. This trend preferably leads to the higher inputs of C18:1 compared to C16:1 unsaturated acid. This trend implies that the C16 and C18 unsaturation indices reflect precipitation or moisture and infiltration rate rather than temperature. With the limited data, it is impossible to ascertain the effect of different factors like rate of reaction, temperature, and precipitation effects, influencing the decomposition of diagenetic changes in unsaturated fatty acids behooves further investigations.
C15 and Branched-Based Indices
The branched C15 fatty acid proxy (iso+anteiso C15/nC15) was applied to reconstruct the ISM variability in KM-1. This index was previously referred to as the Bacteria Invasion Index [(iC15:0 + aC15:0)/nC15:0] by Zhao et al. (2014) in organic matter from penguin droppings in sediment cores to trace the historical changes in climate and environment. The C15 index indicated high values during warm periods due to increased contribution from bacterial activity. The basis for proposing the branched C15 fatty acid proxy is that variation in the distribution of C15 fatty acids, alcohols, and 3-hydroxy fatty acids are indicators of microbial activity that correlate with paleoclimatic changes (Huang et al., 2008; Wang et al., 2016; Zhang et al., 2017). Iso- and anteiso branched fatty acids are metabolic products of bacteria synthesized from amino acids (Willecke and Pardee, 1971; Kaneda, 1991; Wakeham and Beier, 1991). Their composition in the cell membrane is modified depending on the temperature to acclimate to changing environmental conditions. At low temperatures, to maintain membrane fluidity, most bacteria synthesize a higher proportion of unsaturated and branched fatty acids (Kaneda, 1991). A high value indicates this for the branched C15 fatty acid index under low temperature. However, some bacteria, such as Bacillus cereus reported in Krem Mawmluh (Baskar et al., 2011), reduce branched fatty acids and increase unsaturated fatty acids at low temperatures (Brillard et al., 2010; de Sarrau et al., 2012). Assuming B. cereus is an essential component of the microbial community, we expect contrary results, i.e., a low branched C15 fatty acid index reflecting low temperature, similar to the Bacteria Invasion Index. In KM-1, the distribution of C15, iso- and anteiso branched fatty acids vary across the glacial-interglacial continuum (Figure 3). The branched C15 fatty acid index in KM-1 ranges from 0.18 to 0.58 with an average value of 0.33 (Figure 3). The average branched C15 fatty acid index values are <0.33 during the pre-12 ka and >0.33 during the post-12 ka intervals. The branched C15 fatty acid index values are the lowest (0.18) during the late glacial period (pre-12 ka) and highest during the Bølling-Allerød (0.58). The low value during the late-glacial period for branched C15 fatty acid index implies low bacterial activity and reduced production of branched fatty acids by B. cereus at low temperatures. Correspondingly, the high C15 fatty acid index during the Bølling-Allerød and Holocene periods implies higher bacterial activity and increased production of branched fatty acids by B. cereus at higher temperatures during the Holocene.
KM-1 Paleohydrological and Temperature Record
Biomarkers, Stable Isotopes, and the Glacial-Interglacial Continuum
We further evaluate the potential of azelaic acid and branched C15 fatty acid proxies from the present study in sync with previously published GDGT, δ18O, and δ13C records (Huguet et al., 2018) to refine the paleotemperature and paleohydrological interpretation in the KM-1 stalagmite (Figure 3). Abrupt shifts of 4.70 and 3.42‰ in the δ18O and δ13C profile in KM-1 after the onset of Holocene imply more intense monsoon and change in vegetation cover during this period in contrast to the late glacial period (Figure 3). The KM-1 stalagmite δ18O profile spanning from ∼22 to 6 ka also concurs with other isotope records from the same cave extending from ∼34 to 5.5 ka (Dutt et al., 2015) and ∼12 to 3.6 ka (Berkelhammer et al., 2012). The branched C15 fatty acid index does not significantly correlate with δ18O and δ13C (Supplementary Figure S6b). Nevertheless, the branched - C15 fatty acid index shows a trend during the last glacial-interglacial periods tracking the shifts in ISM intensity delineated by δ18O and δ13C.
The GDGT-based paleothermometry proxy TEX86 in KM-1 increased from the late glacial to the Holocene (Figure 3), indicating an increase in temperatures from 16.5 to 19.7°C (Huguet et al., 2018). The TEX86 based paleotemperature calibration of modern speleothems with surface temperatures was proposed in investigations led by Blyth and Schouten (2013), Blyth et al. (2016), and Baker et al. (2019). Huguet et al. (2018) indicated the possibility that in Krem Mawmluh, the GDGTs could have migrated inside the cave from overlying soils. This change most likely happened during the glacial to interglacial period, which indicated differences in hydrological conditions. Although branched C15 fatty acid index shows an overall weak correlation with TEX86 in KM-1 (22–6 ka), we observe a distinct relationship during the pre-glacial and post-glacial periods (Supplementary Figure S6a), pointing to a decoupling between TEX86 and branched C15 fatty acid index with shifts in hydrological conditions.
The BIT index (Figure 3) indicates the relative contribution of branched GDGTs produced by soil bacteria than iso-GDGTs produced by Thaumarchaeota (Hopmans et al., 2004). Though BIT vs. azelaic acid does not show a significant statistical correlation, their values show a good relationship during the glacial-interglacial periods. The average azelaic acid concentration (51.3 μg/g) during pre-12 ka is higher than the overall average concentration (46 μg/g; Figure 2). Higher BIT values (∼0.35) indicating more substantial input from terrestrial sources than Thaumarcheotal source observed during the late glacial period coincide with higher azelaic acid concentrations indicating increased input of surface-derived organic matter during low monsoon intensity.
The branched C15 fatty acid index could not capture the short-lived abrupt cold Henrich 1 (H1) event at ∼17 ka due to the low temporal resolution in sampling spanning this period. After ∼16 ka, the branched C15 fatty acid index increases matching the low δ18O values until ∼13.5 ka. These changes result from increased drip water within the cave due to ISM’s strengthening during the warmer Bølling-Allerød period. This finding is consistent with the δ18O record from the Kailash Cave in central India, which refers to increased ISM precipitation during the Bølling-Allerød interstadial (∼14.8–12.6 ka; Gautam et al., 2019). A sharp decline in branched C15 fatty acid index at ∼12.3 ka corresponds to the cold/dry and weak monsoon during the Younger Dryas. The high δ18O and δ13C values at ∼12 ka indicate low drip water input coinciding with a weak monsoon.
The branched C15 fatty acid profile (Figure 3) after ∼12 ka changes drastically again coinciding with an abrupt shift of about ∼5 and ∼3.5‰ in δ18O and δ13C values, respectively (Huguet et al., 2018). This trend illustrates the transition from the cold and dry Younger Dryas to a warm and wet Holocene epoch. The early to mid-Holocene (∼10 to 6.5 ka) is characterized by intense monsoon activity with few abrupt dry events reflected by the branched C15 fatty acid profile in KM-1. The highest branched C15 fatty acid ratio during the post-glacial period occurs ∼8.9 ka along with higher TEX86 has lower δ18O values indicating a warmer period owing to more robust ISM circulation. Likewise, the lower branched C15 fatty acid ratios at ∼8.15 ka are consistent with lower TEX86 and slightly positive δ18O values indicating a cold and dry event during the Holocene (Anderson et al., 2002; Staubwasser et al., 2002; Gupta et al., 2003; Prasad and Enzel, 2006).
Independent biomarker analyses in stalagmites provide a complementary tool to ascertain changes inferred based on stable isotopes and trace metals. This opportunity offers more precision and confidence in interpreting paleoclimate changes. The fatty acid ratios broadly overlap with paleoenvironmental inferred modifications based on other high-resolution proxies investigated in Krem Mawmluh (Berkelhammer et al., 2012; Dutt et al., 2015). However, one of the potential drawbacks is the low-resolution of all biomarker data investigated to date in speleothems retrieved from this cave (Huguet et al., 2018 and current study) and other cave systems too. This disadvantage is partly due to the high sample demand for traditional biomarker analyses implemented in stalagmite research. Hence, further investigations are recommended for alternative analytical methods involving less sample demand, even in low C deposits. For example, extraction-free lipid analyses at μm scale (Wörmer et al., 2014; Alfken et al., 2019) is a promising method that could be applied to selected samples for specific time intervals to deconvolute the nuanced changes in climate reconstruction.
Conclusion
The present study addresses the sources and distribution of fatty acids, the most dominant biomarker lipids found in drip water, moonmilk deposits, and a stalagmite retrieved from Krem Mawmluh in northeast India. The total lipid extracts in moonmilk samples are one order of magnitude higher than in the stalagmite. The composition of fatty acids is similar in all three types of cave deposits investigated in this study. The trends indicate an abundance of saturated palmitic acid (16:0) and stearic acid (18:0), the presence of branched fatty acids, and low concentrations of HMW fatty acids, indicating the microbial origin of these lipids from both in situ as well as surface production. Another important finding in these samples is the abundance of azelaic acid, a novel biomarker derived from unsaturated fatty acids (C18:1), indicating the input of lipids from surface soils. We have also assessed the application of fatty acid proxies to reconstruct the paleoenvironment. The C18:1/C18:0 and C18:2/C18:0 ratios indicate high values during pre-12 ka and low values during the post-12 ka period. In contrast, C16:1/C16:0 shows a reverse trend implying warm climate events recorded by lower ratios. The weak correlation between unsaturated and saturated fatty acid ratios is a drawback in applying them for paleoclimate/paleotemperature reconstruction. This disadvantage is partly due to the low sampling resolution in this study. However, the branched C15 fatty acid proxy denoted as (iso+anteiso C15/nC15) appears to be more sensitive to the last glacial-interglacial climate change. Higher values of branched C15 fatty acid ratios during the Bølling-Allerød interstadial and Holocene suggest enhanced microbial production of branched (iso+anteiso) C15 under warmer/wetter conditions. During weak monsoon events, microbial activity in the cave is reduced due to slow drip water flow resulting in the higher input of soil-derived biomarkers such as azelaic acid from the overlaying karst system. This trend coincides with GDGT based BIT values. Thus, the source of fatty acids in KM-1 is predominantly in situ, with some terrestrial input from the overlying soil zone during intense monsoons. Branched C15 fatty acid ratios are comparable with δ18O, δ13C, and TEX86 paleoclimate reconstruction. The branched C15 fatty acid index unambiguously captures global climate patterns, namely, the LGM, Bølling-Allerød, Younger Dryas, and Holocene. However, more high-resolution studies are required to establish fatty acid-based proxies as a complementary tool for paleoclimate reconstruction.
Data Availability Statement
The original contributions presented in the study are included in the article/Supplementary Material, further inquiries can be directed to the corresponding author.
Author Contributions
JR has carried out the fieldwork and sample collection. Lipid extraction and analyses were led by MSK and JR. AM led the U/T dating. MSK led data interpretation and writing with JR, SF, and MAL. All authors have approved the final version of the paper.
Funding
The project was funded by a grant provided by SIDA to JR (Grant SWE 2009-089).
Conflict of Interest
The authors declare that the research was conducted in the absence of any commercial or financial relationships that could be construed as a potential conflict of interest.
Acknowledgments
We thank SIDA for funding the project. MK thanks Susanne Karlsson and Lena Lundman for their help in the laboratory. JR thanks “Teddy” Kharpam Daly for helping with sampling inside the cave. Suggestions from the reviewers helped in improving the manuscript. MK thanks the Director, CSIR-NGRI for the support extended to this study. SF acknowledges support from the South African National Research Foundation (Grant 93072, 98905). ML acknowledges support from the Ministry of Science and Technology.
Supplementary Material
The Supplementary Material for this article can be found online at: https://www.frontiersin.org/articles/10.3389/feart.2021.687376/full#supplementary-material
References
Alfken, S., Wörmer, L., Lipp, J. S., Wendt, J., Taubner, H., Schimmelmann, A., et al. (2019). Micrometer Scale Imaging of Sedimentary Climate Archives – Sample Preparation for Combined Elemental and Lipid Biomarker Analysis. Org. Geochem. 127, 81–91. doi:10.1016/j.orggeochem.2018.11.002
Anderson, D. M., Overpeck, J. T., and Gupta, A. K. (2002). Increase in the Asian Southwest Monsoon during the Past Four Centuries. Science 297, 596–599. doi:10.1126/science.1072881
Apaéstegui, J., Cruz, F. W., Sifeddine, A., Vuille, M., Espinoza, J. C., Guyot, J. L., et al. (2014). Hydroclimate Variability of the Northwestern Amazon Basin Near the Andean Foothills of Peru Related to the South American Monsoon System during the Last 1600 Years. Clim. Past 10, 1967–1981. doi:10.5194/cp-10-1967-2014
Atsawawaranunt, K., Comas-Bru, L., Amirnezhad Mozhdehi, S., Deininger, M., Harrison, S. P., Baker, A., et al. (2018). The SISAL Database: A Global Resource to Document Oxygen and Carbon Isotope Records from Speleothems. Earth Syst. Sci. Data 10, 1687–1713. doi:10.5194/essd-10-1687-2018
Baker, A., Blyth, A. J., Jex, C. N., Mcdonald, J. A., Woltering, M., and Khan, S. J. (2019). Glycerol Dialkyl Glycerol Tetraethers (GDGT) Distributions from Soil to Cave: Refining the Speleothem Paleothermometer. Org. Geochem. 136, 103890. doi:10.1016/j.orggeochem.2019.06.011
Baker, A., Routh, J., and Roychoudhury, A. N. (2016). Biomarker Records of Palaeoenvironmental Variations in Subtropical Southern Africa since the Late Pleistocene: Evidences from a Coastal Peatland. Palaeogeogr. Palaeoclimatol. Palaeoecol. 451, 1–12. doi:10.1016/j.palaeo.2016.03.011
Band, S., Yadava, M. G., Lone, M. A., Shen, C.-C., Sree, K., and Ramesh, R. (2018). High-resolution Mid-holocene Indian Summer Monsoon Recorded in a Stalagmite from the Kotumsar Cave, central India. Quat. Int. 479, 19–24. doi:10.1016/j.quaint.2018.01.026
Baskar, S., Baskar, R., and Routh, J. (2011). Biogenic Evidences of Moonmilk Deposition in the Mawmluh Cave, Meghalaya, India. Geomicrobiology J. 28, 252–265. doi:10.1080/01490451.2010.494096
Berkelhammer, M., Sinha, A., Stott, L., Cheng, H., Pausata, F. S. R., and Yoshimura, K. (2012). An Abrupt Shift in the Indian Monsoon 4000 Years Ago. Geophys. Monogr. Ser. 198, 75–88. doi:10.1029/2012GM001207
Bhaumik, S. (2009). India’s Wettest Place ‘Lacks Water’. Sohra: BBCAvailable at: http://news.bbc.co.uk/2/hi/south_asia/8378327.stm.
Bianchi, T. S., and Canuel, E. A. (2011). Chemical Biomarkers in Aquatic Ecosystem. New Jersey: Princeton University Press, 385.
Biswas, J. (2009). The Biodiversity of Krem Mawkhyrdop of Meghalaya, India, on the Verge of Extinction. Curr. Sci. 96, 904–910.
Bligh, E. G., and Dyer, W. J. (1959). A Rapid Method of Total Lipid Extraction and Purification. Can. J. Biochem. Physiol. 37, 911–917. doi:10.1139/o59-09910.1139/y59-099
Blyth, A. J., Asrat, A., Baker, A., Gulliver, P., Leng, M. J., and Genty, D. (2007). A New Approach to Detecting Vegetation and Land-Use Change Using High-Resolution Lipid Biomarker Records in Stalagmites. Quat. Res. 68, 314–324. doi:10.1016/j.yqres.2007.08.002
Blyth, A. J., Baker, A., Collins, M. J., Penkman, K. E. H., Gilmour, M. A., Moss, J. S., et al. (2008). Molecular Organic Matter in Speleothems and its Potential as an Environmental Proxy. Quat. Sci. Rev. 27, 905–921. doi:10.1016/j.quascirev.2008.02.002
Blyth, A. J., Baker, A., Thomas, L. E., and Van Calsteren, P. (2011). A 2000-year Lipid Biomarker Record Preserved in a Stalagmite from North-West Scotland. J. Quat. Sci. 26, 326–334. doi:10.1002/jqs.1457
Blyth, A. J., Farrimond, P., and Jones, M. (2006). An Optimised Method for the Extraction and Analysis of Lipid Biomarkers from Stalagmites. Org. Geochem. 37, 882–890. doi:10.1016/j.orggeochem.2006.05.003
Blyth, A. J., Hartland, A., and Baker, A. (2016). Organic Proxies in Speleothems - New Developments, Advantages and Limitations. Quat. Sci. Rev. 149, 1–17. doi:10.1016/j.quascirev.2016.07.001
Blyth, A. J., Jex, C. N., Baker, A., Khan, S. J., Schouten, S., and Schouten, S. (2014). Contrasting Distributions of Glycerol Dialkyl Glycerol Tetraethers (GDGTs) in Speleothems and Associated Soils. Org. Geochem. 69, 1–10. doi:10.1016/j.orggeochem.2014.01.013
Blyth, A. J., and Schouten, S. (2013). Calibrating the Glycerol Dialkyl Glycerol Tetraether Temperature Signal in Speleothems. Geochimica et Cosmochimica Acta 109, 312–328. doi:10.1016/j.gca.2013.02.009
Bosle, J. M., Mischel, S. A., Schulze, A.-L., Scholz, D., and Hoffmann, T. (2014). Quantification of Low Molecular Weight Fatty Acids in Cave Drip Water and Speleothems Using HPLC-ESI-IT/MS - Development and Validation of a Selective Method. Anal. Bioanal. Chem. 406, 3167–3177. doi:10.1007/s00216-014-7743-6
Breitenbach, S. F. M., Lechleitner, F. A., Meyer, H., Diengdoh, G., Mattey, D., and Marwan, N. (2015). Cave Ventilation and Rainfall Signals in Dripwater in a Monsoonal Setting - A Monitoring Study from NE India. Chem. Geology 402, 111–124. doi:10.1016/j.chemgeo.2015.03.011
Brillard, J., Jéhanno, I., Dargaignaratz, C., Barbosa, I., Ginies, C., Carlin, F., et al. (2010). Identification of Bacillus Cereus Genes Specifically Expressed during Growth at Low Temperatures. Appl. Environ. Microbiol. 76, 2562–2573. doi:10.1128/AEM.02348-09
Cheng, H., Edwards, R. L., Sinha, A., Spötl, C., Yi, L., Chen, S., et al. (2016). The Asian Monsoon over the Past 640,000 Years and Ice Age Terminations. Nature 534, 640–646. doi:10.1038/nature18591
Cheng, H., Sinha, A., Wang, X., Cruz, F. W., and Edwards, R. L. (2012). The Global Paleomonsoon as Seen through Speleothem Records from Asia and the Americas. Clim. Dyn. 39, 1045–1062. doi:10.1007/s00382-012-1363-7
Comas-Bru, L., Atsawawaranunt, K., and Harrison, S.SISAL working group members (2020). SISAL (Speleothem Isotopes Synthesis and Analysis Working Group) Database Version 2.0. England: University of Reading. Dataset. doi:10.17864/1947.256
Cranwell, P. A., Eglinton, G., and Robinson, N. (1987). Lipids of Aquatic Organisms as Potential Contributors to Lacustrine Sediments-II. Org. Geochem. 11, 513–527. doi:10.1016/0146-6380(87)90007-6
Daly, K. B. D. (2006). The Caves of Meghalaya. Shillong: The Directorate of Information and Public Relations Government of Meghalaya.
de Sarrau, B., Clavel, T., Clerté, C., Carlin, F., Giniès, C., and Nguyen-The, C. (2012). Influence of Anaerobiosis and Low Temperature on Bacillus Cereus Growth, Metabolism, and Membrane Properties. Appl. Environ. Microbiol. 78, 1715–1723. doi:10.1128/aem.06410-11
Dutt, S., Gupta, A. K., Clemens, S. C., Cheng, H., Singh, R. K., Kathayat, G., et al. (2015). Abrupt Changes in Indian Summer Monsoon Strength during 33,800 to 5500 Years B.P. Geophys. Res. Lett. 42, 5526–5532. doi:10.1002/2015GL064015
Edlund, A., Nichols, P. D., Roffey, R., and White, D. C. (1985). Extractable and Lipopolysaccharide Fatty Acid and Hydroxy Acid Profiles from Desulfovibrio Species. J. Lipid Res. 26, 982–988. doi:10.1016/s0022-2275(20)34302-9
Fairchild, I. J., and Treble, P. C. (2009). Trace Elements in Speleothems as Recorders of Environmental Change. Quat. Sci. Rev. 28, 449–468. doi:10.1016/j.quascirev.2008.11.007
Fleitmann, D., Burns, S. J., Mudelsee, M., Neff, U., Kramers, J., Mangini, A., et al. (2003). Holocene Forcing of the Indian Monsoon Recorded in a Stalagmite from Southern Oman. Science 300, 1737–1739. doi:10.1126/science.1083130
Gautam, P. K., Narayana, A. C., Band, S. T., Yadava, M. G., Ramesh, R., Wu, C.-C., et al. (2019). High-resolution Reconstruction of Indian Summer Monsoon during the Bølling-Allerød from a central Indian Stalagmite. Palaeogeogr. Palaeoclimatol. Palaeoecol. 514, 567–576. doi:10.1016/j.palaeo.2018.11.006
Gupta, A. K., Anderson, D. M., and Overpeck, J. T. (2003). Abrupt Changes in the Asian Southwest Monsoon during the Holocene and Their Links to the North Atlantic Ocean. Nature 421, 354–357. doi:10.1038/nature01340
Heidke, I., Scholz, D., and Hoffmann, T. (2018). Quantification of Lignin Oxidation Products as Vegetation Biomarkers in Speleothems and Cave Drip Water. Biogeosciences 15, 5831–5845. doi:10.5194/bg-15-5831-2018
Hopmans, E. C., Weijers, J. W. H., Schefuß, E., Herfort, L., Sinninghe Damsté, J. S., and Schouten, S. (2004). A Novel Proxy for Terrestrial Organic Matter in Sediments Based on Branched and Isoprenoid Tetraether Lipids. Earth Planet. Sci. Lett. 224, 107–116. doi:10.1016/j.epsl.2004.05.012
Huang, X., Cui, J., Pu, Y., Huang, J., and Blyth, A. J. (2008). Identifying “Free” and “Bound” Lipid Fractions in Stalagmite Samples: An Example from Heshang Cave, Southern China. Appl. Geochem. 23, 2589–2595. doi:10.1016/j.apgeochem.2008.05.008
Huguet, C., Routh, J., Fietz, S., Lone, M. A., Kalpana, M. S., Ghosh, P., et al. (2018). Temperature and Monsoon Tango in a Tropical Stalagmite: Last Glacial-Interglacial Climate Dynamics. Sci. Rep. 8, 23606. doi:10.1038/s41598-018-23606-w
Kaneda, T. (1991). Iso- and Anteiso-Fatty Acids in Bacteria: Biosynthesis, Function, and Taxonomic Significance. Microbiol. Rev. 55, 288–302. doi:10.1128/mr.55.2.288-302.1991
Kawamura, K., and Gagosian, R. B. (1987). Implications of ω-oxocarboxylic Acids in the Remote marine Atmosphere for Photo-Oxidation of Unsaturated Fatty Acids. Nature 325, 330–332. doi:10.1038/325330a0
Kawamura, K., Yokoyama, K., Fujii, Y., and Watanabe, O. (1999). Implication of Azelaic Acid in a Greenland Ice Core for Oceanic and Atmospheric Changes in High Latitudes. Geophys. Res. Lett. 26, 871–874. doi:10.1029/1999GL9000116
Lachniet, M. S. (2009). Climatic and Environmental Controls on Speleothem Oxygen-Isotope Values. Quat. Sci. Rev. 28, 412–432. doi:10.1016/j.quascirev.2008.10.021
Li, X., Wang, C., Huang, J., Hu, C., and Xie, S. (2011). Seasonal Variation of Fatty Acids from Drip Water in Heshang Cave, central China. Appl. Geochem. 26, 341–347. doi:10.1016/j.apgeochem.2010.12.007
Liu, H., and Liu, W. (2017). Concentration and Distributions of Fatty Acids in Algae, Submerged Plants and Terrestrial Plants from the Northeastern Tibetan Plateau. Org. Geochem. 113, 17–26. doi:10.1016/j.orggeochem.2017.08.008
Logan, G. A., and Eglinton, G. (1994). Biogeochemistry of the Miocene Lacustrine deposit, at Clarkia, Northern Idaho, U.S.A. Org. Geochem. 21, 857–870. doi:10.1016/0146-6380(94)90045-0
Lone, M. A., Ahmad, S. M., Dung, N. C., Shen, C.-C., Raza, W., and Kumar, A. (2014). Speleothem Based 1000-year High Resolution Record of Indian Monsoon Variability during the Last Deglaciation. Palaeogeogr. Palaeoclimatol. Palaeoecol. 395, 1–8. doi:10.1016/j.palaeo.2013.12.010
McDermott, F. (2004). Palaeo-climate Reconstruction from Stable Isotope Variations in Speleothems: A Review. Quat. Sci. Rev. 23, 901–918. doi:10.1016/j.quascirev.2003.06.021
McGarry, S. F., and Baker, A. (2000). Organic Acid Fluorescence: Applications to Speleothem Palaeoenvironmental Reconstruction. Quat. Sci. Rev. 19, 1087–1101. doi:10.1016/S0277-3791(99)00087-6
Mendoza, Y. A., Gülaçar, F. O., and Buchs, A. (1987). Comparison of Extraction Techniques for Bound Carboxylic Acids in Recent Sediments. Chem. Geology 62, 321–330. doi:10.1016/0009-2541(87)90094-5
Meyers, P. A., and Ishiwatari, R. (1993). Lacustrine Organic Geochemistry-An Overview of Indicators of Organic Matter Sources and Diagenesis in lake Sediments. Org. Geochem. 20, 867–900. doi:10.1016/0146-6380(93)90100-P
Murata, F., Hayashi, T., Matsumoto, J., and Asada, H. (2007). Rainfall on the Meghalaya Plateau in Northeastern India-one of the Rainiest Places in the World. Nat. Hazards 42, 391–399. doi:10.1007/s11069-006-9084-z
Ouyang, X., Guo, F., and Bu, H. (2015). Lipid Biomarkers and Pertinent Indices from Aquatic Environment Record Paleoclimate and Paleoenvironment Changes. Quat. Sci. Rev. 123, 180–192. doi:10.1016/j.quascirev.2015.06.029
Pokhrel, A., Kawamura, K., Seki, O., Matoba, S., and Shiraiwa, T. (2015). Ice Core Profiles of Saturated Fatty Acids (C 12:0 -C 30:0 ) and Oleic Acid (C 18:1 ) from Southern Alaska since 1734 AD: A Link to Climate Change in the Northern Hemisphere. Atmos. Environ. 100, 202–209. doi:10.1016/j.atmosenv.2014.11.007
Prasad, S., and Enzel, Y. (2006). Holocene Paleoclimates of India. Quat. Res. 66, 442–453. doi:10.1016/j.yqres.2006.05.008
Rousseau, L., Laafar, S., Pèpe, C., and de Lumley, H. (1995). Sterols as biogeochemical markers: Results from ensemble E of the stalagmitic floor, Grotte du Lazaret, Nice, France. Quat. Sci. Rev. 14, 51–59. doi:10.1016/0277-3791(94)00111-N
Ruess, L., Häggblom, M. M., Garcı́a Zapata, E. J., and Dighton, J. (2002). Fatty Acids of Fungi and Nematodes-Possible Biomarkers in the Soil Food Chain?. Soil Biol. Biochem. 34 (6), 745–756. doi:10.1016/S0038-0717(01)00231-0
Rushdi, A. I., Clark, P. U., Mix, A. C., Ersek, V., Simoneit, B. R. T., Cheng, H., et al. (2011). Composition and Sources of Lipid Compounds in Speleothem Calcite from Southwestern Oregon and Their Paleoenvironmental Implications. Environ. Earth Sci. 62, 1245–1261. doi:10.1007/s12665-010-0613-4
Russell, J. M., and Werne, J. P. (2007). The Use of Solid Phase Extraction Columns in Fatty Acid Purification. Org. Geochem. 38, 48–51. doi:10.1016/j.orggeochem.2006.09.003
Sinha, A., Kathayat, G., Cheng, H., Breitenbach, S. F. M., Berkelhammer, M., Mudelsee, M., et al. (2015). Trends and Oscillations in the Indian Summer Monsoon Rainfall over the Last Two Millennia. Nat. Commun. 6, 7309. doi:10.1038/ncomms7309
Staubwasser, M., Sirocko, F., Grootes, P. M., and Erlenkeuser, H. (2002). South Asian Monsoon Climate Change and Radiocarbon in the Arabian Sea during Early and Middle Holocene. Paleoceanography 17, 15. doi:10.1029/2000pa000608
Suutari, M., and Laakso, S. (1994). Microbial Fatty Acids and thermal Adaptation. Crit. Rev. Microbiol. 20, 285–328. doi:10.3109/10408419409113560
Volkman, J. K. (2006). Lipid Markers for marine Organic Matter. Handbook Environ. Chem. 2, 27–70. doi:10.1007/698_2_002
Wakeham, S. G. (1999). Monocarboxylic, Dicarboxylic and Hydroxy Acids Released by Sequential Treatments of Suspended Particles and Sediments of the Black Sea. Org. Geochem. 30, 1059–1074. doi:10.1016/S0146-6380(99)00084-4
Wakeham, S. G., and Beier, J. A.(1991). Fatty Acid and Sterol Biomarkers as Indicators of Particulate Matter Source and Alteration Processes in the Black Sea. Deep-Sea Res. 38, 5943–5968.
Wang, C., Bendle, J. A., Greene, S. E., Griffiths, M. L., Huang, J., Moossen, H., et al. (2019). Speleothem Biomarker Evidence for a Negative Terrestrial Feedback on Climate during Holocene Warm Periods. Earth Planet. Sci. Lett. 525, 115754. doi:10.1016/j.epsl.2019.1157542019
Wang, C., Bendle, J. A., Zhang, H., Yang, Y., Liu, D., Huang, J., et al. (2018). Holocene Temperature and Hydrological Changes Reconstructed by Bacterial 3-hydroxy Fatty Acids in a Stalagmite from central China. Quat. Sci. Rev. 192, 97–105. doi:10.1016/j.quascirev.2018.05.030
Wang, C., Zhang, H., Huang, X., Huang, J., and Xie, S. (2012). Optimization of Acid Digestion Conditions on the Extraction of Fatty Acids from Stalagmites. Front. Earth Sci. 6, 109–114. doi:10.1007/s11707-012-0311-5
Wang, J., Sun, L., Chen, L., Xu, L., Wang, Y., and Wang, X. (2016). The Abrupt Climate Change Near 4,400 Yr BP on the Cultural Transition in Yuchisi, China and its Global Linkage. Sci. Rep. 6, 27723. doi:10.1038/srep27723
Willecke, K., and Pardee, A. B. (1971). Fatty Acid-Requiring Mutant of Bacillus Subtilis Defective in Branched Chain α-Keto Acid Dehydrogenase. J. Biol. Chem. 246, 5264–5272. doi:10.1016/s0021-9258(18)61902-7
Wörmer, L., Elvert, M., Fuchser, J., Lipp, J. S., Buttigieg, P. L., Zabel, M., et al. (2014). Ultra-high-resolution Paleoenvironmental Records via Direct Laser-Based Analysis of Lipid Biomarkers in Sediment Core Samples. Proc. Nat. Acad. Sci. 111, 15669–15674. doi:10.1073/pnas.1405237111
Xie, S., Huang, J., Wang, H., Yi, Y., Hu, C., Cai, Y., et al. (2005). Distributions of Fatty Acids in a Stalagmite Related to Paleoclimate Change at Qingjiang in Hubei, Southern China. Sci. China Ser. D-earth Sci. 48, 1463. doi:10.1360/04yd0155
Xie, S., Yi, Y., Huang, J., Hu, C., Cai, Y., Collins, M., et al. (2003). Lipid Distribution in a Subtropical Southern China Stalagmite as a Record of Soil Ecosystem Response to Paleoclimate Change. Quat. Res. 60, 340–347. doi:10.1016/j.yqres.2003.07.010
Yang, H., Ding, W., Zhang, C. L., Wu, X., Ma, X., He, G., et al. (2011). Occurrence of Tetraether Lipids in Stalagmites: Implications for Sources and GDGT-Based Proxies. Org. Geochem. 42, 108–115. doi:10.1016/j.orggeochem.2010.11.006
Zhang, Y., Meyers, P. A., Gao, C., Liu, X., Wang, J., and Wang, G. (2017). Holocene Climate Change in Northeastern China Reconstructed from Lipid Biomarkers in a Peat Sequence from the Sanjiang Plain. Org. Geochem. 113, 105–114. doi:10.1016/j.orggeochem.2017.07.018
Zhao, J., Zhang, H., Han, Z., Liu, G., and Lu, B. (2014). The Vicissitudes of Microorganism and Vegetation Recorded by Lipid Biomarkers in the Antarctic Penguin Habitat and Their Implications for Climate Change. Acta Ecologica Sinica 34, 277–283. doi:10.1016/j.chnaes.2014.07.001
Zheng, Y., Zhou, W., Meyers, P. A., and Xie, S. (2007). Lipid Biomarkers in the Zoigê-Hongyuan Peat Deposit: Indicators of Holocene Climate Changes in West China. Org. Geochem., 38 1927–1940.
Keywords: drip water, moonmilk, stalagmite, fatty acids, paleoclimate, Indian monsson
Citation: Kalpana MS, Routh J, Fietz S, Lone MA and Mangini A (2021) Sources, Distribution and Paleoenvironmental Application of Fatty Acids in Speleothem Deposits From Krem Mawmluh, Northeast India. Front. Earth Sci. 9:687376. doi: 10.3389/feart.2021.687376
Received: 29 March 2021; Accepted: 21 June 2021;
Published: 05 July 2021.
Edited by:
Steven L. Forman, Baylor University, United StatesCopyright © 2021 Kalpana, Routh, Fietz, Lone and Mangini. This is an open-access article distributed under the terms of the Creative Commons Attribution License (CC BY). The use, distribution or reproduction in other forums is permitted, provided the original author(s) and the copyright owner(s) are credited and that the original publication in this journal is cited, in accordance with accepted academic practice. No use, distribution or reproduction is permitted which does not comply with these terms.
*Correspondence: Joyanto Routh, joyanto.routh@liu.se