
Degradation of Polymetallic Nodules in Deep-Sea Multi-Stage Lifting Motor Pump


1
College of Mechanical and Electrical Engineering, Central South University, Changsha 410083, China
2
National Key Laboratory of Deep-Sea Mineral Researches Development and Utilization Technology, Changsha 410083, China
*
Author to whom correspondence should be addressed.
Minerals 2021, 11(6), 656; https://doi.org/10.3390/min11060656
Submission received: 2 May 2021
/
Revised: 17 June 2021
/
Accepted: 18 June 2021
/
Published: 21 June 2021
(This article belongs to the Special Issue Deep-Sea Ferromanganese Nodules and Related Mineral Resources: Genesis, Exploration, and Mining)
Abstract
:The polymetallic nodules in the deep-sea multi-stage lifting motor pump will undergo repeated impeller blade impact and fragmentation, which will change the particle size, thereby affecting the number of ores that can be recovered on the surface and the design parameters of the processing equipment. A new calculation method of degradation rate is proposed. The degradation model of multiple impacts of particles is improved to quantitatively calculate the final particle size distribution (PSD) of polymetallic nodules transported from the Clarion Clipperton Zone (CCZ) to the ground through a series of multi-stage lifting electric pumps. The newly proposed calculation method is obtained by analyzing the degradation of experimental data of polymetallic nodules when they pass through the six-stage lifting motor pump experimental system many times. The improved model is used to predict the PSD of the nodules after running for 10 min in the experimental system, and compared with the experimental test results, the deviation is small. The new method can estimate the change in PSD of nodules due to degradation during transportation, reducing design costs for land processing equipment.
1. Introduction
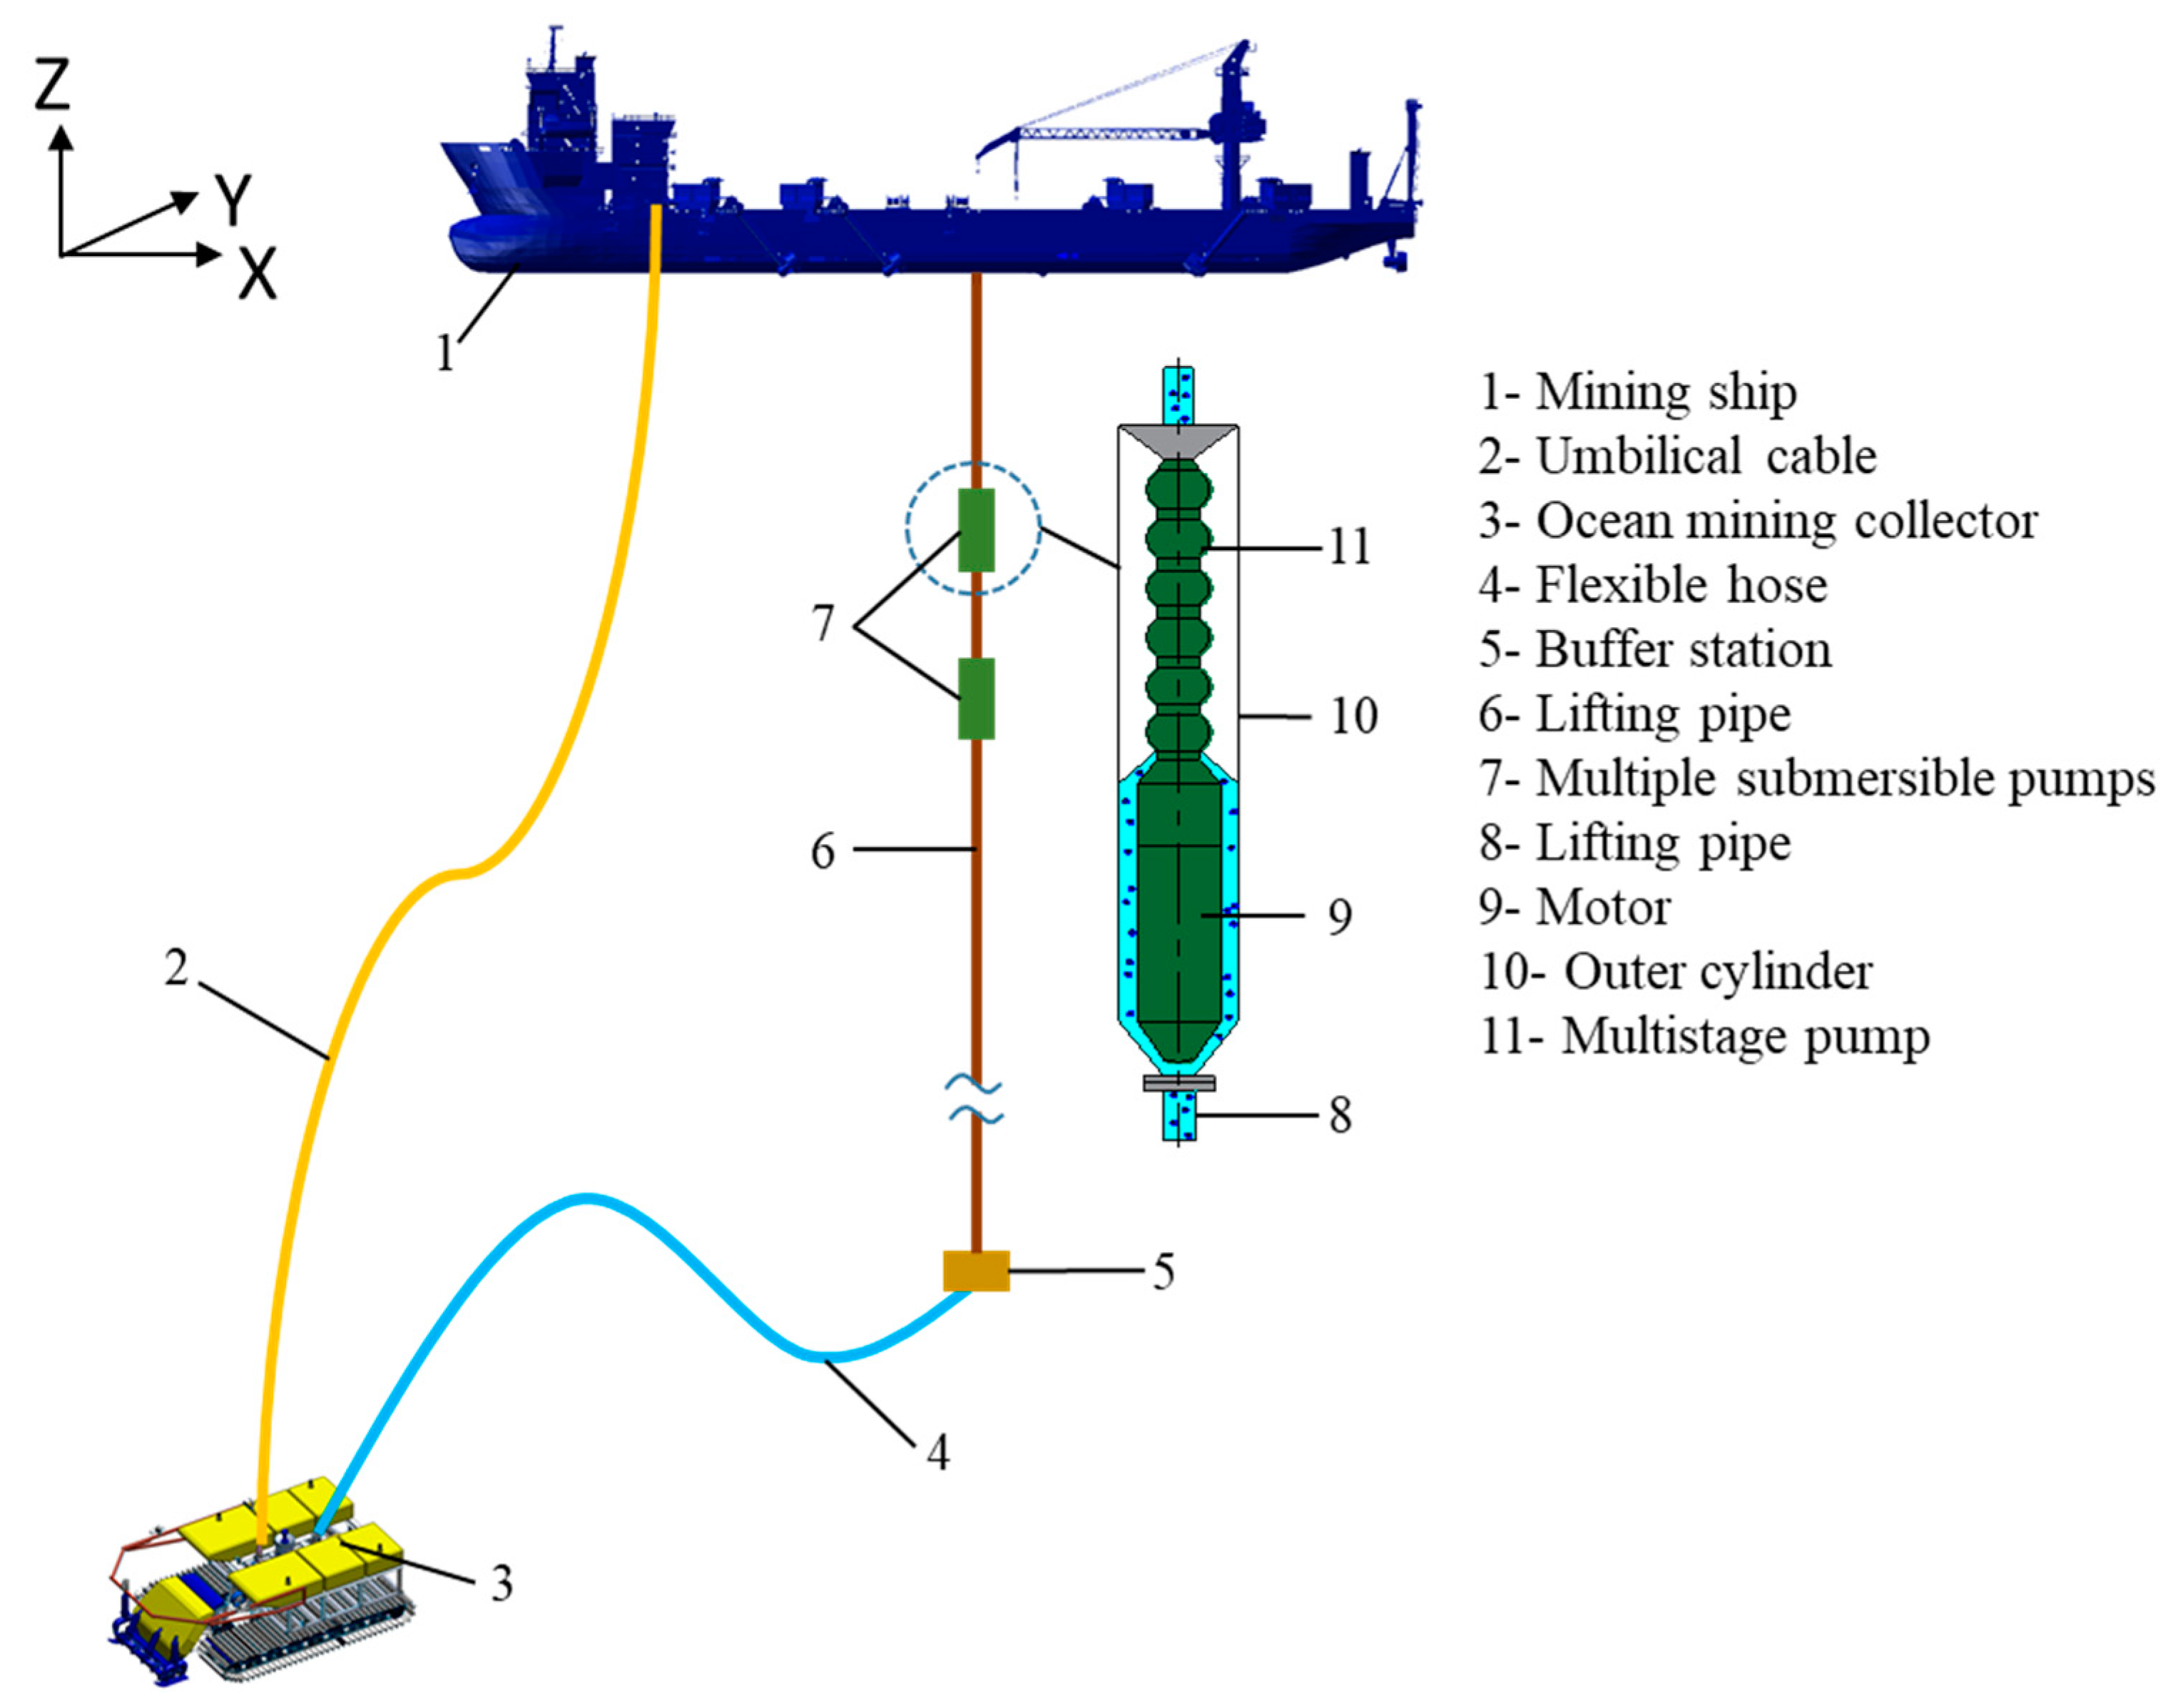
Mineral resources are important resources for human survival and development. With the rapid development of industrialization, land mineral resources cannot meet people’s huge demand for metal resources, and people are beginning to turn their attention to ocean exploration [1,2]. The ocean area accounts for about 70% of the earth’s surface area, and the seabed contains rich mineral resources [3]. The polymetallic nodules found on the deep seabed of most ocean basins contain millions of tons of key metals such as nickel, copper, cobalt, and manganese, making them a target for energy needs in the future. In the deep-sea mining system, hydraulic lifting pipeline transportation is currently recognized as one of the most feasible process methods [4]. The polymetallic nodules are hydraulic transported from the Clarion Clipperton Zone (CCZ) at depths of around 5000 m to the sea surface required through several thousand meters of vertical pipelines and a series of multi-stage deep-sea lifting motor pumps. The nodules will inevitably degrade in this process, and the reasons for the degradation are complex. The friction of the pipe wall, the impact fragmentation of the impeller of the lifting motor pump, and the interaction between particles will all cause the reduction of particle size.
The degradation process can be divided into four forms: attrition, fragmentation, abrasion, and chipping, determined by the direction and magnitude of the force on the particles during transportation [5]. Particles mainly impact fracturing in the lifting motor pump, while abrasion mainly occurs in the pipeline [6]. The volume fraction of large particles near the pipeline wall is tiny or even close to zero [7]. The wear rate of fine particles on the pipeline wall is very low [8]. Therefore, it can be considered that the degradation of nodules in the transportation process is mainly due to the impact of the centrifugal pump, and the pipeline wall has a weaker effect on the particles. In order to meet the needs of high heads, many countries have developed multi-stage lifting motor pumps [9,10,11,12]. Figure 1 shows a traditional hydraulic polymetallic nodule mining system using a series of lifting motor pumps. The nodules will be impacted by the impeller multiple times in each stage of the multi-stage lifting motor pump, which causes the nodules to be fractured by the pump during the transportation process more severely.
In the field of studying powder rupture, the methods and models used can provide reference for us to study the degradation of nodules. Pitchumani et al. [13,14] used two different repeated impact test devices to study particle breakage. Reynolds et al. [15] reviewed the research on how new particles are generated after particle breakage. To the degradation of particles, the speed and humidity of the slurry should be considered, and the strength of the particles is also an important parameter. In addition, wet particles need to consider the porosity between the particles. At present, some physical and mechanical properties of polymetallic nodules have been measured, but researchers did not relate the measured data with particle degradation [16]. In order to explore the degradation of seabed minerals, Yamazaki [17] used a small centrifugal pump connected to a set of rectangular pipelines to test the seabed sediments in the two different mining areas for 30 min. After the test, the coarse particles became powdery particles, and it was found that the particle size would not continue to decrease after reaching a lower limit. Zenhorst [18] used a similar test device to make the polymetallic nodules slurry run ten times in the test device at a flow rate of 4 m/s and observed that the particle size will gradually approach a minimum size. The pressure of particles under the deep sea is different from the pressure under the atmosphere. The environmental pressure of nodules at depths of 5000 m in the deep sea is 50 MPa, and it takes more energy to rupture minerals under high-pressure conditions [19]. Van Wijk [20] studied the impact fragmentation of polymetallic nodules in a single centrifugal pump under different ambient pressures and calculated the degradation rate of the 16–32 mm size class at different pump speeds. However, it was found that ambient pressure had no significant effect on the degradation of nodules. The degradation of nodules was closely related to the nodule velocity and the rotating speed of the impeller.
After the mixed slurry of nodules is degraded by hydraulic transportation, the final PSD that leaves the hydraulic transportation system to reach the mining vessel is extremely important for processing equipment. When the seabed minerals reach the sea surface, they usually need to be screened, crushed step by step, dewatered and ground multiple times (particles between 0.5 and 2 mm can usually be directly ground) and other processing procedures according to their PSD to facilitate the later extraction of precious metals inside [21]. At present, it is very technically difficult to recover the fine nodules with particle size less than 8 μm produced after the degradation of nodules, and they will eventually be discharged back into the sea [22]. This not only means the loss of the mass of valuable minerals, but also affects the surrounding marine environment. The distribution position and radial movement of particles of different sizes in the riser are different during the lifting process, which will affect transportation [23]. The particle size is also related to the collision and erosion of the impeller [24,25]. When designing the lifting equipment of the hydraulic transportation system, it is necessary to consider the degradation of the nodules during the transportation process and the variability of the particle size. Therefore, estimating the percentage of each particle size class after degradation is of great help to our processing equipment design and improvement of lifting equipment, and it is essential to investigate the degradation rate of nodules, establish a particle size prediction model, and realize the quantitative calculation of the PSD after the degradation of the nodules.
Some particle degradation models have been proposed and used to calculate the size change of particles during impact fragmentation. Based on Wilson and Addie (1997) [26], Van Wijk [7] proposed an exponential decay degradation model of particle size by pump impact and used Zenhorst [18] data to estimate the degradation rate of nodule. The exponential decay degradation model of Pitchumani [14] is aimed at the mass fraction of the particle size class. Chapelle et al. [27,28] described the degradation model in the form of a matrix. The coefficients in the matrix follow the principle of species redistribution. For example, after an impact, a% of the particles will remain in the original size class, b% of the particles will move from another size class to this size class, and z% of the particles will move out of the original size category. On the basis of Chapelle et al., Van Wijk [22] defined the matrix with three empirical parameters and used a single polymetallic nodule for repeated impact tests. The test determined the values of three empirical parameters at different impact speeds, and the results predicted by the model are consistent with the experimental results. However, the model needs to assume a parameter value α in advance.
The degradation rate of polymetallic nodules during vertical hydraulic transportation (especially when passing through multiple multi-stage lifting motor pumps) is an important parameter to quantify the PSD of slurry particles after leaving the hydraulic transport system. The nodules will enter the flexible hose first during transportation (Figure 1). Due to the structure of the flexible hose, the mixed slurry of nodules will be stratified and form a sliding bed, which will cause attrition under the action of particles and particles. Then, the nodules enter the vertical riser and flow as a homogeneous suspension. The nodules close to the wall will cause particle abrasion due to sliding, while the nodules inside the riser will cause slight impact fragmentation, chipping, and attrition due to the particle–particle interaction [8]. When the nodules enter the lifting motor pump, they collide with the wall of the impeller and suffer a strong impact force. Then, under the particle–wall and particle–particle interaction, the nodules are fractured, which causes the particles to degrade. By predicting the degraded PSD of nodules, it can provide a reference for the improvement of lifting and reduce the design cost of processing equipment. This article mainly studies the fracturing of nodules in the lifting motor pump, with a sidestep to the degradation of nodules in the riser. However, the current research on the degradation of polymetallic nodules is mostly concentrated on single-stage centrifugal pumps, and there are a lack of data and effective calculation methods to predict the PSD after particle degradation. In this study, the wet polymetallic nodules recovered from the China contract area in the CCZ were used to multiple impact fragmentation on the deep-sea six-stage lifting motor pump experimental system, and the degradation process of the nodules in the six-stage lifting motor pump was studied.
2. Particle Impact Fragmentation Analysis
2.1. Susceptibility of Collision
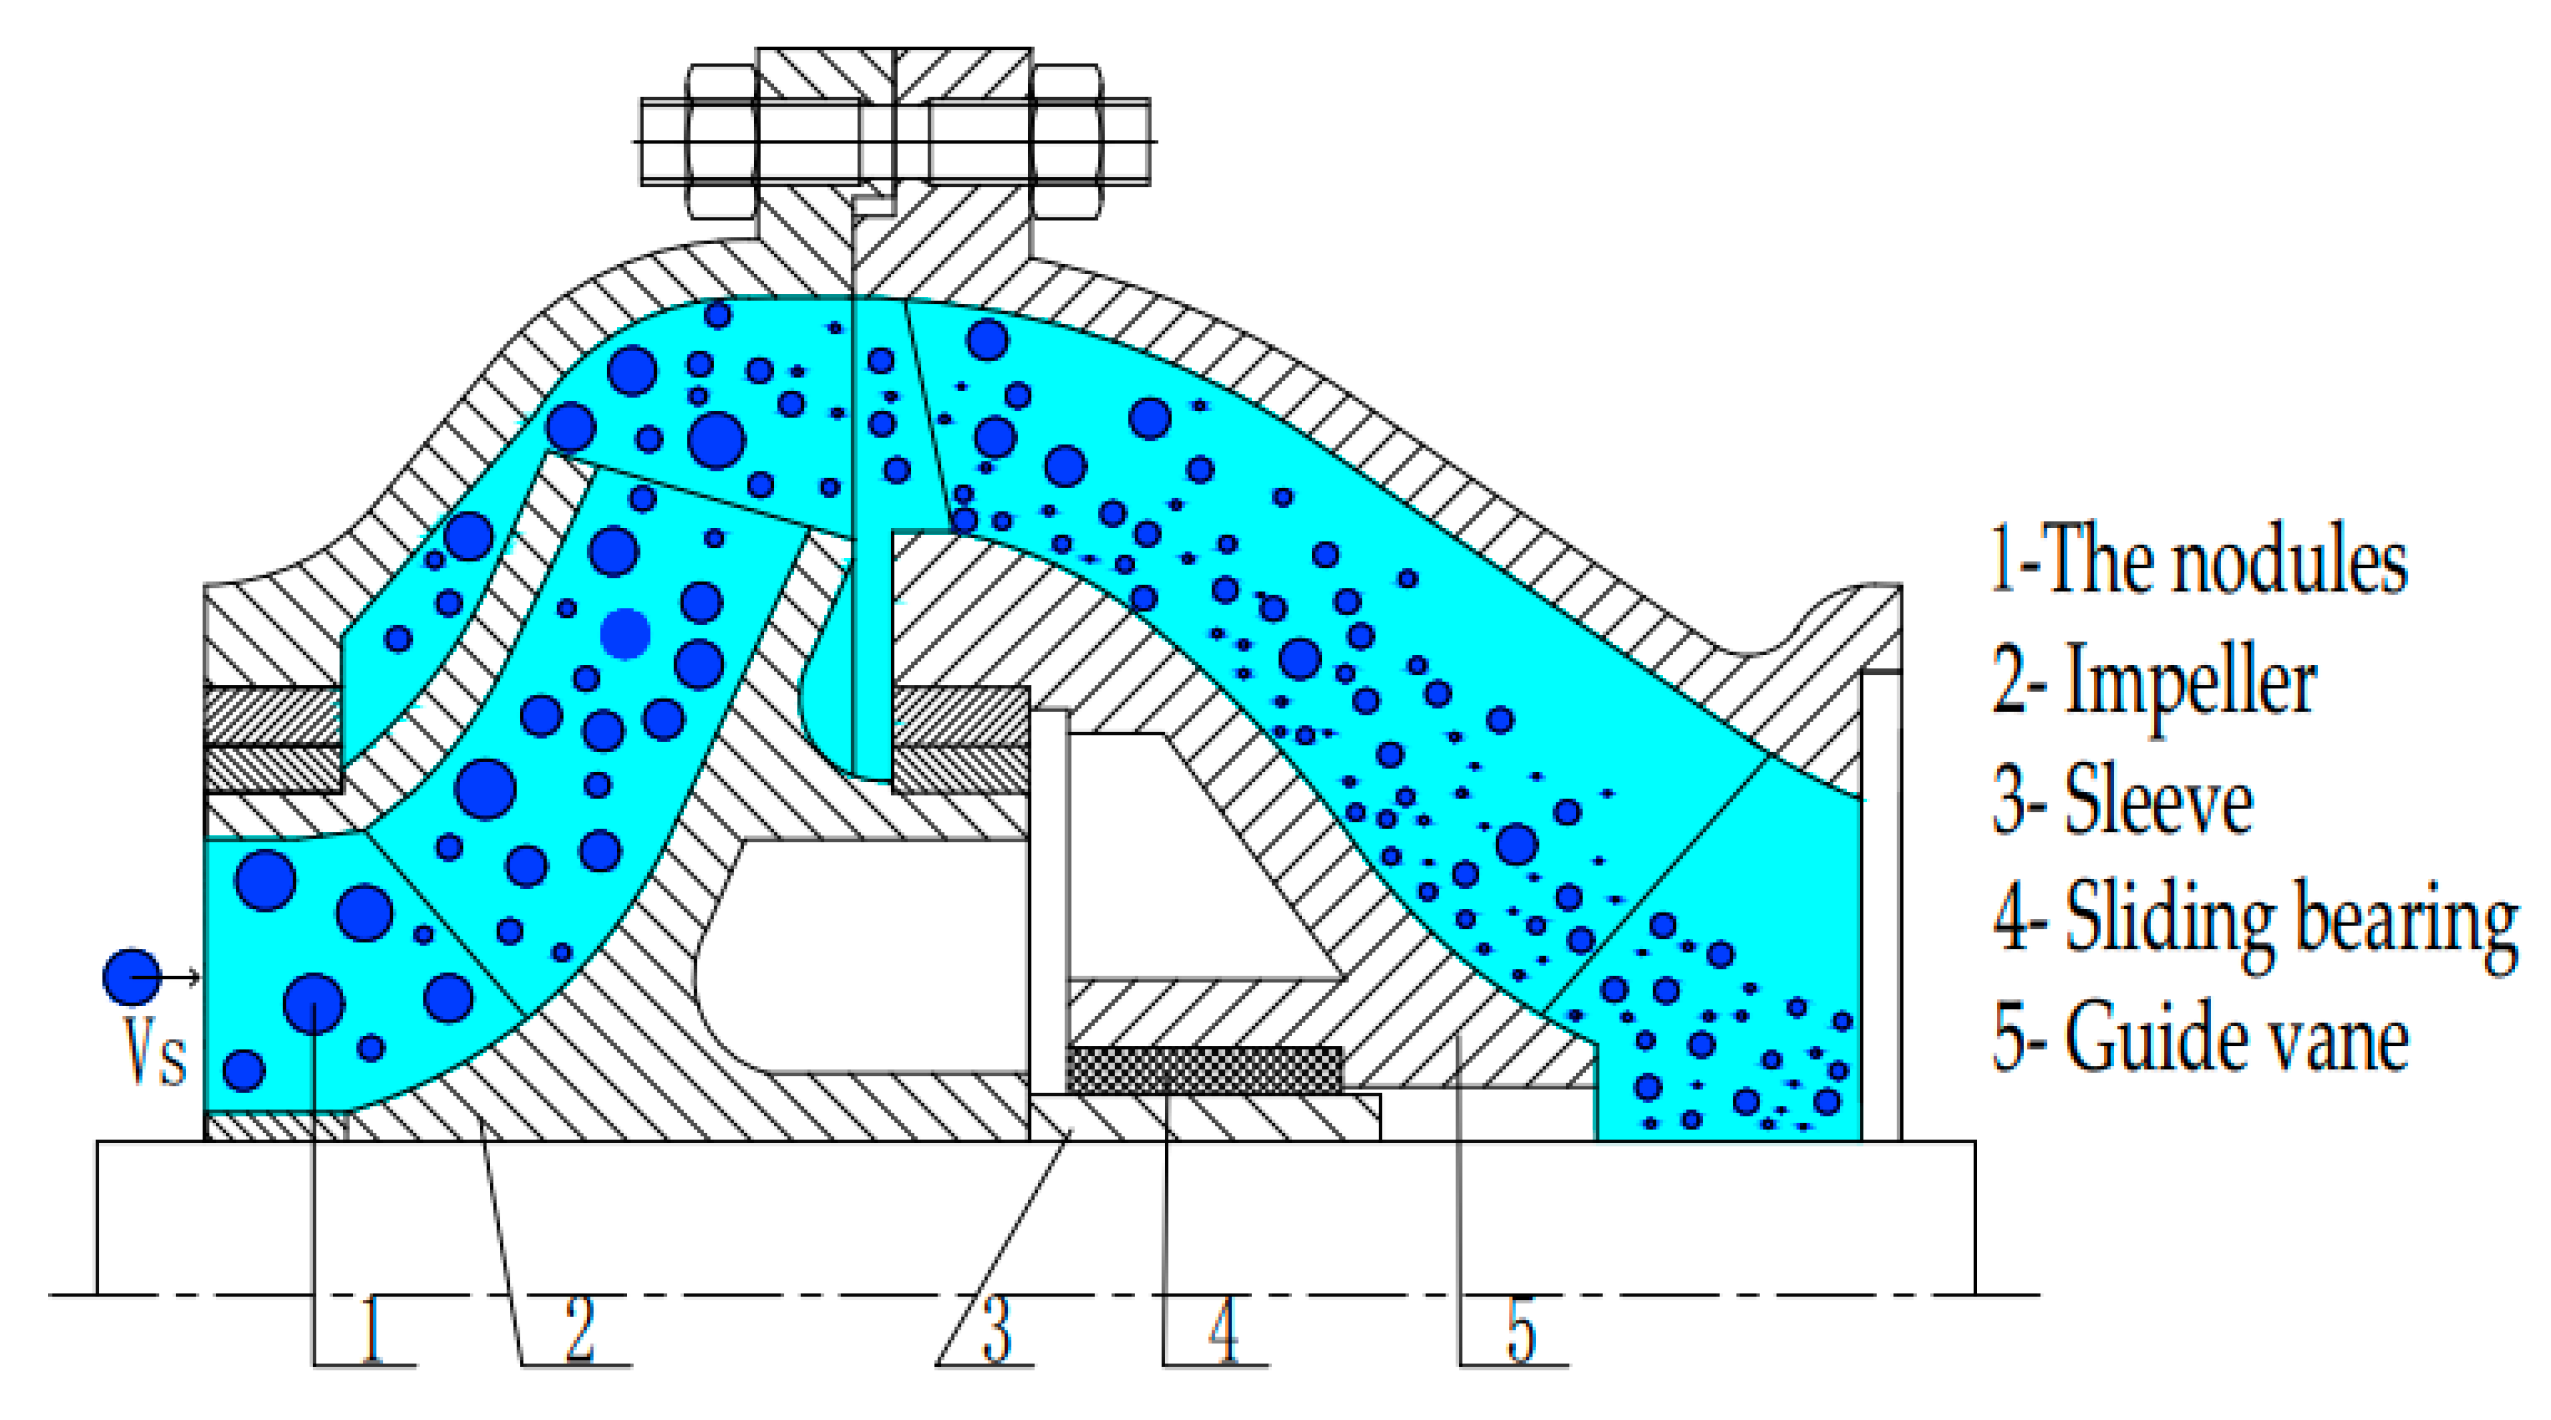
The deep-sea lifting motor pump has multi-stage space guide vanes, which can stabilize the flow of nodule slurry. The flow of nodules in the single-stage lifting motor pump is shown in Figure 2. Assuming that a single spherical nodule enters the multi-stage electric pump, it is parallel to the pump rotation axis, and the particle velocity is equal to the volume velocity of the mixed slurry vs = vf. The interaction between the nodules and the lifting motor pump is divided into four dominant stages. The first stage is when the nodules collide with the head of the impeller at the entrance, and then, the angle is changed to move again in a new direction. In the second stage, the nodules collide with the inner wall of the pump or the impeller blades for the second time, and they continue to change the angle to enter the space guide vane. In the third stage, the nodules collide with the space guide vane, and under the action of the space guide vanes, the moving direction is parallel to the pump rotation axis again. Finally, the nodules leave the space guide vane and enter the next-stage lifting pump; then, they repeat the above impact process.
The susceptibility of particle collision can be judged by the Stokes number (St). The Stokes number describes the inertial effect of particles in the flow field. When St << 1, the particles have no significant inertia effect and are easily followed by liquid flow in the pump due to the influence of the external flow field. When St >> 1, it means that the inertial effect of the particles is high, and the particles are hardly affected by the external flow field and thus escape from the flow field. The St can be calculated by the ratio of the particle reaction time tp to the timescale of the environment tf:
The particle reaction time tp is defined as 63% of the time required for the particle to reach the terminal settling velocity wt from the initial position [29]. The reaction time of nodules in the flow process is related to the diameter and density of nodules. The density ρs of deep-sea polymetallic nodules is 2000 kg/m3. The terminal settling velocity of a single spherical particle is as follows [30]:
where g is the gravitational acceleration, d is the diameter of the particle, and ρf is the fluid density. The drag coefficient of spherical particles CD is a function of Reynolds number Rep [31]:
Reynolds number of particles:
where μf is the dynamic viscosity coefficient. Van Wijk et al. [20] gave an analytical solution for the particle reaction time tp:
where w(t) is the settling velocity at a certain time, Vp is the Particle volume, and Ap is the particle projected area. Equations (2)–(4) can obtain the terminal settling velocity wt of the particles and then use Equation (5) to solve w(tp) = 0.63·wt to find the reaction time tp of the particles.
The timescale of the surrounding environment tf is related to particle velocity vs and the size of the relevant cross-section. There are mainly three areas in the section of the lifting pump that are interesting. The first area is the inlet of the lifting motor pump, and the timescale tf1 related to the flow in the impeller is defined as:
Dio is the outer diameter of the impeller, and Dii is the inlet diameter of the impeller. The second area is the outlet of the single-stage impeller; the timescale tf2 related to the flow in the guide vane is defined as:
Ddmax is the maximum diameter of the guide streamline in the space guide vane, and Ddmin is the minimum diameter of the guide streamline in the space guide vane. The third area is the timescale tf3 related to the speed of the impeller, and the number of blades is defined as:
Ni is the number of blades of the impeller, and n is the speed of the pump. Different tp and tf values can be calculated according to the particle diameter d, particle velocity vs, pump speed n, and pump geometric parameters. In our experiment, the maximum fluid velocity vf = 4 m/s, assuming that the particle velocity is equal to the fluid velocity vs = vf and using Equations (6)–(8) to calculate and find that tf1 > tf2 > tf3.
Therefore, we use tf1, and combined with the reaction time tp of the particles at the pump inlet, we can find that St = 3.47 with particle size d = 1 mm, and St = 71.72 with particle size d = 15 mm. The original particle size range used in the experiment is mainly 1 < d < 15 mm, so St < 1 is suitable for all particles. This means that the particles will escape from the fluid in the process of transporting in the six-stage electric lift pump and will have a strong impact on the blades, walls, and other particles, which will cause the particles to degrade.
2.2. Degradation Model
Van Wijk [7] proposed an exponential decay degradation model of the original particle size after impact on the basis of Wilson and Addie [26]. The model shows the relationship between particle size and impact times before and after impact fragmentation:
di,N is the size of the particles of class i after N impacts, di,0 is the original size of class i, and ki is the degradation rate. Equation (9) can be rewritten as , and the degradation rate of different size classes under different impact times is determined through experiments. However, this model is only for single particle size, and the work is complicated for particles with a wide range of sizes.
Pitchumani et al. [14] proposed an exponential decay model with the mass fraction of the particle size range through repeated impact experiments (RIT):
where mi,N is the mass fraction of the particles retained in the size class i after N impacts, mi,0 is the mass fraction originally retained in the size class i, and ki is the degradation rate in the size class i. The model is similar to Van Wijk [7], but the size class i in the model proposed by Pitchumani [14] is the particle size range, while the size class i in the model proposed by Van Wijk is the size of the particle.
The model of Pitchumani calculates the mass loss after degradation of a single particle size class, but it does not consider the relationship between different particle size classes. Chapelle et al. [27,28] considered the redistribution of species after particle degradation and described the particle degradation model in the form of a matrix:
where B is the breakage matrix, yi is the column vector of different particle size classes before breakage, and y0 is the column vector of different particle size classes after breakage. Since a size class can theoretically be degraded to all the particle size grades smaller than it after impact fragmentation, in order to solve the broken matrix B, a large amount of experimental data is needed to calculate the coefficients in the breakage matrix.
Van Wijk [22] uses three empirical parameters h1, h2, and h3 to define the breakage matrix model based on the degradation model of Chapelle et al. h1 is the number of particles remaining in the first size class after being broken, h2 is the relative number of particles moving from the first size class to the second subcategory, and h3 is the number of particles distributed in the third class to the last class. The three parameters satisfy the condition h1 + h2 + h3 = 1 and h1, h2, h3 ≥ 0. However, it needs to presume a parameter value α to determine the volume that remains in the third class after the impact.
Therefore, the particle degradation model of Equation (10) is more suitable for predicting the particle size distribution after multiple impacts. Based on the model of Equation (10) and considering the influence of the number of pump stages S, we improved the model:
We will use Equation (12) as the framework to carry out degradation analysis. The nodules will be repeatedly impacted in the deep-sea six-stage lifting motor pump to obtain degradation data. The data are used to calculate the degradation rate and then predict the degradation process of nodules in the deep-sea multi-stage lifting motor pump.
3. Nodule Degradation Experiment
3.1. Experimental System
The nodule degradation experiment system mainly consists of a particle recovery device, a deep-sea multi-stage lifting motor pump, a feeding device, and the transport pipeline loop, as shown in Figure 3.
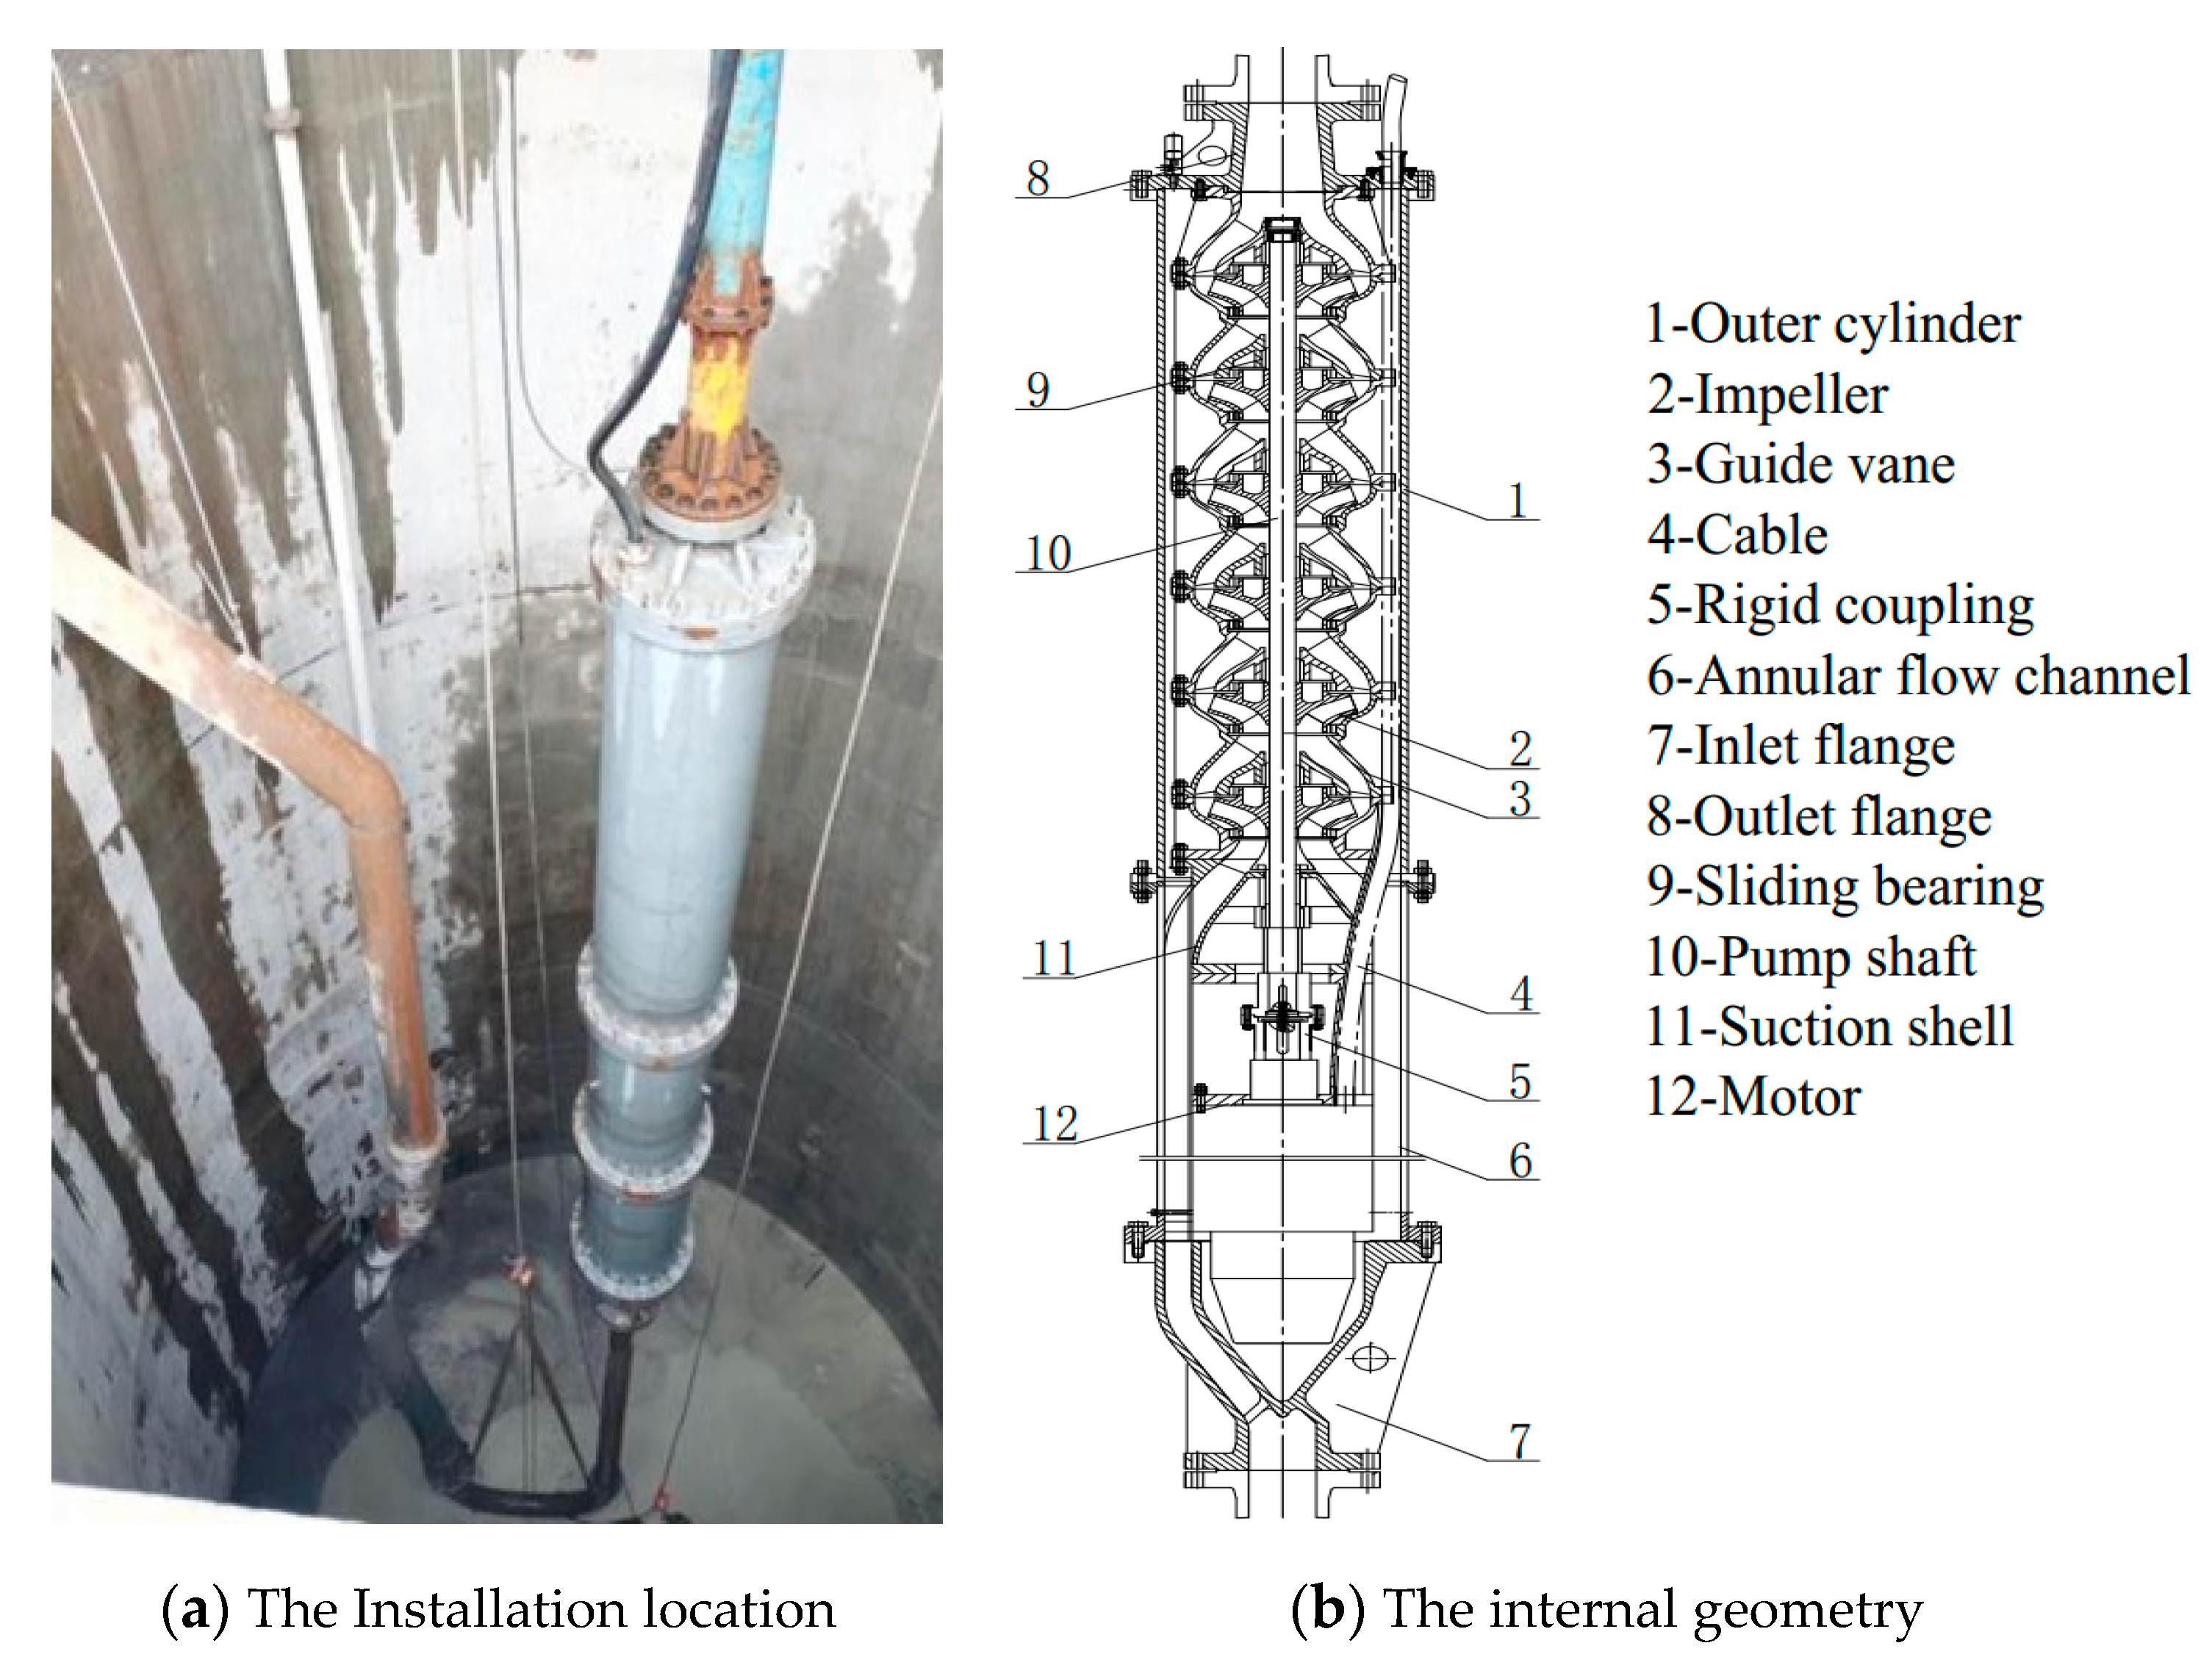
The deep-sea multi-stage lifting motor pump is the core part of the experimental system, and its overall structure is shown in Figure 4. The main body of the pump is composed of six single-stage pumps in the form of cartridges. Each stage has a rotating impeller and a static space guide vane. The pump shaft and the motor shaft are coupled through a rigid coupling and then fitted into a cylindrical outer cylinder. The outer cylinder is the main pressure-bearing part of the pump, three annular flow passages are arranged on the outer cylinder of the motor, and the annular flow passage makes the slurry transition from the lifting pipe to the inside of the pump body. The inlet flange and outlet flange are used to connect the pump and the lifting pipe. The total length of the lifting motor pump is about 7.5 m, and it is placed in a circular deep pit below the ground of the experimental system. The working parameters of the lifting motor pump are shown in Table 1.
The transport pipeline loop includes the pipeline with the diameter of Dp = 200 mm and the length of L ≈ 200 m, a multi-stage reducing pipe, and two electric pipe clamp valves in series. The resistance consumption of the original continuous U-shaped elbow pipe is limited. We replaced the straight pipe on the upper part of the U-shaped elbow pipe with a multi-stage reducer and connected two electric pipe clamp valves in series behind the reducer, as shown in Figure 5. The multi-stage reducer can greatly consume the head of the lifting motor pump, and the electric pipe clamp valve can realize the adjustment of the flow within a certain range. The electric pipe clamp valve of model TG941X-16CDN200 is selected. It proportionally controls the opening of the valve through a 4–20 mA current to change the flow rate of the slurry in the pipeline.
The feeder is the main equipment to control the feeding speed of particles in the degradation experiment system. By setting the feeding speed of the feeder, the particles in the mineral storage bin will be collected in the mixer together with water in a certain amount and then flow into the downward hose in the form of slurry.
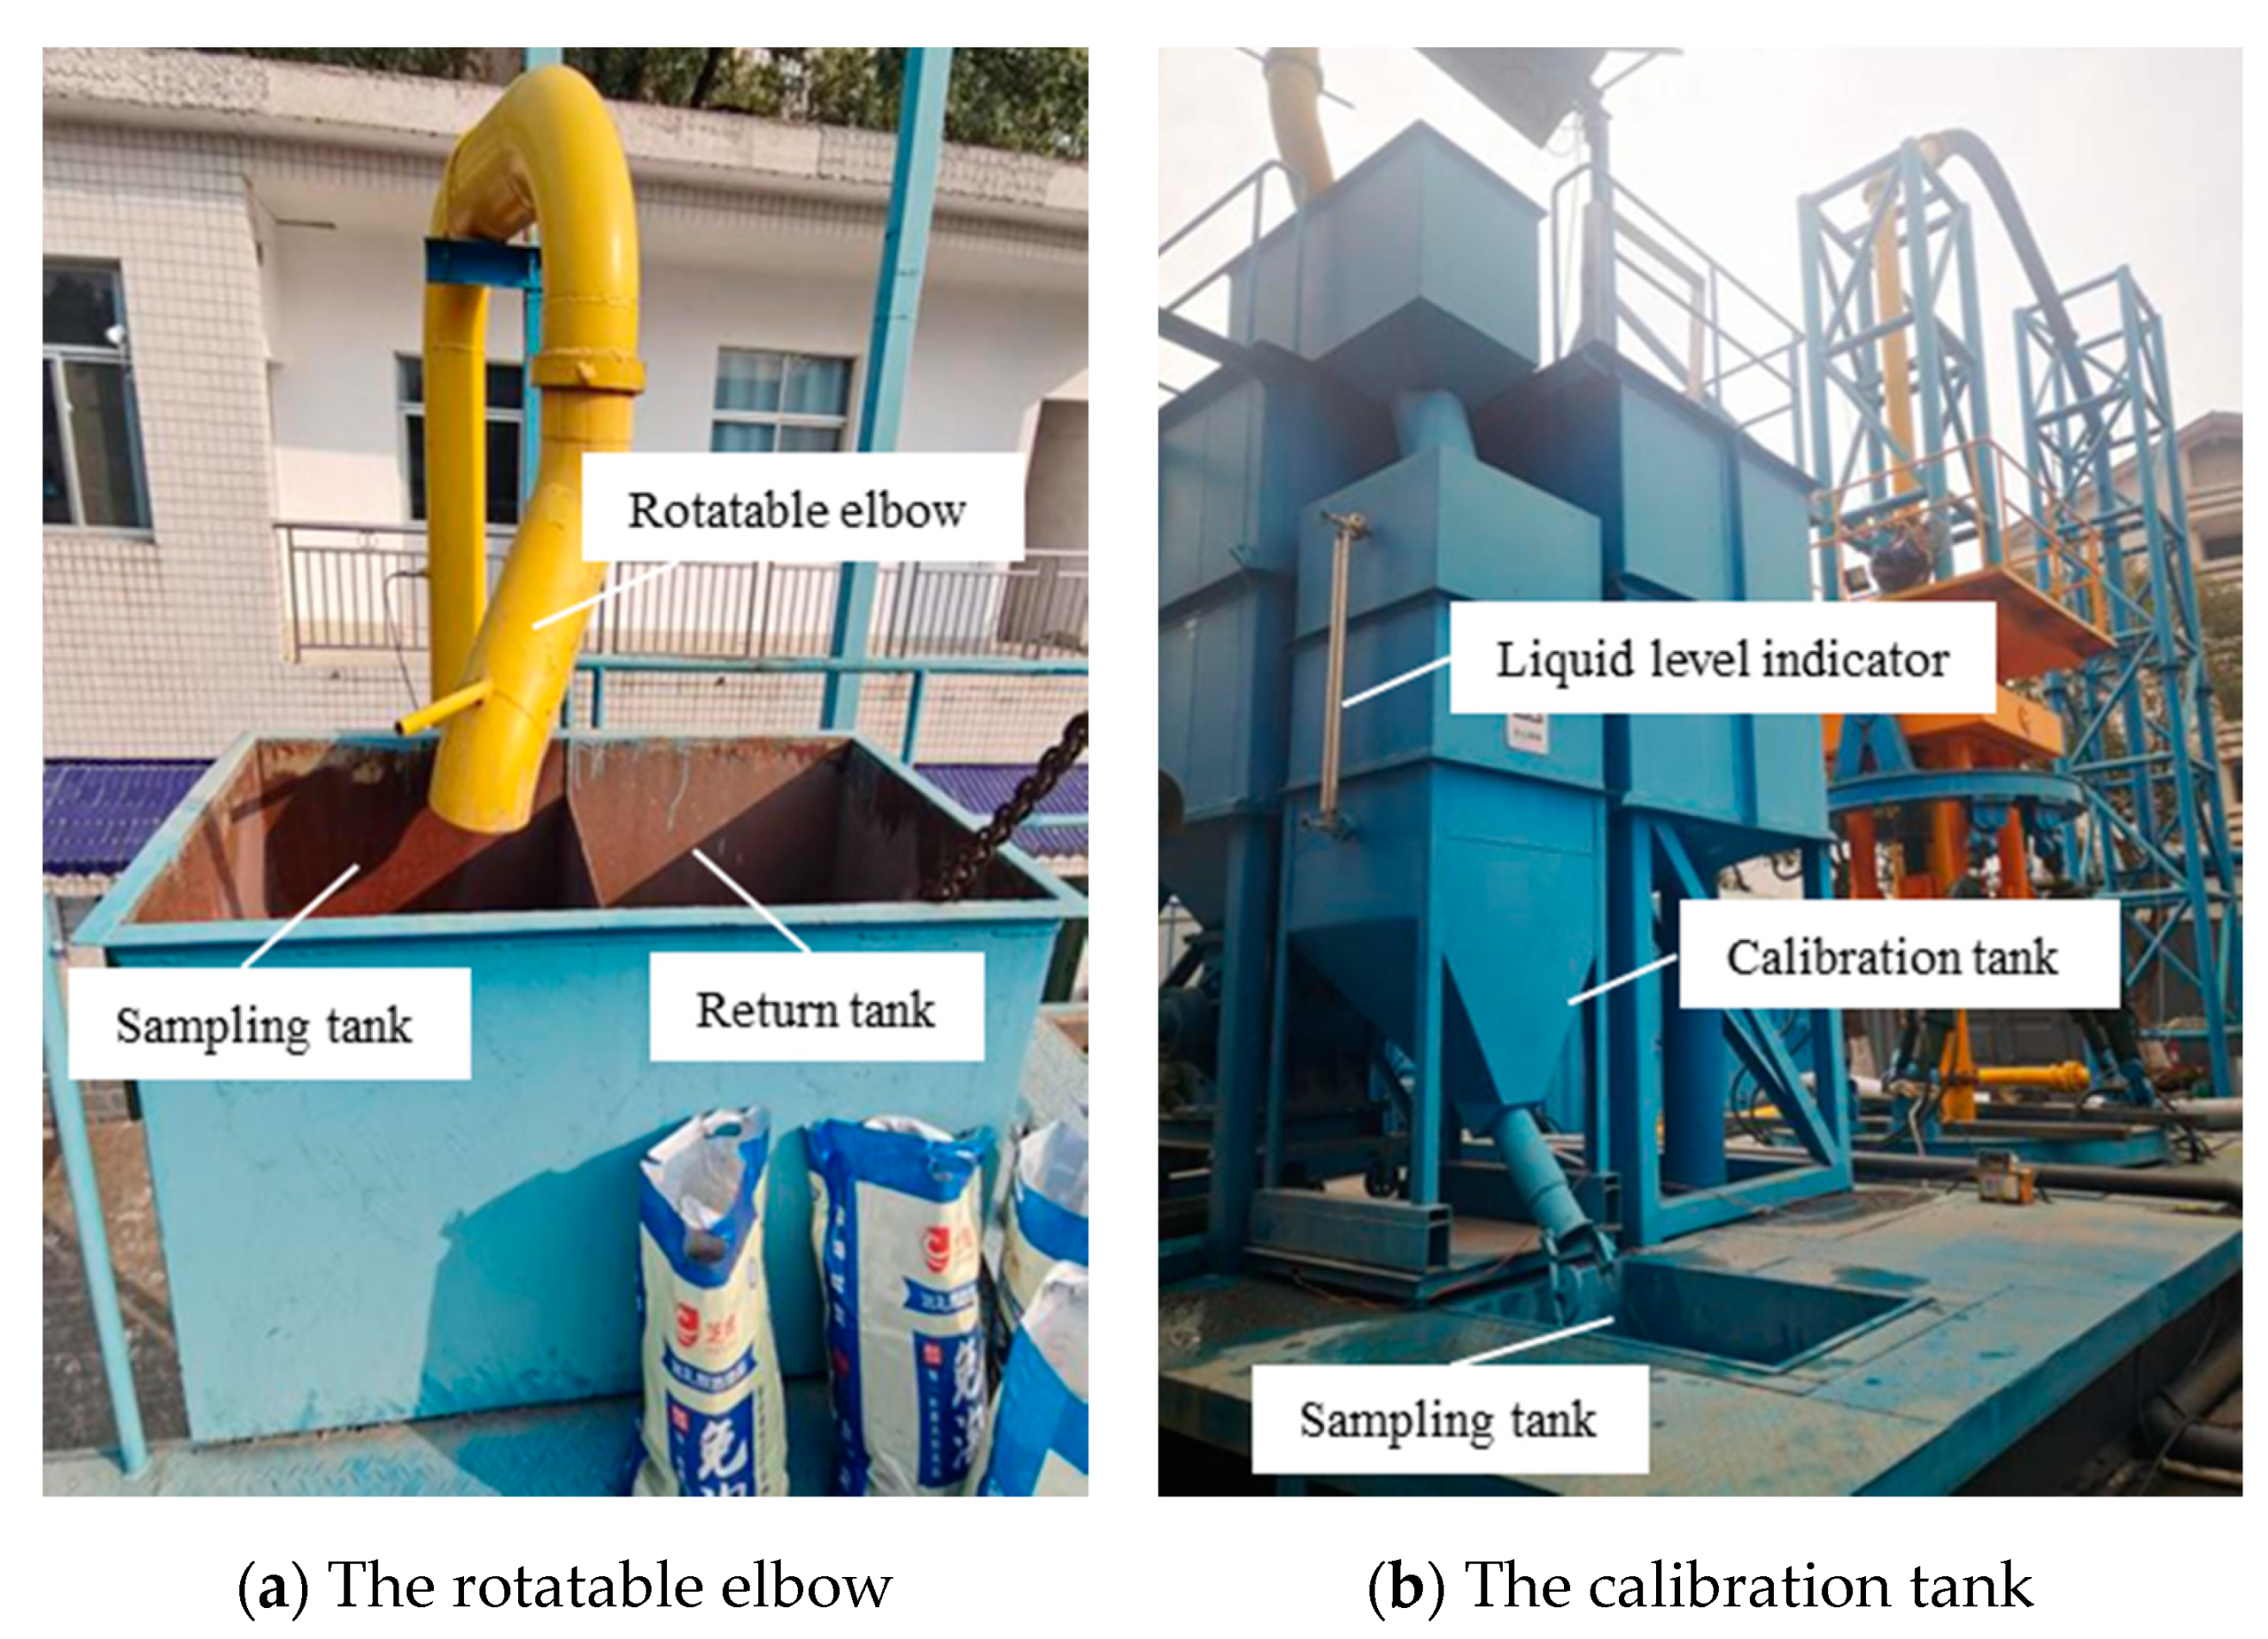
The upper part of the particle recovery device is a rotatable elbow, and the lower part is a calibration tank, as shown in Figure 6. After the particles are impacted and fractured by the pump, the rotatable elbow turns the outlet from the return tank to the calibration tank to realize the recovery and calibration of the particles. There is a liquid level indicator on the calibration tank, which can monitor the liquid level in the calibration tank and measure the volume of slurry flowing into the calibration tank.
3.2. Experimental Method
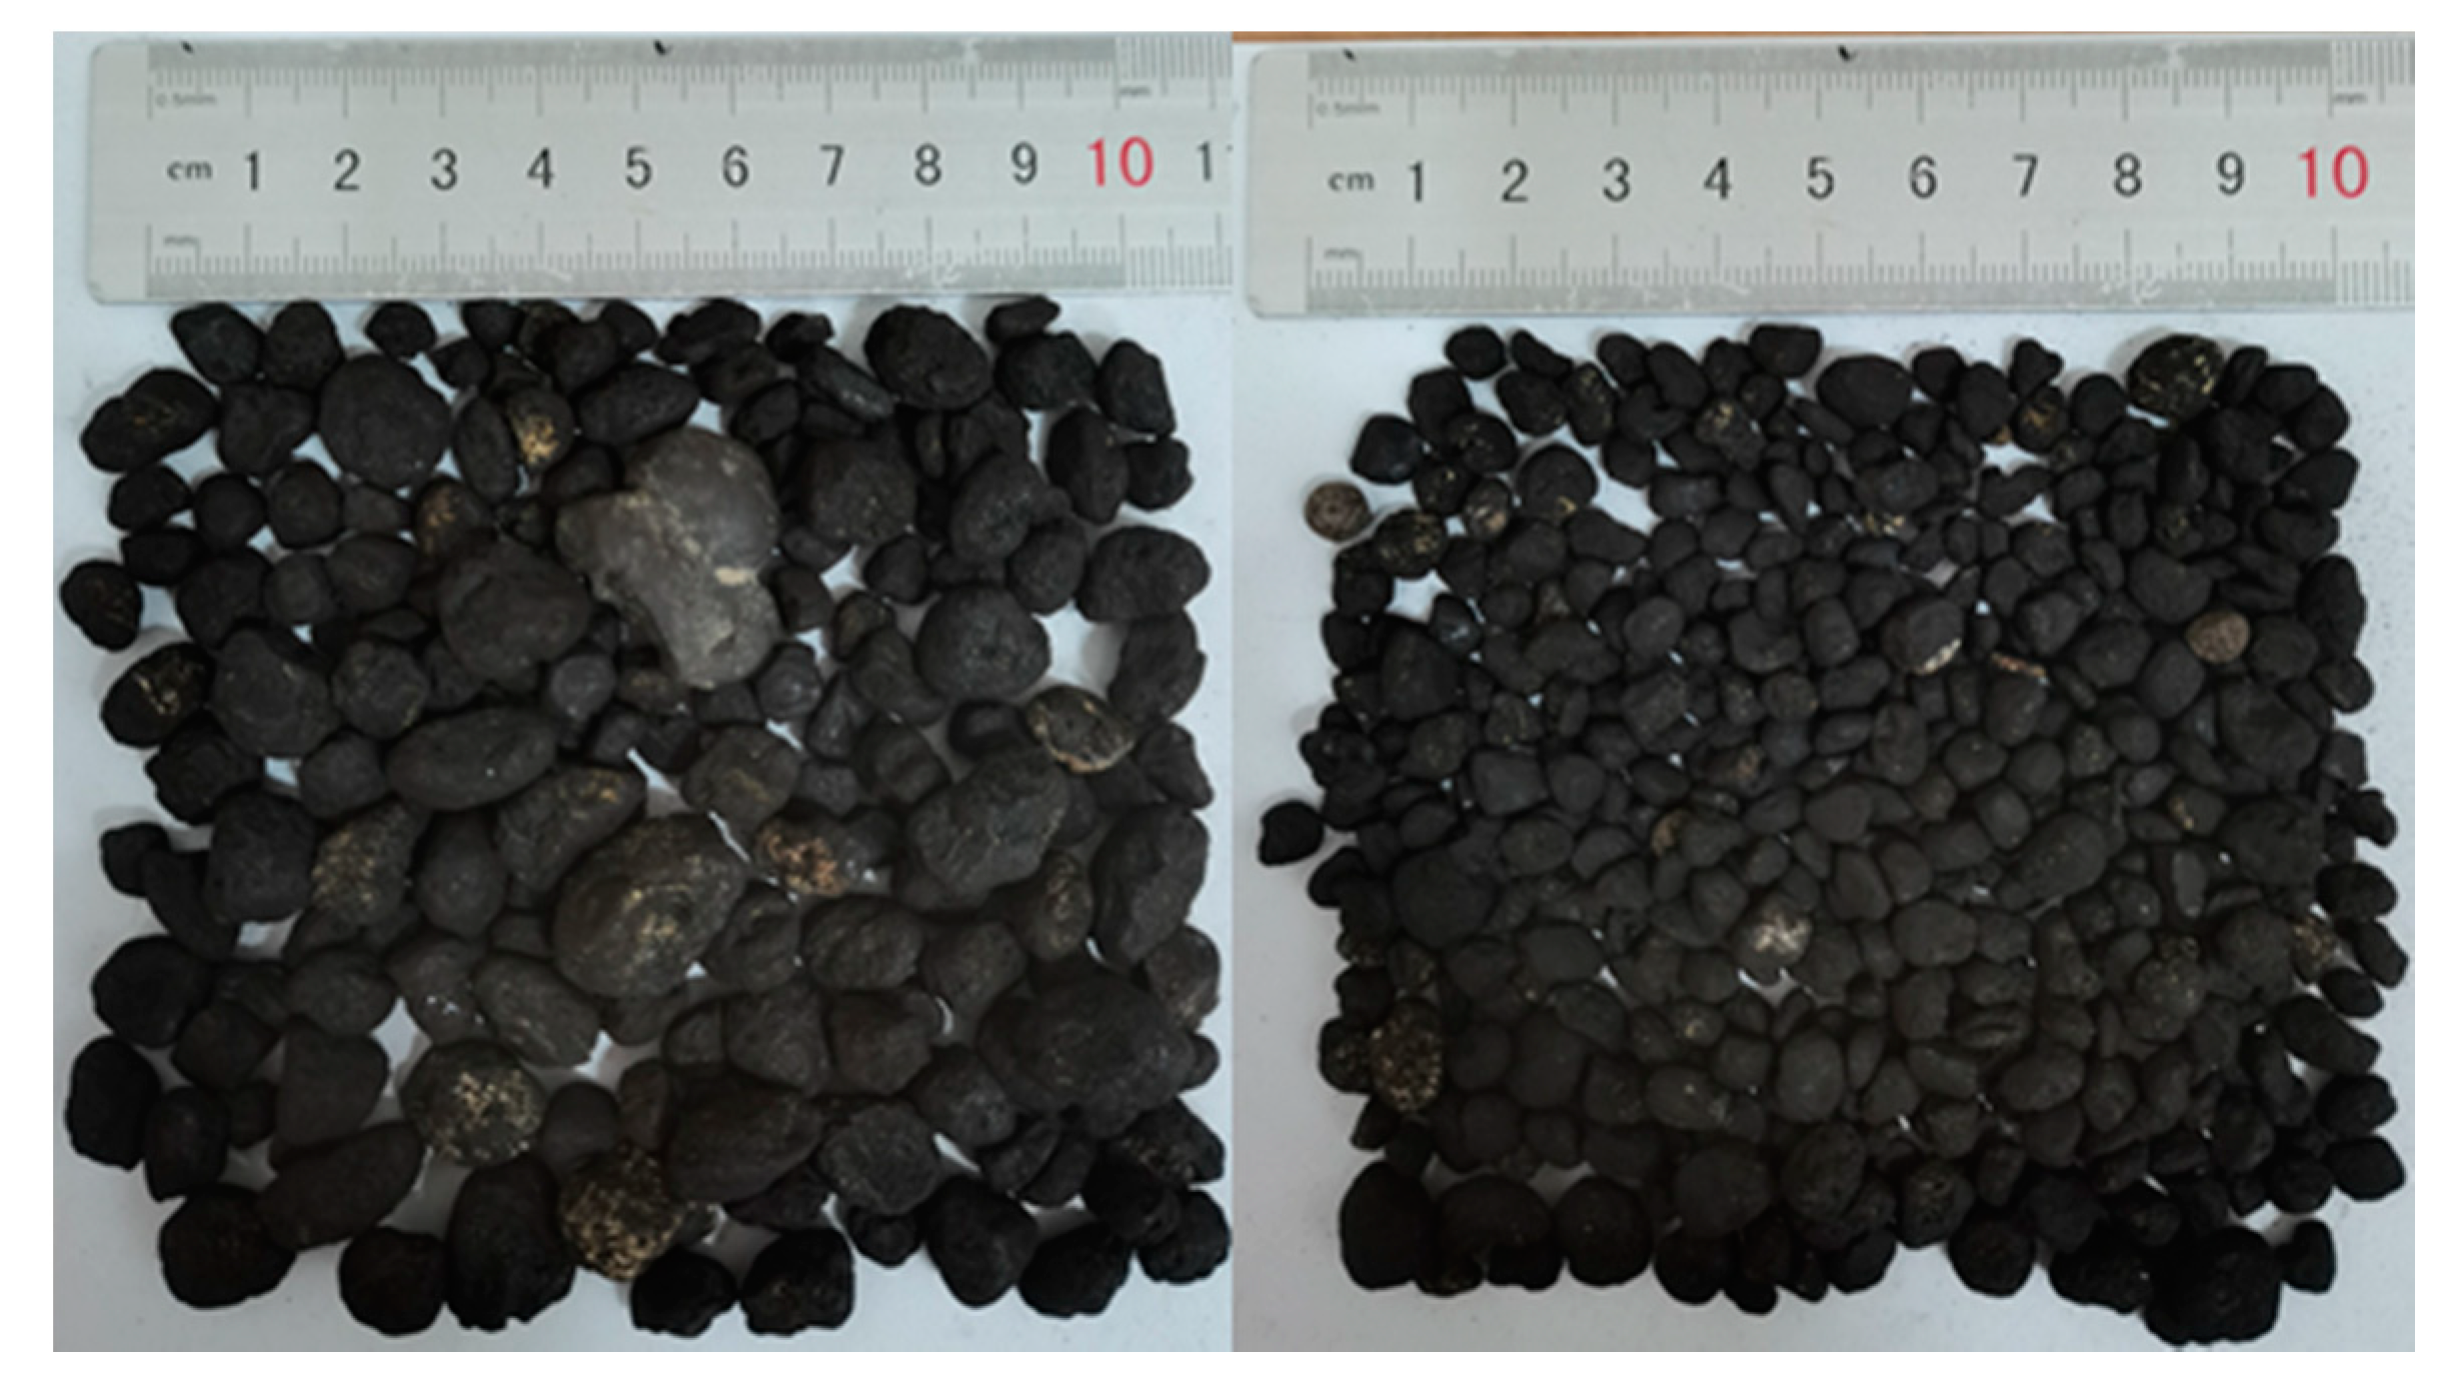
The liquid phase is water with a density of ρl = 1025 kg/m3, and the particle phase is polymetallic nodules with a density of ρs = 2000 kg/m3. The maximum particle size of natural polymetallic nodules particles can reach more than 50 mm, which easily causes the pump to block during transportation. The nodules were crushed by the crusher, and the nodules with diameter less than 15 mm were finally used for the experiment. Figure 7 shows the nodules after crushing by the crusher. Then, we submersed the nodules in water for more than two weeks before the experiment to ensure that the pores inside the nodules were fully wetted. Then, we rinsed off the sediments attached to the nodules with water before putting them into the mineral storage bin. A total of 250 kg of wet polymetallic nodules recovered from the China contract area in the CCZ were used in the experiment.
The nodules in the experiment are all from the same batch. The initial total mass m0 of the nodules is measured before the start of each test. The transportation of polymetallic nodules from the seabed in the CCZ zone to the sea surface usually requires 20–30 impeller impacts. Therefore, the PSD of the nodules after different impact times of the six-stage pump (number of times N =1–5) and running time t = 10 min (in order to compare with the results of the degradation prediction model in Section 4.2.) is measured. The particle volume fraction in the experimental system is set at 5% by controlling the feeding speed of the feeder.
The cycle time is about 65 s when all the particles are released in the mineral storage bin through the feeder, and they return to the mineral storage bin after passing through the six-stage lifting motor pump and transport pipeline. At the end of the experiment, we flushed the pipeline and pump with water to flush out all the remaining particles. The changes in PSD caused by the degradation of particles larger than 1 mm are more closely related to the design of processing equipment and the improvement of lifting. Thus, the particles were wet sieved with screens with apertures of 1 mm, 3 mm, 5 mm, 8 mm, 10 mm, 13 mm, and 15 mm, combined with a vibrating screening machine, as shown in Figure 8. Particles below 1 mm were mixed with water, and the resulting slurry was very turbid. In order to obtain the weight of fine particles below 1 mm, the slurry was allowed to settle for two days. Then, we filtered out the clean water on the upper part of the slurry and dried the remaining powdered particle mixture. We found that the particles smaller than 1 mm contained some paint fragments after drying, which implies that the nodules were worn out with the wall of the pump and the wall of the pipeline during the test. In order to avoid these paint fragments from affecting the results, we weigh the particles larger than 1 mm sieved out after the test is m>1mm, and the weight of the particles below 1 mm is m0 − m > 1 mm.
4. Results
4.1. Size Distribution of Nodules after Multiple Impact
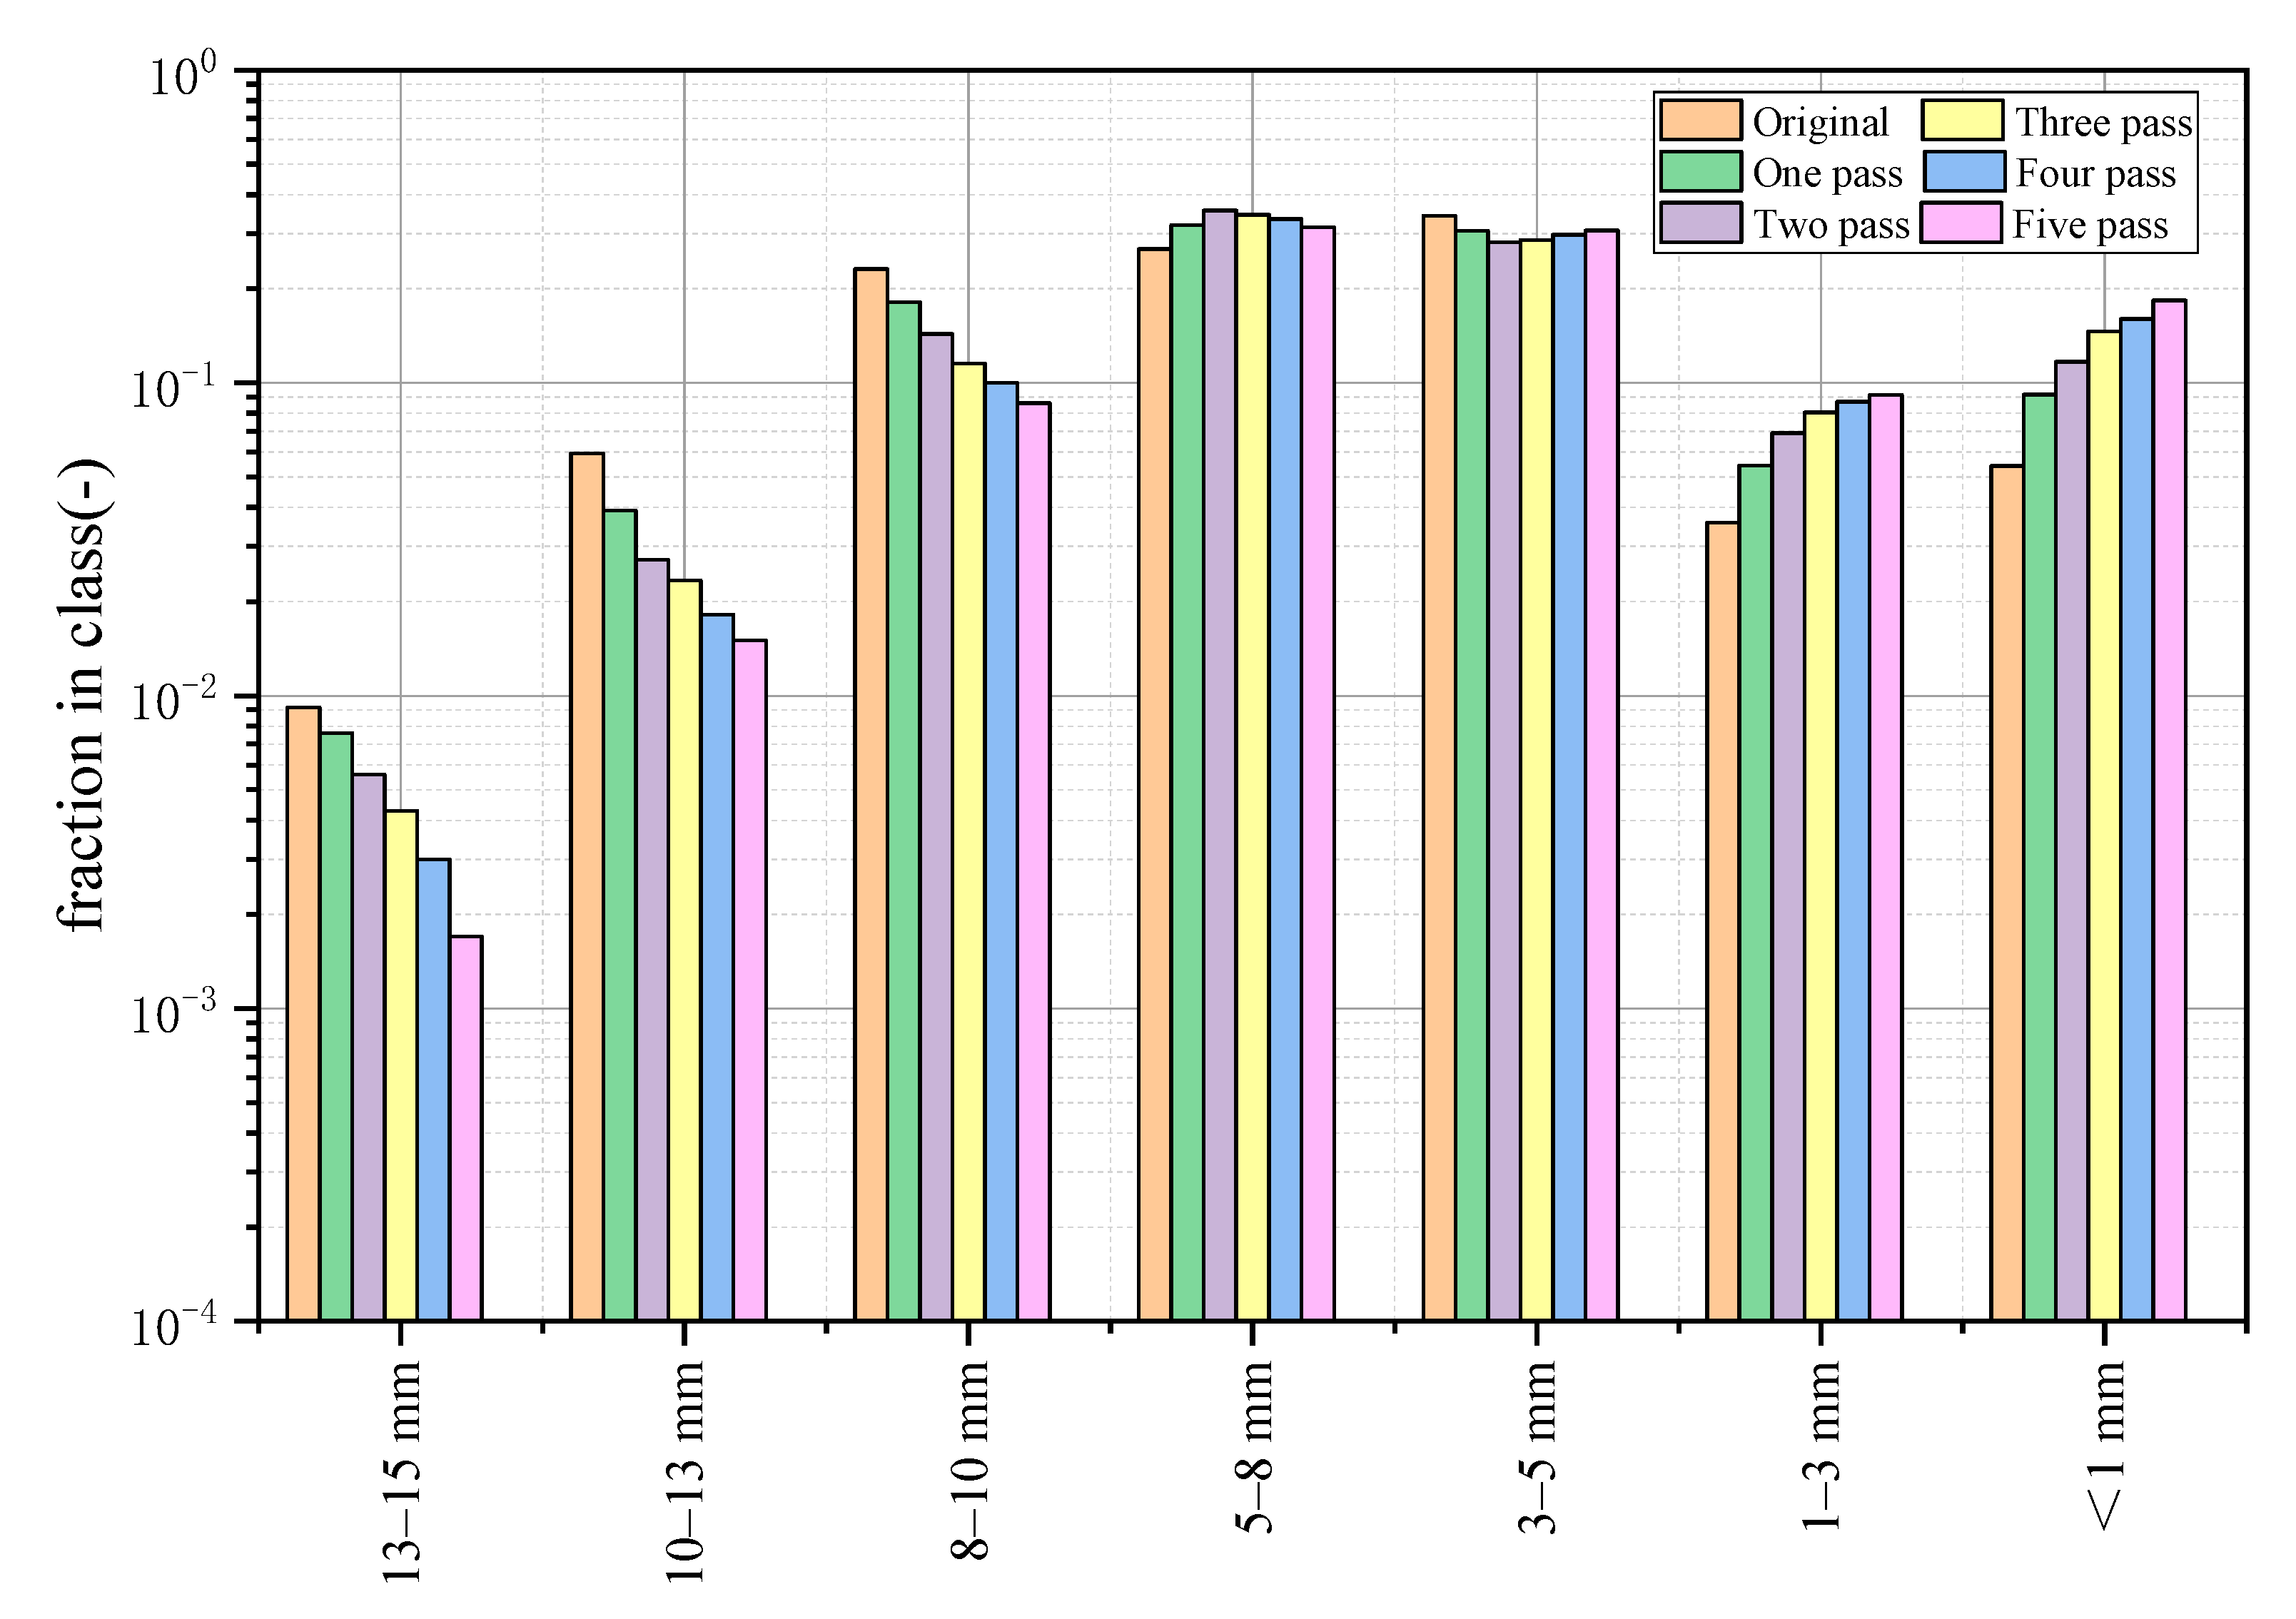
The nodules will be impacted six times when passing through the six-stage electric pump. The nodules are impacted by the high-speed rotation of the impeller, which makes the fragile inner nodules easily broken by the impact. The PSD after the impact of the six-stage lifting motor pump (passed 1–5 times respectively) is shown in Figure 9. The mass fraction of nodules with size class of 8–15 mm will gradually decrease after each passing through the lifting motor pump. After the nodules have passed through the pump five times (the particles were impacted 30 times), 0.17% of the nodules remain in the particles with a size class of 13–15 mm, 1.5% of the nodules remain in the size class of 10–13 mm, and 8.63% of the nodules remain in the size class of 8–10 mm.
The mass fraction of nodules with a size class of 5–8 mm experienced a process from rising to falling. After the second pass through the pump, it reached the maximum ratio of 35.59%, but after the fifth pass through the pump, it dropped to 31.45%. This means that at the beginning, the mass fraction of particles that moved from another size class to the size class of 5–8 mm is higher than the mass fraction of particles removed from the same class, which makes the mass fraction of the size class of 5–8 mm initially rise. After the second pass through the pump, the particles with a size class of 5–8 mm moved out more, which caused the mass fraction to gradually decrease.
Meanwhile, the mass fraction of nodules with a size class of 3–5 mm experienced a process from falling to rising. It reached the minimum of 28.19% after the second pass through the pump but rose to 30.74% after the fifth pass through the pump. This means that at the beginning, more particles move out of the size class of 3–5 mm. After the second pass through the pump, fewer particles move out of this class and more move in, which makes it show a trend of first decline and then rise.
The mass fraction of nodules with d < 3 mm gradually increased each time they passed the pump. After the nodules passed through the pump for the fifth time, the mass fraction of nodules with a size class of 3–5 mm increased to 9.15%, and the mass fraction of nodules with d < 1 mm increased to 18.36%. Figure 10 shows the comparison of the PSD of polymetallic nodules after passing different pump times.
4.2. Degradation Prediction Model
Figure 11 shows the degradation rate change of different size classes of particles after multiple impacts, which is calculated as . The degradation rate indicates the inflow and outflow of particles. ki > 0 means that the outflow of particles is greater than the inflow of particles, and the mass of this class will be lost. ki < 0 means that the outflow of particles is smaller than the inflow of particles, and the mass of this class will net accumulate. The ki values of particles with class sizes of d < 1 mm, 1< d < 3 mm, and 5 < d < 8 mm are all negative. It means that after the fifth pass through the pump (30 impacts), the mass has a net accumulation compared to the original mass. Their ki is positively correlated with the number of impacts. Especially for the particle class of 5 < d < 8 mm, the ki has increased from −0.0295 to −0.0053 after 30 impacts. When the impact continues, its mass may be lost compared to the original mass.
The ki values of particles with class sizes of 3 < d < 5 mm, 8 < d < 10 mm, 10 < d < 13 mm, and 13 < d < 15 mm are all positive, which means that their mass compared to the original mass is lost after the fifth pass through the pump (30 impacts). The ki values of particles with a class of 13 < d < 15 mm are positively correlated with the number of impacts, which means that as the number of impacts increases, the degradation rate will continue to increase, and more and more mass is lost.
However, the ki values of particles with class sizes of 3 < d < 5 mm, 8 < d < 10 mm, and 10 < d < 13 mm are negatively correlated with the number of impacts. For class of 3 < d < 5 mm, the ki has been reduced from 0.0185 to 0.0036 after 30 impacts. When the number of impacts continues to increase, its mass may increase compared to the original mass.
It can be found from Figure 11 that the degradation rate ki will change with the increase in the number of impacts. We carried out a fitting analysis on the degradation rate of all particle classes to study its change law. This paper tried linear, power, exponential, and logarithmic function fitting, and we found that the logarithmic fitting is more in line with the development trend of degradation rate with the number of impacts:
where ai and bi represent the parameter values of the size class i in the degradation rate logarithmic fitting curve. Equation (13) is used to fit the degradation rate changes of all particle classes, and the different ai and bi values obtained are shown in Table 2. The correlation coefficient R2 of all fitted curves is greater than 0.88, which shows that the degradation rate can be approximated by a logarithmic relationship with the number of impacts.
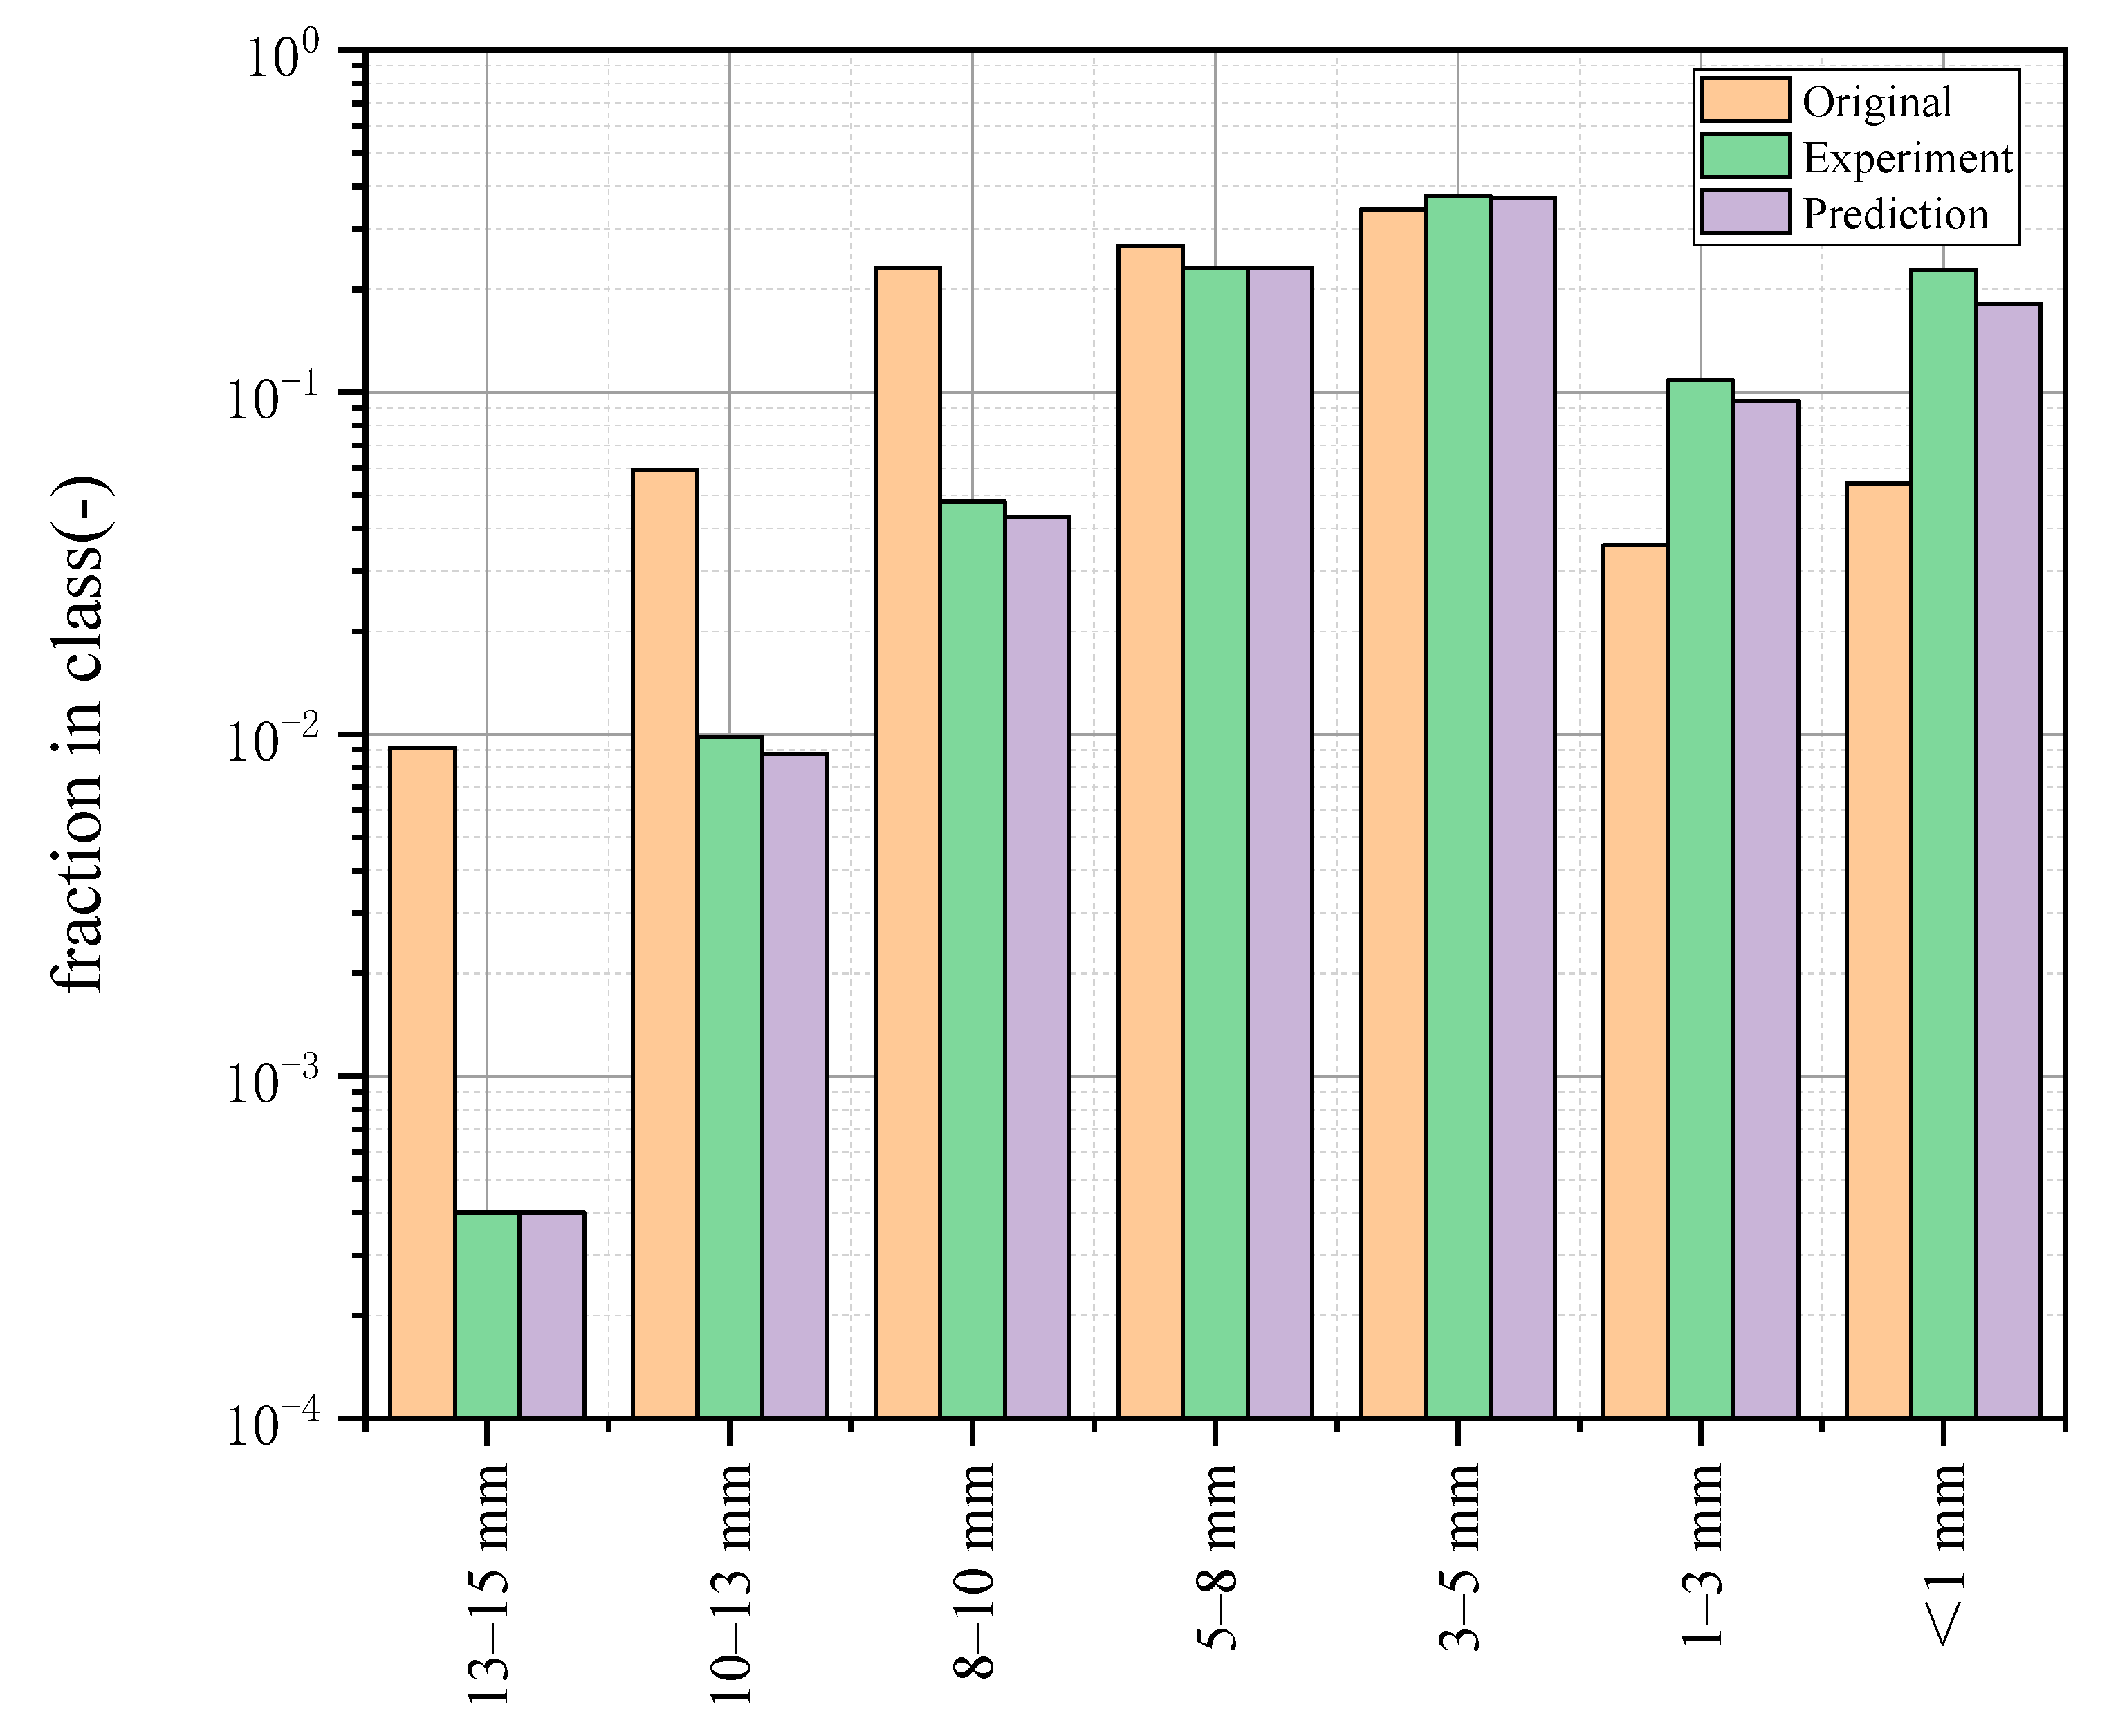
The parameters in Table 2 are used in Equation (13) and combined with Formula (10) to predict the PSD of nodules after running for 10 min (each cycle time of the nodules in the experimental system is 65 s, and the nodules have passed through the six-stage lifting pump about nine times and were impacted 54 times) in the experimental system, and compare them with the actual measured results, as shown in Figure 12. The experimental values for a particle class size of 13 < d < 15 mm, 10 < d< 13 mm, 8 < d< 10 mm, 5 < d < 8 mm, 3 < d < 5 mm, 1 < d< 3 mm, and d < 1 mm is 0.04%, 0.98%, 4.8%, 23.2%, 37.33%, 10.84%, and 22.82% respectively, and the predicted values of the model are 0.04%, 0.88%, 4.33%, 23.13%, 37.07%, 9.43%, and 18.22% respectively. The predicted result is smaller than the experimental result, and the overall accuracy is within 20.2% (appears at the particle class of d < 1 mm). After the nodules are run in the experimental system for 10 min, the mass fraction of particles of the large class 8 < d < 15 mm is greatly reduced. The mass fraction of the particles of the medium class 3 < d < 5 mm has a small change compared with the original. The mass fraction of fine class d < 3 mm has increased greatly, and the appearance of all nodules becomes smooth. Figure 13 shows the PSD of polymetallic nodules at the initial time and after 10 min of running the experimental system (nodules were impacted 54 times).
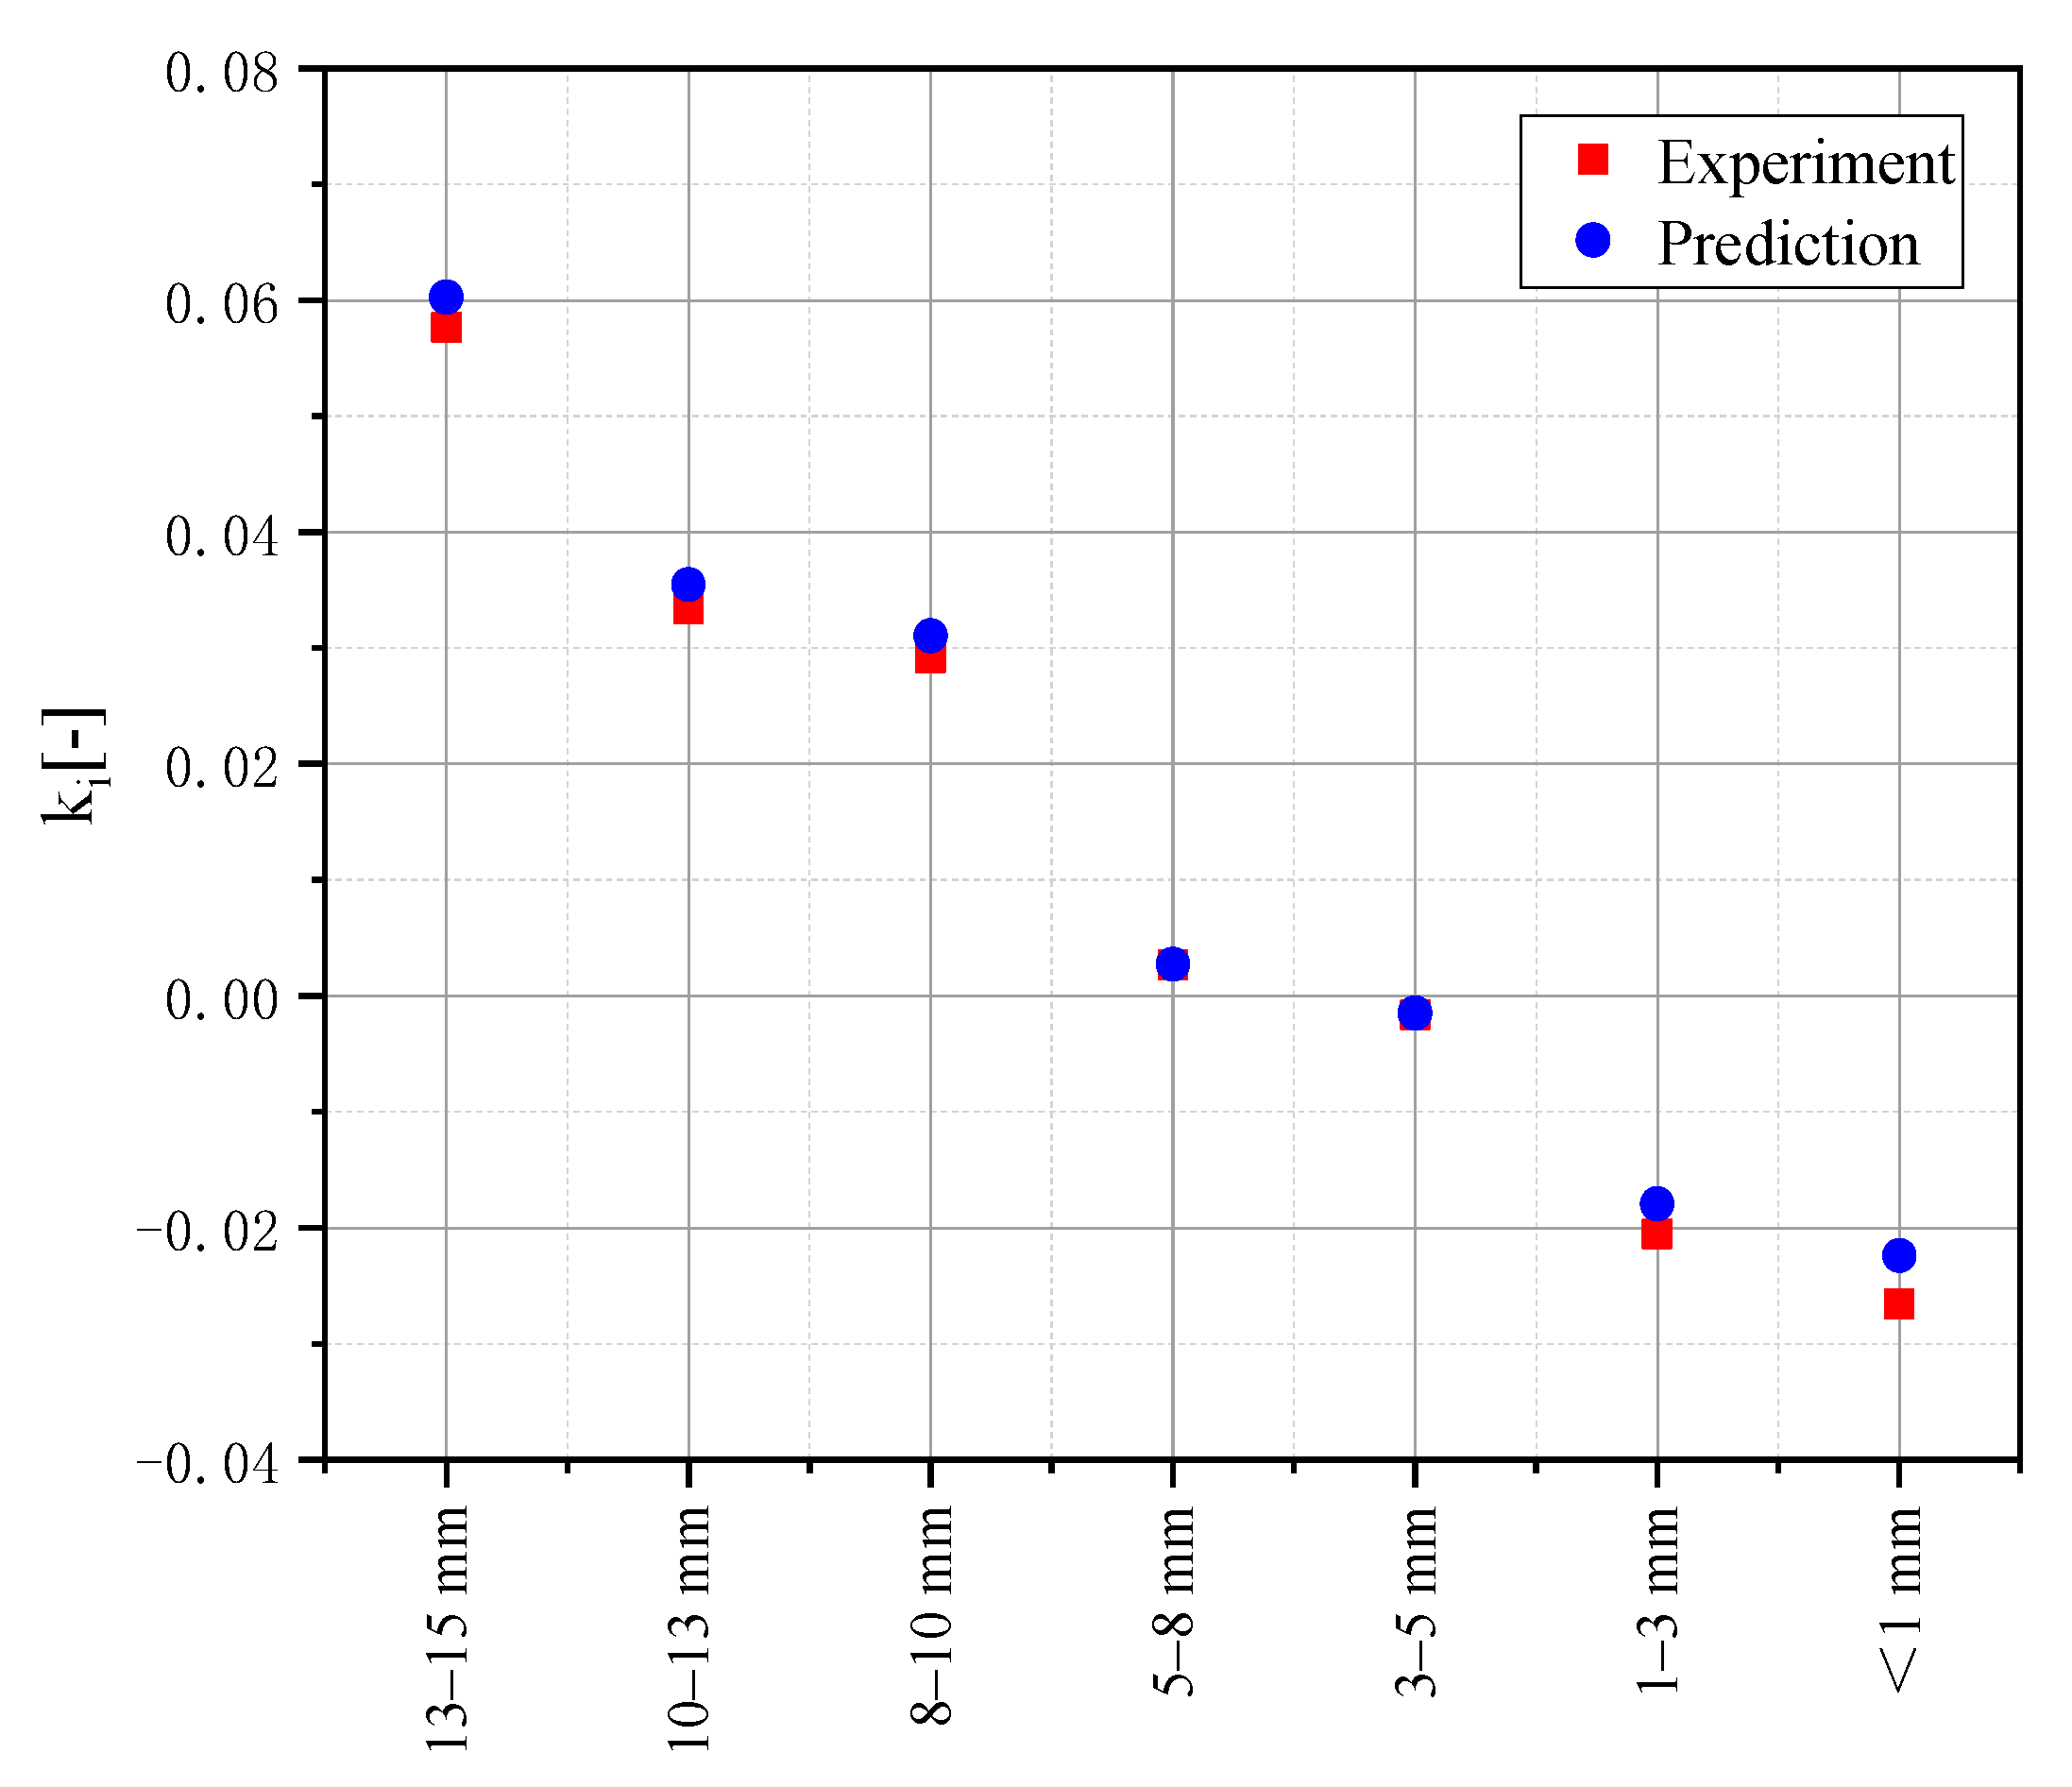
Figure 14 shows the comparison of the degradation rate of different particle classes predicted by Equation (13) after running for 10 min in the experimental system with the experimental results. The ki values of class sizes 5 < d < 8 mm, 8 < d< 10 mm, 10 < d < 13 mm, and 13 < d < 15 mm are positive, which means that their mass is lost relative to the original mass. The ki values of class sizes d < 1 mm, 1 < d < 3 mm, and 3 < d < 5 mm are all negative, which indicates that their mass is net cumulative relative to the initial mass. The predicted result is consistent with the experimental result. It is worth noting k3<d<5mm and k5<d<8mm, which are respectively positive and negative after 30 impacts (passing five times through the pump), but the results are opposite after 54 impacts (passing nine times through the pump). This shows that with the increase in the number of impacts, the particles mass of the class size 3 < d < 5 mm experienced a process from loss to net accumulation, and the particles mass of the class size 5 < d< 8 mm experienced a process from net accumulation to net loss.
5. Influence of Sediment
When the polymetallic nodules are lifted from the seabed to the mining vessel, the sediment will inevitably be recovered along with the nodules through the hydraulic transportation system due to its adhesiveness [32]. Since the space of the mining vessel is limited, after the recovered slurry mixture undergoes preliminary processing and separation, the sediment and nodule powder (considered the two major components of the discharged solid) will be discharged back to the ocean through the discharge pipe. The amount of sediment discharged varies with the design of the engineering system [33,34]. It will affect the recovery of ore and cause disturbance to the marine environment [35,36,37].
Some studies have shown that the average grain size of the bottom sediments in the CCZ zone is about 3–100 μm [34,38,39]. Not only the nodules, but also the size of the sediment will decrease due to physical degradation during the lifting process. Knowing the PSD of the sediment can help us separate it from nodule powder and reduce the influence on the environment. Therefore, some studies have analyzed the degradation process through laboratory-scale lift pumps [20,34]. Other studies use more abstract methods of traditional instruments such as ball mills [38,40]. However, they did not distinguish between the PSD of sediment and nodule powder, which were mixed together to calculate the percentage.
Yamazaki [17] independently conducted hydraulic transport experiments on deep-sea sediments. They used small centrifugal pumps (a maximum pressure head of 2.4 m) connected to a set of rectangular pipes to test the CCZ seabed sediments for 30 min. Then, the quality frequency and cumulative quality frequency of the sediments at the beginning and after the 30 min test were compared. The experimental results show that the sediments are mainly distributed below 100 μm, and the particle size of the sediments is significantly reduced after 30 min of testing. The sediment initially showed a three-peak distribution with peaks at 1.3 μm, 5 μm, and 39 μm, respectively. However, after 30 min of testing, the sediment showed a two-peak distribution with peaks at 1.3 μm and 8 μm.
If the nodules and sediments can be completely separated, and all nodule particles can be recovered, the loss of ore can be minimized. However, it will take longer and cause inefficiency, and the cost is undoubtedly extremely expensive [40]. The design of different separation processes determines the size of particles that cannot be effectively recovered. At present, the size of particles that are technically difficult to recover is 8 μm [22]. However, considering the economic cost and separation efficiency, the unrecoverable particle size may be larger. The percentage of different particle size classes can provide a reference for mineral processing cost calculation and processing equipment design. Especially for particles with a size of less than 1 mm, it may need to go through multiple different dehydration equipment for multiple dehydration treatments, which will undoubtedly increase more process design and processing costs. The PSD of the sediment is very interesting, but it is not within the scope of our research this time. The main focus of this article is the change of different particle size classes due to the degradation of nodules and the quantitative calculation of nodules PSD through predictive models, which is very useful for the improvement of mineral lifting and the design of processing equipment.
6. Conclusions
In this paper, the PSD of the nodules was measured after respectively passing one to five times through a deep-sea six-stage lifting motor pump and 10 min of transportation in the experimental system (passing nine times through the pump). Then, the degradation rate of each particle size class under different impact times was calculated. In the experiment, the nodules will collide with the tube at a certain direction and speed, causing erosion of the tube [41]. At the same time, the nodules will generate chipping due to the collision. The nodules close to the tube wall will slide along the wall and cause abrasion [8]. We are concerned about the fracturing of nodules in the multi-stage lifting motor pump, but the abrasion and the chipping of the nodules in the tube will also affect the measurement results. This paper does not consider abrasion and chipping.
After the nodules were impacted and fractured by the lifting motor pump five times, the mass fraction of large size particles with a class size of 8 < d < 15 mm gradually decreased, and the mass fraction of small-size particles with a class size of d < 3 mm gradually increased. Medium-sized particles with a class size of 3 < d< 5 mm and 5< d < 8 mm show different trends. The mass fraction of 3 < d< 5 mm particles is a process from falling to rising. The mass fraction of class 3 < d < 5 mm particles experienced a process from falling to rising, while the class of 5 < d < 8 mm particles experienced a process from rising to falling. This shows that the inflow and outflow relationship of different classes of particles will change with the number of impacts, and the degradation rate ki will also change.
The relationship between the degradation rate and the number of impacts of the nodules in the multi-stage electric pump can be expressed by a logarithmic relationship. The new calculation method is used in combination with the improved prediction model to predict the PSD of the nodules after the experimental system has been running for 10 min (with 54 impacts). Compared with the actual measurement results, the overall accuracy is within 20.2% (appears at the particle class of d < 1 mm). The overall accuracy of the degradation rate calculated by the new method is within 15.7% (appears at the particle class of d < 1 mm). The overall accuracy is acceptable. The research in this paper provides a general framework and reference for the quantitative calculation of the PSD of polymetallic nodules after passing through the deep-sea multi-stage lifting motor pumps.
Next, we will consider the influence of long-distance vertical hydraulic transportation pipelines on the degradation process of nodules and combine it with the multi-stage lifting motor pump impact model of this article.
Author Contributions
The paper emerged from the long-term cooperation of the authors. Conceptualization, Y.L. and K.L.; methodology, Y.L. and K.L.; formal analysis, H.D.; writing—original draft preparation, Y.L. and K.L.; writing—review and editing, H.D. and C.Z. All authors have read and agreed to the published version of the manuscript.
Funding
This research was funded by the National Key Research and Development Program of China, grant number 2016YFC0304101-8 and the Open Fund of the State Key Laboratory of Deep-sea Mineral Resources Development and Utilization Technology, grant number SH-2020-KF-A02.
Institutional Review Board Statement
Not applicable.
Data Availability Statement
Not applicable.
Acknowledgments
The authors would like to thank the editors and anonymous reviewers for their careful work and thoughtful suggestions that have helped improve this paper substantially.
Conflicts of Interest
The authors declare no conflict of interest.
References
- Cllae, F.; Lba, B.; Mca, C.; Im, A.; Mmsa, D.; Ii, A. Development of physical modelling tools in support of risk scenarios: A new framework focused on deep-sea mining—ScienceDirect. Sci. Total Environ. 2019, 650, 2294–2306. [Google Scholar]
- Nishi, Y. Static analysis of axially moving cables applied for mining nodules on the deep sea floor. Appl. Ocean Res. 2012, 34, 45–51. [Google Scholar] [CrossRef]
- Yamazaki, T. Past, Present, and Future of Deep-Sea Mining. Shigen-to-Sozai 2016, 131, 592–596. [Google Scholar] [CrossRef] [Green Version]
- Liu, S.J.; Liu, C.; Dai, Y. Status and progress on researches anddevelopments of deep ocean mining equipments. J. Mech. Eng. 2014, 50, 8–18. [Google Scholar] [CrossRef]
- Laarhoven, B.V. Breakage of Agglomerates. Ph.D. Thesis, Technische Universiteit Delft, Delft, The Netherlands, 2010. [Google Scholar]
- Worster, R.C.; Denny, D.F. Hydraulic Transport of Solid Material in Pipes. Inst. Mech. Eng. 1955, 169, 563–586. [Google Scholar] [CrossRef]
- Van Wijk, J.M. The influence of nodule degradation on the vertical hydraulic transport of manganese nodules. In Proceedings of the 18th International Conference on Transport and Sedimentation of Solid Particles, Prague, Czech Republic, 11–15 September 2017. [Google Scholar]
- Hoog, E.D.; Wijk, J.; Wijnands, J.; Talmon, A.M. Degradation of polymetallic nodules during hydraulic transport under influence of particle-wall and particle-particle interaction. Miner. Eng. 2020, 155, 106415. [Google Scholar] [CrossRef]
- Chung, J.S. An articulated pipe-miner system with thrust control for deep-ocean crust mining. Mar. Geotechnol. 1998, 16, 253–271. [Google Scholar] [CrossRef]
- Kurushima, M.; Kuriyagawa, M.; Koyama, N.K. Japanese Program for Deep Seabed Mineral Resources DeveIopmen. In Proceedings of the Offshore Technology Conference, Houston, TX, USA, 1–4 May 1995. [Google Scholar]
- Zou, W. COMRA’s Research On Lifting Motor Pump. In Proceedings of the Seventh (2007) ISOPE Ocean Mining Symposium, Lisbon, Portugal, 1–6 July 2007. [Google Scholar]
- McFarlane, J.; Brockett, T.; Huizingh, J.P. Analysis of mining technologies developed in the 1970’s and 1980’s. In Proceedings of the Workshop on Polymetallic Nodule Mining Technology Current Status and Challenges Ahead, Chennai, India, 18–22 February 2008. [Google Scholar]
- Pitchumani, R.; Meesters, G.; Scarlett, B. Breakage behaviour of enzyme granules in a repeated impact test. Powder Technol. 2003, 130, 421–427. [Google Scholar] [CrossRef] [Green Version]
- Pitchumani, R.; Strien, S.A.; Meesters, G.; Schaafsma, S.H.; Scarlett, B. Breakage of sodium benzoate granules under repeated impact conditions. Powder Technol. 2004, 140, 240–247. [Google Scholar] [CrossRef] [Green Version]
- Reynolds, G.K.; Fu, J.S.; Cheong, Y.S.; Hounslow, M.J.; Salman, A.D. Breakage in granulation: A review. Chem. Eng. Sci. 2005, 60, 3969–3992. [Google Scholar] [CrossRef]
- Dreiseitl, I. About geotechnical properties of the deep seabed polymetallic nodules. In Proceedings of the 18th International Conference on Transport and Sedimentation of Solid Particles, Prague, Czech Republic, 11–15 September 2017. [Google Scholar]
- Yamazaki, T.; Sharma, R. Preliminary Experiment on Powderization of Deep-sea Sediment during Hydraulic Transportation. In Proceedings of the Fourth (2001) Ocean Mining Symposium, Szczecin, Poland, 23–27 September 2001. [Google Scholar]
- Zenhorst, J. Degradation of Poly-Metallic Nodules in a Dredge Pump. Master’s Thesis, Technische Universiteit Delft, Delft, The Netherlands, 2016. [Google Scholar]
- Helmons, R. Excavation of Hard Deposits and Rocks, on the Cutting of Saturated Rock. Ph.D. Thesis, Technische Universiteit Delft, Delft, The Netherlands, 2017. [Google Scholar]
- Van Wijk, J.M.; Haalboom, S.; de Hoog, E.; de Stigter, H.; Smit, M.G. Impact fragmentation of polymetallic nodules under deep ocean pressure conditions. Miner. Eng. 2019, 134, 250–260. [Google Scholar] [CrossRef]
- Pradip; Gautham, B.P.; Reddy, S.; Runkana, V. Future of Mining, Mineral Processing and Metal Extraction Industry. Trans. Indian Inst. Met. 2019, 72, 2159–2177. [Google Scholar] [CrossRef]
- Van Wijk, J.M.; Hoog, E.D. Size reduction of CCZ polymetallic nodules under repeated impact fragmentation. Results Eng. 2020, 7, 100154. [Google Scholar] [CrossRef]
- Dai, Y.; Zhang, Y.; Li, X. Numerical and experimental investigations on pipeline internal solid-liquid mixed fluid for deep ocean mining. Ocean Eng. 2021, 220, 108411. [Google Scholar] [CrossRef]
- Noon, A.A.; Kim, M.-H. Erosion wear on centrifugal pump casing due to slurry flow. Wear 2016, 364–365, 103–111. [Google Scholar] [CrossRef]
- Yang, H.; Liu, S. A new lifting pump for deep-sea mining. J. Mar. Eng. Technol. 2020, 19, 102–108. [Google Scholar] [CrossRef]
- Wilson, K.C.; Addie, G.R. Coarse-particle pipeline transport: Effect of particle degradation on friction. Powder Technol. 1997, 94, 235–238. [Google Scholar] [CrossRef]
- Chapelle, P.; Abou-Chakra, H.; Christakis, N.; Bridle, I.; Cross, M. Numerical predictions of particle degradation in industrial-scale pneumatic conveyors. Powder Technol. 2004, 143, 321–330. [Google Scholar] [CrossRef]
- Chapelle, P.; Abou-Chakra, H.; Christakis, N.; Patel, M.; Abu-Nahar, A.; Tüzün., U.; Cross, M. Computational model for prediction of particle degradation during dilute-phase pneumatic conveying: The use of a laboratory-scale degradation tester for the determination of degradation propensity. Adv. Powder Technol. 2004, 15, 13–29. [Google Scholar] [CrossRef] [Green Version]
- Crowe, C.T.; Schwartzkopf, J.D.; Sommerfield, M.; Tsuji, Y. Multiphase Flows with Droplets and Particles, 2nd ed.; CRC Press: Boca Raton, FL, USA, 2012; pp. 25–26. [Google Scholar]
- Van Wijk, J.M.; Talmon, A.M.; Rhee, C.V. Stability of vertical hydraulic transport processes for deep ocean mining: An experimental study. Ocean Eng. 2016, 125, 203–213. [Google Scholar] [CrossRef]
- Brown, P.P.; Lawler, D.F. Sphere Drag and Settling Velocity Revisited. J. Environ. Eng. 2003, 129, 222–231. [Google Scholar] [CrossRef]
- Rzeznik, A.J.; Flierl, G.R.; Peacock, T. Model investigations of discharge plumes generated by deep-sea nodule mining operations. Ocean Eng. 2019, 172, 684–696. [Google Scholar] [CrossRef]
- Oebius, H.U.; Becker, H.J.; Rolinski, S.; Jankowski, J.A. Parametrization and evaluation of marine environmental impacts produced by deep-sea manganese nodule mining. Deep. Sea Res. Part II Top. Stud. Oceanogr. 2001, 48, 3453–3467. [Google Scholar] [CrossRef]
- Yamazaki, T.; Tsurusaki, K.; Handa, K. Discharge from manganese nodule mining system. In Proceedings of the First (1991) International Offshore and Polar Engineering Conference, Edinburgh, UK, 11–16 August 1991. [Google Scholar]
- Boetius, A.; Haeckel, M. Mind the seafloor. Science 2018, 359, 34–36. [Google Scholar] [CrossRef]
- Jones, D.O.B.; Ardron, J.A.; Colaço, A.; Durden, J.M. Environmental considerations for impact and preservation reference zones for deep-sea polymetallic nodule mining. Mar. Policy 2020, 118, 103312. [Google Scholar] [CrossRef]
- Pinheiro, M.; Oliveira, A.; Barros, S.; Alves, N.; Raimundo, J.; Caetano, M.; Coimbra, J.; Neuparth, T.; Santos, M.M. Functional, biochemical and molecular impact of sediment plumes from deep-sea mining on Mytilus galloprovincialis under hyperbaric conditions. Environ. Res. 2021, 195, 110753. [Google Scholar] [CrossRef] [PubMed]
- Yoon, C.H.; Kim, J.; Park, H.; Yoo, K. The distribution of particle size and composition of manganese nodule comminuted during lifting. Geosyst. Eng. 2015, 18, 348–352. [Google Scholar] [CrossRef]
- Zawadzki, D.; Maciąg, Ł.; Abramowski, T.; McCartney, K. Fractionation Trends and Variability of Rare Earth Elements and Selected Critical Metals in Pelagic Sediment from Abyssal Basin of NE Pacific (Clarion-Clipperton Fracture Zone). Minerals 2020, 10, 320. [Google Scholar] [CrossRef] [Green Version]
- Kim, M.G.; Hyeong, K.; Yoo, C.M.; Lee, J.Y.; Seo, I. Characterization of Fines Produced by Degradation of Polymetallic Nodules from the Clarion–Clipperton Zone. Minerals 2021, 11, 205. [Google Scholar] [CrossRef]
- Arabnejad, H.; Mansouri, A.; Shirazi, S.A.; McLaury, B.S. Development of mechanistic erosion equation for solid particles. Wear 2015, 332–333, 1044–1050. [Google Scholar] [CrossRef]
Figure 1.
Schematic diagram of China polymetallic nodules deep-sea mining pilot system.

Figure 2.
Single-stage lifting motor pump cross-section.

Figure 3.
Nodule degradation experimental system.

Figure 4.
Deep-sea six-stage lifting motor pump.

Figure 5.
Multi-stage reducer and electric pipe clamp valves.

Figure 6.
The particle recovery device.

Figure 7.
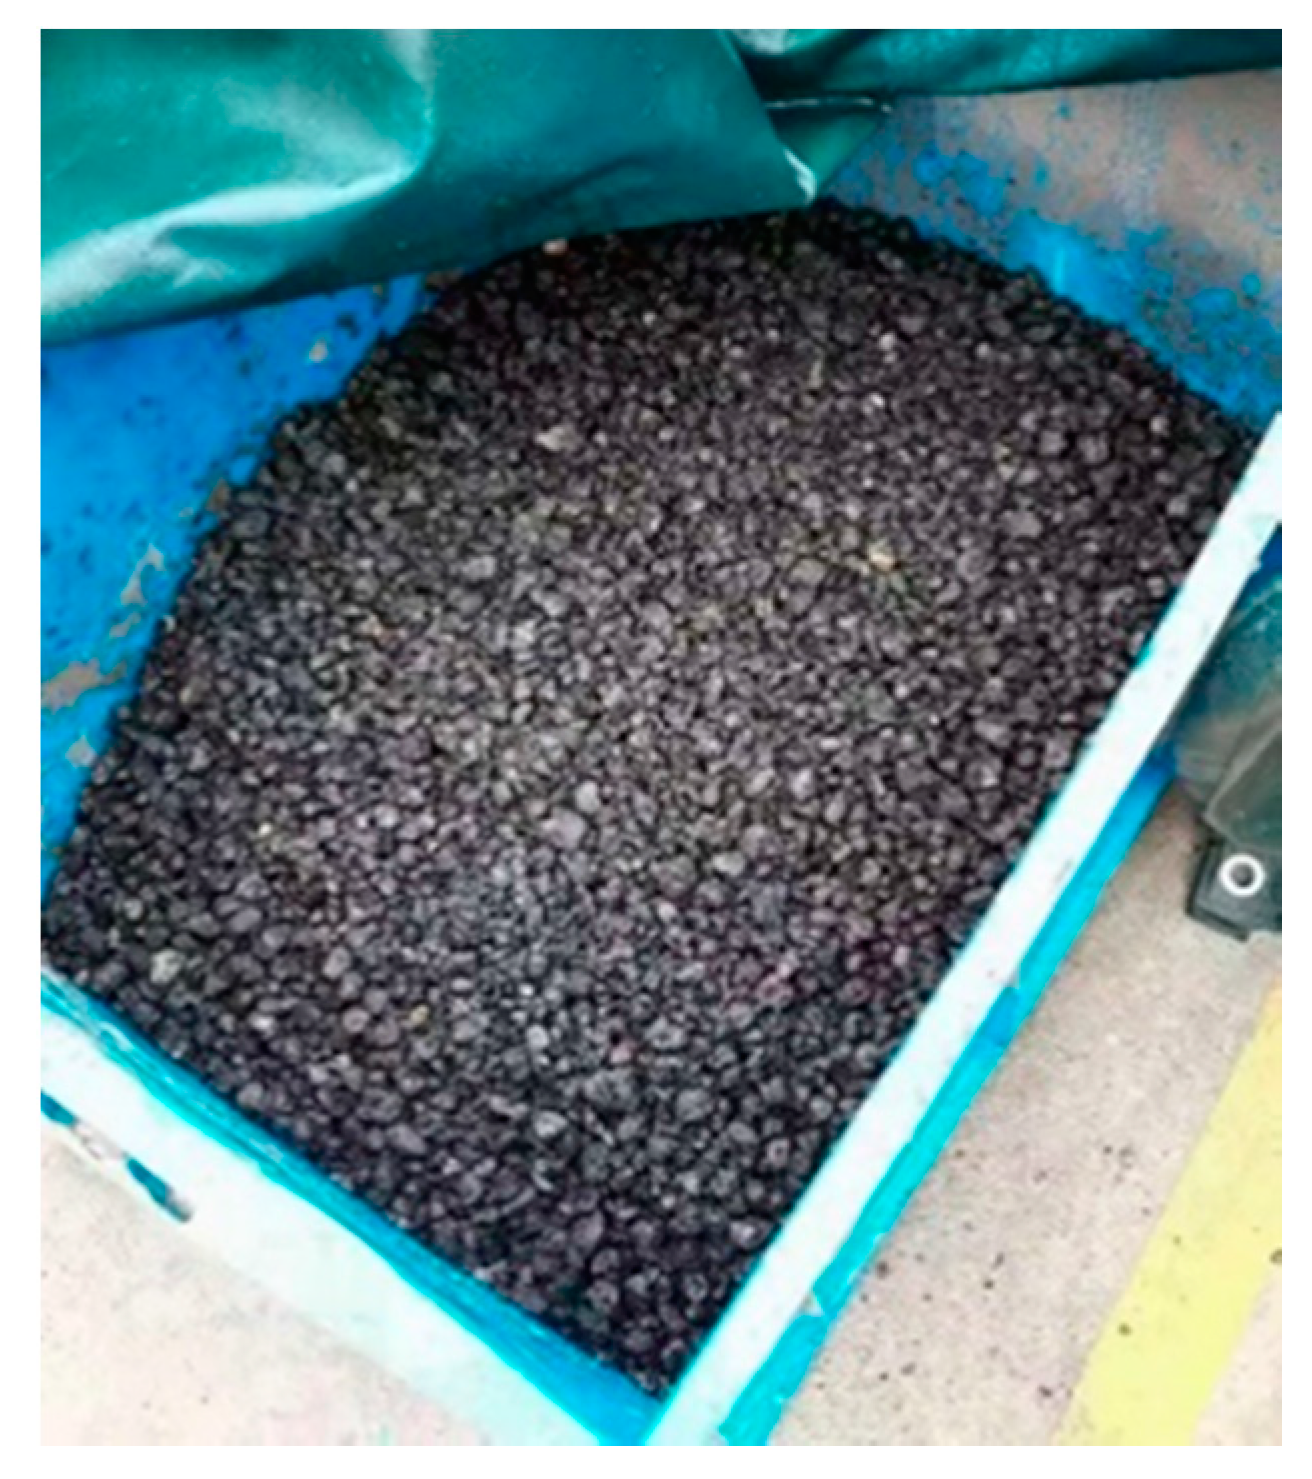
The nodules after crushing by the crusher.

Figure 8.
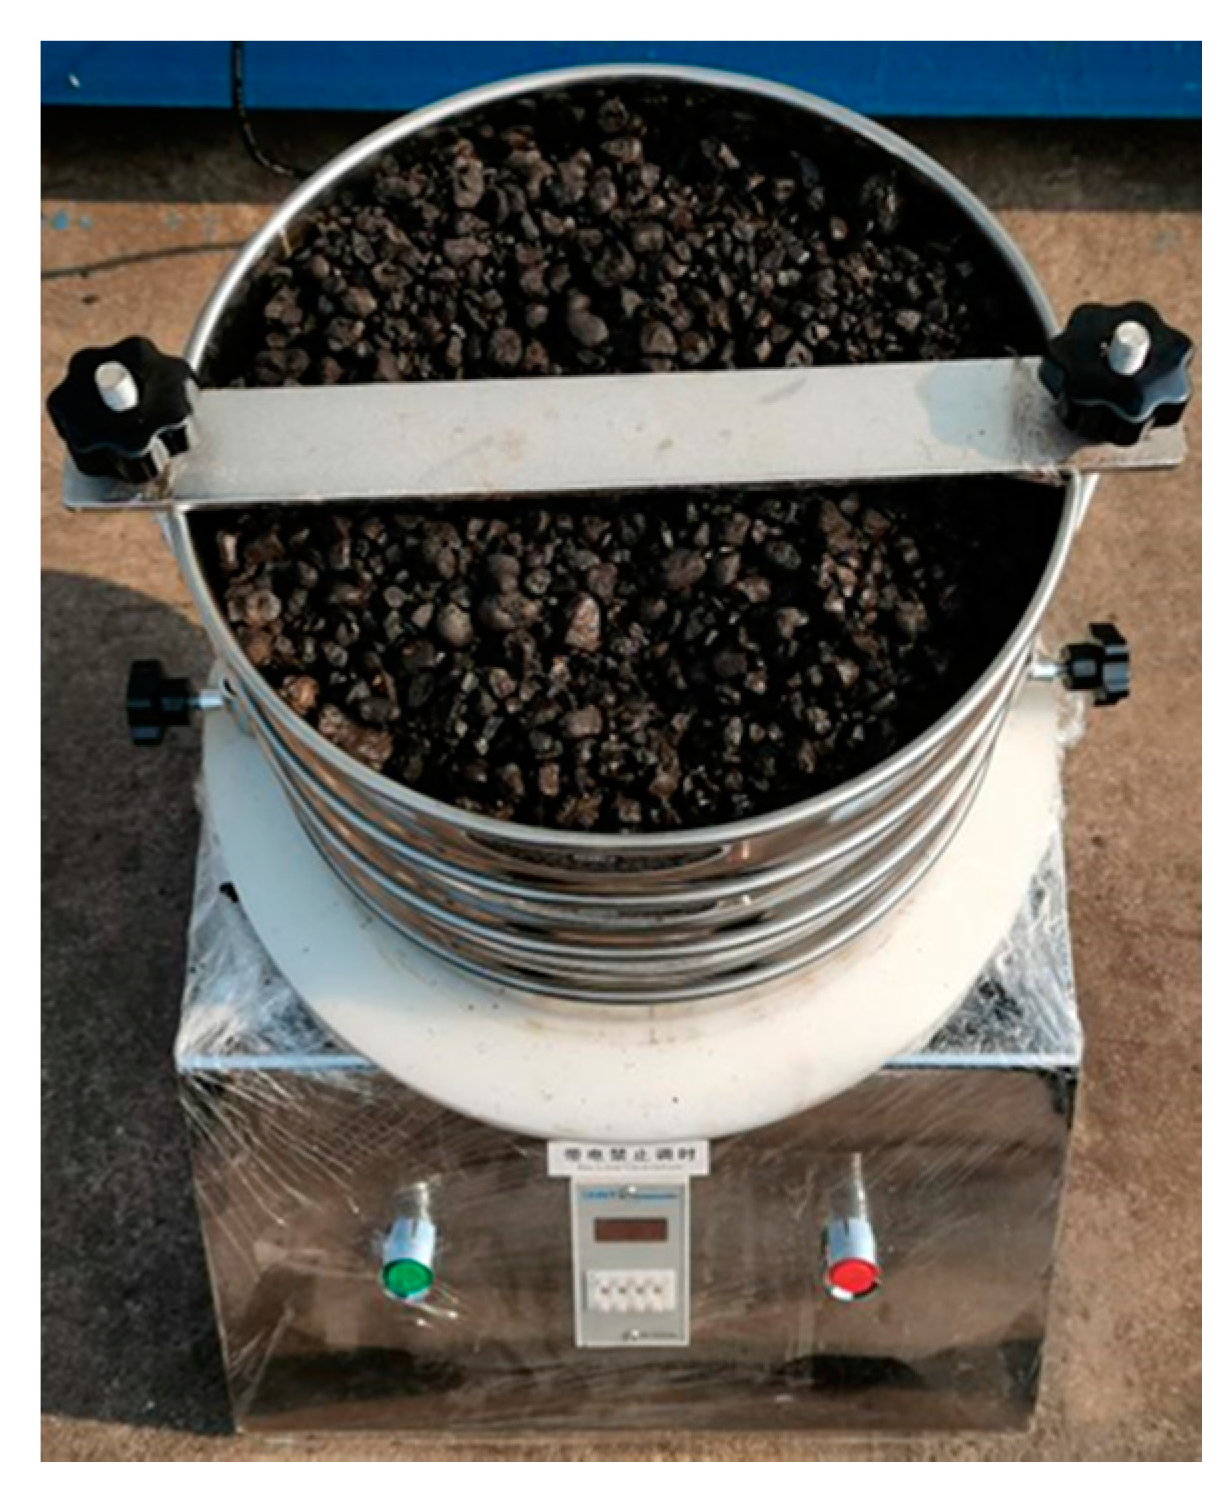
Vibrating screening machine.

Figure 9.
Comparison of PSD of polymetallic nodules with different passes (100 means that the percentage of particle size class is 100%, and 10−4 means that the percentage of particle size class is 0.01%).
Figure 9.
Comparison of PSD of polymetallic nodules with different passes (100 means that the percentage of particle size class is 100%, and 10−4 means that the percentage of particle size class is 0.01%).

Figure 10.
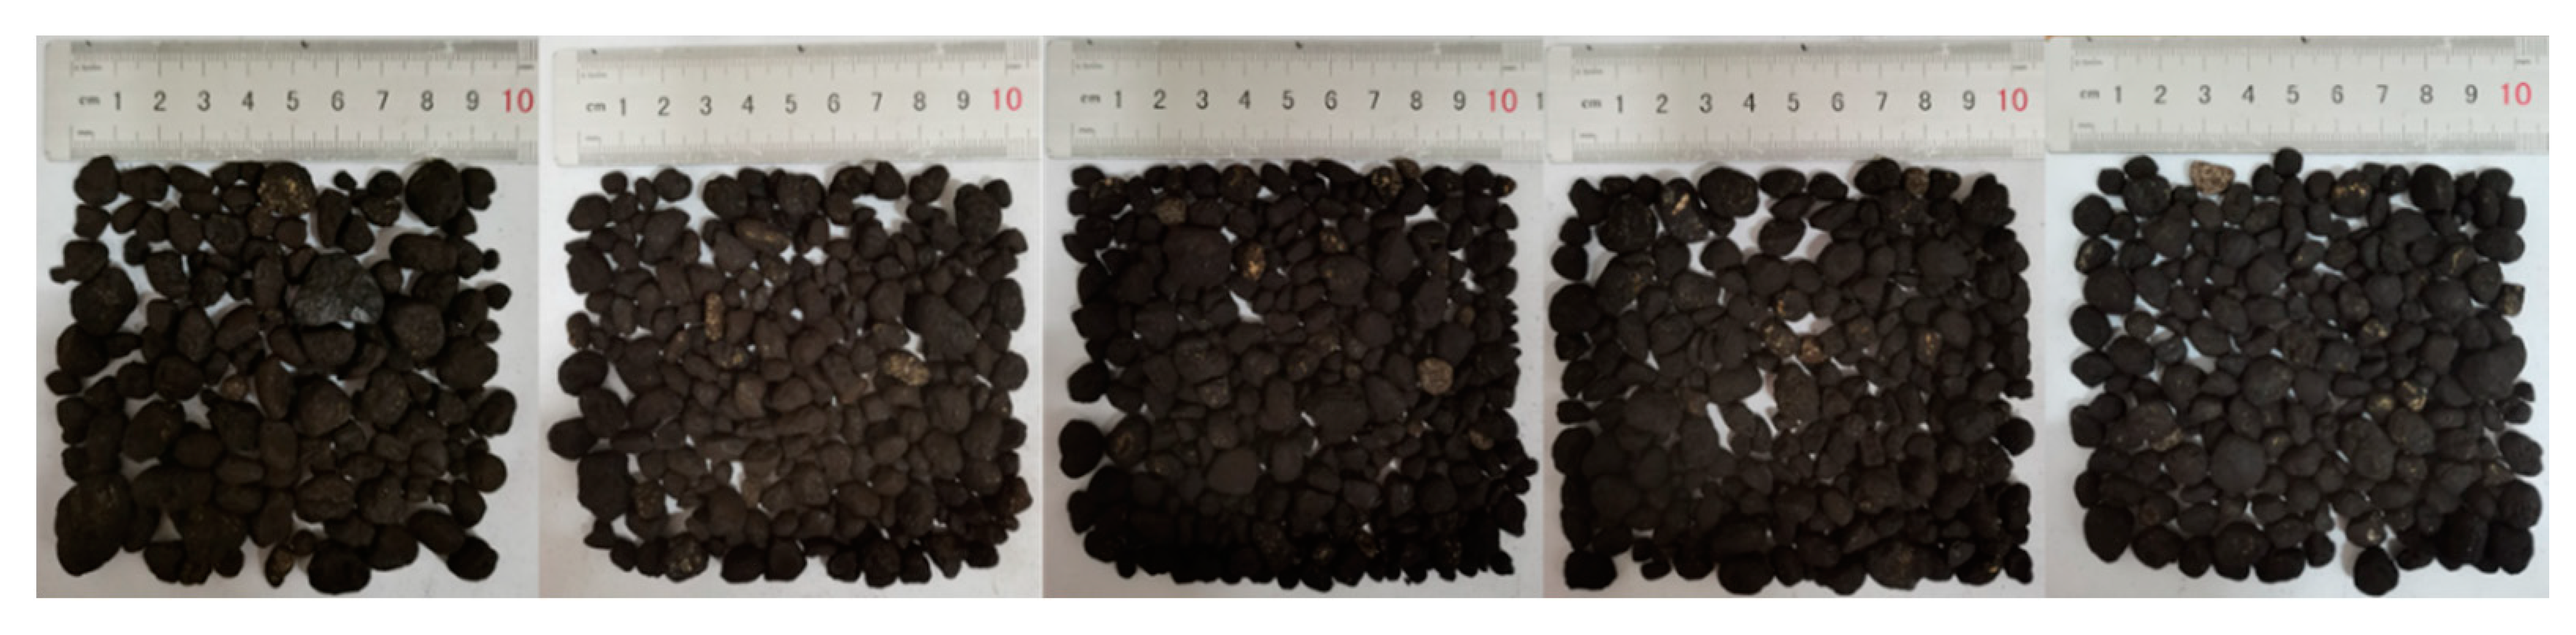
PSD of polymetallic nodules after passing different pump times (the leftmost is the first time, and the rightmost is the fifth time).
Figure 10.
PSD of polymetallic nodules after passing different pump times (the leftmost is the first time, and the rightmost is the fifth time).

Figure 11.
The degradation rate change of different classes of nodules after multiple impacts.

Figure 12.
The predicted and experimental results of the PSD of nodules after running for 10 min (54 impacts) in the experimental system. (100 means that the percentage of particles of the size class is 100%, and 10−4 means that the percentage of particles of the size class is 0.01%).
Figure 12.
The predicted and experimental results of the PSD of nodules after running for 10 min (54 impacts) in the experimental system. (100 means that the percentage of particles of the size class is 100%, and 10−4 means that the percentage of particles of the size class is 0.01%).

Figure 13.
PSD of polymetallic nodules in the original (left) and after running for 10 min (54 impacts) in the experimental system (right).
Figure 13.
PSD of polymetallic nodules in the original (left) and after running for 10 min (54 impacts) in the experimental system (right).

Figure 14.
The predicted degradation rate and experimental value of different classes of nodules after running for 10 min in the experimental system (54 impacts).
Figure 14.
The predicted degradation rate and experimental value of different classes of nodules after running for 10 min in the experimental system (54 impacts).


Table 1.
The structure and hydraulic parameters of the six-stage lifting motor pump.
| Description | Parameter | Value |
|---|---|---|
| Work Flow Rate | Data Q (m3/h) | 450 |
| Stage | S | 6 |
| Total Head | H (m) | 93 |
| Single Head | Hs (m) | 15.5 |
| Work Rotation Speed | n (rpm) | 900 |
| Impeller | Inlet diameter of the impeller Dii (mm) | 235 |
| Outer diameter of the impeller Dio (mm) | 410 | |
| Number of the blade Z1 | 4 | |
| Inlet placement angle α1 | 35° | |
| Outer placement angle α2 | 32.5° | |
| Blade wrap angle α3 | 110° | |
| Space Guide Vanes | Minimum diameter of streamline Ddmin (mm) | 395 |
| Maximum diameter of streamline Ddmax (mm) | 516 | |
| Number of the guide vanes Z2 | 5 | |
| Inlet placement angle β1 | 12° | |
| Outer placement angle β2 | 85° | |
| Blade wrap angle β3 | 97° |
Table 2.
Parameter values and correlation coefficients in the Equation (13).
| Description | ai | bi | R2 |
|---|---|---|---|
| <1 mm | 0.0291 | −0.1385 | 0.994 |
| 1–3 mm | 0.0240 | −0.1137 | 0.997 |
| 3–5 mm | −0.0098 | 0.0376 | 0.928 |
| 5–8 mm | 0.0155 | −0.0591 | 0.965 |
| 8–10 mm | −0.0054 | 0.0526 | 0.885 |
| 10–13 mm | −0.0160 | 0.0993 | 0.929 |
| 13–15 mm | 0.0137 | 0.0056 | 0.898 |
Publisher’s Note: MDPI stays neutral with regard to jurisdictional claims in published maps and institutional affiliations. |
© 2021 by the authors. Licensee MDPI, Basel, Switzerland. This article is an open access article distributed under the terms and conditions of the Creative Commons Attribution (CC BY) license (https://creativecommons.org/licenses/by/4.0/).
Share and Cite
MDPI and ACS Style
Li, Y.; Liang, K.; Dai, H.; Zhang, C. Degradation of Polymetallic Nodules in Deep-Sea Multi-Stage Lifting Motor Pump. Minerals 2021, 11, 656. https://doi.org/10.3390/min11060656
AMA Style
Li Y, Liang K, Dai H, Zhang C. Degradation of Polymetallic Nodules in Deep-Sea Multi-Stage Lifting Motor Pump. Minerals. 2021; 11(6):656. https://doi.org/10.3390/min11060656
Chicago/Turabian StyleLi, Yan, Kesen Liang, Huan Dai, and Chi Zhang. 2021. "Degradation of Polymetallic Nodules in Deep-Sea Multi-Stage Lifting Motor Pump" Minerals 11, no. 6: 656. https://doi.org/10.3390/min11060656
Note that from the first issue of 2016, this journal uses article numbers instead of page numbers. See further details here.