Article

Evaluation of the Tolerance Ability of Wheat Genotypes to Drought Stress: Dissection through Culm-Reserves Contribution and Grain Filling Physiology

by
Md. Amirul Islam
1,2,†,
Rajib Kumar De
3,†,
Md. Alamgir Hossain
1,*,
Md. Sabibul Haque
1,
Md. Nesar Uddin
1,
Md. Solaiman Ali Fakir
1,
Md. Abdul Kader
4,5,
Eldessoky S. Dessoky
6,*,
Attia O. Attia
6,
Ehab I. El-Hallous
6 and
Akbar Hossain
7,*
1
Department of Crop Botany, Bangladesh Agricultural University, Mymensingh 2202, Bangladesh
2
International Maize and Wheat Improvement Center (CIMMYT), Dhaka 1212, Bangladesh
3
Department of Seed Science & Technology, Bangladesh Agricultural University, Mymensingh 2202, Bangladesh
4
Department of Soil Science, Bangladesh Agricultural University, Mymensingh 2202, Bangladesh
5
School of Agriculture, Geography, Environment, Ocean and Natural Science, University of South Pacific, Apia 1343, Samoa
6
Department of Biology, College of Science, Taif University, P.O. Box 11099, Taif 21944, Saudi Arabia
7
Department of Agronomy, Bangladesh Wheat and Maize Research Institute, Dinajpur 5200, Bangladesh
*
Authors to whom correspondence should be addressed.
Authors contributed equally.
Agronomy 2021, 11(6), 1252; https://doi.org/10.3390/agronomy11061252
Submission received: 13 May 2021 / Revised: 13 June 2021 / Accepted: 16 June 2021 / Published: 21 June 2021
(This article belongs to the Collection Crop Physiology and Stress)

Abstract

:
Drought stress is one of the limiting factors for grain filling and yield in wheat. The grain filling and determinants of individual grain weight depend on current assimilation and extent of remobilization of culm reserves to grains. A pot experiment was conducted with eight wheat cultivars at the Pot House to study the grain filling and the contributions of reserves in culm, including the sheath to grain yield under drought stress. Drought stress was enforced by restricting irrigation during the grain-filling period. The plants (tillers) were harvested at anthesis, milk-ripe, and maturity. The changes in dry weights of leaves, culm with sheath, spikes, and grains; and the contribution of culm reserves to grain yield were determined. Results revealed that drought stress considerably decreased the grain filling duration by 15–24% and grain yield by 11–34%. Further, drought-induced early leaf senescence and reduced total dry matter production indicate the minimum contribution of current assimilation to grain yield. The stress reduced the contribution of culm reserves, the water-soluble carbohydrates (WSCs), to the grains. The accumulation of culm WSCs reached peak at milk ripe stage in control, varied from 28.6 to 84 mg culm−1 and that significantly reduced in the range from 14.9 to 40.6 mg culm−1 in stressed plants. The residual culm WSCs in control and stressed plants varied from 1.23 to 8.12 and 1.00 to 3.40 mg g−1 culm dry mass, respectively. BARI Gom 24 exhibited a higher contribution of culm WSCs to grain yield under drought, while the lowest contribution was found in Kanchan. Considering culm reserves WSCs and their remobilization along with other studied traits, BARI Gom 24 showed greater drought tolerance and revealed potential to grow under water deficit conditions in comparison to other cultivars.

1. Introduction

Drought is one of the major abiotic stresses affecting the productivity of crops worldwide. It impairs plant productivity by inhibiting growth and development [1] Drought reduces morpho-physiological traits such as leaf sizes, photosynthesis rate, stomatal conductance, and alters the plant’s anatomical features [2]. Drought severely limits wheat productivity, and in dry environments, wheat production can be reduced by 50–90% of the crop potential [3]. Drought hampers wheat growth at the seedling stage [4], although water scarcity at the grain development stage reduces grain yields drastically [5,6]. The grain development is the most critical growth phase in wheat under water deficit condition, and drought mediated impairment in the rate and duration of grain filling determines the size of the grains and ultimately causes 31–92% yield reduction [7].
Bangladesh enjoys a subtropical climate, having a dry winter and a very wet summer. Wheat is grown in Bangladesh during the dry winter—with no rainfall, and only a few wheat-growing areas with irrigation facilities. Thus, it is hypothesized that abiotic stress like drought, especially during the grain filling, mainly accounts for the lighter grain weight, the crucial component for lower wheat grain yield in Bangladesh. The rate and duration of grain filling determine the grain weight in wheat [8]. Grain filling starts with the division of endosperm cells followed by the increase in cell volume through the accumulation of assimilate that comes from two major sources—current photosynthesis and mobilization of culm reserves into the growing grains [9,10]. The post-anthesis drought alters the sources and sinks of assimilates and thereby declines the grain filling rate and duration along with final sink capacity [11] Under environmental stress conditions, grain filling mostly depends on re-mobilized culm reserves as the current photosynthesis is down-regulated [12,13,14]. Drought quickly declines photosynthesis in the post-anthesis period, which ultimately restricts the contribution of current assimilates to the grain leading to a considerable reduction in individual grain weight and thereby yield [15]. In a three-year study, the allocation of photosynthates for canopy respiration and grain filling was almost equal. Their sum, in the late grain filling stage, was greater than canopy photosynthesis [16]. Photosynthesis in flag leaf singly cannot support both respiration and kernel development under terminal drought stress [17]. Therefore, a significant quantity of the carbohydrates used during kernel filling must be contributed from reserves [16]. Stored culm reserves, mainly water-soluble carbohydrates (WSCs), can serve as a buffer to continue a steady rate of grain filling under stressful environments. The WSCs, mainly glucose, fructose, sucrose, and fructans, accumulated in the stem and sheath of wheat during the period from stem elongation to the early phase of grain filling, which could be remobilized during the later stage of grain filling [15] Under typical conditions, the accretion of WSCs can be 10–80% of the culm dry weight and may contribute 5–80% of the final grain weight depending on the genotypes and environmental conditions [15,18,19,20,21]. There are considerable genotypic variations in stem WSC concentration observed in wheat [11,22]. The drought-tolerant genotype is superior in WSC partitioning than the drought-sensitive due to its more substantial capacity for stem WSCs remobilization [23]. Therefore, the potential accumulation of culm WSCs and its subsequent remobilization to developing grains might be considered for selecting or introducing cultivars for the stressful environment during the post-anthesis period [16,24,25,26,27].
However, no information is available about the contributions of culm WSCs to grain weight in Bangladeshi wheat cultivars, especially under drought stress. Drought stress is becoming severe and more frequent in the Indo-Gangetic floodplain due to global climate change, particularly during the later part of the winter wheat growing season [28]. Therefore, it is necessary to know the grain filling pattern of the Bangladeshi wheat cultivars under drought stress. The study was aimed to screen some Bangladeshi wheat cultivars in respect to the extent of contribution of culm WSCs under drought stress for the development of drought-tolerant wheat cultivars to sustain food security for a rapidly growing population of Bangladesh.

2. Materials and Methods

2.1. Experimentation

A pot experiment was conducted at the Pot House of Botanical Garden, Bangladesh Agricultural University, Mymensingh (24°75′ N, 90°50′ E, and 18 m ASL) from November 2014 to March 2015. The experimental site belongs to the subtropical humid climate, which is characterized by hot and humid summer (April–September) and dry and cold winter (October–March) [29]. The annual mean temperature of the area is 25.8 °C with a total yearly rainfall of 2427 mm, of which 80% falls between May to September [30]. The experiment was laid out in a completely randomized design (CRD) with three replications. There were two factors in the experiment—wheat cultivars and drought stress. Eight wheat cultivars (Kanchan, BARI Gom 18, BARI Gom 23, BARI Gom 24, BARI Gom 25, BARI Gom 26, BARI Gom 27, and BARI Gom 28) were collected from Bangladesh Agricultural Research Institute (BARI), Gazipur, and sown on 20 November 2014 in 104 pots (35 cm height and 27 cm diameter) @14 seeds pot−1. Each pot was prepared with 15 kg of soil. The soil was collected from the field and mixed with well-decomposed cow dung at the ratio of 2:1. The soil used belongs to Aeric Haplaqueptat, having a silty-loam texture with a pH value of 6.5. The N, P, and K fertilizers were applied @ 0.7, 0.52, and 0.30 g pot−1, respectively; P and K were applied as basal dose during pot preparation while N was applied in two instalments at tillering and anthesis with irrigation water. The plants were thinned to seven plants pot−1 at 25 days after sowing (DAS), and other intercultural practices like weeding, irrigation, etc. were done as necessary.
Drought stress was imposed at the anthesis on half of the number of pots for each cultivar by manipulating the irrigation in the pots. The pot house was an uncontrolled setting with comparable growing conditions to those found outside. During the treatment time, a transparent polythene covering was temporarily put over the pothouse to prevent the plants from receiving rainwater. Although a sudden light rain combined with a high wind provided only a modest amount of water to all pots at the onset of drought stress, the drought-stressed pot soils quickly recovered to emulate the stress condition. The stressed pots were irrigated once a week with 1 L of water pot−1, while the control pots were irrigated at 2 days intervals with 1.5 L of water pot−1. The irrigation was withheld at the hard dough stage (Zadoks growth scale 87) [31] for both control and stressed plants. The level of drought stress was monitored by measuring soil water tension after imposing drought with the help of an electronic tensiometer (SMS 2500S, SDEC, France) installed in soils of control and stressed pots. The levels of drought stress in the pots were expressed by soil water tension and presented in Figure 1.

2.2. Sampling and Data Recoding

The tillers were tagged for sampling on the first day of showing anthesis. Tillers were sampled at anthesis, milk ripe, and maturity stages for all the cultivars in control and stress treatments from all three replications. The tillers were divided into a culm with sheaths, leaves, and spikes, then were oven-dried at 70 °C for 48 h before weighing. The oven-dried culm and sheaths were ground for the chemical analysis of water-soluble carbohydrates (WSCs). The grains were detached from the spikes by a tweezer, counted as grains spike−1 (GPS) and weighed to determine the individual grain weight (GW, mg grain−1).
At maturity, all the plants were harvested for yield and yield components. The plants were dried and weighed to determine the biomass yield (BY, g pot−1). The spikes per pot (SPP) were counted, hand-threshed, and weighed for grain yield (GY, g pot−1). The grains were counted and weighed to determine 1000-grain weight (TGW, g) and the number of grains per spike (GPS).

2.3. Estimation of Phenological Traits

The days to anthesis (DTA, d) was determined when 50% of plants (tillers) in a pot showed at least one extruded anther, and the days to maturity (DTM, d) was determined when the leaves and spike turned yellow, and the grains became hard enough when it was not possible to divide with thumbnail. Grain filling duration (GFD) was calculated as the period between anthesis and maturity. The days to anthesis were defined as the duration from sowing to anthesis. The days to maturity were calculated as the duration from sowing to maturity. The grain filling rate (GFR, mg grain−1 d−1) was calculated by dividing the maximum grain weight by GFD (Julian days) [32]. Oven-dried grain weight (GW) was expressed as mg grain−1).

2.4. Estimation of Culm WSCs

The dried culm (with leaf sheaths) was ground into a coarse powder for extraction and estimation of WSCs through the anthrone method [33] as adopted by Hossain et al. [14]. About 0.5 g of culm powder was taken into a microtube (5 mL), and WSCs were extracted with 80% ethanol at 60 °C for 30 min and then with distilled water twice at 80 °C for 15 min. The extracts were combined in a beaker (30 mL) and evaporated to dryness in an oven at 65 °C. The dried carbohydrates in the beaker were resolved in 5 mL distilled water, and about 1 mL of that extract was taken in a micro-centrifuge tube (1.5 mL). Later, the charcoal powder was added to the extract and was mixed thoroughly with a vortex (touch mixer). The mixed solution was then centrifuged at 5000 rpm for 5 min, and the clear WSCs extract was obtained. Next, the extract was diluted 10–20 times with distilled water. Then, 0.1 mL diluted extract was mixed with ice-cold anthrone reagent (5 mL) followed by heating in a boiling-water bath for 10 min and after that cooled immediately with ice. The absorbance of the cooled solution was measured with a UV-vis spectrophotometer (DR6000, Hach, Dusseldorf, Germany) at 620 nm. The amount of WSCs in the sample was calculated using the regression equation. The amount of remobilized culm WSCs was measured by subtracting residual culm WSCs at maturity from the total culm WSCs at the milk ripe stage (maximum WSCs content) as described by Ehdaie et al. [10].

2.5. Statistical Analysis

All data on yield and yield components, phenological characters, and average grain filling rate were subjected to two factorial analysis of variance (ANOVA) in a completely randomized design (CRD) using Minitab statistical software program. Tukey Pairwise Comparisons of means were also performed by Minitab software. The heat map, scatter plot, and correlation matrix were made using the R program. The multivariate data analysis was performed as principal component analysis (PCA), using MINITAB software.

3. Results

3.1. Yield and Its Components
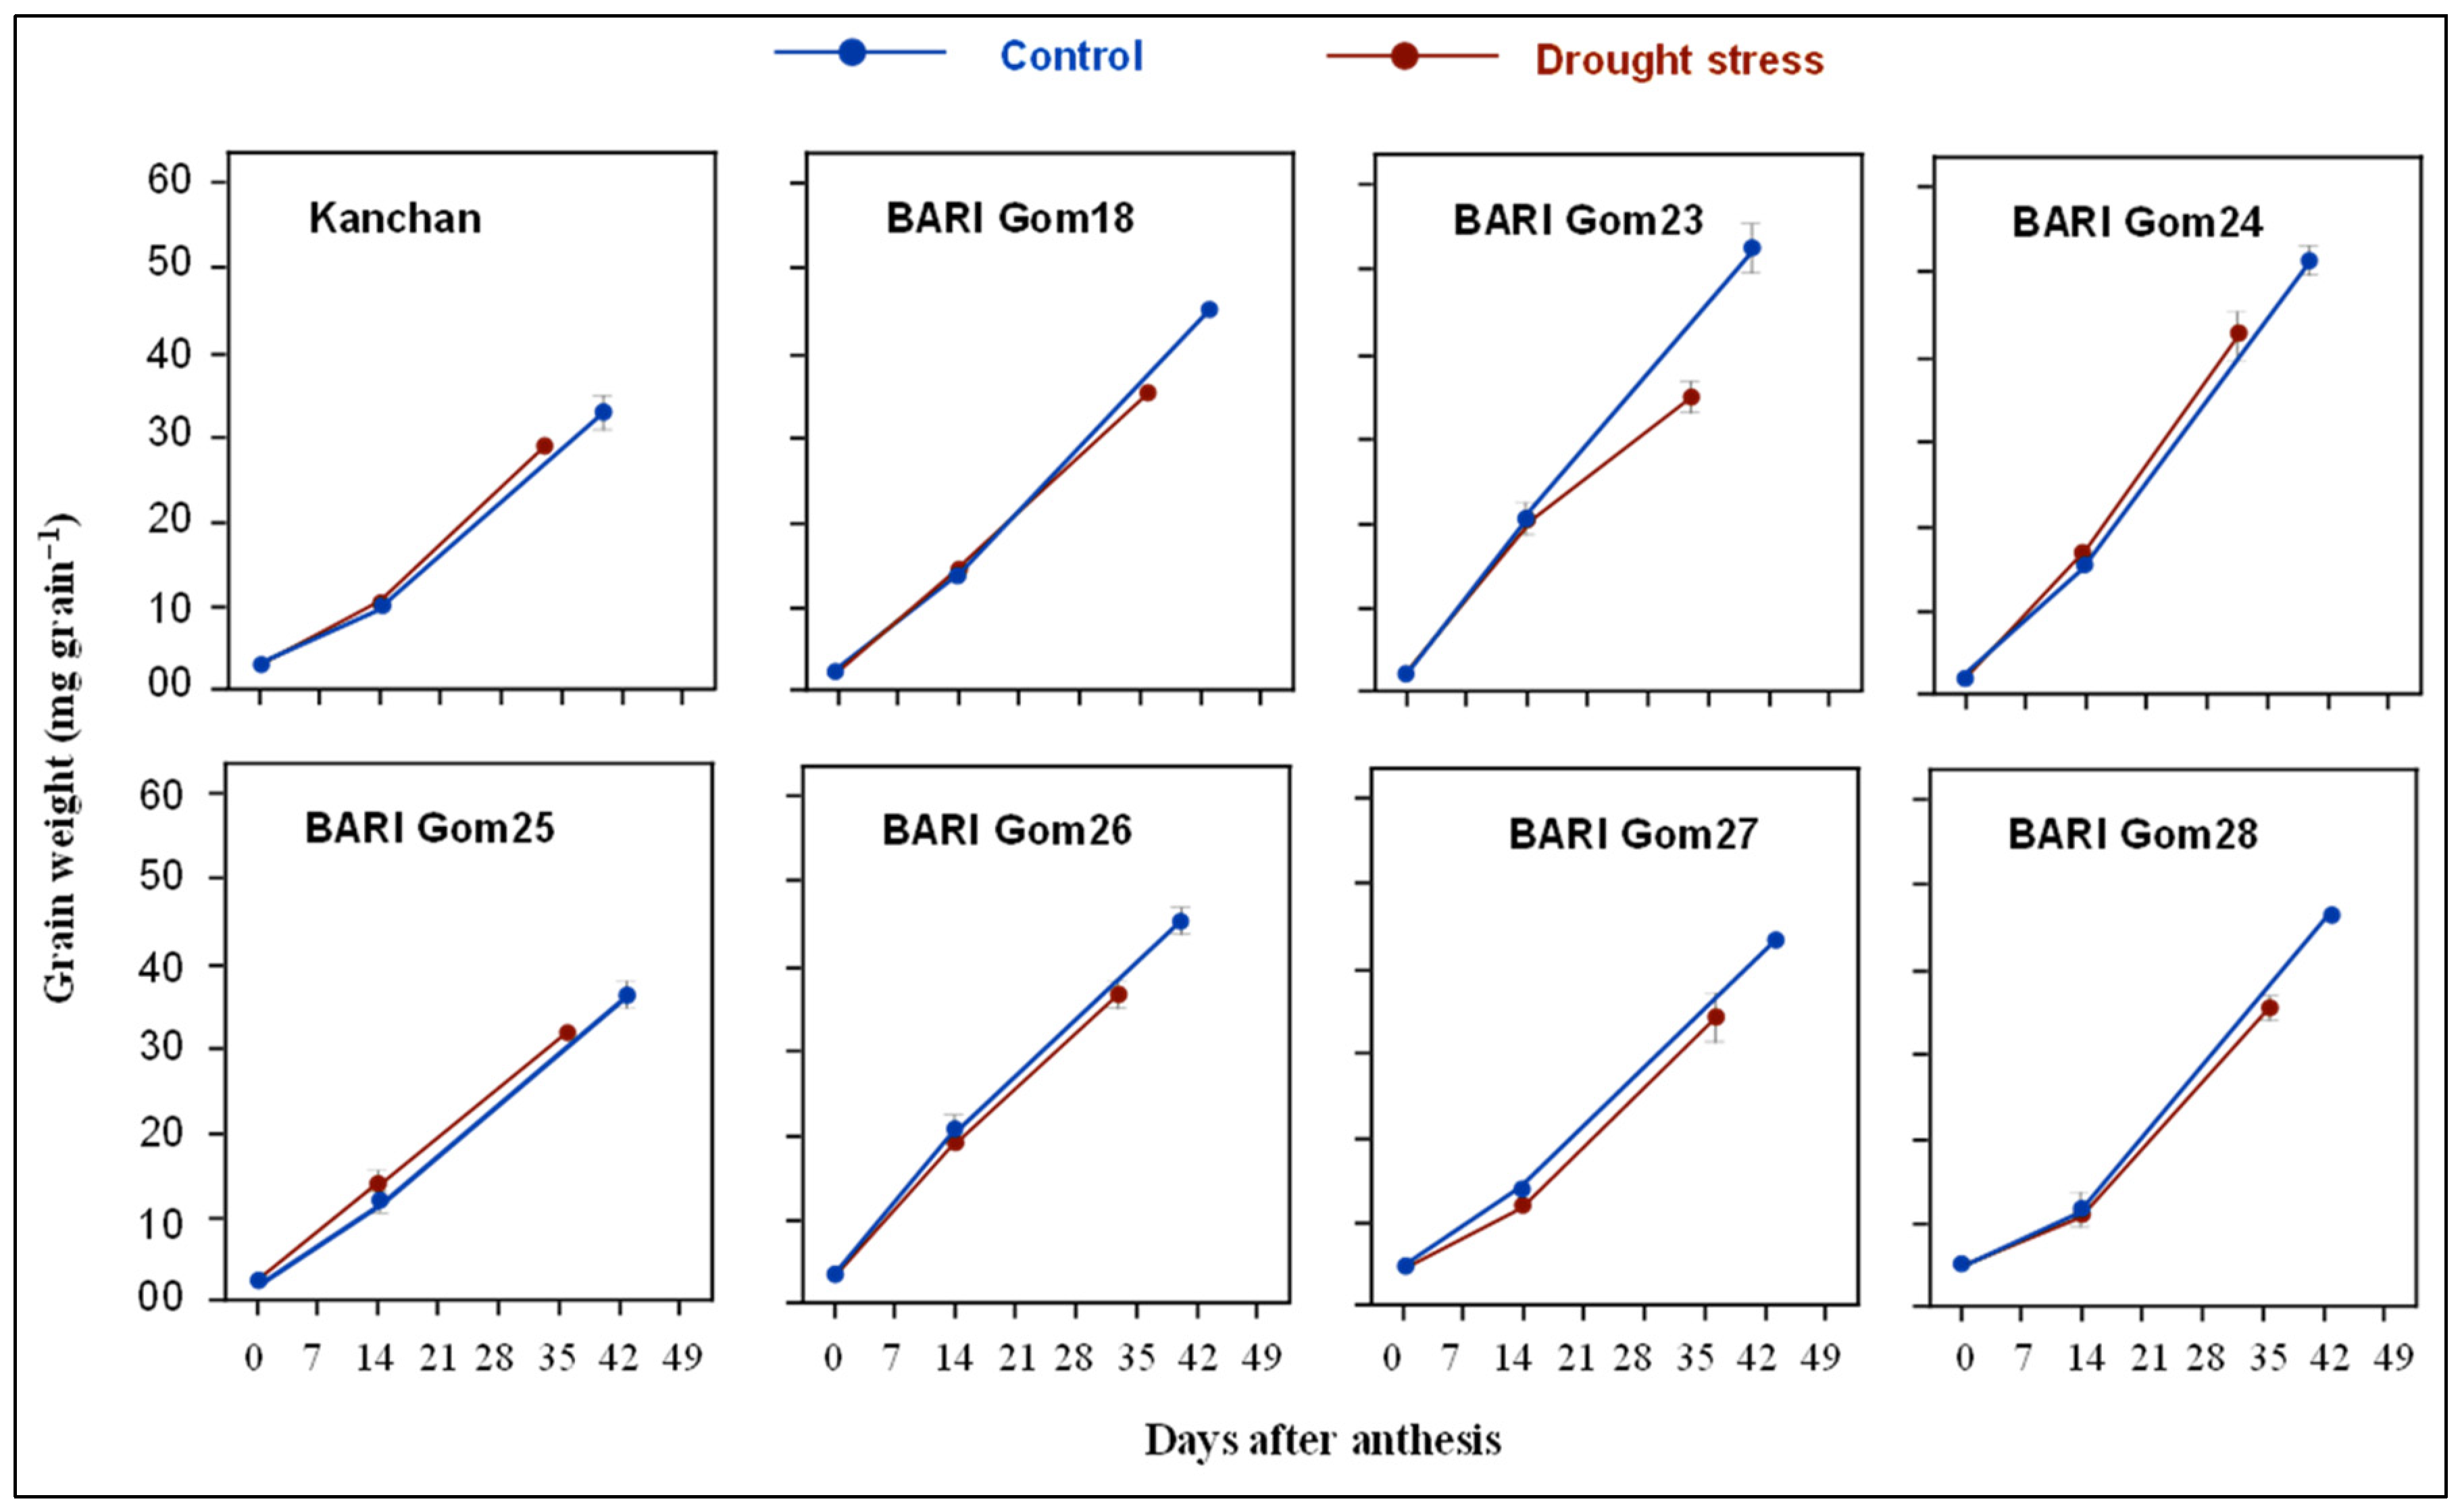
The effect of drought stress during the grain-filling period on grain yield, biomass yield, harvest index, and yield components of eight wheat cultivars is presented in Table 1 and Figure 2.
The post-anthesis drought stress had a significant negative effect (p ≤ 0.01) on the average grain yield of eight wheat cultivars (Figure 2). The post-anthesis drought stress reduced the grain yield by 10.5–33.5% in eight wheat cultivars. The grain yield varied from 12.46 to 27.46 g pot−1 with the mean of 19.90 g pot−1 under control while it ranged from 9.15 to 18.99 g pot−1 with the mean of 12.95 g pot−1 under drought stress. According to grain yield under control condition, the order of the cultivars was as BARI Gom 24 > BARI Gom 23 > BARI Gom 18 > BARI Gom 28 > BARI Gom 27 > BARI Gom 26 > BARI Gom 25 > Kanchan, whereas under stress condition the order was changed as BARI Gom 24 > BARI Gom 27 > BARI Gom 23 > BARI Gom 18 > BARI Gom 26 > BARI Gom 28 > Kanchan > BARI Gom 25 (Table 1).
Furthermore, the biomass yield significantly varied (p ≤ 0.01) among the treatment combinations in the cultivar (C) × stress (S) interaction (Table 1) as well as between the stress treatments as the average of eight cultivars (Figure 2). In contrast, harvest index (HI) exhibited a significant difference (p ≤ 0.01) among the treatment combinations in the C × S interaction (Table 1) but not between stress treatments (Figure 2). HI ranged from 40.17 to 56.63% and from 36.44 to 49.99% under control and stress treatment, respectively. Tukey test realized that neither genotypes nor stress treatments were significantly detrimental to make a variation in HI, except BARI Gom 28 whose harvest index significantly fall due to stress treatment as compared to the control.
Seemingly, the 1000-grain weight showed significant (p ≤ 0.01) variation among the treatment combinations in the C × S interaction (Table 1) and also between the stress treatments (Figure 2). The stress reduced thousand-grain weights by 10.2–32.9% in eight cultivars studied. It varied between 33.12 and 52.40 g with the mean of 44.37 g under control and declined to 29.76 and 42.24 g with the mean of 35.03 g under stressed condition. The order of the cultivars in 1000-grain weight under control was as follows: BARI Gom 23 > BARI Gom 24 > BARI Gom 28 > BARI Gom 18 > BARI Gom 26 > BARI Gom 27 > BARI Gom 25 > Kanchan. The order of the cultivars under the drought stress, on the other hand, changed as follows: BARI Gom 24 > BARI Gom 18 > BARI Gom 26 > BARI Gom 23 > BARI Gom 28 > BARI Gom 27 > BARI Gom 25 > Kanchan. Except for BARI Gom 25 and Kanchan, all genotypes showed a significant decline in TGW under the stressed condition as compared to the respective controls.

3.2. Grain Growth

The dry weight of grain augmented slowly during the preliminary phase of grain filling followed by a sharp rise till maturity in nearly all cultivars (Figure 3). Nevertheless, the growth patterns differed with cultivars along with drought treatments. The cultivars that contain higher grain yield (e.g., BARI Gom 18, BARI Gom 24, BARI Gom 26), exhibited relatively sharper trends towards achieving higher grain weight compared to the cultivars having lower grain yield (e.g., BARI Gom 25 and Kanchan). BARI Gom 24, BARI Gom 18, and BARI Gom 26 possessed higher grain growth under stress conditions compared to other cultivars, and particularly one of the high yielders BARI Gom 23 appeared as the cultivar whose grain growth was most affected under stress despite having a much higher trend at control.

3.3. Changes in Total Dry Mass

The changes in the total dry mass (g/tiller) in eight wheat cultivars in both control and stress conditions during the anthesis and post-anthesis period were depicted in Figure 4. Regardless of stress, almost all cultivars showed steady growth from anthesis to 14 days after anthesis (DAA) followed by either decreasing or more or less unchanged patterns towards maturity. In general, high yielding cultivars e.g., BARI Gom 24, BARI Gom 26, etc. resulted in higher TDM in anthesis compared to low yielders e.g., BARI Gom 25, BARI Gom 27, etc. Considering stress conditions, total dry mass was lower than control.

3.4. Phenological Characters
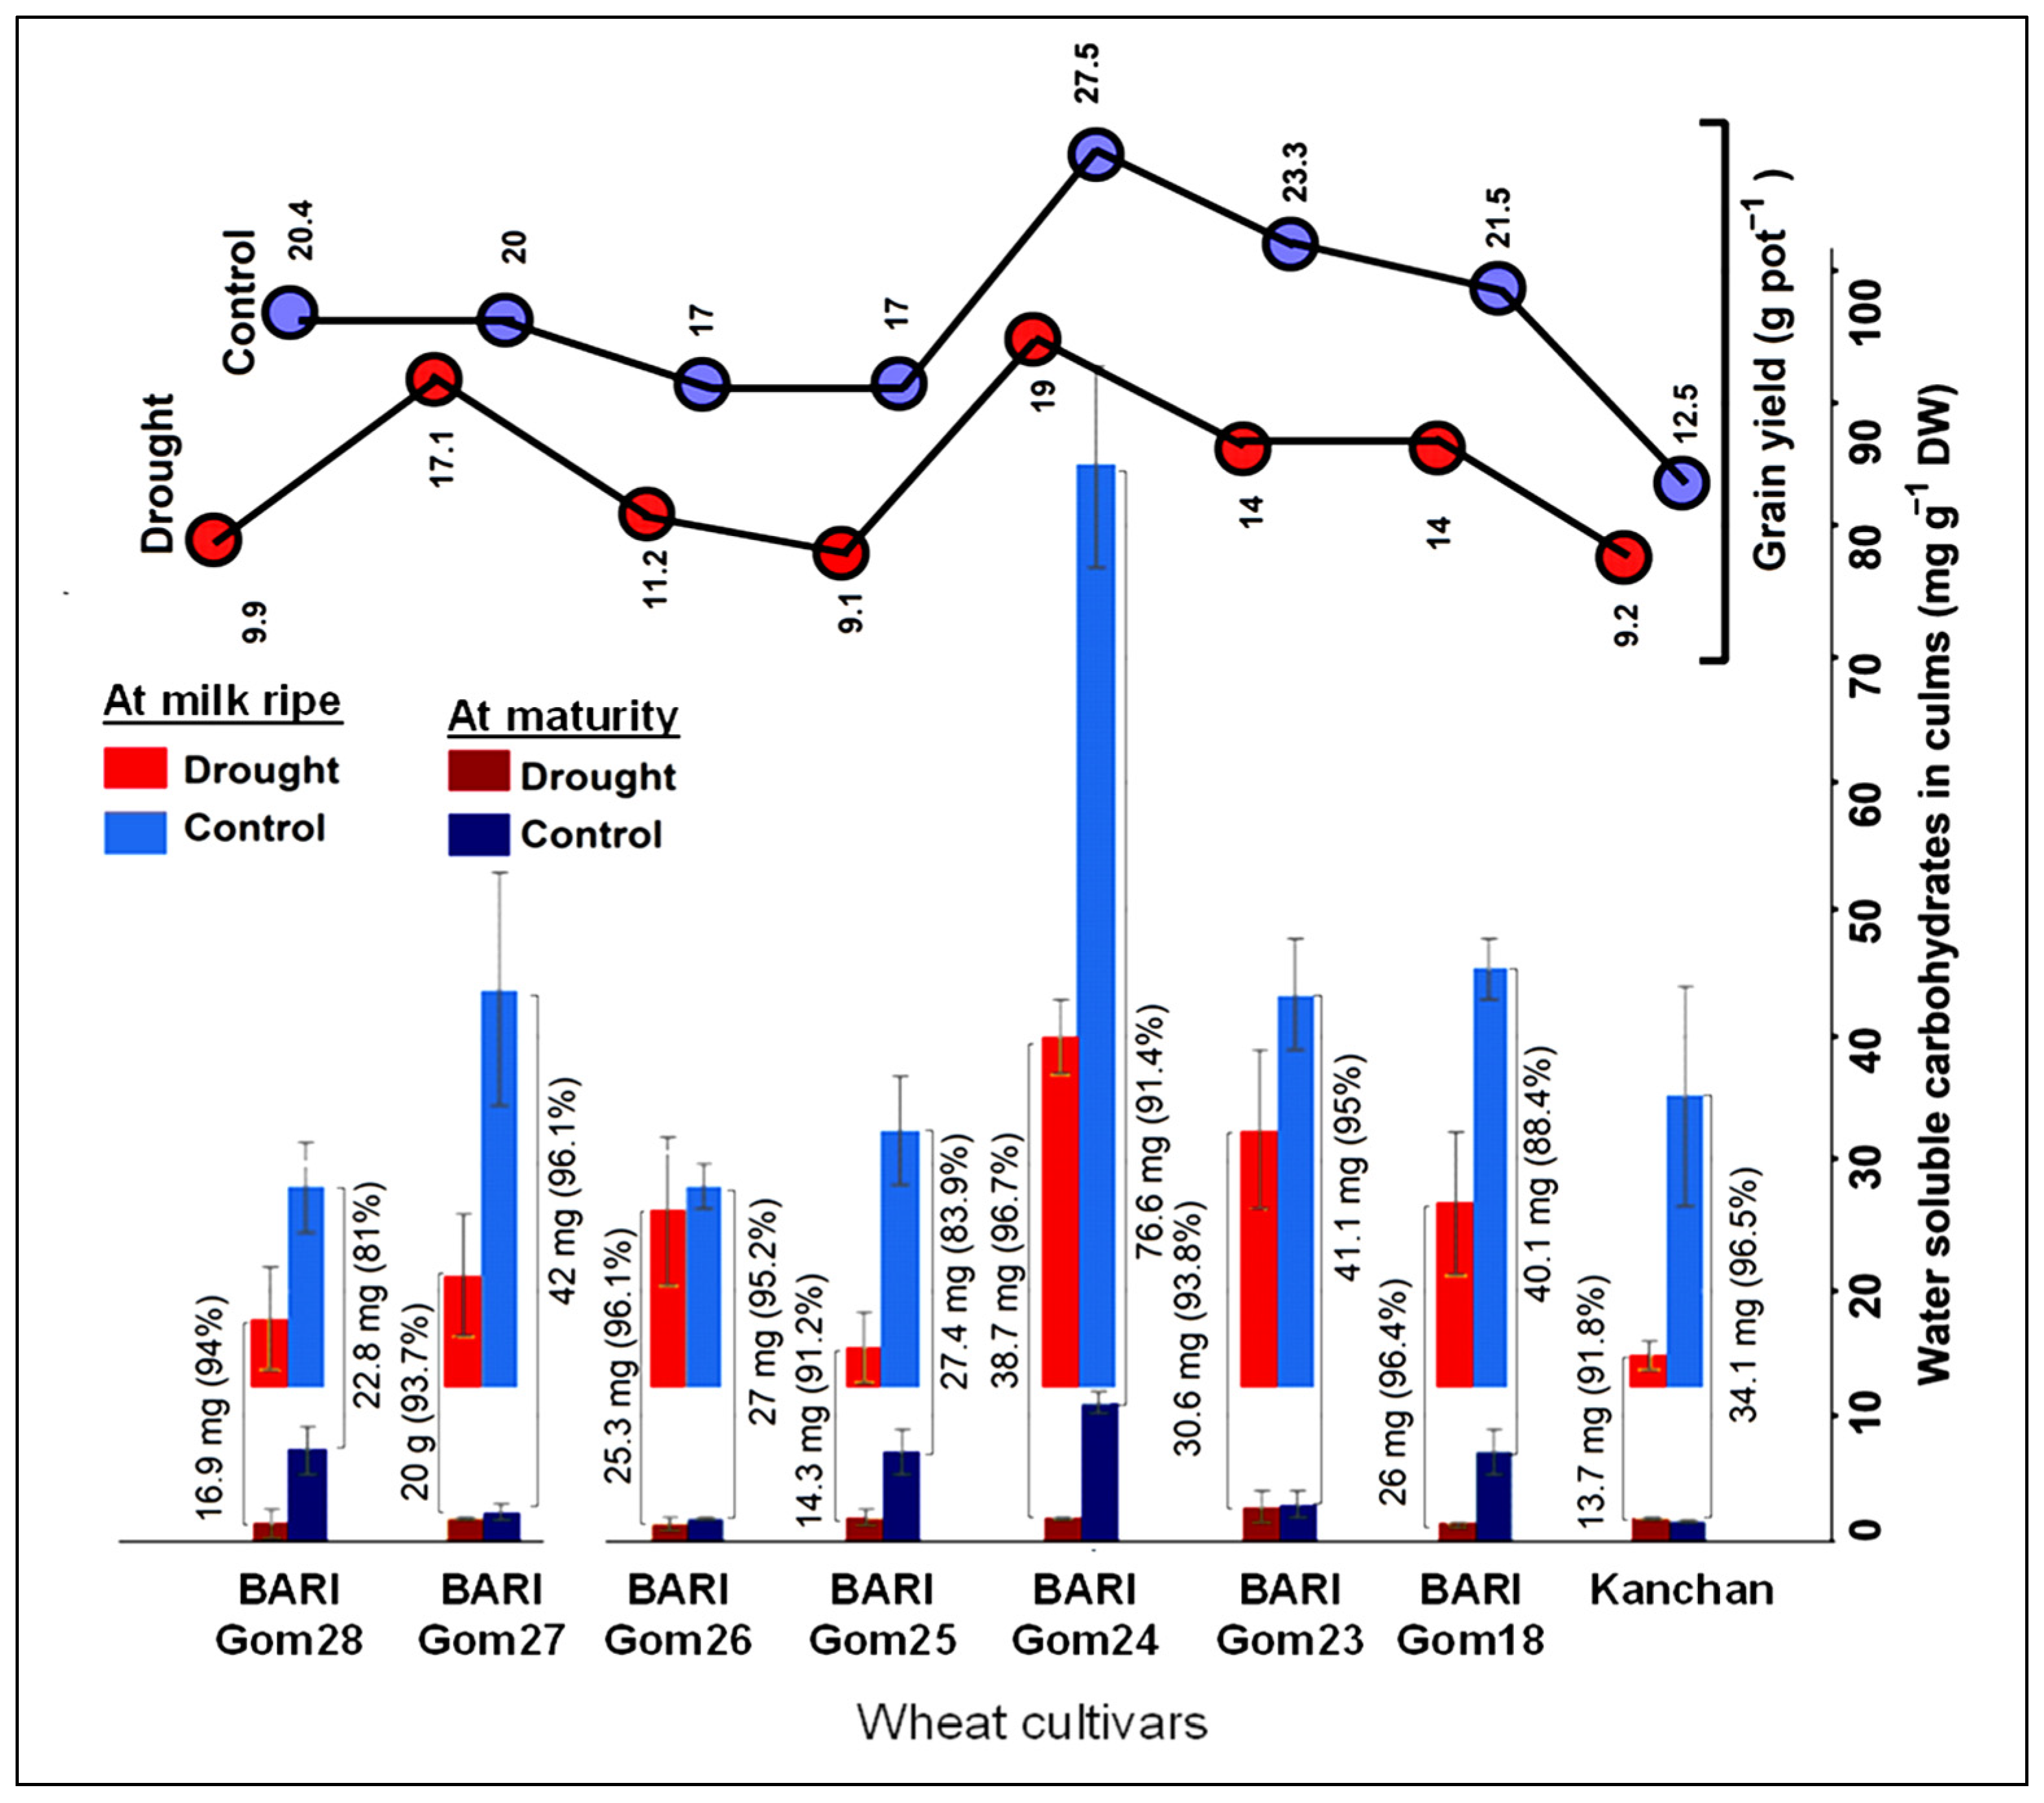
Days to anthesis, days to maturity, grain filling duration, and average grain-filling rate of eight wheat cultivars under control and drought stress conditions are presented in Table 2 and Figure 2. The post-anthesis drought stress had a significant negative effect (p ≤ 0.01) on the average grain grain-filling duration (GFD) of eight wheat cultivars (Figure 2). GFD also varied significantly with the cultivars (Table 2). Grain filling periods were shortened by 6.3–10.0 days in eight wheat cultivars due to the drought stress. There were significant (p ≤ 0.01) differences among the cultivars as well as also between the drought treatments in terms of days to anthesis. The days to maturity also showed significant (p ≤ 0.01) variation with the stress treatment but not with the cultivars. Furthermore, there was significant (p ≤ 0.01) variation among the cultivars in the average grain-filling rate but the influence of stress treatment was rather insignificant (Figure 2). In general, the high yielding cultivars (e.g., BARI Gom 23, BARI Gom 18, BARI Gom 24, etc.) exhibited a comparatively higher grain filling rate compared to the low yielding cultivars (e.g., Kanchan, BARI Gom 25, etc.) under both control and drought conditions.

3.5. Culm Reserves

Figure 5 shows the changes in water-soluble carbohydrates (WSCs) at milk ripe and maturity of eight wheat cultivars and remobilization of WSCs to the grains as a difference in WSCs between these two stages in response to post-anthesis drought stress. It clearly shows a trend that in general, cultivars have higher reserves for WSCs at milk-ripe, having a higher capacity of grain yield setting. There were considerable variations in the amount of culm WSCs at milk-ripe when the wheat plants show maximum accumulation of WSCs in the culm. The utmost amount of WSCs in culm was found in BARI Gom 24 and the lowermost in BARI Gom 28 under control while the maximum content was observed in BARI Gom 24 and the minimum in Kanchan under the stress. In general, cultivars having WSCs ≥ 20 mg g−1 culm DW under stress treatment produced higher grain yields with an exception in BARI Gom 26. The cultivars also varied in residual culm WSCs at maturity; BARI Gom 23 stands top and Kanchan in the bottom. Under a stress environment, the remobilization was highly favored resulting in almost no residual WSCs in culm at harvest in almost all cultivars.

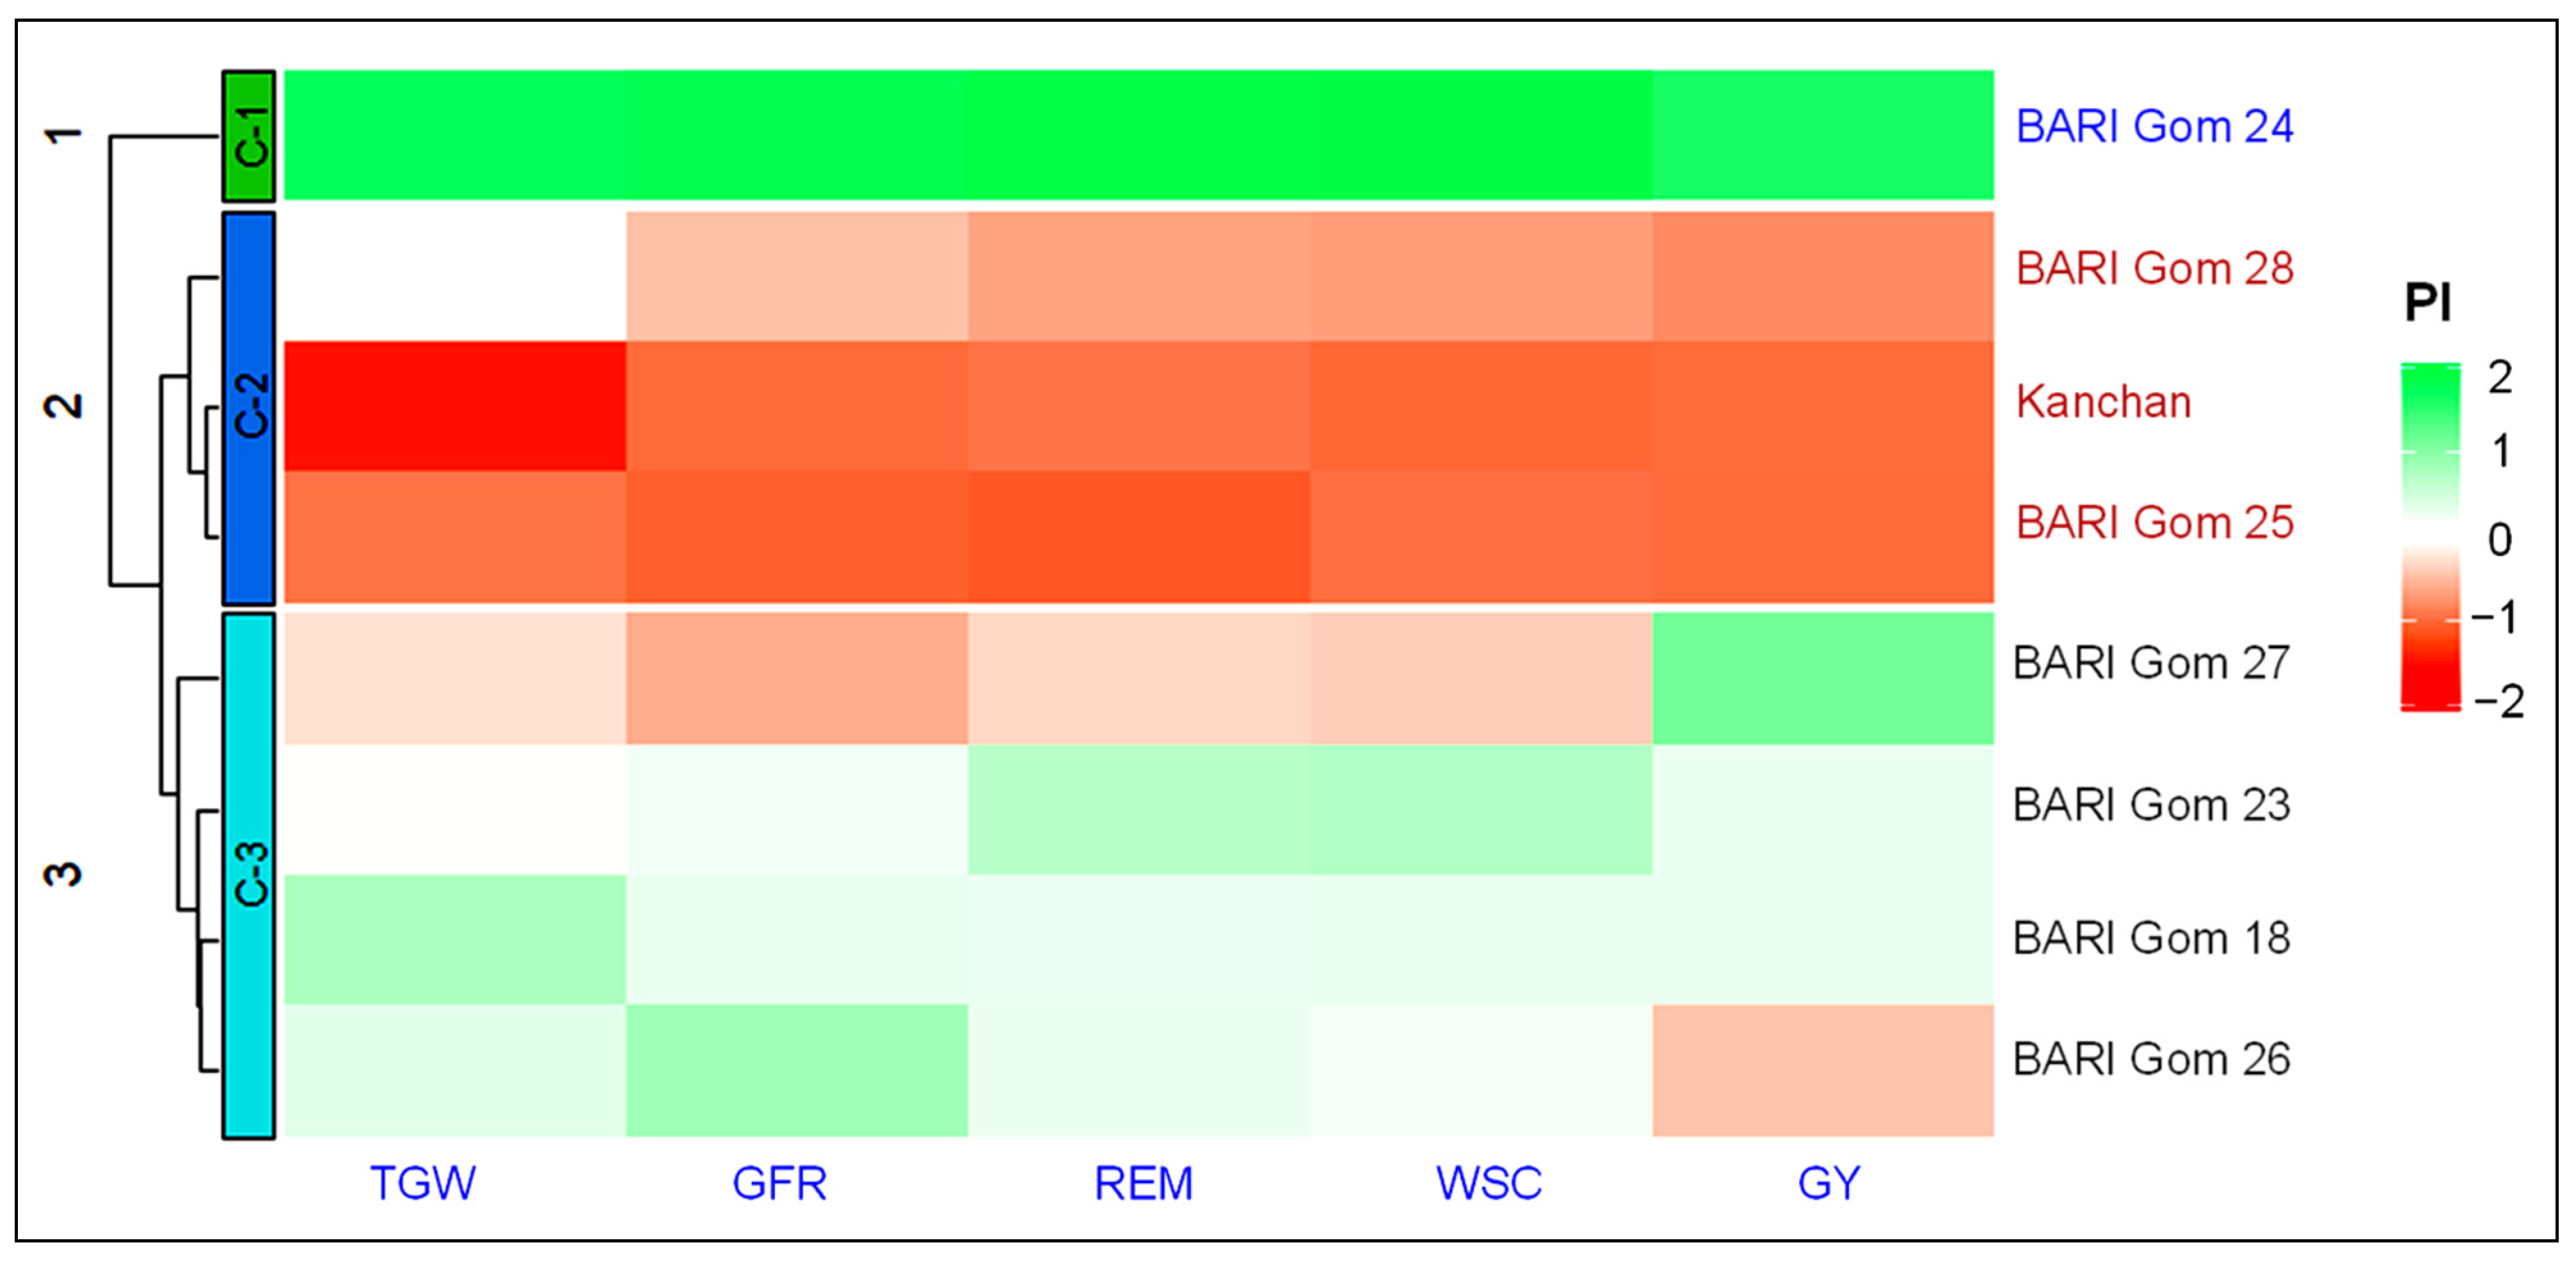
3.6. Clustering of Wheat Cultivars into Different Drought Tolerance Groups

Hierarchical clustering of eight cultivars based on some important stress-tolerance traits viz. grain yield; thousand-grain weight; Water-soluble carbohydrates in culm at milk ripe stage; the amount of remobilized WSCs and grain filling rate is demonstrated in Figure 6. The highly similar cultivars were placed in the row clusters. The BARI Gom 18, BARI Gom 23, BARI Gom 26, and BARI Gom 27 appeared moderately drought-tolerant (MDT) cultivars in cluster number 3 (C-3). In contrast, Kanchan, BARI Gom 25, and BARI Gom 28 formed cluster number-2 (C-2) as drought-sensitive (DS). BARI Gom 24 ranked as a drought-tolerant (C-1; DT) cultivar, which shows the most elevated performance indices for all the five traits considered. Under drought, the cultivar Kanchan showed the lowest GY concomitant with the lowest WSC and TGW. The grain yields under drought stress were 19.0, 14.10, and 9.40 g pot−1 for three different clusters of cultivars, namely, DT, MDT, and DS. Under drought, DT, MDT, and DS clusters showed TGW as 42.24, 35.37, and 32.17 g while GFR as 1.33, 1.05, and 0.96, respectively. Two important grain physiological parameters viz. WSCs and REM also showed variation among the three clusters under drought conditions. While the concentrations of WSCs among the DT, MDT, and DS clusters were 40.58, 25.76, and 15.99 mg g−1 Culm DW, the remobilization of WSCs was 38.00, 24.17, and 13.89 mg g−1 Culm DW, respectively, under the drought stress condition.

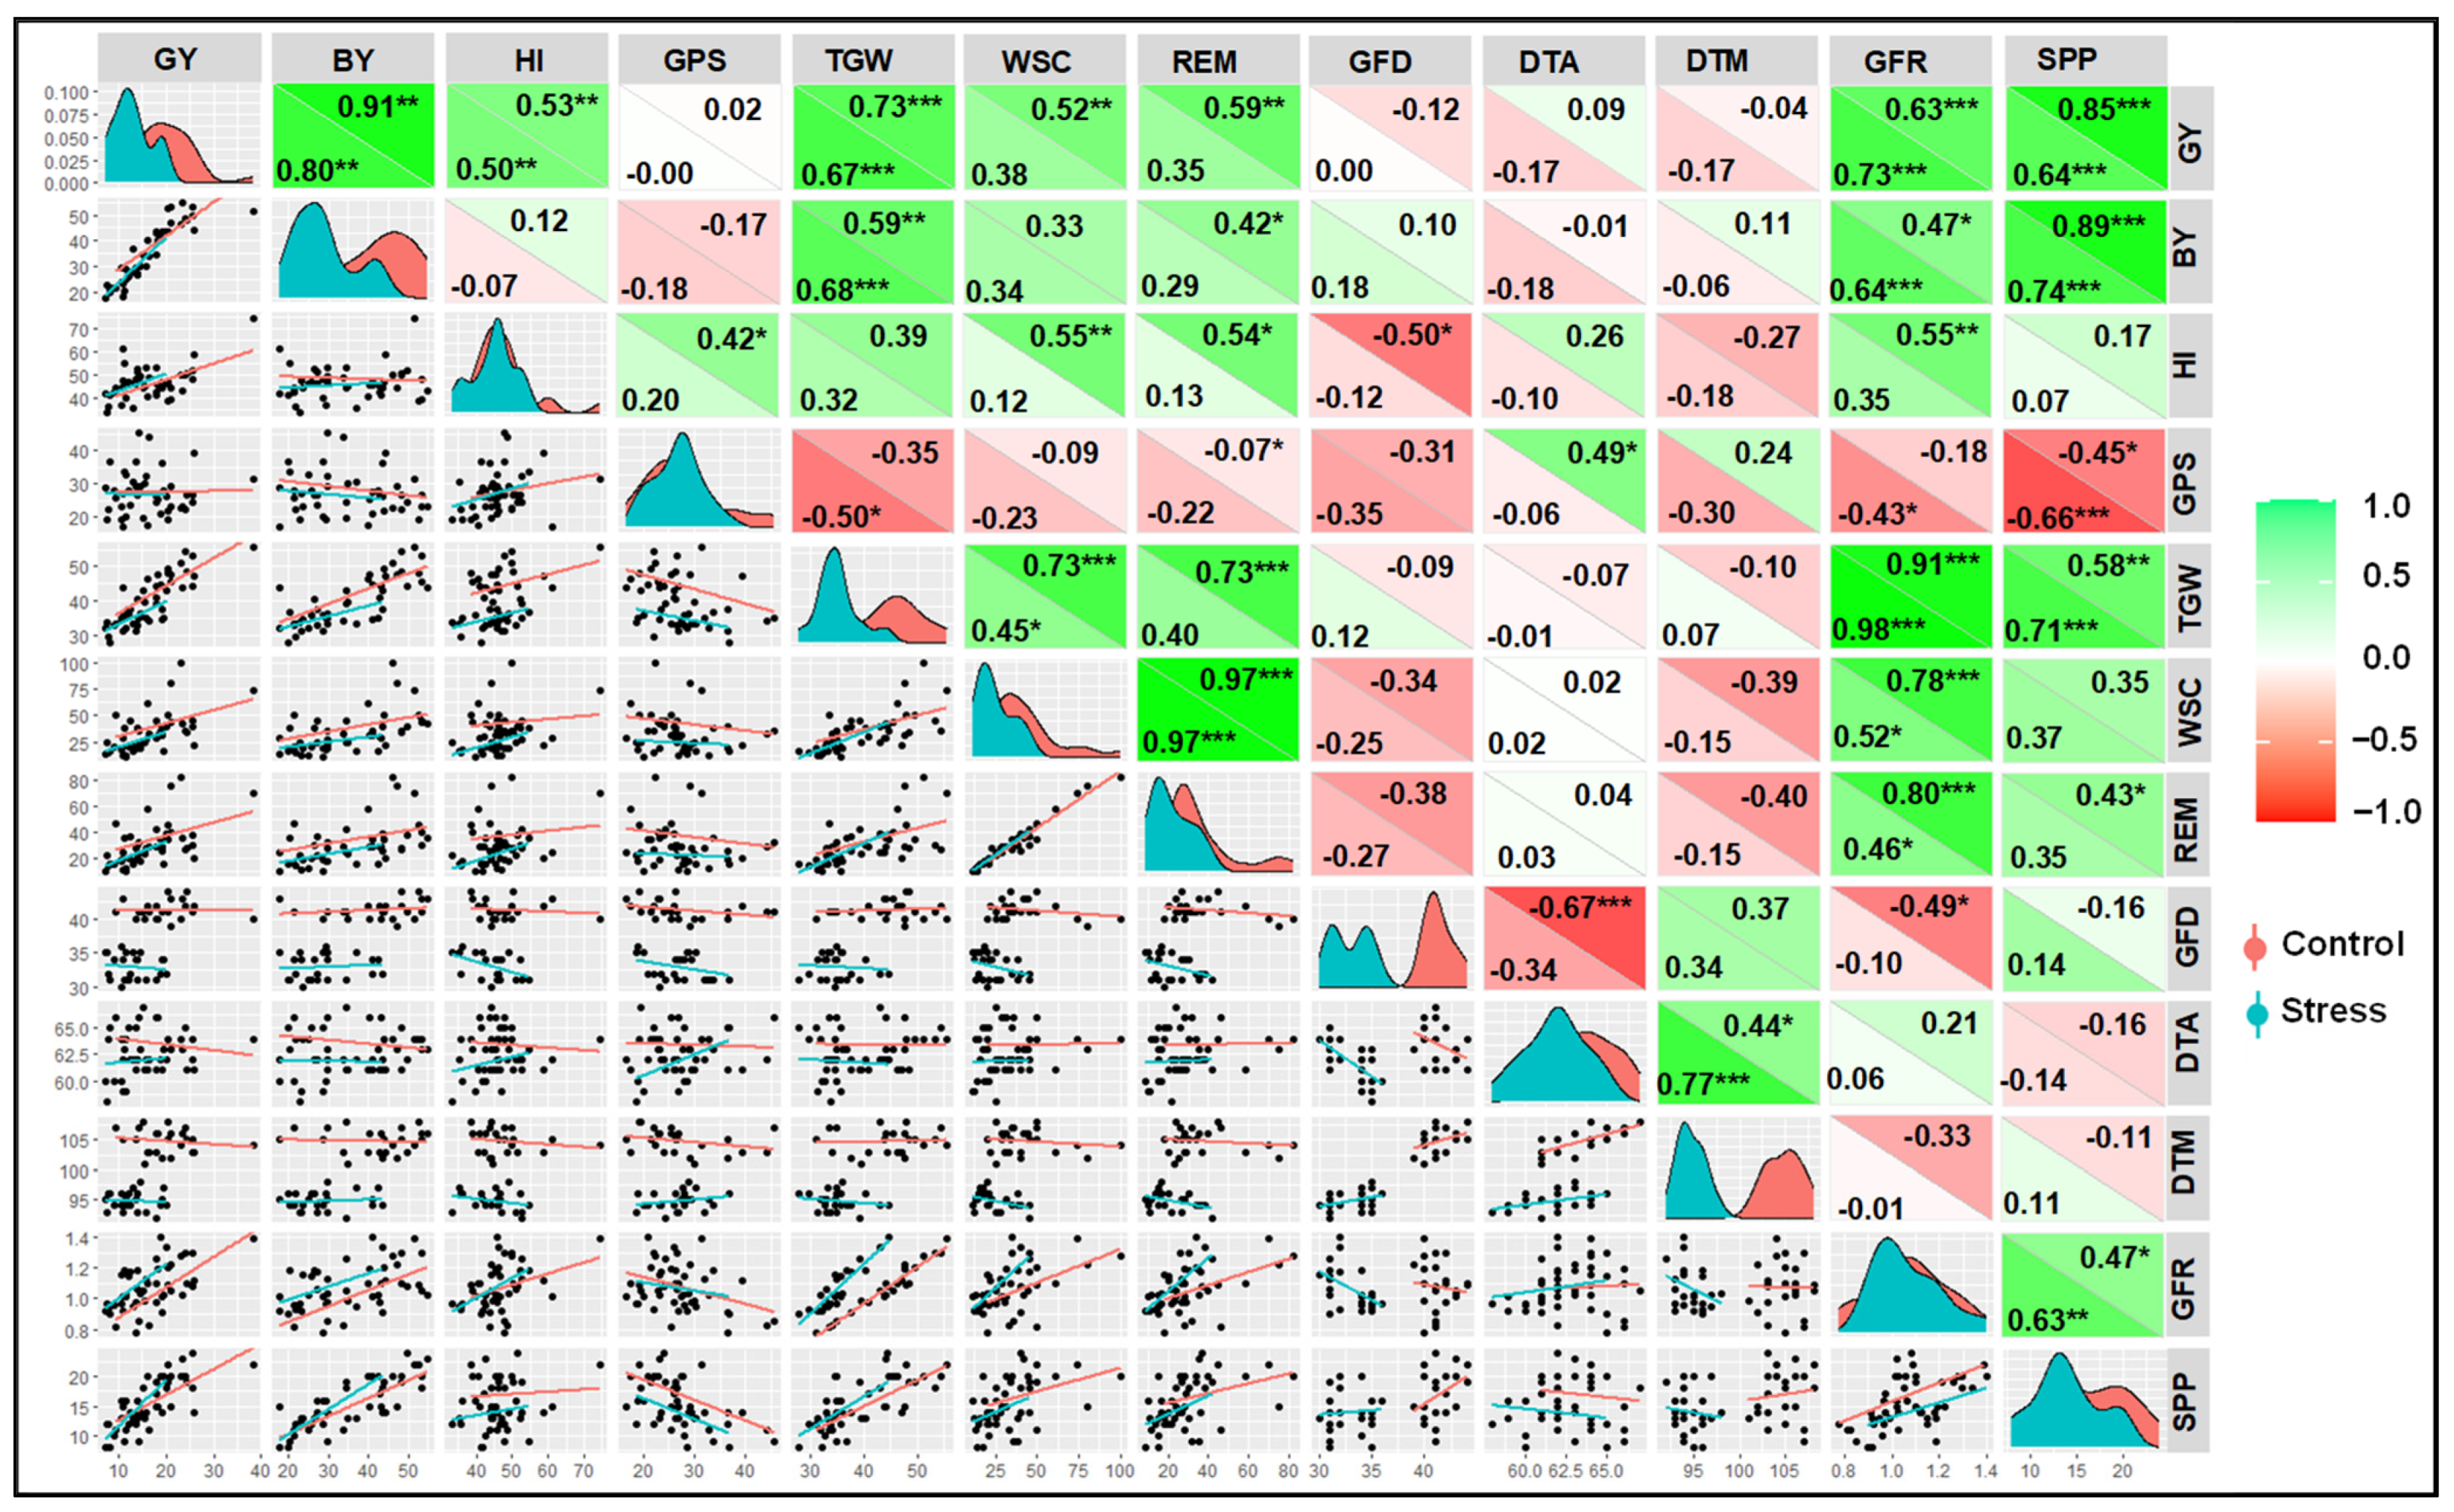
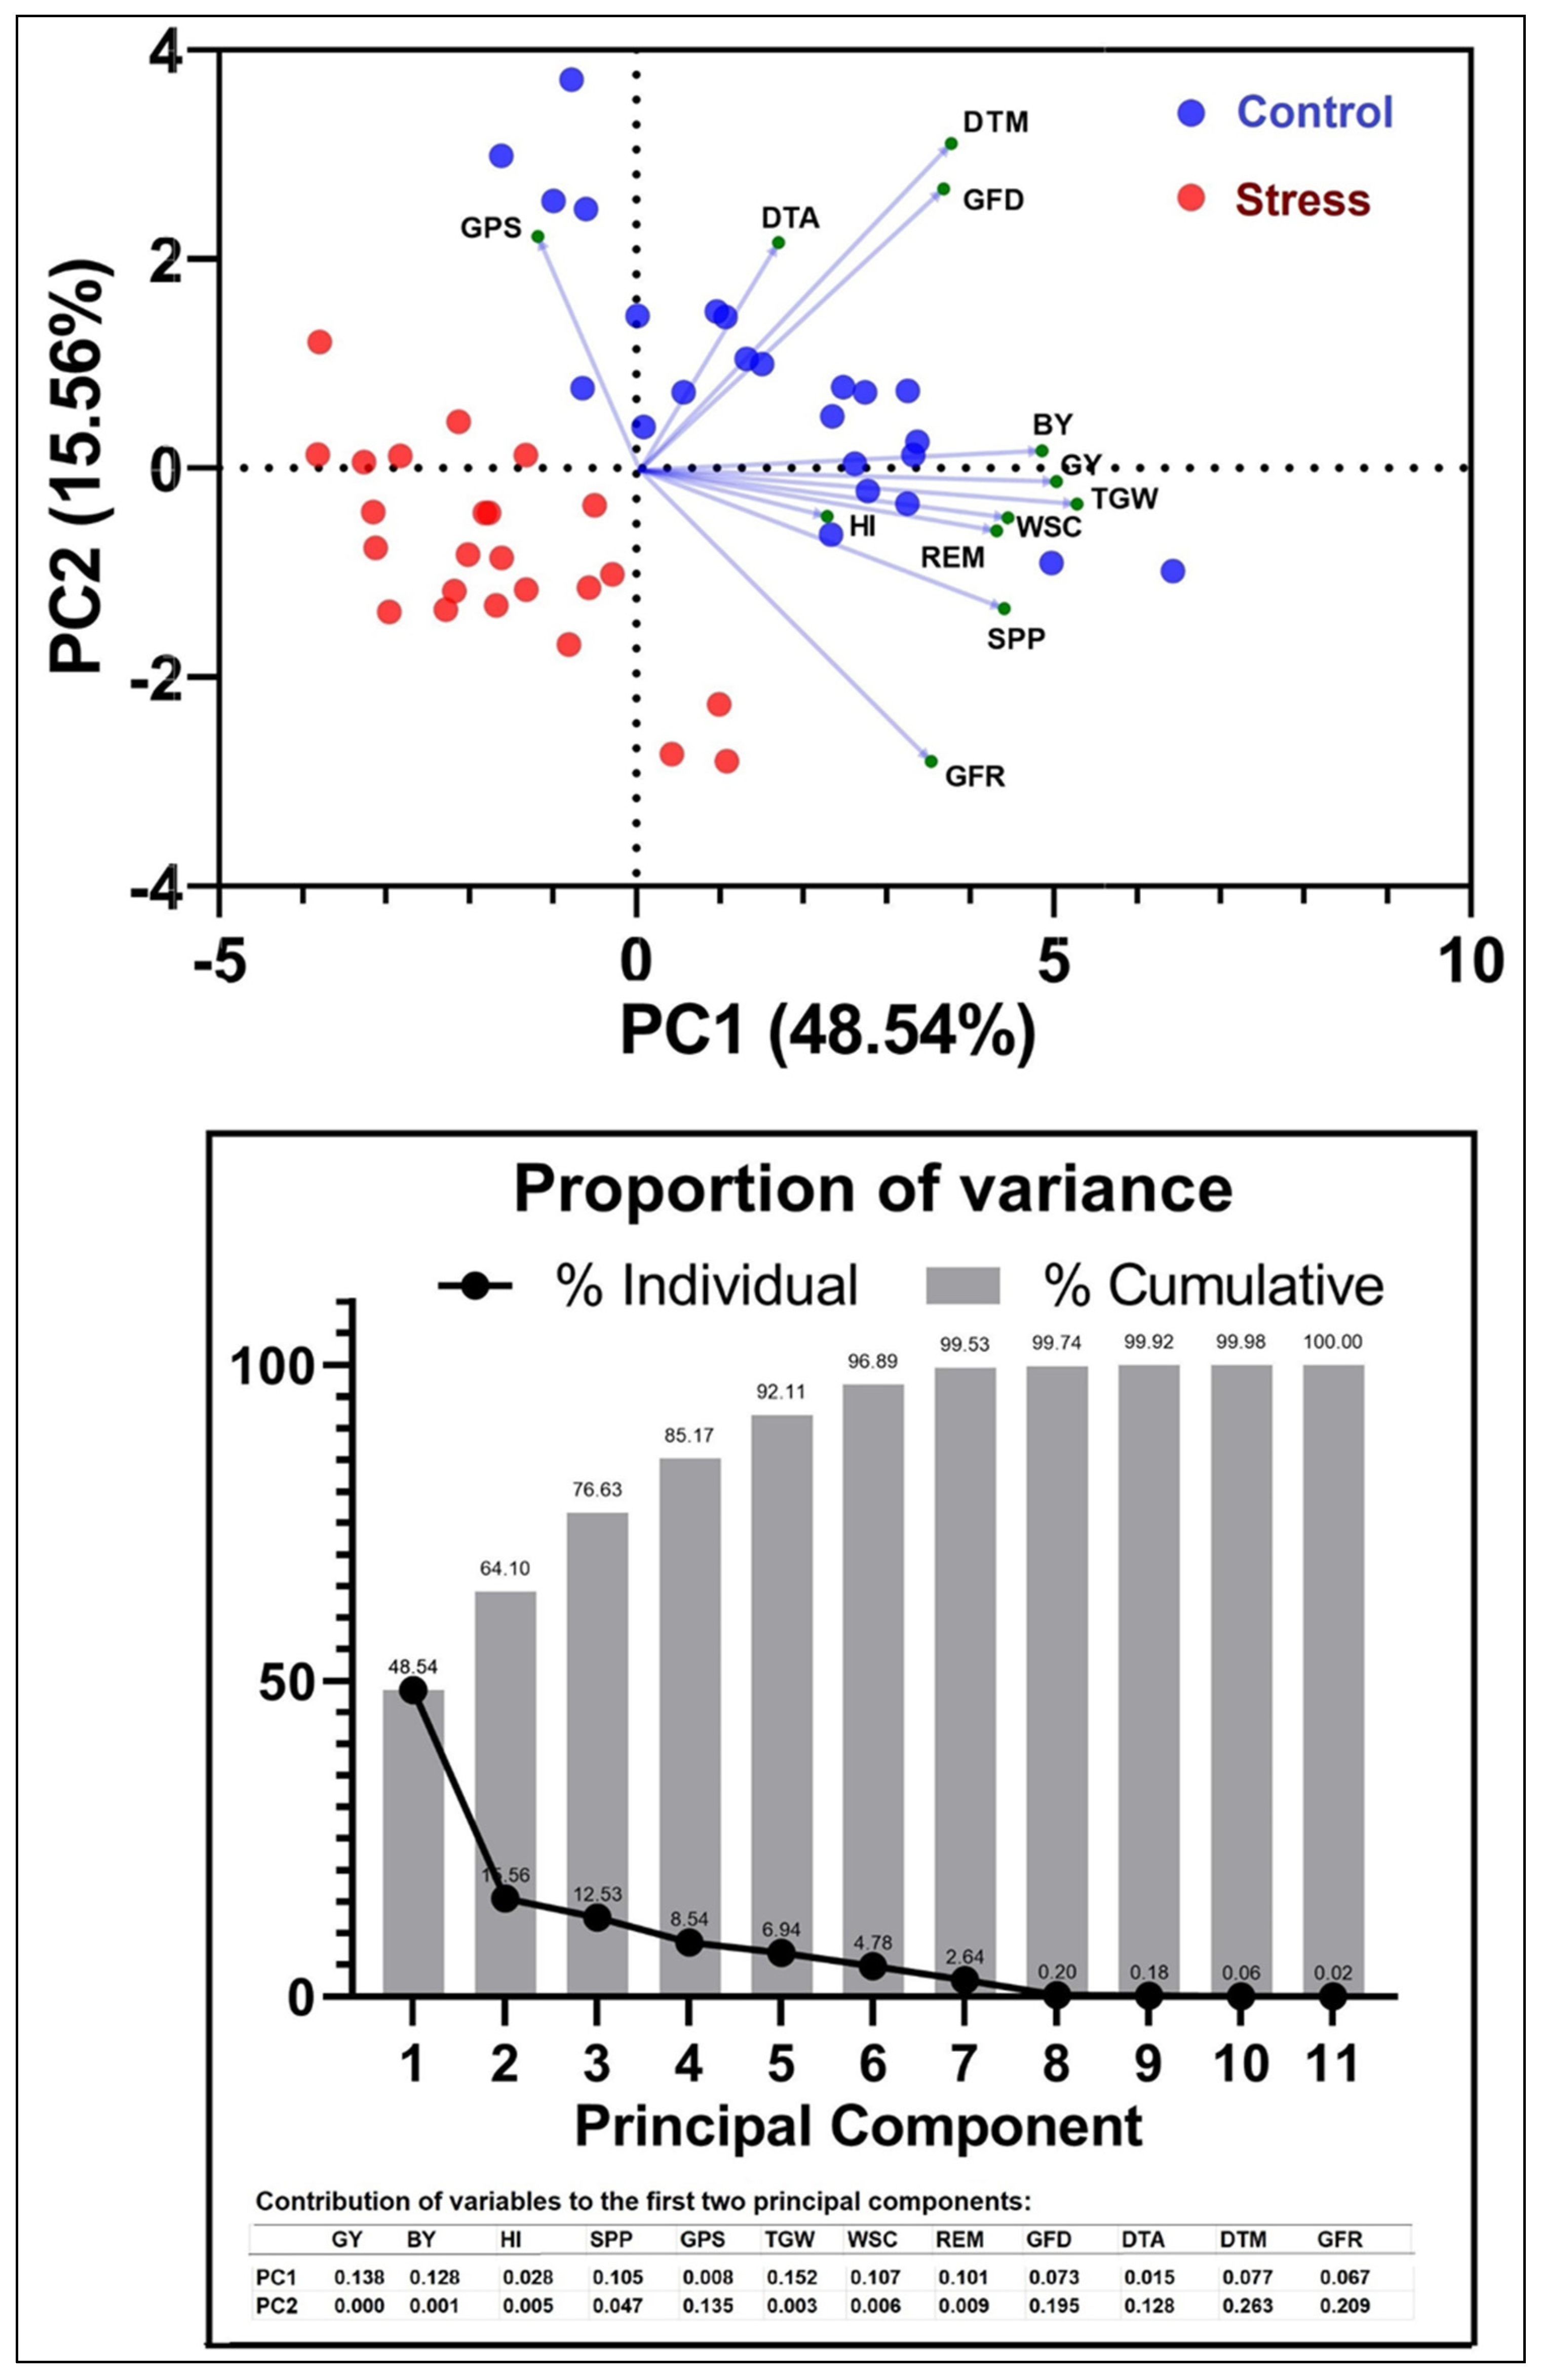
3.7. Correlation and PCA between Yield and Other Parameters

Figure 7 shows correlation amongst grain yield (GY), biological yield (BY), harvest index (HI), grains per spike (GPS), thousand-grain weight (TGW), water-soluble carbohydrate accumulation (WSC), WSCs remobilization (REM), grain filling duration (GFD), days to anthesis (DTA), days to maturity (DTM), grain filling rate (GFR), and spike per pot (SPP) at each of control and drought stress. Both under control and stress conditions, a significant positive correlation was observed between GY and each of BY, HI, GW, GFR, and SPP. Interestingly, WSC and REM maintained significantly positive correlations with GY and TGW only under stress conditions. Likewise, only under stress, HI also maintained a significantly higher positive correlation with each of GPS, GW, WSC, REM, and GFR, and a significantly negative correlation with GFD. GFD and GFR also exhibited strong negative correlations but only under drought stress.
Principal component analysis (PCA), a type of multivariate analysis, was done to extract information on whether genotypic behavior under control and stress can be explained more thoroughly based on constructing mainly a pair of new variables (PC1 and PC2) that combines original variables/traits to a different extent. PCA in the present study extracted information (Figure 8), and a bi-plot between PC1 and PC2 scores shows that PC1 alone explained 48.5% of the total variability while PC2 added a further 15.6% variability. PC1 which principally combines TGW, GY, BY, SPP, WSC, and REM (Figure 7 lower panel) clearly separated genotypic observations into control and stress groups. On the other hand, PC2 which was mainly contributed by DTM, GFR, GFD, GPS and DTA partially separated the control from the stress group. Apparently, two major trait groups are projected in the loading plots (Figure 7 upper panel). In one group the traits BY, GY, TGW, WSC, REM, HI, and SPP are positioned maintaining acute angles among themselves showing their positive correlations. Loading plots highlighted another group of traits composed of DTA, DTM, and GFD that also maintained strong acute angles among themselves and signifies their strong positive correlations. In the first trait group, the longest and shortest projection lines for TGW and HI indicate their highest and lowest contribution to the PC1 score.

4. Discussion

Post-anthesis drought accounts for drastic yield loss in wheat due to enhanced senescence of leaves [5], reduced state of carbon assimilation, lower culm storage of WSC, and poor remobilization of WSCs to the grains [34], smaller sized grains [35] and diminished state of sink strength [36].
Wheat cultivars used in this study showed significant variations in grain yield and yield contributing parameters (Table 1). The drought stress imposed by restricting irrigation during post-anthesis significantly reduced grain yield (Table 1, Figure 2). Among the yield components, TGW and SPP were found to be the most important direct yield components for the variations in grain yield both under control and drought stress in this experiment (Table 1, Figure 7 and Figure 8).
To set grain yield, assimilates are accumulated in grains during the grain filling period [36]. The sources of assimilates for grain filling are current photosynthesis and culm reserves [14,26,27,37]. In this study, high yielding wheat cultivars (such as BARI Gom 18, BARI Gom 23, BARI Gom 24, and BARI Gom 28) exhibited better grain growth from anthesis towards maturity with an augmented rate of grain filling resulting in heavier grains (Table 2) compared to low yielding ones (Figure 3). Enhanced senescence of wheat leaves, particularly the flag leaf, can be realized from the lower grain filling duration (GFD) under the drought stress (Figure 2 and Table 2). Drought accelerated senescence of leaves and, thus, on average, curtailed 20% from GFD compared to the control (Figure 2). In general, GFD became shorter due to stress, which is a significant factor for lighter grains in stressed plants. An acute angle between two loading plots GFD and GY, in PCA analysis in this study, supports this hypothesis, and also GFD appeared as one of the key contributors of PC2 (Figure 8).
The variation in grain filling among the cultivars might be due to the variations in post-anthesis current assimilation and culm WSCs remobilized to grains [6]. A significant positive correlation observed in this study between grain yield and TGW and WSCs accumulation and remobilization, particularly under stressed environment supports this hypothesis (Figure 7). Moreover, when control and stress data are pooled in generating the loading plots of various traits (Figure 8), it is realized that the TGW, WSC, and REM strongly influenced grain yield. It is not surprising to see the substantial contribution of each of these three traits in PC2 (Figure 8 lower panel). Current assimilation can be monitored by the changes in total dry mass [28]. The cultivars producing higher yield (e.g., BARI Gom 24) generally possessed better accumulation of TDM than low yielding cultivars (e.g., Kanchan) (Figure 4). This result indicates that high-yielding cultivars usually contributed more to grain filling through current assimilation compared to the low yielders [26,27,38,39,40]. The stressed plants showed rapid senescence and smaller TDM productions, which indicates that current assimilation contributes less to grain yield under drought stress. When current assimilation becomes limited due to stress, then the culm reserves play an important role in buffer grain yield [12]. The culm accumulates WSCs during the period from anthesis to milk ripe, at around 14 DAA and these WSCs are remobilized to grains from milk ripe to maturity [9]. The cultivars studied in this experiment showed significant variations in accumulation and remobilization of culm WSCs in relation to the grain yield (Figure 5). Usually, high yielders possessed to accumulate more WSCs in culms with a different degree of its remobilization and contribution to grain yield than that of the low yielders. BARI Gom 24 contained a very high and low amount of WSCs at the milk ripe stage and maturity, respectively, indicating the strong contribution of WSCs to ultimate grain weight. On the contrary, Kanchan and BARI Gom 25 both contained a reasonably low amount of WSCs for remobilization, and both yielded poorly for grains under stress conditions (Figure 5).
Culm’s WSCs can contribute around 50% of the culm dry weight, and these WSCs can be a very potential grain-filling source under the stressed environment [41]. The drought stress largely influenced the accumulation and remobilization of culm reserves. In general, due to stress, the accumulation of culm WSCs was considerably reduced, but the remobilization was augmented (Figure 5). Some other reports also highlighted that drought-tolerant genotypes showed higher concentrations of WSCs than the drought-sensitive ones [42,43]. In fact, the ability to store and remobilize higher amounts of WSCs to grains was utilized as a selection criterion for wheat breeding to enhance grain yield [22]. The correlation matrix (Figure 7) reveals that under the stressed environment, the correlation behavior of WSCs and its remobilization (REM) with GY was totally changed to a significantly positive manner as compared to the insignificant relation under control. This realizes the contribution of culm reserves and its mobilization to the wheat grain for final yield setting under drought stress. In this context, it was also not surprising to observe that WSC and REM contributed significantly to the TGW under the stressed environment (Figure 7) and TGW appears as the closest grain yield determinant as realized from the loading plots of PCA analysis (Figure 8 upper panel). In fact, Li et al. [44]) reported significantly higher positive correlations between culm stored WSCs and TGW under drought stress. There were significant and positive correlations for stem WSCs at grain filling with accumulating efficiency of stem WSCs and grain filling efficiency at the late stage [45]. Furthermore, a significantly higher correlation of HI with each of WSC and REM under drought realizes the fact that remobilization under stress is mainly contributed to the grains. In general, high-yielding cultivars, except BARI Gom 24, were more affected by drought than the low yielding cultivars. This may be due to the reduction in current photosynthesis under drought resulting in quick exhaustion of culm reserves to meet the high demand of carbohydrates for grain filling [11,12,14]. As a result, the plant showed quicker senescence by shortening its grain-filling period resulting in lighter grain and low yield. However, high yielding cultivars like BARI Gom 24 withstand drought better due to their high initial culm reserves that were remobilized to grain during drought while current photosynthesis declined. This indicates that high-yielding cultivars have the ability to accumulate more culm WSCs, and like BARI Gom 24 may withstand drought better. On the other hand, low-yielding cultivars are affected less due to drought stress as they have less demand for carbohydrates for grain filling than the high-yielding cultivars. This demand can be met from minimum current photosynthesis along with the remobilization of culm reserves even if it is not too high. Therefore, they did not show rapid senescence-like the high yielding cultivars. Drought stress triggers reactive oxygen species (ROS), causing oxidative injury. However, antioxidants, flavonoids, and secondary metabolites produced in response to stress play a vital role in protecting the plant through detoxification of ROS; and protein and amino acid stabilization [46,47]. Tolerant cultivars in this study might have a better protective mechanism by upregulating the synthesis of antioxidants under drought, which might result in increased grain filling than for sensitive ones.

5. Conclusions

Drought stress shortened the grain-filling period and augmented the remobilization of culm reserves in studied wheat cultivars. As a result, plants showed rapid senescence with lighter grain as well as poor grain yield. High-yielding cultivars of wheat having fewer culm reserves were more affected than the low-yielding ones, due to the greater demand of carbohydrates for grain filling. BARI Gom 24 appeared more promising in withstanding drought than the other cultivars due to its high culm reserves. However, further research is necessary with different locations under field trials to confirm the tolerance of these cultivars to drought stress with respect to culm reserve dynamics, as plants show variable responses at different edaphoclimatic conditions.

Author Contributions

Conceptualization: M.A.H. and M.S.A.F.; methodology: R.K.D., M.A.I. M.A.K. and M.A.H.; formal analysis: M.A.H., M.N.U. and M.S.H.; data curation: M.A.H., M.N.U. and M.S.H.; statistical expertise: M.N.U. and M.S.H.; writing—original draft preparation: M.A.I. R.K.D. and M.A.H.; writing—review and editing: M.A.H., M.N.U., M.S.H., M.S.A.F., M.A.K., E.S.D., A.O.A., E.I.E.-H. and A.H.; visualization: M.A.H., M.N.U., M.S.H.; supervision: M.A.H. and M.S.A.F.; project administration: M.A.H. and M.A.I.; funding acquisition: M.A.H., A.H., E.S.D., A.O.A. and E.I.E.-H. All authors have read and agreed to the published version of the manuscript.

Funding

This research was funded by the University Grants Commission (UGC) (Project no. 2014/25/UGC) of Bangladesh and the Taif University Researchers Supporting Project number (TURSP-2020/85), Taif University, Taif, Saudi Arabia.

Institutional Review Board Statement

Not applicable.

Informed Consent Statement

Not applicable.

Data Availability Statement

The data that support the findings of this study are available from the corresponding authors upon reasonable request.

Acknowledgments

We gratefully acknowledge the concerned personnel of Regional Wheat Research Centre, Bangladesh Agricultural Research Institute (BARI), Gazipur, Bangladesh to provide wheat seeds for this study. The authors also extend their appreciation to the Taif University Researchers Supporting Project number (TURSP-2020/85), Taif University, Taif, Saudi Arabia for funding the research.

Conflicts of Interest

The authors declare no conflict of interest.

Abbreviations

BARIBangladesh Agricultural Research Institute
BYBiomass yield
CRDCompletely randomized design
DAADays after anthesis
DTADays to anthesis
DTMDays to maturity
DWDry weight
GFDGrain filling duration
GFRGrain filling rate
GPSGrain per spike
GYGrain yield
HIHarvest index
IQRInterquartile range
PCAPrincipal component analysis
PCPrincipal component
Q1First quartile (25th Percentile)
Q3Third quartile (75th Percentile)
SPPSpike per pot
TDMTotal dry mass
TGWThousand grain weight
WSCsWater-soluble carbohydrates

References

  1. Singh, N.P.; Pal, P.K.; Vaishali, S.K. Morpho-physiological characterization of Indian wheat genotypes and their evaluation under drought condition. Afr. J. Biotechnol. 2014, 13, 20. [Google Scholar]
  2. Bhusal, N.; Lee, M.; Han, A.R.; Kim, H.S. Responses to drought stress in Prunus sargentii and Larix kaempferi seedlings using morphological and physiological parameters. For. Ecol. Manag. 2020, 465, 118099. [Google Scholar] [CrossRef]
  3. Olivares-Villegas, J.J.; Reynolds, M.P.; McDonald, G.K. Drought-adaptive attributes in the Seri/Babax hexaploid wheat population. Funct. Plant Biol. 2007, 34, 189–203. [Google Scholar] [CrossRef] [PubMed]
  4. Mohi-Ud-Din, M.; Hossain, M.A.; Rohman, M.M.; Uddin, M.N.; Haque, M.S.; Ahmed, J.U.; Hossain, A.; Hassan, M.M.; Mostofa, M.G. Multivariate Analysis of Morpho-Physiological Traits Reveals Differential Drought Tolerance Potential of Bread Wheat Genotypes at the Seedling Stage. Plants 2021, 10, 879. [Google Scholar] [CrossRef] [PubMed]
  5. Ji, X.; Shiran, B.; Wan, J.; Lewis, D.C.; Jenkins, C.L.D.; Condon, A.; Richards, R.A.; Dolferus, R. Importance of pre-anthesis anther sink strength for maintenance of grain number during reproductive stage water stress in wheat. Plant Cell Environ. 2010, 33, 926–942. [Google Scholar] [CrossRef]
  6. Wang, X.; Cai, J.; Liu, F.; Dai, T.; Cao, W.; Wollenweber, B.; Jiang, D. Multiple heat priming enhances thermo-tolerance to a later high temperature stress via improving subcellular antioxidant activities in wheat seedlings. Plant Physiol. Biochem. 2014, 74, 185–192. [Google Scholar] [CrossRef]
  7. Abid, M.; Ali, S.; Qi, L.K.; Zahoor, R.; Tian, Z.; Jiang, D.; Snider, J.L.; Dai, T. Physiological and biochemical changes during drought and recovery periods at tillering and jointing stages in wheat (Triticum aestivum L.). Sci. Rep. 2018, 8, 1–15. [Google Scholar] [CrossRef]
  8. Singh, B.; Jenner, C. Factors Controlling Endosperm Cell Number and Grain Dry Weight in Wheat: Effects of Shading on Intact Plants and of Variation in Nutritional Supply to Detached, Cultured Ears. Funct. Plant Biol. 1984, 11, 151–163. [Google Scholar] [CrossRef]
  9. Takahashi, T.; Tsuchihashi, N.; Nakaseko, K. Grain Filling Mechanisms in Spring Wheat. I. Grain filling phases according to the development of plant organs. Jpn. J. Crop. Sci. 1993, 62, 560–564. [Google Scholar] [CrossRef] [Green Version]
  10. Ehdaie, B.; Alloush, G.A.; Madore, M.A.; Waines, J.G. Genotypic Variation for Stem Reserves and Mobilization in Wheat: I. Postanthesis Changes in Internode Dry Matter. Crop. Sci. 2006, 46, 735–746. [Google Scholar] [CrossRef]
  11. Ovenden, B.; Milgate, A.; Lisle, C.; Wade, L.; Rebetzke, G.; Holland, J.B. Selection for water-soluble carbohydrate accumulation and investigation of genetic × environment interactions in an elite wheat breeding population. Theor. Appl. Genet. 2017, 130, 2445–2461. [Google Scholar] [CrossRef] [PubMed]
  12. Tahir, I.S.A.; Nakata, N. Remobilization of Nitrogen and Carbohydrate from Stems of Bread Wheat in Response to Heat Stress during Grain Filling. J. Agron. Crop. Sci. 2005, 191, 106–115. [Google Scholar] [CrossRef]
  13. Ehdaie, B.; Alloush, G.; Waines, J. Genotypic variation in linear rate of grain growth and contribution of stem reserves to grain yield in wheat. Field Crop. Res. 2008, 106, 34–43. [Google Scholar] [CrossRef]
  14. Hossain, M.A.; Araki, H.; Takahashi, T. Poor grain filling induced by water logging is similar to that in abnormal early ripening in wheat grown in Western Japan. Field Crops Res. 2011, 123, 100–108. [Google Scholar] [CrossRef]
  15. Wardlaw, I.F.; Willenbrink, J. Mobilization of fructan reserves and changes in enzyme activities in wheat stems correlate with water stress during kernel filling. New Phytol. 2000, 148, 413–422. [Google Scholar] [CrossRef]
  16. Rawson, H.; Evans, L. The contribution of stem reserves to grain development in a range of wheat cultivars of different height. Aust. J. Agric. Res. 1971, 22, 851–863. [Google Scholar] [CrossRef]
  17. Gent, M.P.N. Photosynthate Reserves during Grain Filling in Winter Wheat. Agron. J. 1994, 86, 159–167. [Google Scholar] [CrossRef]
  18. Jiang, D.; Fan, X.; Dai, T.; Cao, W. Nitrogen fertiliser rate and post-anthesis waterlogging effects on carbohydrate and nitrogen dynamics in wheat. Plant Soil 2008, 304, 301–314. [Google Scholar] [CrossRef]
  19. Hossain, A.; Takahashi, T.; Jinno, H.; Senju, K.; Kawata, Y.; Zhan, L.; Araki, H. Grain Filling Mechanisms in Two Wheat Cultivars, Haruyutaka and Daichinominori, grown in Western Japan and in Hokkaido. Plant Prod. Sci. 2010, 13, 156–163. [Google Scholar] [CrossRef]
  20. Hossain, M.A.; Takahashi, T.; Araki, H. Mechanisms and Causes of Poor Grain Filling in Wheat; Lambert Academic Publishing: Saarbrücken, Germany, 2012; p. 90. [Google Scholar]
  21. Araki, H.; Hamada, A.; Hossain, A.; Takahashi, T. Waterlogging at jointing and/or after anthesis in wheat induces early leaf senescence and impairs grain filling. Field Crop. Res. 2012, 137, 27–36. [Google Scholar] [CrossRef]
  22. Ruuska, S.A.; Rebetzke, G.J.; van Herwaarden, A.F.; Richards, R.A.; Fettell, N.A.; Tabe, L.; Jenkins, C.L.D. Genotypic varia-tion in water-soluble carbohydrate accumulation in wheat. Funct. Plant Biol. 2006, 33, 799–809. [Google Scholar] [CrossRef]
  23. Liu, Y.; Zhang, P.; Li, M.; Chang, L.; Cheng, H.; Chai, S.; Yang, D. Dynamic responses of accumulation and remobilization of water soluble carbohydrates in wheat stem to drought stress. Plant Physiol. Biochem. 2020, 155, 262–270. [Google Scholar] [CrossRef] [PubMed]
  24. Volaire, F.; Lelievre, F. Production, persistence, and water-soluble carbohydrate accumulation in 21 contrasting populations of Dactylis glomerata L. subjected to severe drought in the south of France. Aust. J. Agric. Res. 1997, 48, 933. [Google Scholar] [CrossRef]
  25. Foulkes, J.; Sylvester-Bradley, R.; Weightman, R.; Snape, J. Identifying physiological traits associated with improved drought resistance in winter wheat. Field Crop. Res. 2007, 103, 11–24. [Google Scholar] [CrossRef]
  26. Rana, M.R.; Karim, M.M.; Hassan, M.J.; Hossain, M.A.; Haque, M.A. Grain filling patterns of barley as affected by high temperature stress. J. Bangladesh Agric. Univ. 2017, 15, 174–181. [Google Scholar] [CrossRef] [Green Version]
  27. Karim, M.M.; Islam, M.A.; Rana, M.R.; Hossain, M.A.; Kader, M.A. Screening of barley genotypes for drought tolerance based on culm reserves contribution to grain yield. J. Bangladesh Agric. Univ. 2018, 16, 62–66. [Google Scholar] [CrossRef] [Green Version]
  28. Shekhar, I.; Paul, S. Rice and Wheat Crop Productivity in the Indo-Gangetic Plains of India: Changing Pattern of Growth and Future Strategies. Ind. J. Agric. Econ. 2012, 67, 238–252. [Google Scholar]
  29. Rokonujjman, M.; Kader, M.A.; Begum, S.A.; Sarker, A. Evaluating manurial value of bio-slurry for tomato cultivation in sub-tropical floodplain soil. J. South Pacific Agric. 2019, 22, 23–29. [Google Scholar]
  30. BMD (Bangladesh Meteorological Department). 2020. Available online: http://www.bmd.gov.bd/Document/climateofbangladesh.doc (accessed on 27 August 2020).
  31. Zadoks, J.C.; Chang, T.T.; Konzak, C.F. A decimal code for the growth stages of cereals. Weed Res. 1974, 14, 415–421. [Google Scholar] [CrossRef]
  32. Dias, A.S.; Lidon, F.C. Evaluation of grain filling rate and duration in bread and durum wheat under heat stress after anthesis. J. Agron. Crop Sci. 2009, 195, 137–147. [Google Scholar] [CrossRef]
  33. Yemm, E.W.; Willis, A.J. The estimation of carbohydrates in plant extracts by anthrone. Biochem. J. 1954, 57, 508–514. [Google Scholar] [CrossRef] [Green Version]
  34. Asada, K. Production and scavenging of reactive oxygen species in chloro- plasts and their functions. Plant Physiol. 2006, 141, 391–396. [Google Scholar] [CrossRef] [Green Version]
  35. Altenbach, S.B. New insights into the effects of high temperature, drought and post-anthesis fertilizer on wheat grain development. J. Cereal Sci. 2012, 56, 39–50. [Google Scholar] [CrossRef]
  36. Yang, W.; Peng, S.; Dionisio-Sese, M.L.; Laza, R.C.; Visperas, R.M. Grain filling duration, a crucial determinant of genotypic variation of grain yield in field-grown tropical irrigated rice. Field Crop. Res. 2008, 105, 221–227. [Google Scholar] [CrossRef]
  37. Austin, R.B.; Morgan, C.L.; Ford, M.A.; Blackwell, R.D. Contributions to grain yield from pre-anthesis assimilation in tall and dwarf barley genotypes in two contrasting seasons. Ann. Bot. 1980, 45, 309–316. [Google Scholar] [CrossRef]
  38. Hossain, A.; Takahashi, T.; Zhang, L.; Nakatsukasa, M.; Kimura, K.; Kurashige, H.; Hirata, T.; Ariyoshi, M. Physiological Mechanisms of Poor Grain Growth in Abnormally Early Ripening Wheat Grown in West Japan. Plant Prod. Sci. 2009, 12, 278–284. [Google Scholar] [CrossRef]
  39. Islam, M.A.; Hossain, M.A.; Atikuzzamman, M.; Islam, M.S.; Razzak, M.A.; Sathi, M.A. Assessment of wheat genotypes based on culm reserves contribution to grain yield. Int. J. Adv. Res. Technol. 2018, 7, 1–6. [Google Scholar]
  40. Islam, M.A.; Fakir, M.S.A.; Hossain, M.A.; Sathi, M.A. Genotypic variation of wheat (Triticum aestivum L.) in grain filling and contribution of culm reserves to yield. Bangladesh J. Bot. 2021, 50, 51–59. [Google Scholar] [CrossRef]
  41. Zhang, J.; Chen, W.; Dell, B.; Vergauwen, R.; Zhang, X.; Mayer, J.E.; Ende, W.V.D. Wheat genotypic variation in dynamic fluxes of WSC components in different stem segments under drought during grain filling. Front. Plant Sci. 2015, 6, 624. [Google Scholar] [CrossRef] [Green Version]
  42. Goggin, D.E.; Setter, T.L. Fructosyltransferase activity and fructan accumulation during development in wheat exposed to terminal drought. Funct Plant Biol. 2004, 31, 11–21. [Google Scholar] [CrossRef] [PubMed]
  43. Yang, D.-L.; Jing, R.-L.; Chang, X.-P.; Li, W. Identification of Quantitative Trait loci and Environmental Interactions for Accumulation and Remobilization of Water-Soluble Carbohydrates in Wheat (Triticum aestivum L.) Stems. Genetics 2007, 176, 571–584. [Google Scholar] [CrossRef] [Green Version]
  44. Li, W.; Zhang, B.; Li, R.; Chang, X.; Jing, R. Favorable Alleles for Stem Water-Soluble Carbohydrates Identified by Association Analysis Contribute to Grain Weight under Drought Stress Conditions in Wheat. PLoS ONE 2015, 10, e0119438. [Google Scholar] [CrossRef] [PubMed]
  45. Nadia, K.; Chang, X.; Jing, R. Genetic Dissection of Stem Water-Soluble Carbohydrates and Agronomic Traits in Wheat under Different Water Regimes. J. Agric. Sci. 2017, 9, 42. [Google Scholar] [CrossRef] [Green Version]
  46. Khaleghi, A.; Naderi, R.; Brunetti, C.; Maserti, B.; Salami, S.A.; Babalar, M. Morphological, physiochemical and antioxidant responses of Maclura pomifera to drought stress. Sci. Rep. 2019, 9, 1–12. [Google Scholar] [CrossRef] [PubMed]
  47. Bhusal, N.; Lee, M.; Lee, H.; Adhikari, A.; Han, A.R.; Kim, H.S. Evaluation of morphological, physiological, and biochemical traits for assessing drought resistance in eleven tree species. Sci. Total. Environ. 2021, 779, 146466. [Google Scholar] [CrossRef] [PubMed]
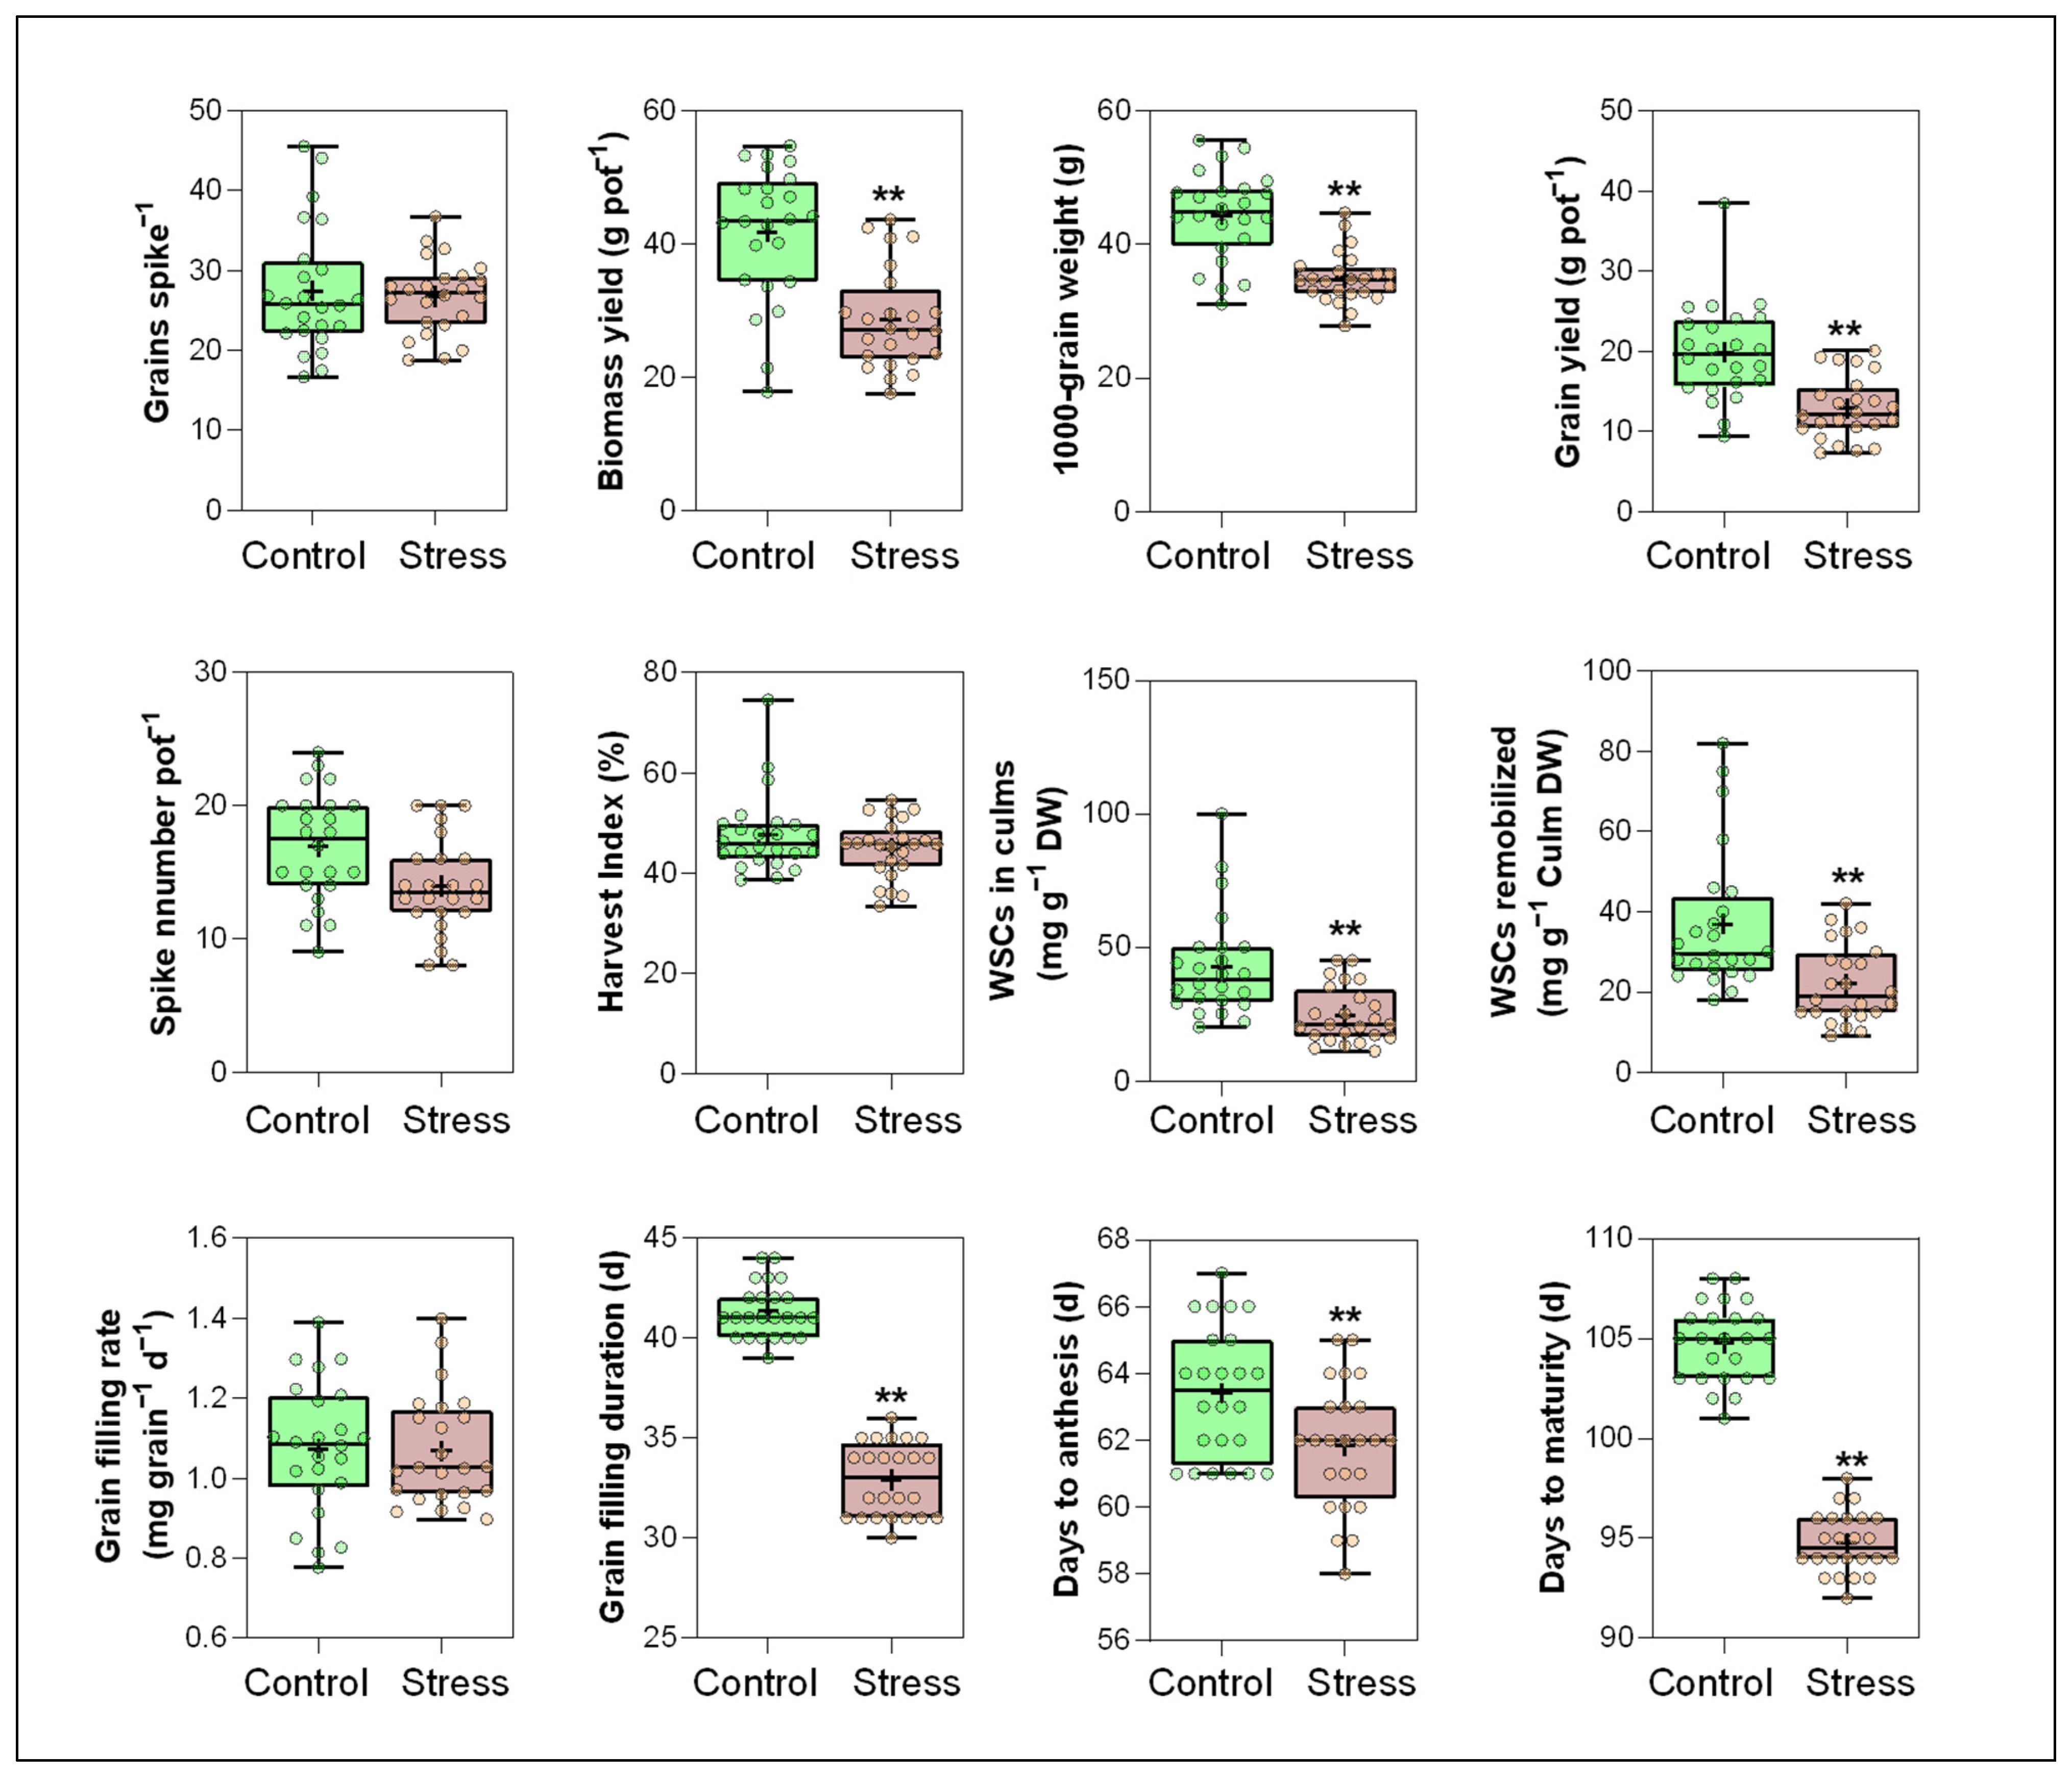
Figure 1. Soil-water tension (mv) of pot soils in control and drought treatments. Arrow indicates the sudden spell of light rain which contributed to the rise in soil water tension both in control and drought.
Agronomy 11 01252 g001
Figure 2. Box plots showing the descriptive statistics of different traits in pot-grown eight wheat cultivars under control and drought stress conditions during the grain-filling period. The horizontal line and + sign within the box represents the median and mean, respectively. The lower and upper limit of the box, lower and upper whisker represents Q1 (first quartile), Q3 (third quartile), (Q1 − 1.5IQR) and (Q3 + 1.5IQR), respectively. IQR—interquartile range. Open circle dots on the boxes indicate the distribution of observations. ** indicates significant variations between control and stress at 1% level of significances.
Agronomy 11 01252 g002
Figure 3. Changes in grain dry weight (g) of eight wheat cultivars as affected by drought stress during the grain-filling period. Vertical bars represent standard errors of means (n = 3).
Agronomy 11 01252 g003
Figure 4. Changes in total dry mass (g tiller−1) of eight wheat cultivars as affected by drought stress during the grain-filling period. Vertical bars represent standard errors of means (n = 3).
Agronomy 11 01252 g004
Figure 5. Water-soluble carbohydrates in culm of eight wheat cultivars at milk ripe stage and at maturity (bar chart) as affected by post-anthesis drought stress. Vertical bars represent standard errors of means (n = 3). The values in mg with percent values in parenthesis along the bars indicate the contents of water-soluble carbohydrate per g culm dry weight at milk ripe with the percent of its remobilization to grain, respectively. Grain yields were overlaid to the histogram to realize the contribution of culm reserves on grain yield setting both at control and drought stress. Values adjacent to data point indicate the grain yields as g pot−1.
Agronomy 11 01252 g005
Figure 6. Hierarchical clustering heatmap based on the performances of eight wheat cultivars in important five traits under drought stress. The mean values of studied traits under drought conditions in all cultivars were normalized as a performance index (PI) and clustered. Three distinct clusters were obtained—tolerant (C-1), moderately tolerant (C-3), and sensitive (C-2) wheat cultivars based on the PI values. Different color scale expresses the intensity of the PI values of five important traits viz., GY, TGW, WSC, REM and GFR.
Agronomy 11 01252 g006
Figure 7. Scatterplot, correlation matrix and distribution data of the studied traits in eight pot-grown wheat cultivars both under control and post-anthesis drought stress. The upper-right panel shows a correlation matrix of different traits; each small rectangle is diagonally divided into lower-left and upper-right triangles that carry correlation information for a paired trait under control and drought stress, respectively. The diagonal panel indicates the normal distribution curve of correlated traits under control and drought stress. The lower-left panel indicates scatterplots and trend lines of the correlated traits under control and stress. *, ** and *** indicate significant at p < 0.05, p < 0.01 and p < 0.001. (GY—grain yield (g pot−1); BY—biomass yield (cm pot−1); HI—harvest index (%); GPS—grain per spike (no); TGW—thousand-grain weight (g); WSC—Water-soluble carbohydrates in culm at milk ripe stage (mg g−1 DW); REM—Amount of remobilized WSCs (mg mg−1 Culm DW); GFD—grain filling duration (d); DTA—days to anthesis (d); DTM—days to maturity (d); GFR—grain filling rate (mg grain−1 d−1); SPP—spike per pot).
Agronomy 11 01252 g007
Figure 8. Principle Component Analysis (PCA) Biplot (top) of different traits (arrows) and wheat cultivars (points). Cultivars are dispersed in different ordinates based on the dissimilarity among them. The magnitude of the vectors (lines) shows the strength of their contribution to each PC. The angles between the vectors derived from the middle point of biplots exhibit positive or negative interactions of studied traits. The close variables (vectors) forming small angles represent a highly positive correlation among them. The PCA scree plot (bottom) shows the proportion of variance of different principal components. (GY—grain yield (g pot−1); BY—biomass yield (cm seedling−1); HI—harvest index (%); GPS—grain per spike (no); TGW—thousand-grain weight (g); WSC—Water-soluble carbohydrates in culm at milk ripe stage (mg g−1 DW); REM—Amount of remobilized WSCs (mg mg−1 Culm DW); GFD—grain filling duration (d); DTA—days to anthesis (d); DTM—days to maturity (d); GFR—grain filling rate (mg grain−1 d−1); SPP—spike per pot).
Agronomy 11 01252 g008
Table 1. Grain yield, biomass yield, harvest index, and yield attributes in eight wheat cultivars as affected by drought stress during grain filling period.
CultivarsDrought StressGrain Yield
(g pot−1)
Biomass Yield
(g pot−1)
Harvest Index
(%)
Spikes Pot −1Grains
Spike−1
1000-Grain
Weight (g)
KanchanControl12.4626.70 d–f46.43 ab10.6735.9533.12 f
Stressed9.1622.23 f41.00 ab10.3330.5229.76 f
BARI Gom 18Control21.5253.53 a40.17 ab21.6721.7945.78 a–c
Stressed14.0228.69 c–f48.96 ab13.6728.2536.48 ef
BARI Gom 23Control23.3348.53 ab48.02 ab19.0023.4752.40 a
Stressed14.0528.05 c–f49.99 ab14.6727.4535.16 ef
BARI Gom 24Control27.4648.34 ab56.20 a19.0027.7251.48 ab
Stressed1939.73 a–e48.10 ab19.0023.7942.24 c–e
BARI Gom 25Control17.0237.29 a–f45.81 ab12.6736.8936.98 d–f
Stressed9.1520.83 f43.72 ab10.3327.8931.99 f
BARI Gom 26Control17.0739.31 a–e43.53 ab16.0023.9844.98 bc
Stressed11.223.27 e–f48.46 ab11.3328.3335.67 ef
BARI Gom 27Control19.9644.21 a–c44.70 ab20.3322.5243.82 cd
Stressed17.1440.11 a–d42.45 ab17.6728.5434.17 f
BARI Gom 28Control20.3636.81 b–f56.63 a16.0027.4446.42 a-c
Stressed9.8826.94 d–f36.44 b14.6719.2834.75 f
SignificanceCultivar (C)6.22 **10.13 **1.68 NS0.46 NS2.72 *24.78 **
(F value)Stress (S)39.25 **69.62 **3.01 NS0.43 NS0.21 NS181.4 **
C × S0.77 NS2.88 *3.81 **0.14 NS2.23 NS4.5 **
* = significant at 5% probability, ** = significant at 1% levels of probability, NS = Non significant. Different letters followed by values in a column indicate significant differences at a 5% level of probability tested by Turkey’s test.
Table 2. Phenological characters, grain filling rate, and individual grain weight in eight wheat cultivars as affected by drought stress during the grain filling period.
CultivarsDrought StressGrain Filling Duration (d)Days to Anthesis (d)Days to Maturity (d)Grain Filling Rate
(mg grain−1 d−1)
Grain Weight
(mg Grain−1)
KanchanControl40.065.0108.00.8433.0
Stressed31.364.399.00.9329.24
BARI Gom 18Control43.363.0107.31.3656.61
Stressed34.362.099.01.1338.6
BARI Gom 23Control41.364.3106.31.3752.79
Stressed31.362.0100.61.1235.13
BARI Gom 24Control39.663.6109.31.2951.23
Stressed31.661.6100.31.3642.6
BARI Gom 25Control40.661.3107.00.8635.54
Stressed34.359.6101.00.9231.5
BARI Gom 26Control40.366.3110.01.1645.15
Stressed30.664.0102.61.2136.94
BARI Gom 27Control41.661.3106.30.9338.34
Stressed34.662.099.30.9934.32
BARI Gom 28Control43.061.3107.61.1546.21
Stressed35.359.0101.31.0135.63
SignificanceCultivar (C)2.83 *6.67 **1.86 NS5.8 **5.4 **
(F value)Stress (S)172.18 **8.88 **58.04 **0.51 NS25.77 **
C × S0.5 NS0.5 NS0.64 NS1.01 NS1.23 NS
* = significant at 5% probability, ** = significant at 1% levels of probability, NS = Non significant.
Publisher’s Note: MDPI stays neutral with regard to jurisdictional claims in published maps and institutional affiliations.

