
Long-Term Trend Analysis of Precipitation and Extreme Events over Kosi River Basin in India

 , , , , and
Abstract
:1. Introduction
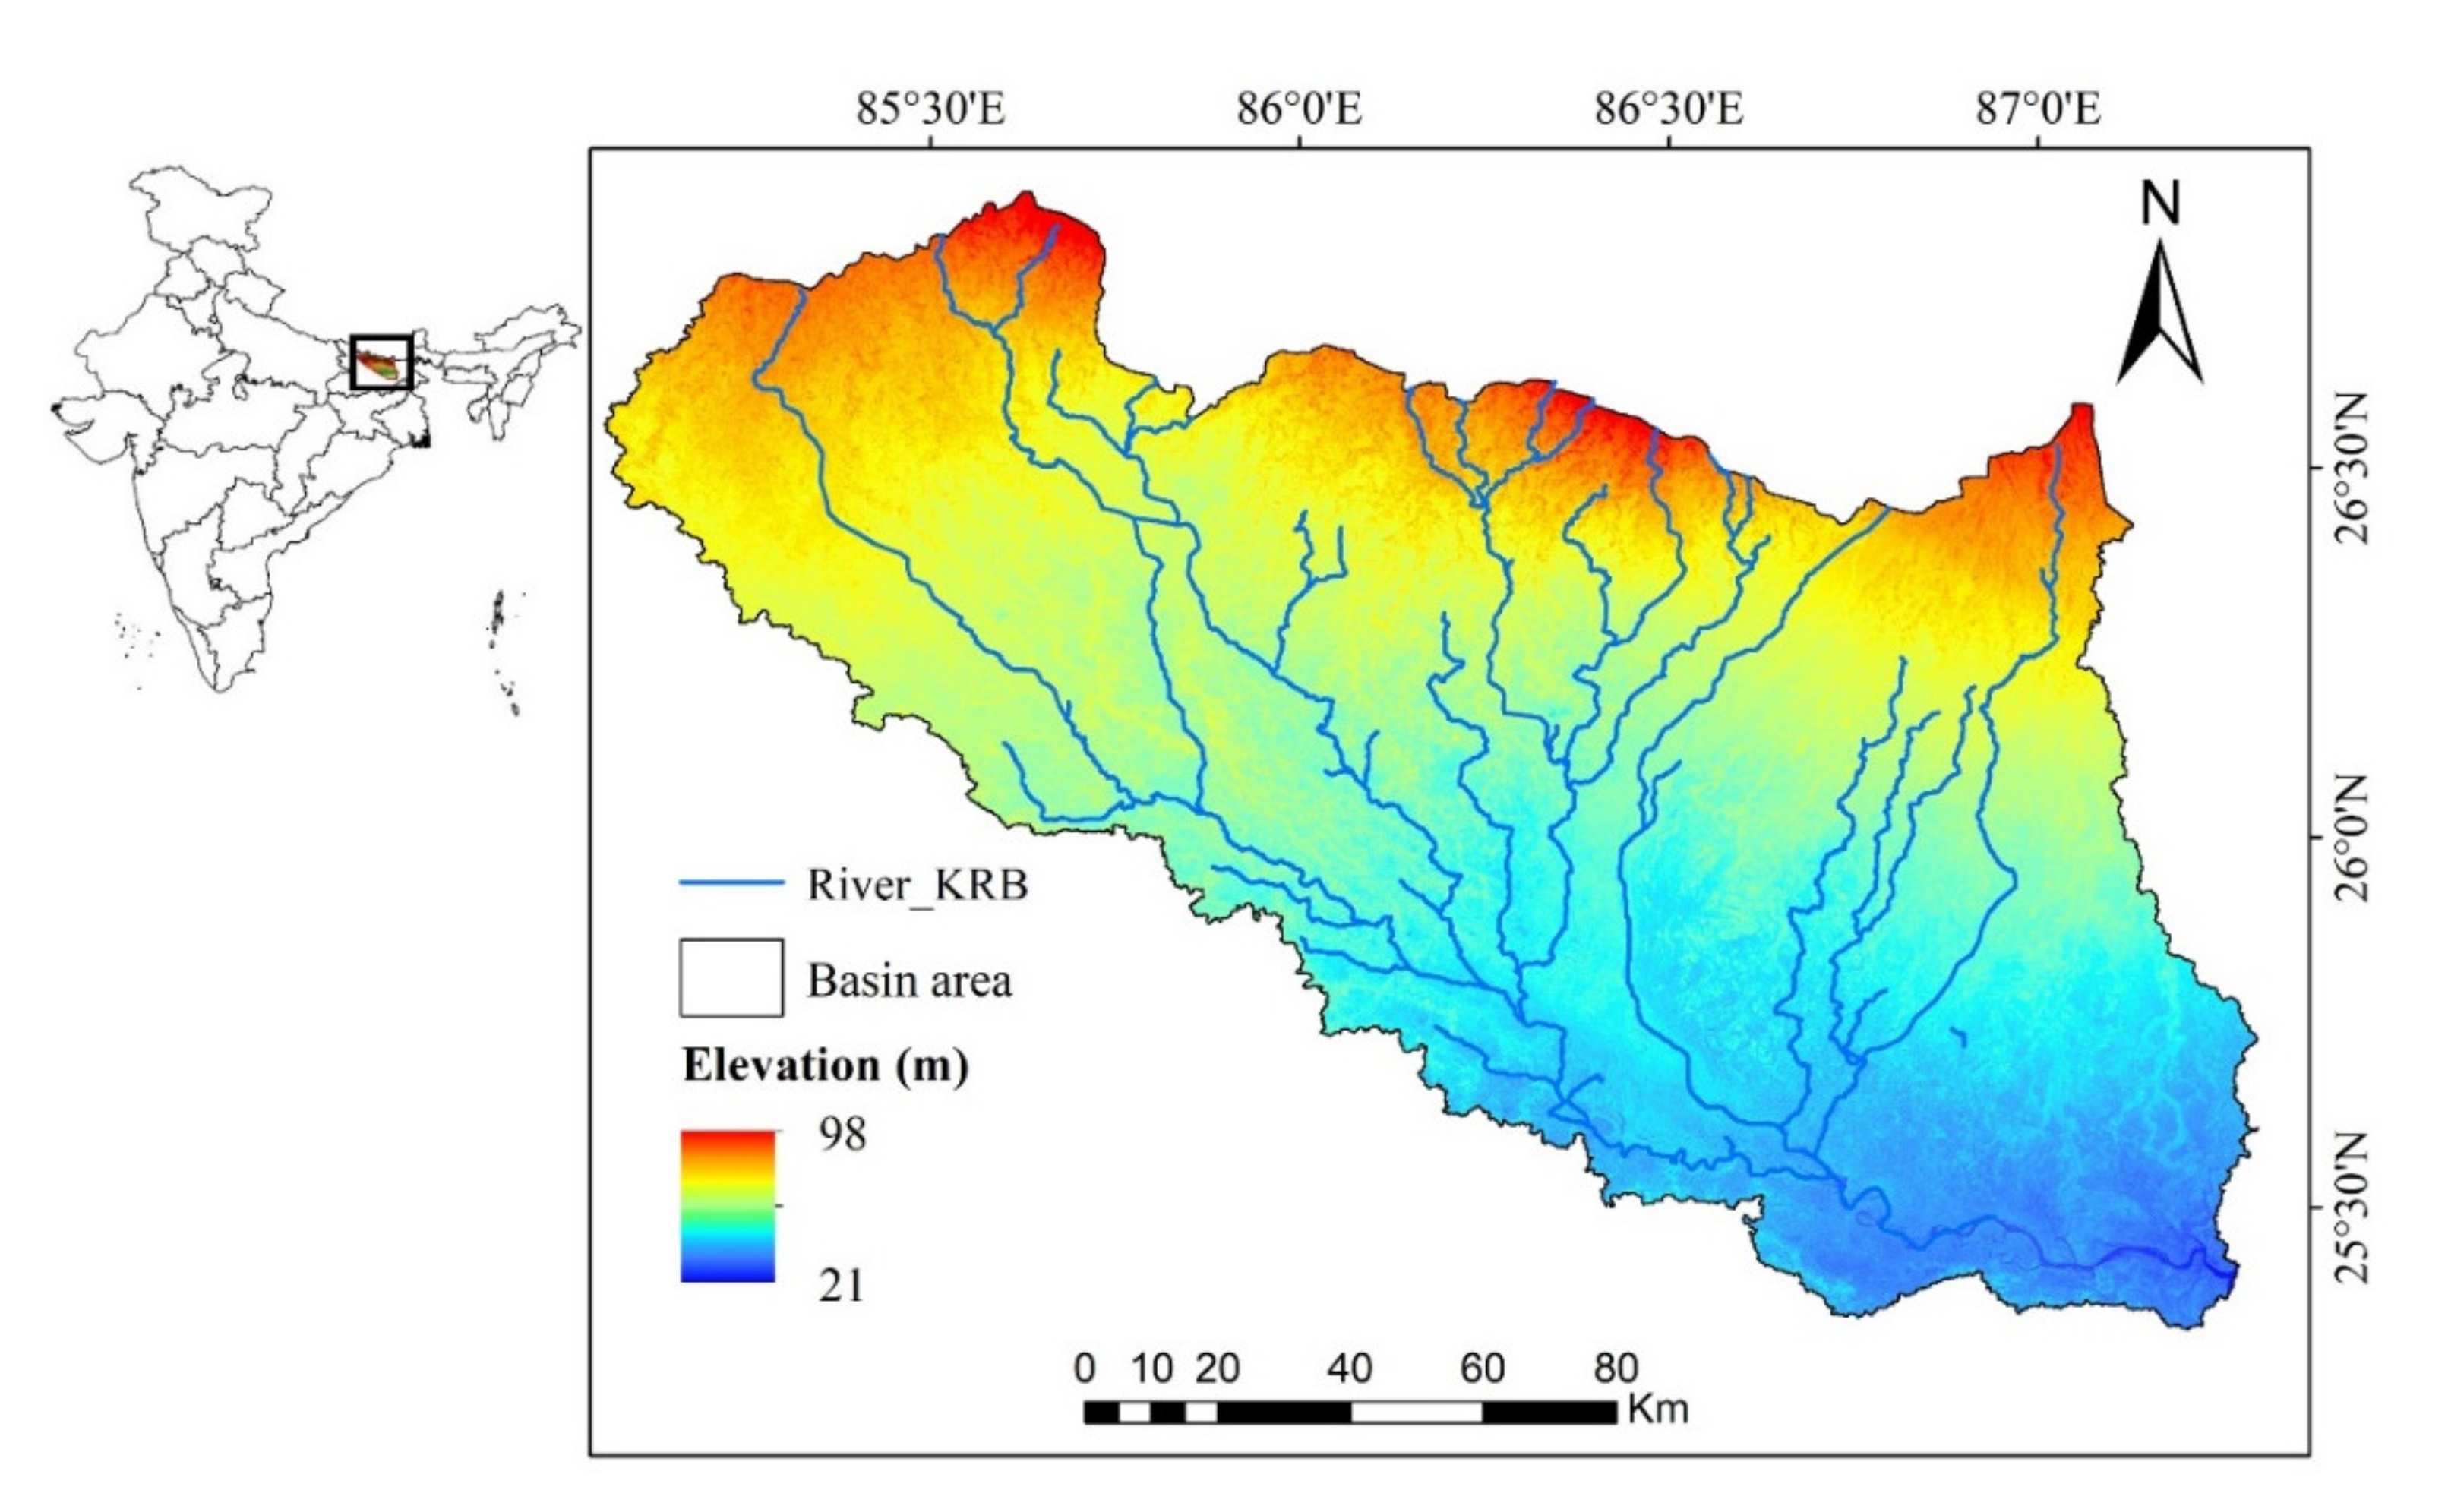
2. Study Area
3. Materials and Methodology
3.1. Trend Analysis
3.2. Extreme Precipitation Indices
4. Results and Discussion
4.1. Evaluation of Rainfall Dataset
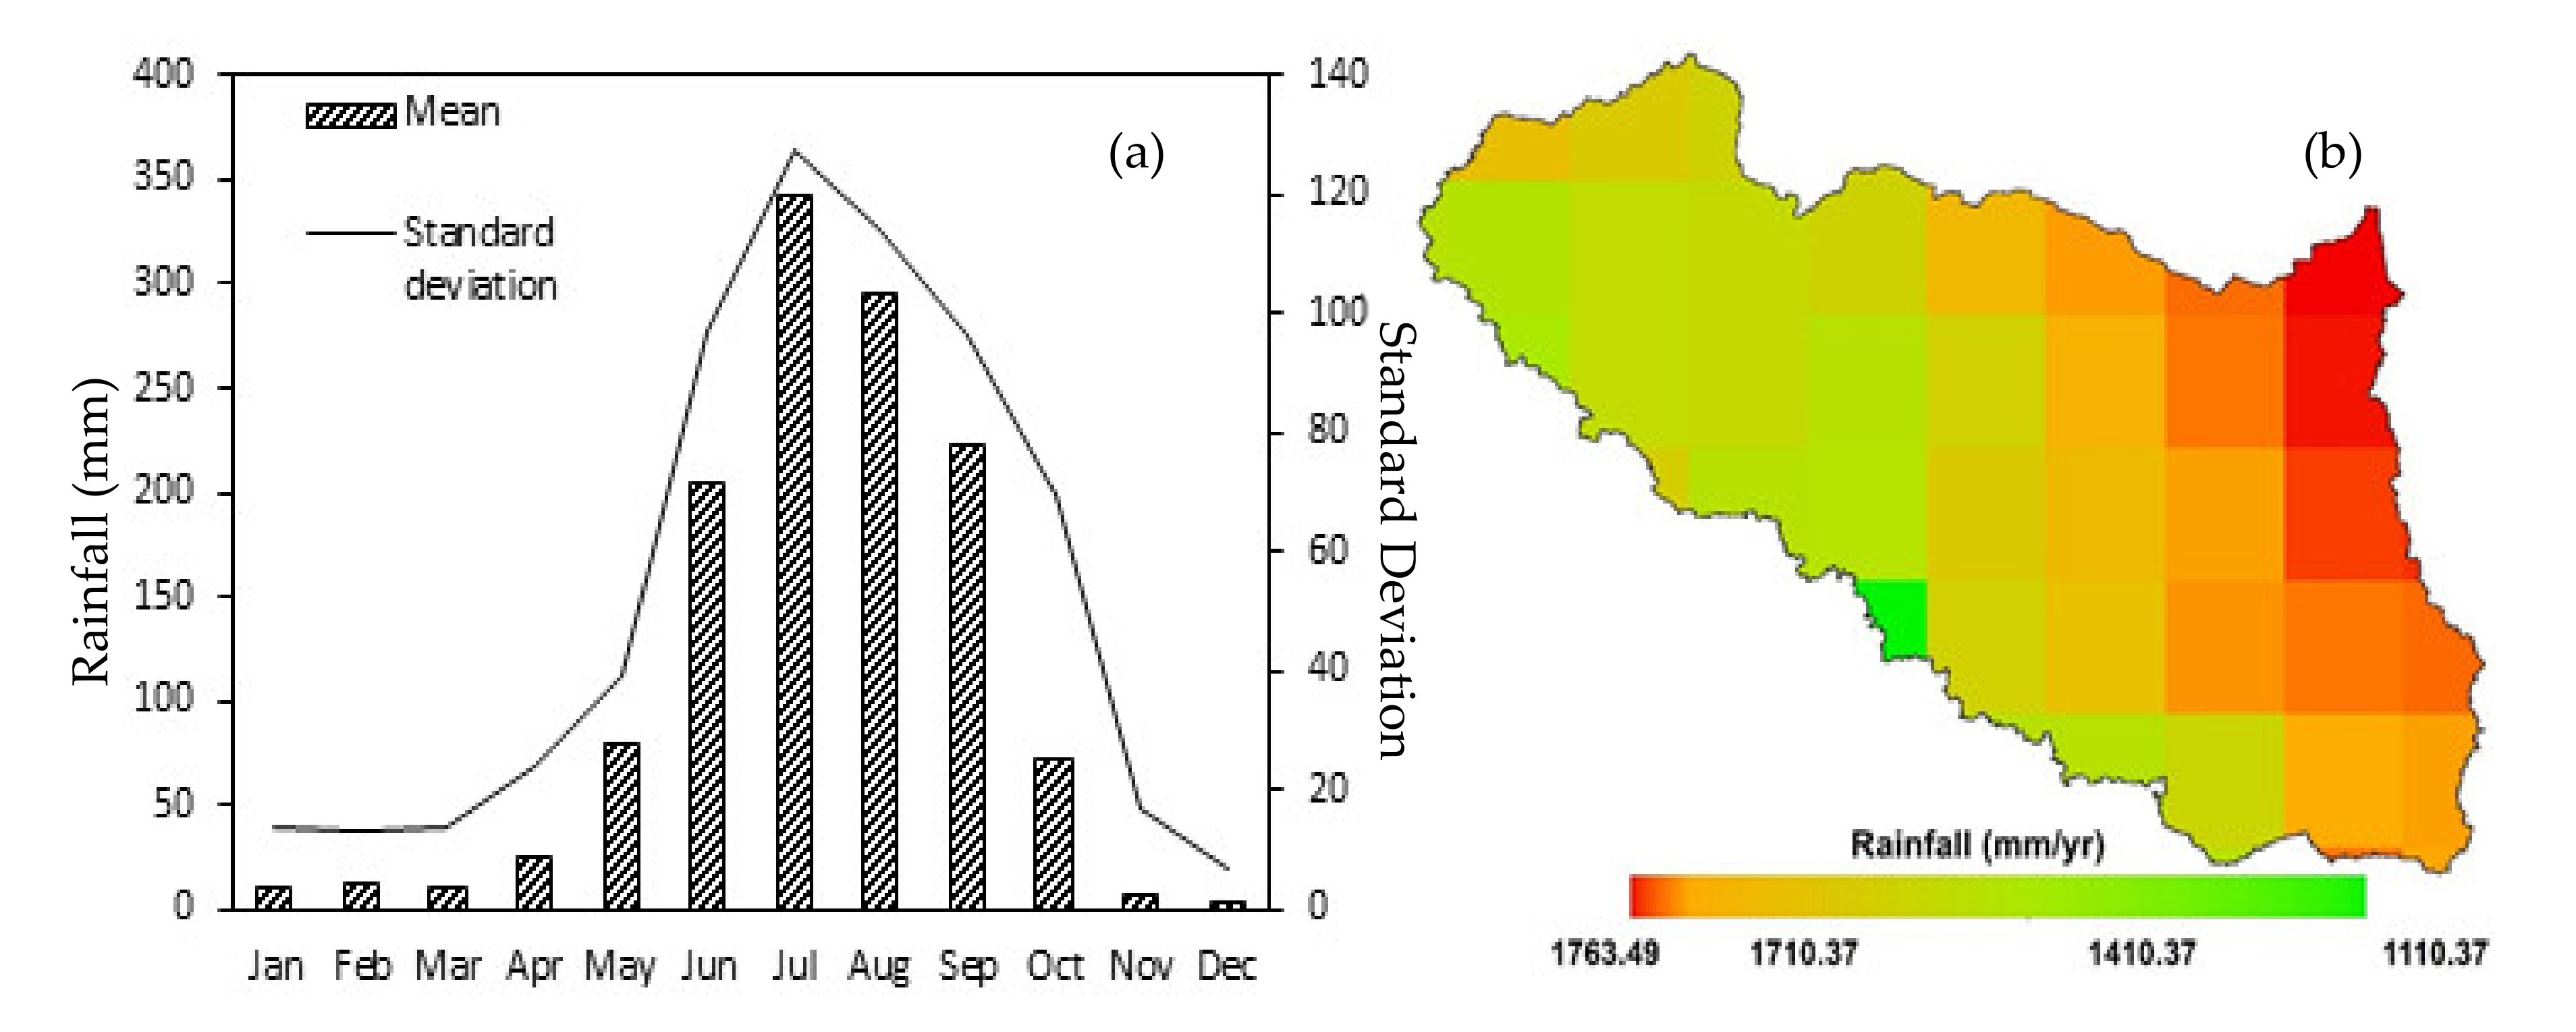
4.2. Monthly Analysis
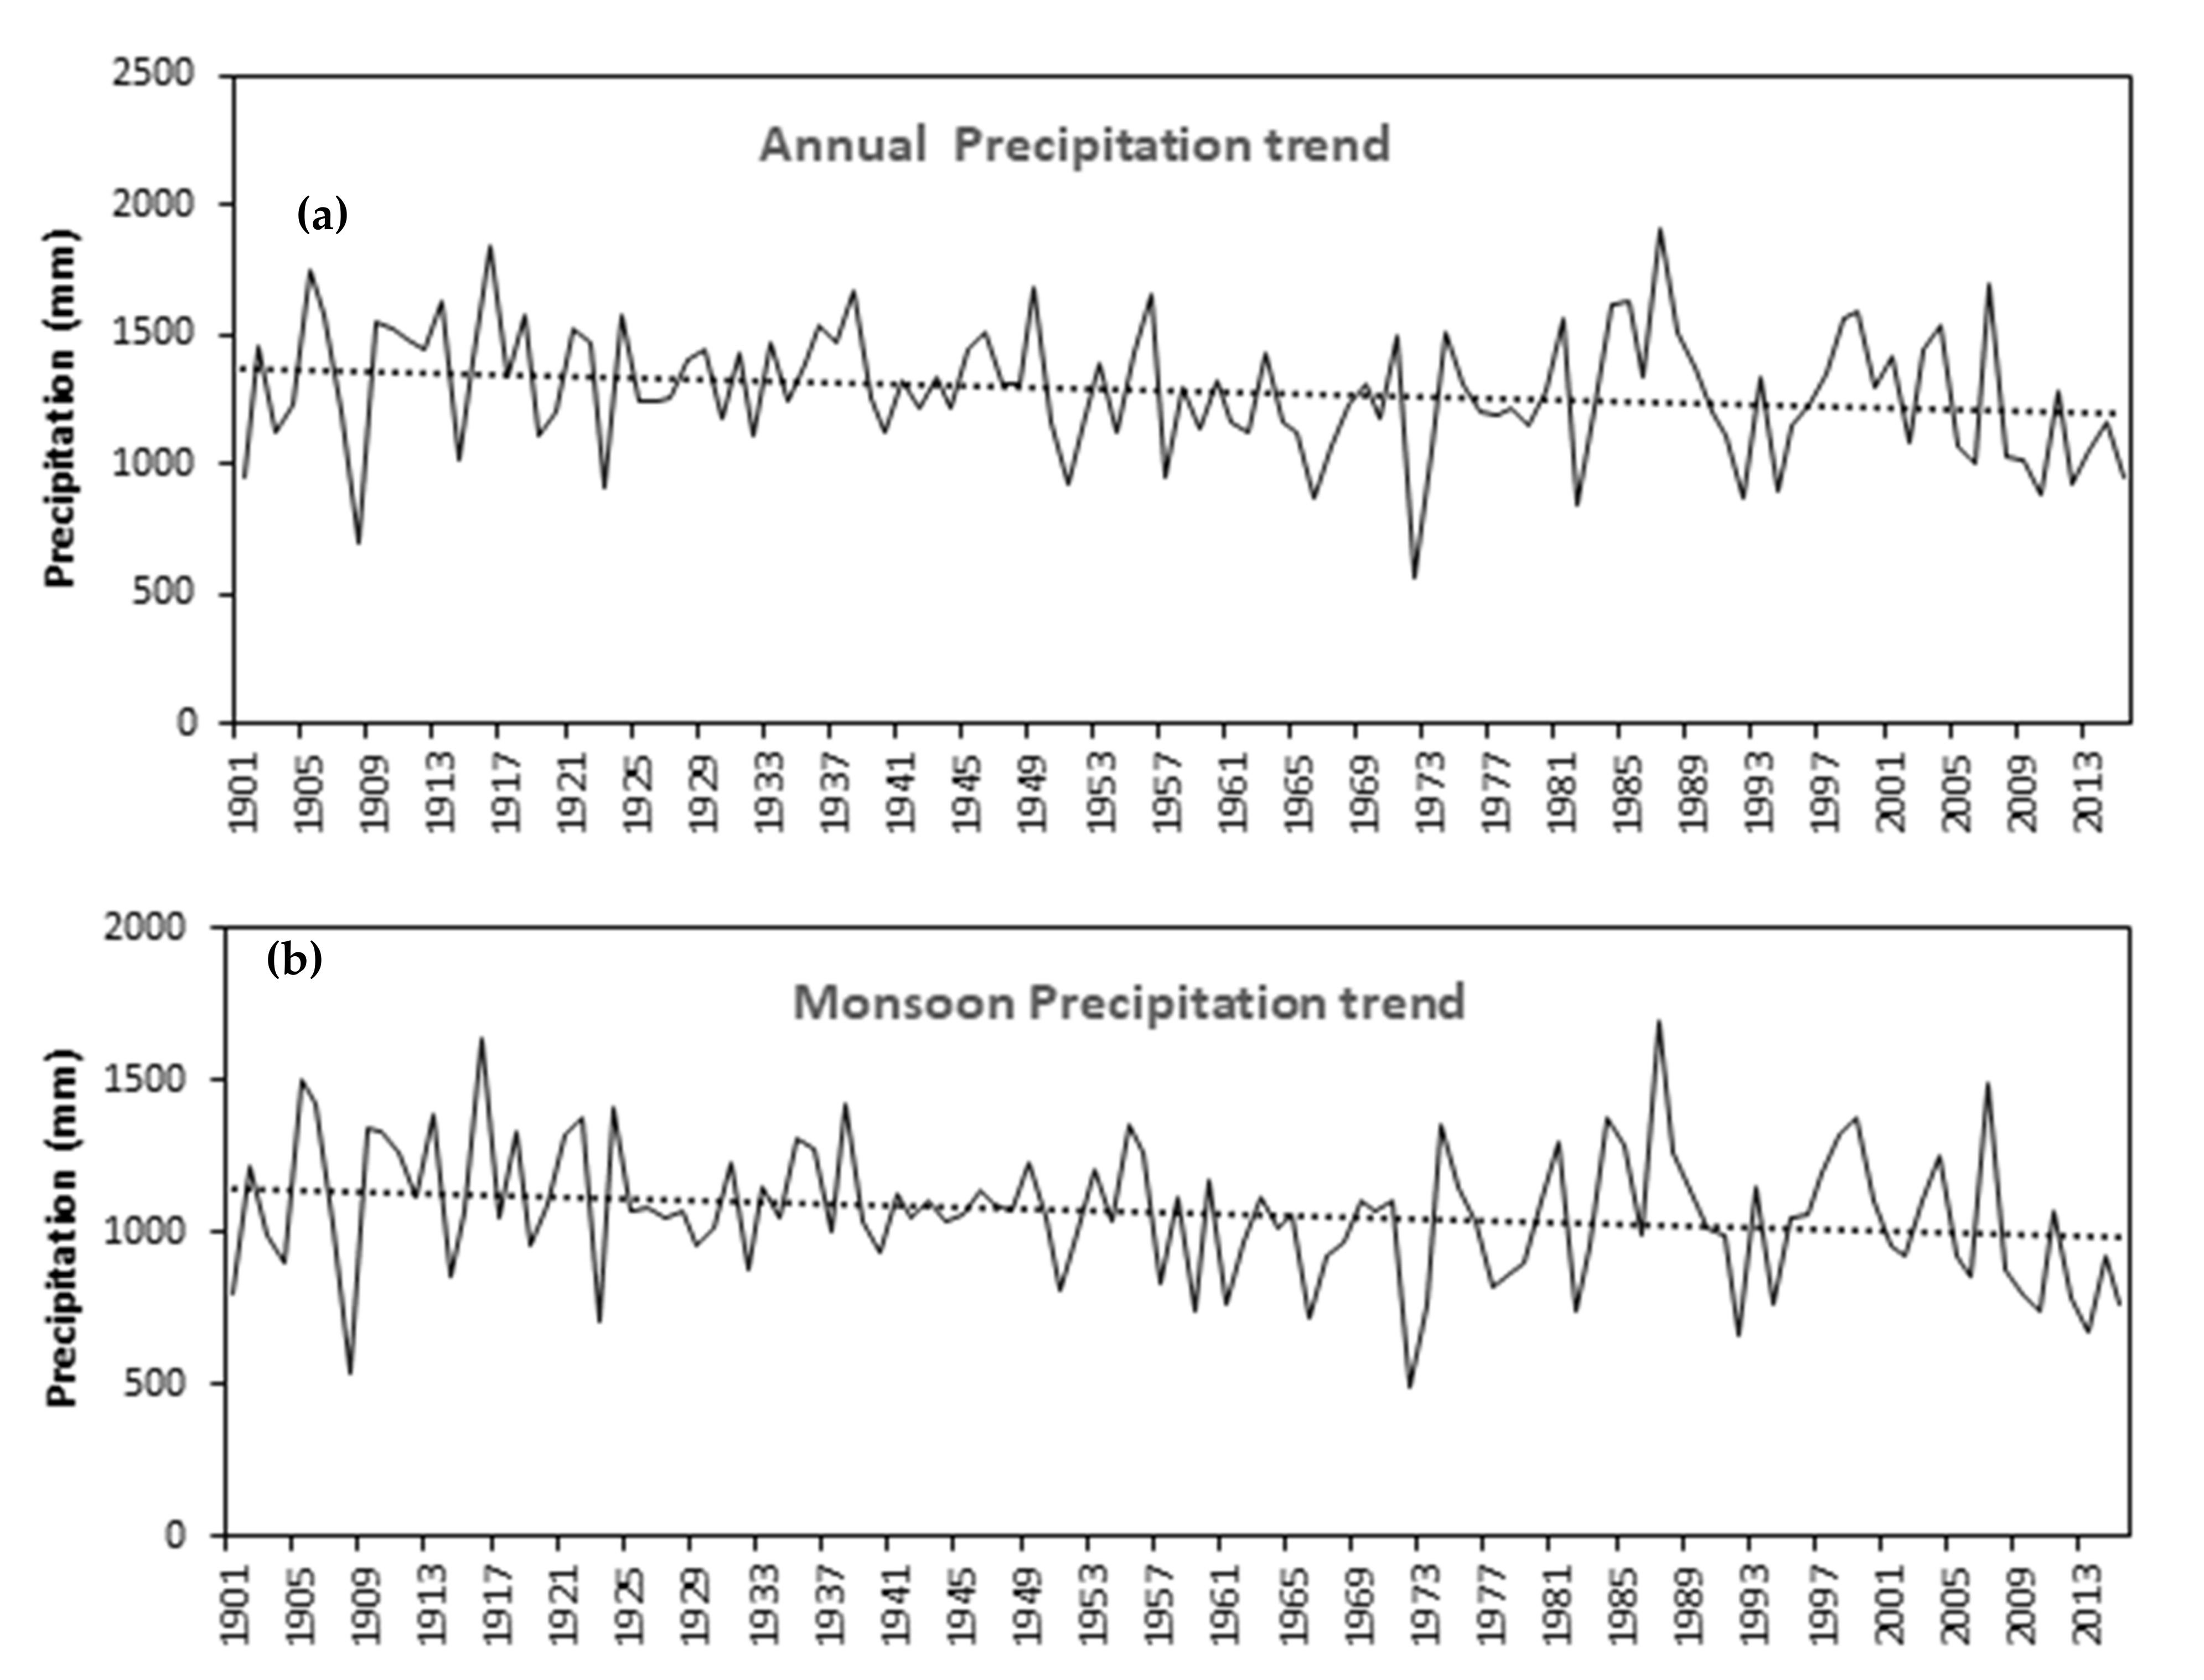
4.3. Seasonal and Annual Precipitation Time-Series Trend Analysis
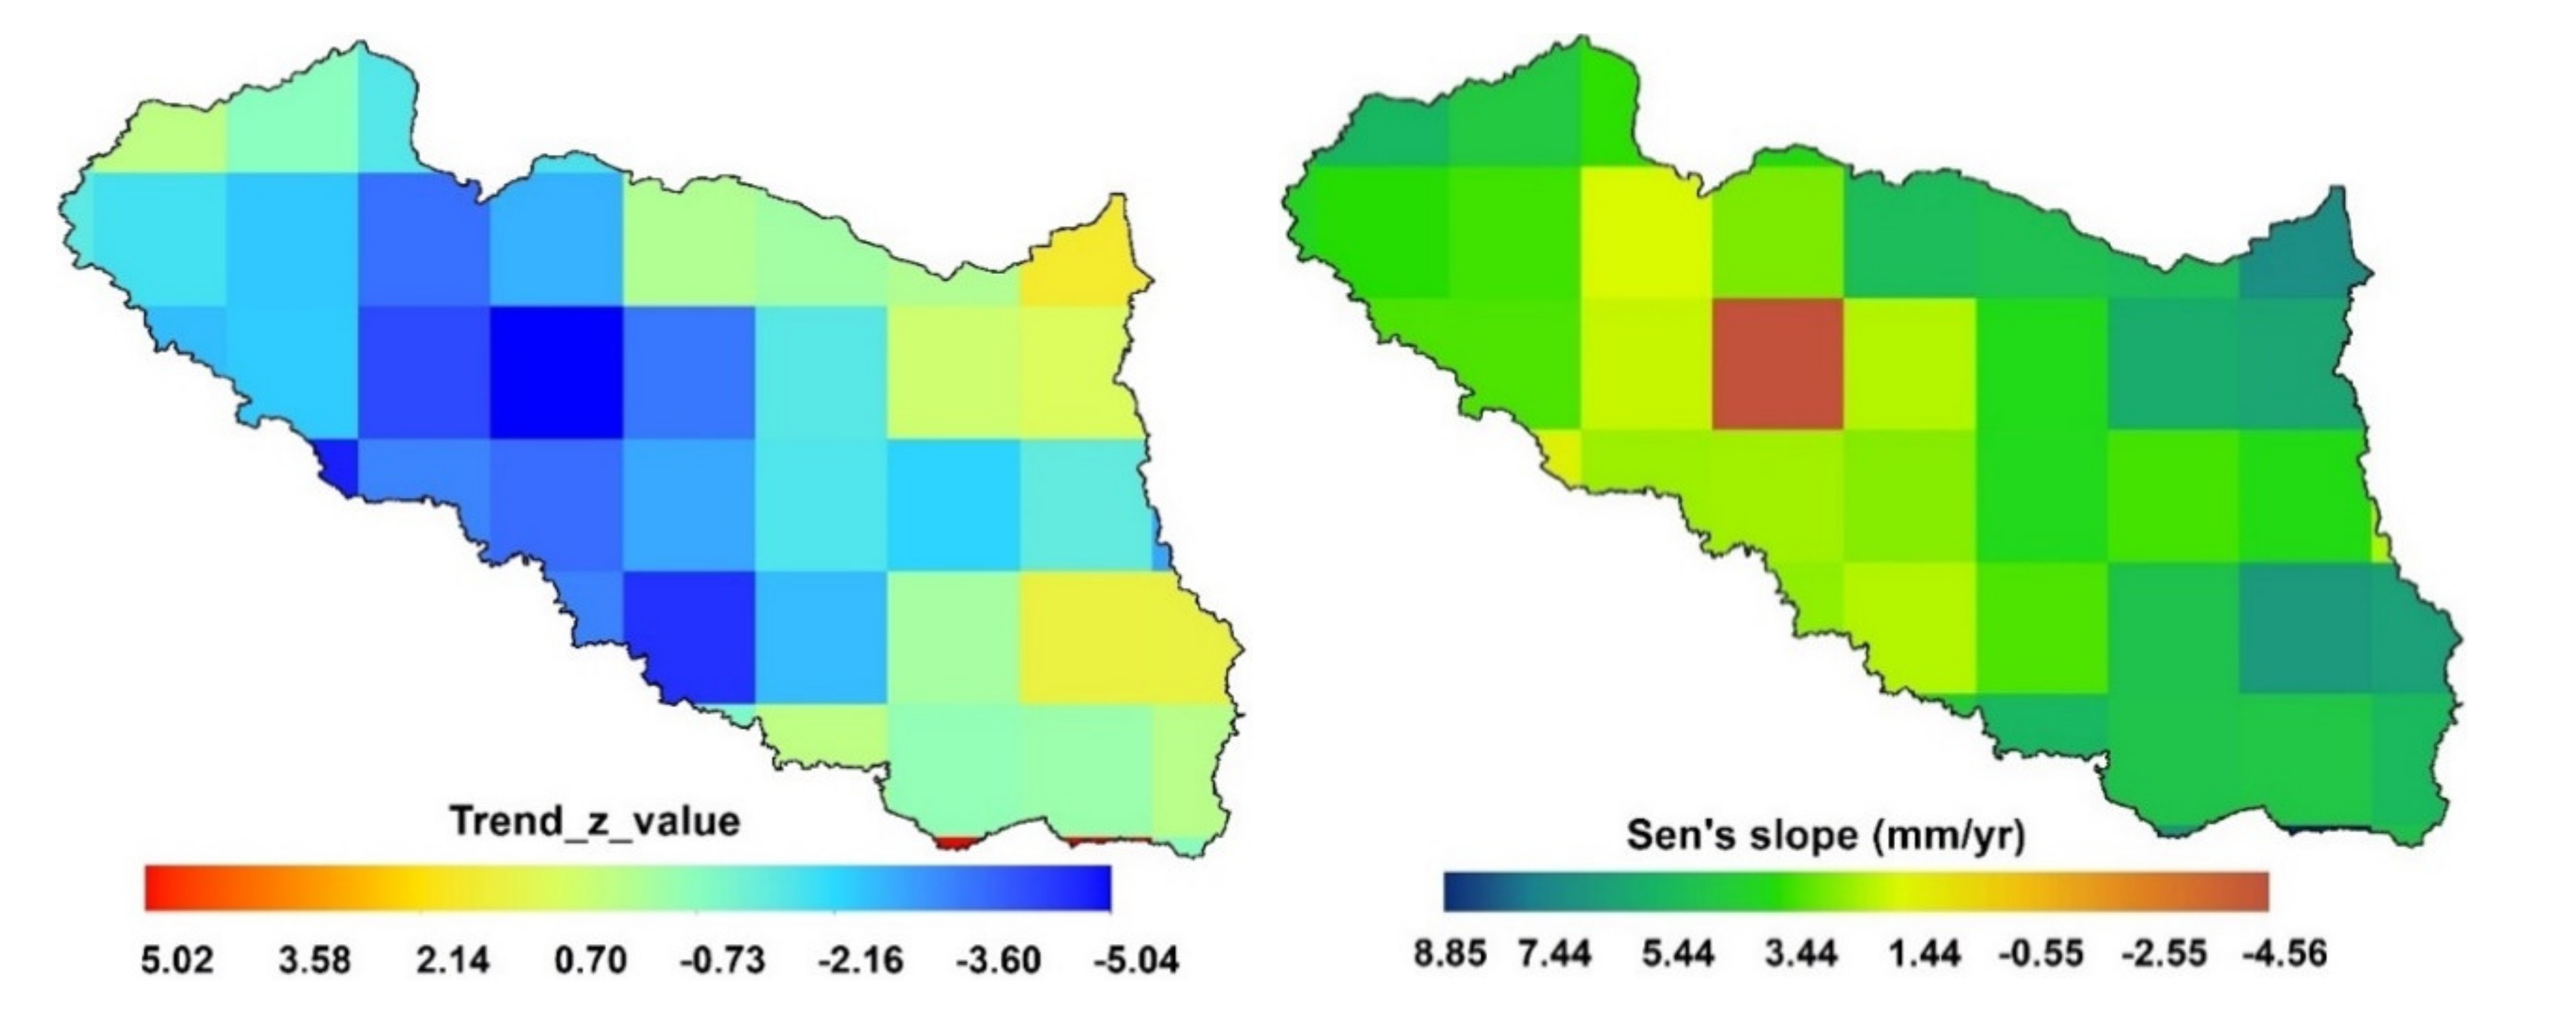
4.4. Spatial Variability in Long-Term Trend of Precipitation Time Series
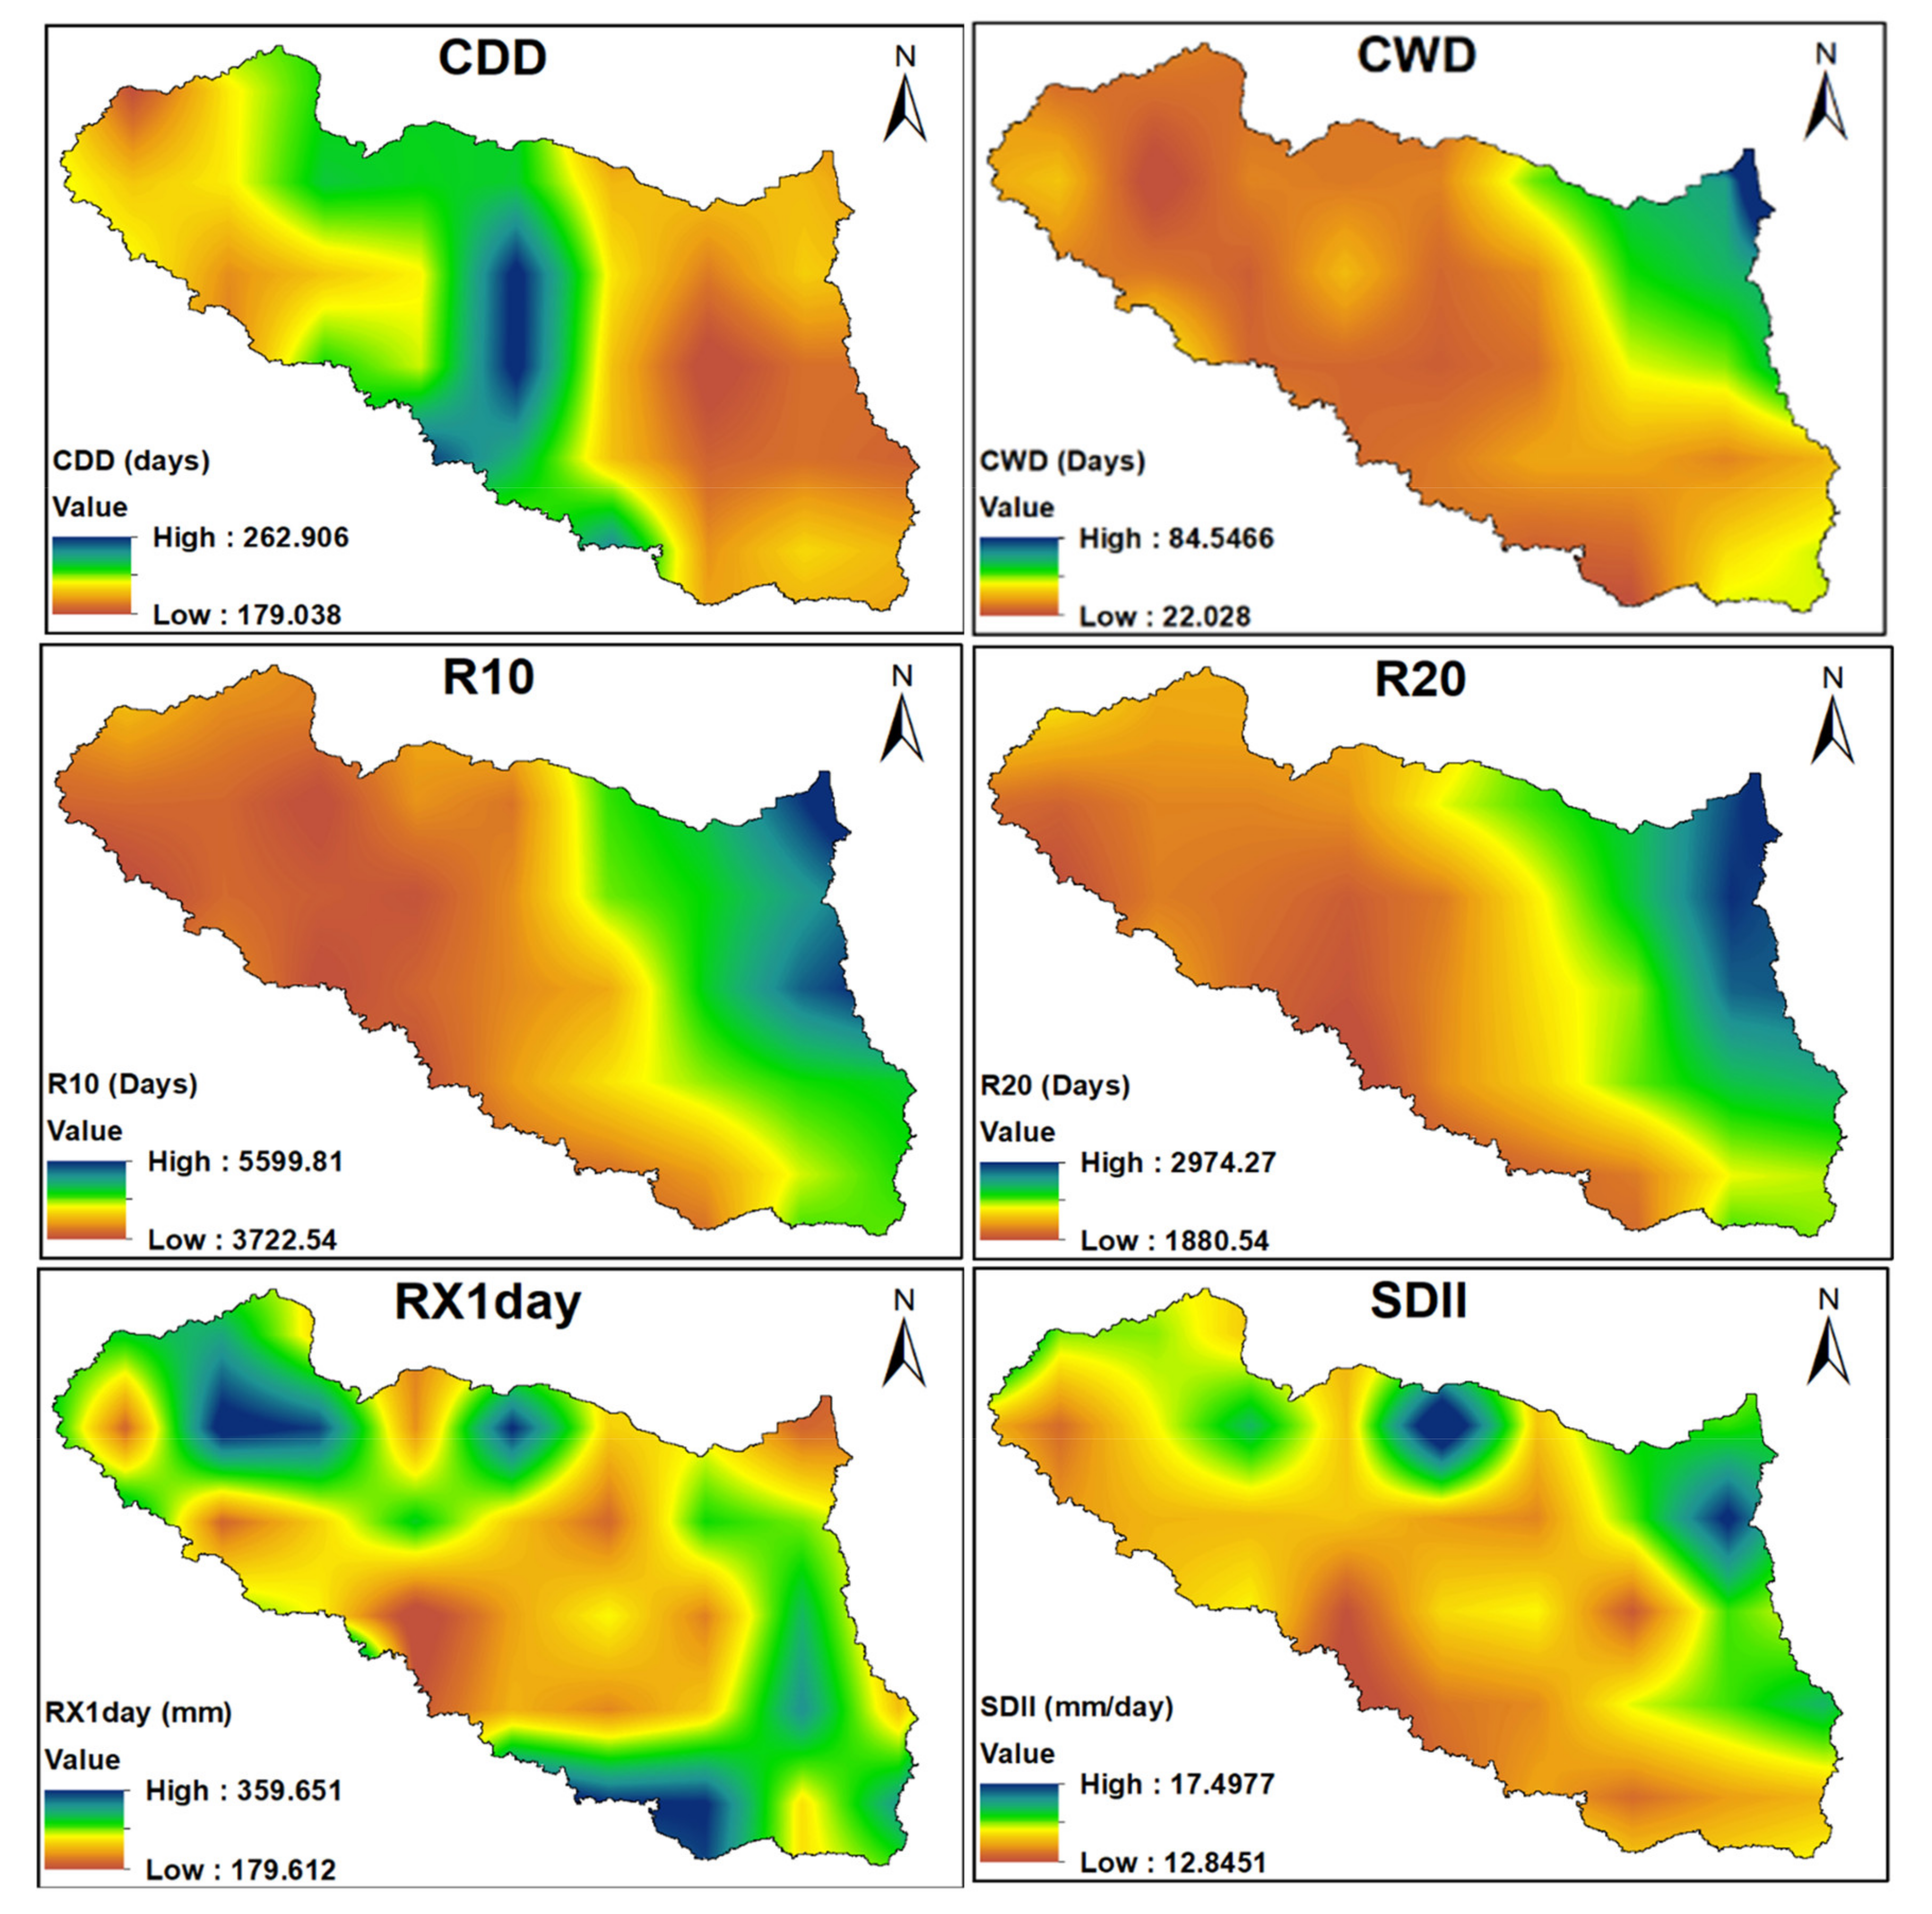
4.5. Spatial Distribution of Extreme Precipitation Indices
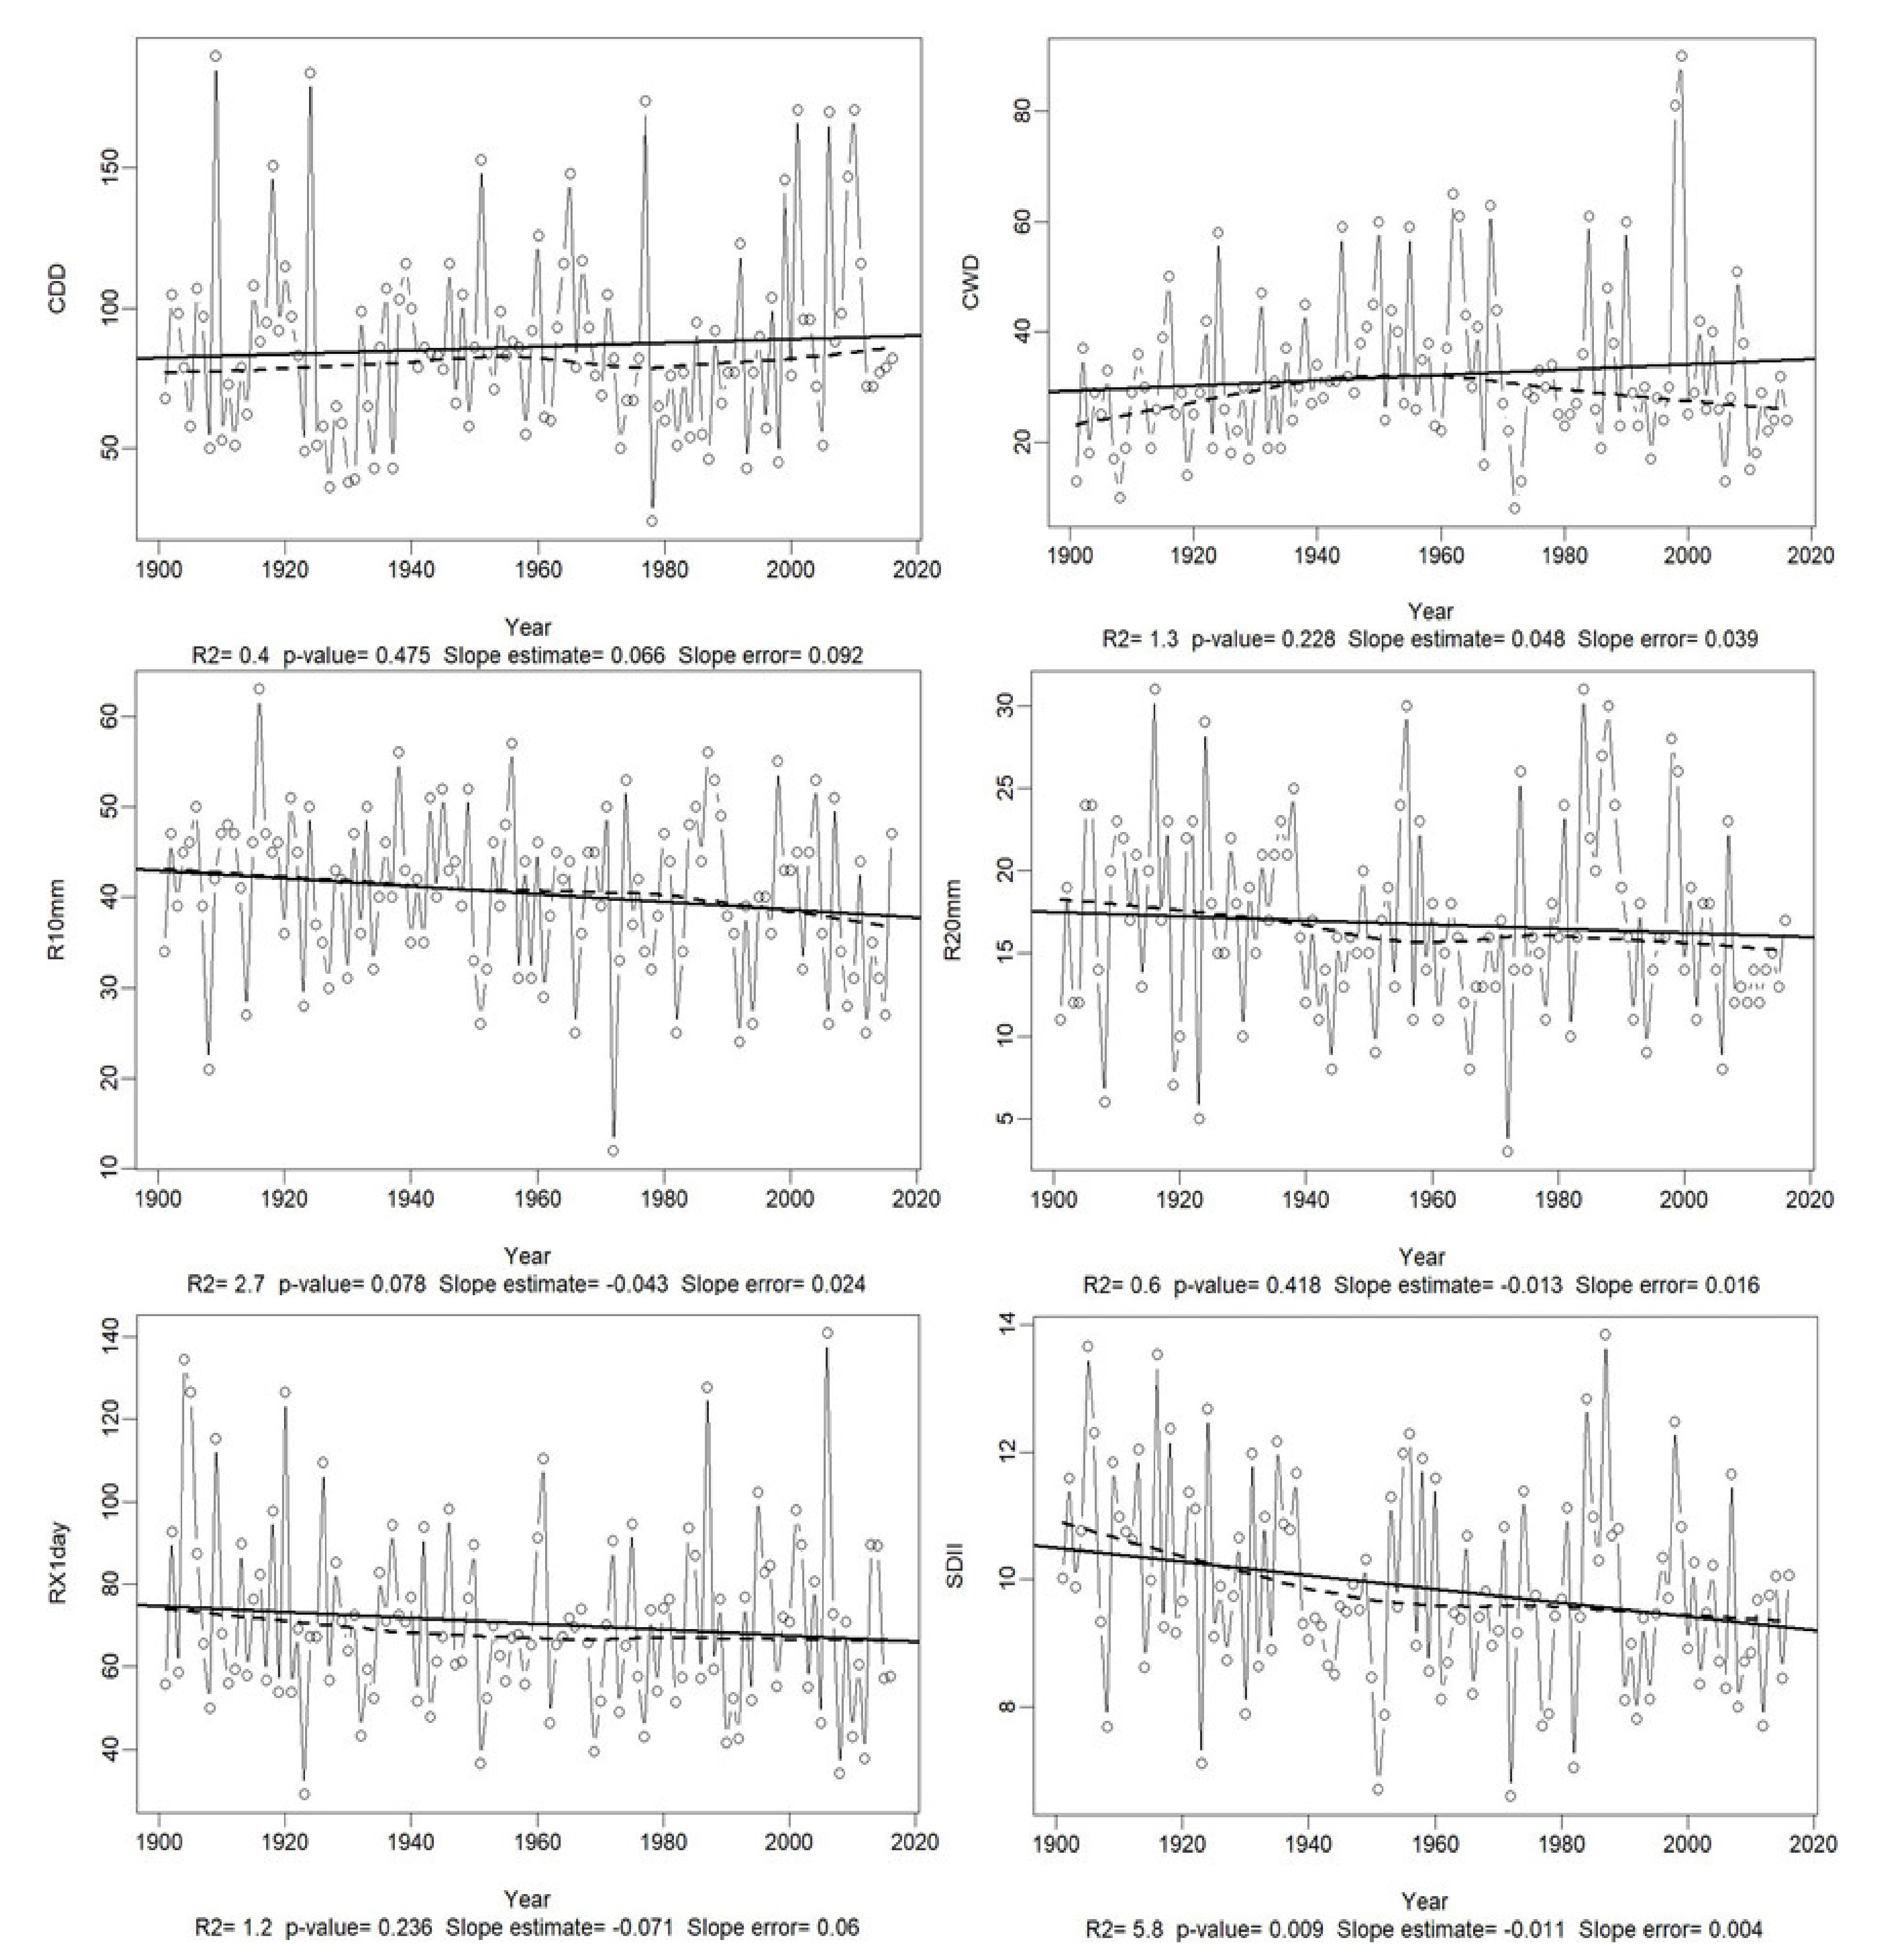
4.6. Long-Term Trend in Extreme Precipitation Indices
5. Conclusions
Author Contributions
Funding
Institutional Review Board Statement
Informed Consent Statement
Data Availability Statement
Acknowledgments
Conflicts of Interest
References
- Xia, X.; Wu, Q.; Mou, X.; Lai, Y. Potential impacts of climate change on the water quality of different water bodies. J. Environ. Informatics 2015, 25, 85–98. [Google Scholar] [CrossRef]
- Basher, M.A.; Stiller-Reeve, M.A.; Islam, A.S.; Bremer, S. Assessing climatic trends of extreme rainfall indices over northeast Bangladesh. Theor. Appl. Climatol. 2018, 134, 441–452. [Google Scholar] [CrossRef]
- Moss, R.H.; Meehl, G.A.; Lemos, M.C.; Smith, J.B.; Arnold, J.; Arnott, J.C.; Behar, D.; Brasseur, G.P.; Broomell, S.; Busalacchi, A. Hell and high water: Practice-relevant adaptation science. Science 2013, 342, 696–698. [Google Scholar] [CrossRef] [Green Version]
- Mall, R.K.; Gupta, A.; Singh, R.; Singh, R.S.; Rathore, L. Water resources and climate change: An Indian perspective. Curr. Sci. 2006, 1610–1626. [Google Scholar]
- Sridhar, S.; Raviraj, A. Statistical Trend Analysis of Rainfall in Amaravathi River Basin using Mann-Kendall Test. Curr. World Environ. 2017, 12. [Google Scholar] [CrossRef] [Green Version]
- Bera, S. Trend analysis of rainfall in Ganga Basin, India during 1901–2000. Am. J. Clim. Chang. 2017, 6, 116. [Google Scholar] [CrossRef] [Green Version]
- Gajbhiye, S.; Meshram, C.; Singh, S.K.; Srivastava, P.K.; Islam, T. Precipitation trend analysis of Sindh River basin, India, from 102-year record (1901–2002). Atmos. Sci. Lett. 2016, 17, 71–77. [Google Scholar] [CrossRef]
- Mishra, N.; Kumar, M.; Kumar, S. Trend Analysis of Precipitation by MK Test in Kumaon Region of Uttarakhand (1901–2010). Indian J. Sci. Technol. 2016, 9. [Google Scholar] [CrossRef]
- Pandit, D.V. Seasonal Rainfall Trend Analysis. Int. J. Eng. Res. Appl. 2016, 6, 69–73. [Google Scholar]
- Chaubey, P.K.; Srivastava, P.K.; Gupta, A.; Mall, R.K. Integrated assessment of extreme events and hydrological responses of Indo-Nepal Gandak River Basin. Environ. Dev. Sustain. 2021, 23, 8643–8668. [Google Scholar] [CrossRef]
- Hadi, S.J.; Tombul, M. Long-term spatiotemporal trend analysis of precipitation and temperature over Turkey. Meteorol. Appl. 2018, 25, 445–455. [Google Scholar] [CrossRef] [Green Version]
- Rustum, R.; Adeloye, A.J.; Mwale, F. Spatial and temporal Trend Analysis of Long Term rainfall records in data-poor catchments with missing data, a case study of Lower Shire floodplain in Malawi for the Period 1953–2010. Hydrol. Earth Syst. Sci. Discuss 2017. preprint. [Google Scholar] [CrossRef] [Green Version]
- Howard, G.; Calow, R.; Macdonald, A.; Bartram, J. Climate change and water and sanitation: Likely impacts and emerging trends for action. Annu. Rev. Environ. Resour. 2016, 41, 253–276. [Google Scholar] [CrossRef] [Green Version]
- Mall, R.K.; Srivastava, R.K.; Banerjee, T.; Mishra, O.P.; Bhatt, D.; Sonkar, G. Disaster Risk Reduction Including Climate Change Adaptation Over South Asia: Challenges and Ways Forward. Int. J. Disaster Risk Sci. 2019, 10, 14–27. [Google Scholar] [CrossRef] [Green Version]
- Kumar, V.; Jain, S.K.; Singh, Y. Analysis of long-term rainfall trends in India. Hydrol. Sci. J. J. Sci. Hydrol. 2010, 55, 484–496. [Google Scholar] [CrossRef]
- Panda, R.K.; Singh, G. Analysis of Trend and Variability of Rainfall in the Mid-Mahanadi River Basin of Eastern India. Analysis 2016, 1608, 53049. [Google Scholar]
- Mirza, M.; Warrick, R.; Ericksen, N.; Kenny, G. Trends and persistence in precipitation in the Ganges, Brahmaputra and Meghna river basins. Hydrol. Sci. J. 1998, 43, 845–858. [Google Scholar] [CrossRef]
- Chandrakar, A.; Khare, D.; Krishan, R. Assessment of Spatial and Temporal Trends of Long Term Precipitation over Kharun Watershed, Chhattisgarh, India. Environ. Process. 2017, 4, 959–974. [Google Scholar] [CrossRef]
- Kumar Pradhan, R.; Srivastava, P.K.; Maurya, S.; Kumar Singh, S.; Patel, D.P. Integrated framework for soil and water conservation in Kosi River Basin. Geocarto Int. 2020, 35, 391–410. [Google Scholar] [CrossRef]
- Shrestha, A.B.; Bajracharya, S.R.; Sharma, A.R.; Duo, C.; Kulkarni, A. Observed trends and changes in daily temperature and precipitation extremes over the Koshi river basin 1975–2010. Int. J. Climatol. 2017, 37, 1066–1083. [Google Scholar] [CrossRef] [Green Version]
- Nepal, S. Impacts of climate change on the hydrological regime of the Koshi river basin in the Himalayan region. J. Hydro Environ. Res. 2016, 10, 76–89. [Google Scholar] [CrossRef] [Green Version]
- Agarwal, A.; Babel, M.S.; Maskey, S. Analysis of future precipitation in the Koshi river basin, Nepal. J. Hydrol. 2014, 513, 422–434. [Google Scholar] [CrossRef]
- Gupta, K.S.N. Towards enhanced disaster risk reduction in the Koshi River basin: A look at the downstream reaches of Bihar in India. Available online: https://www.icimod.org/article/towards-enhanced-disaster-risk-reduction-in-the-koshi-river-basin-a-look-at-the-downstream-reaches-of-bihar-in-india/ (accessed on 16 July 2020).
- Sahana, M.; Patel, P.P. A comparison of frequency ratio and fuzzy logic models for flood susceptibility assessment of the lower Kosi River Basin in India. Environ. Earth Sci. 2019, 78, 1–27. [Google Scholar] [CrossRef]
- Sinha, R.; Bapalu, G.; Singh, L.; Rath, B. Flood risk analysis in the Kosi river basin, north Bihar using multi-parametric approach of analytical hierarchy process (AHP). J. Indian Soc. Remote. Sens. 2008, 36, 335–349. [Google Scholar] [CrossRef]
- Pai, D.; Sridhar, L.; Rajeevan, M.; Sreejith, O.; Satbhai, N.; Mukhopadhyay, B. Development of a new high spatial resolution (0.25 × 0.25) long period (1901–2010) daily gridded rainfall data set over India and its comparison with existing data sets over the region. Mausam 2014, 65, 1–18. [Google Scholar]
- Prakash, S. Performance assessment of CHIRPS, MSWEP, SM2RAIN-CCI, and TMPA precipitation products across India. J. Hydrol. 2019, 571, 50–59. [Google Scholar] [CrossRef]
- Bae, D.H.; Jung, I.W.; Chang, H. Long-Term trend of precipitation and runoff in Korean river basins. Hydrol. Process. 2008, 22, 2644–2656. [Google Scholar] [CrossRef]
- Asfaw, A.; Simane, B.; Hassen, A.; Bantider, A. Variability and time series trend analysis of rainfall and temperature in northcentral Ethiopia: A case study in Woleka sub-basin. Weather. Clim. Extrem. 2018, 19, 29–41. [Google Scholar] [CrossRef]
- Longobardi, A.; Villani, P. Trend analysis of annual and seasonal rainfall time series in the Mediterranean area. Int. J. Climatol. 2010, 30, 1538–1546. [Google Scholar] [CrossRef]
- Ahmad, I.; Tang, D.; Wang, T.; Wang, M.; Wagan, B. Precipitation Trends over Time Using Mann-Kendall and Spearman’s rho Tests in Swat River Basin, Pakistan. Adv. Meteorol. 2015, 2015, 1–15. [Google Scholar] [CrossRef] [Green Version]
- Salami, A.; Ikpee, O.; Ibitoye, A.; Oritola, S. Trend analysis of hydro-meteorological variables in the coastal area of Lagos using Mann-Kendall trend and Standard Anomaly Index methods. J. Appl. Sci. Environ. Manag. 2016, 20, 797–808. [Google Scholar] [CrossRef] [Green Version]
- Okafor, G.C.; Jimoh, O.; Larbi, K.I. Detecting Changes in Hydro-Climatic Variables during the Last Four Decades (1975–2014) on Downstream Kaduna River Catchment, Nigeria. Atmos. Clim. Sci. 2017, 7, 161. [Google Scholar] [CrossRef] [Green Version]
- Sen, P.K. Estimates of the regression coefficient based on Kendall’s tau. J. Am. Stat. Assoc. 1968, 63, 1379–1389. [Google Scholar] [CrossRef]
- Drápela, K.; Drápelová, I. Application of Mann-Kendall test and the Sen’s slope estimates for trend detection in deposition data from Bílý Kříž (Beskydy Mts., the Czech Republic) 1997–2010. Beskydy 2011, 4, 133–146. [Google Scholar]
- Sharma, A.; Sharma, D.; Panda, S.; Dubey, S.K.; Pradhan, R.K. Investigation of temperature and its indices under climate change scenarios over different regions of Rajasthan state in India. Glob. Planet. Chang. 2018, 161, 82–96. [Google Scholar] [CrossRef]
- Pradhan, R.K.; Sharma, D.; Panda, S.; Dubey, S.K.; Sharma, A. Changes of precipitation regime and its indices over Rajasthan state of India: Impact of climate change scenarios experiments. Clim. Dyn. 2019, 52, 3405–3420. [Google Scholar] [CrossRef]
- Sillmann, J.; Kharin, V.; Zhang, X.; Zwiers, F.; Bronaugh, D. Climate extremes indices in the CMIP5 multimodel ensemble: Part 1. Model evaluation in the present climate. J. Geophys. Res. Atmos. 2013, 118, 1716–1733. [Google Scholar] [CrossRef]
- Kim, Y.; Rocheta, E.; Evans, J.P.; Sharma, A. Impact of bias correction of regional climate model boundary conditions on the simulation of precipitation extremes. Clim. Dyn. 2020, 55, 3507–3526. [Google Scholar] [CrossRef]
- Tank, A.M.G.K.; Peterson, T.C.; Quadir, D.A.; Dorji, S.; Zou, X.; Tang, H.; Santhosh, K.; Joshi, U.R.; Jaswal, A.K.; Kolli, R.K.; et al. Changes in daily temperature and precipitation extremes in central and south Asia. J. Geophys. Res. Space Phys. 2006, 111, 111. [Google Scholar] [CrossRef]
- Warwade, P.; Tiwari, S.; Ranjan, S.; Chandniha, S.K.; Adamowski, J. Spatio-temporal variation of rainfall over Bihar State, India. J. Water Land Dev. 2018, 36, 183–197. [Google Scholar] [CrossRef] [Green Version]
- Zakwan, M.; Ara, Z. Statistical analysis of rainfall in Bihar. Sustain. Water Resour. Manag. 2019, 5, 1781–1789. [Google Scholar] [CrossRef]
- Marengo, J.A. On the hydrological cycle of the Amazon Basin: A historical review and current state-of-the-art. Rev. Bras. Meteorol. 2006, 21, 1–19. [Google Scholar]
- Das, P.; Behera, M.D.; Patidar, N.; Sahoo, B.; Tripathi, P.; Behera, P.R.; Srivastava, S.; Roy, P.S.; Thakur, P.; Agrawal, S. Impact of LULC change on the runoff, base flow and evapotranspiration dynamics in eastern Indian river basins during 1985–2005 using variable infiltration capacity approach. J. Earth Syst. Sci. 2018, 127, 1–19. [Google Scholar] [CrossRef] [Green Version]
- Rai, P.K.; Chandel, R.S.; Mishra, V.N.; Singh, P. Hydrological inferences through morphometric analysis of lower Kosi river basin of India for water resource management based on remote sensing data. Appl. Water Sci. 2018, 8, 1–16. [Google Scholar] [CrossRef] [Green Version]
- Rimal, B.; Sharma, R.; Kunwar, R.; Keshtkar, H.; Stork, N.E.; Rijal, S.; Rahman, S.A.; Baral, H. Effects of land use and land cover change on ecosystem services in the Koshi River Basin, Eastern Nepal. Ecosyst. Serv. 2019, 38, 100963. [Google Scholar] [CrossRef]
- Paudel, B.; Gao, J.; Zhang, Y.; Wu, X.; Li, S.; Yan, J. Changes in cropland status and their driving factors in the Koshi River basin of the Central Himalayas, Nepal. Sustainability 2016, 8, 933. [Google Scholar] [CrossRef] [Green Version]
- Das, P.; Behera, M.; Pal, S.; Chowdary, V.; Behera, P.; Singh, T. Studying land use dynamics using decadal satellite images and Dyna-CLUE model in the Mahanadi River basin, India. Environ. Monit. Assess. 2019, 191, 1–17. [Google Scholar] [CrossRef] [PubMed]
- Shukla, A.K.; Ojha, C.S.P.; Mijic, A.; Buytaert, W.; Pathak, S.; Garg, R.D.; Shukla, S. Population growth, land use and land cover transformations, and water quality nexus in the Upper Ganga River basin. Hydrol. Earth Syst. Sci. 2018, 22, 4745–4770. [Google Scholar] [CrossRef] [Green Version]
- Mitra, S.; Roy, A.K.; Tamang, L. Assessing the status of changing channel regimes of Balason and Mahananda River in the Sub-Himalayan West Bengal, India. Earth Syst. Environ. 2020, 4, 409–425. [Google Scholar] [CrossRef]
- Alahacoon, N.; Edirisinghe, M. Spatial Variability of Rainfall Trends in Sri Lanka from 1989 to 2019 as an Indication of Climate Change. ISPRS Int. J. Geo Inf. 2021, 10, 84. [Google Scholar] [CrossRef]
- Shah, N.; Patel, Y.; DBhangaonkar, P. Assessing Impact of Climate Change on Rainfall Patterns of Vadodara District, Gujarat, India. In In Proceedings of the Journal of Physics, Conference Series, Goa, India, 24–25 October 2020; p. 012046. [Google Scholar]
- Onyutha, C.; Tabari, H.; Rutkowska, A.; Nyeko-Ogiramoi, P.; Willems, P. Comparison of different statistical downscaling methods for climate change rainfall projections over the Lake Victoria basin considering CMIP3 and CMIP5. J. Hydro Environ. Res. 2016, 12, 31–45. [Google Scholar] [CrossRef]
- Manton, M.J.; Della-Marta, P.M.; Haylock, M.R.; Hennessy, K.; Nicholls, N.; Chambers, L.; Collins, D.; Daw, G.; Finet, A.; Gunawan, D. Trends in extreme daily rainfall and temperature in Southeast Asia and the South Pacific: 1961–1998. Int. J. Climatol. 2001, 21, 269–284. [Google Scholar] [CrossRef]
- Singh, D.; Tsiang, M.; Rajaratnam, B.; Diffenbaugh, N.S. Observed changes in extreme wet and dry spells during the South Asian summer monsoon season. Nat. Clim. Chang. 2014, 4, 456–461. [Google Scholar] [CrossRef]
- Sivakumar, M.V.; Stefanski, R. Climate change in South Asia. In Climate change and food security in South Asia; Springer: New York, NY, USA, 2010; pp. 13–30. [Google Scholar]
- Rajbhandari, R.; Shrestha, A.B.; Nepal, S.; Wahid, S.; Ren, G.-Y. Extreme climate projections over the transboundary Koshi River Basin using a high resolution regional climate model. Adv. Clim. Chang. Res. 2017, 8, 199–211. [Google Scholar] [CrossRef]


| Indices | Definition | Units |
|---|---|---|
| CDD | Maximum number of consecutive dry days with RR < 1 mm | days |
| CWD | Maximum number of consecutive wet days with RR > 1 mm | days |
| RX1 day | Monthly maximum 1-day precipitation | mm |
| R10 | Annual count of days when PRCP ≥ 10 mm | days |
| R20 | Annual count of days when PRCP ≥ 20 mm | days |
| SDII | Annual total precipitation divided by the number of wet days (defined as PRCP ≥ 1.0 mm in the year | mm/day |
| Month | Max (mm) | Min (mm) | Mean (mm) | Standard Deviation |
|---|---|---|---|---|
| Jan. | 80.31 | 0.00 | 10.73 | 13.85 |
| Feb. | 58.80 | 0.00 | 11.72 | 13.17 |
| Mar. | 67.74 | 0.00 | 10.97 | 13.91 |
| Apr. | 122.37 | 0.00 | 25.40 | 23.84 |
| May | 186.54 | 2.62 | 78.80 | 39.57 |
| Jun. | 545.82 | 44.10 | 205.12 | 97.28 |
| Jul. | 715.12 | 109.23 | 343.03 | 127.55 |
| Aug. | 662.97 | 86.91 | 294.70 | 113.83 |
| Sep. | 501.22 | 70.70 | 223.48 | 96.06 |
| Oct. | 330.40 | 0.06 | 71.47 | 69.91 |
| Nov. | 120.10 | 0.00 | 6.87 | 16.96 |
| Dec. | 34.79 | 0.00 | 3.21 | 6.64 |
| Time Scale | Z Statistic | Q (mm/year) |
|---|---|---|
| Jan. | 0.81 | 0.006 |
| Feb. | −0.48 | −0.005 |
| Mar. | −0.27 | −0.003 |
| Apr. | 0.90 | 0.042 |
| May | 0.49 | 0.058 |
| Jun. | −1.73 | −0.380 |
| Jul. | 0.12 | 0.043 |
| Aug. | −1.55 | −0.514 |
| Sep. | −1.15 | −0.337 |
| Oct. | 0.20 | 0.021 |
| Nov. | 0.89 | 0.000 |
| Dec. | 1.67 | 0.000 |
| Annual | −2.53 | −1.880 |
| Monsoon | −2.43 | −0.408 |
Publisher’s Note: MDPI stays neutral with regard to jurisdictional claims in published maps and institutional affiliations. |
© 2021 by the authors. Licensee MDPI, Basel, Switzerland. This article is an open access article distributed under the terms and conditions of the Creative Commons Attribution (CC BY) license (https://creativecommons.org/licenses/by/4.0/).
Share and Cite
Srivastava, P.K.; Pradhan, R.K.; Petropoulos, G.P.; Pandey, V.; Gupta, M.; Yaduvanshi, A.; Wan Jaafar, W.Z.; Mall, R.K.; Sahai, A.K. Long-Term Trend Analysis of Precipitation and Extreme Events over Kosi River Basin in India. Water 2021, 13, 1695. https://doi.org/10.3390/w13121695
Srivastava PK, Pradhan RK, Petropoulos GP, Pandey V, Gupta M, Yaduvanshi A, Wan Jaafar WZ, Mall RK, Sahai AK. Long-Term Trend Analysis of Precipitation and Extreme Events over Kosi River Basin in India. Water. 2021; 13(12):1695. https://doi.org/10.3390/w13121695
Chicago/Turabian StyleSrivastava, Prashant K., Rajani Kumar Pradhan, George P. Petropoulos, Varsha Pandey, Manika Gupta, Aradhana Yaduvanshi, Wan Zurina Wan Jaafar, Rajesh Kumar Mall, and Atul Kumar Sahai. 2021. "Long-Term Trend Analysis of Precipitation and Extreme Events over Kosi River Basin in India" Water 13, no. 12: 1695. https://doi.org/10.3390/w13121695