
Effect of Long-Term Nitrogen and Phosphorus Additions on Understory Plant Nutrients in a Primary Tropical Forest
by

Qinggong Mao
1,2, 
Hao Chen
3,
Cong Wang
4,
Zongqing Pang
1,2,
Jiangming Mo
1,2 and
Xiankai Lu
1,2,* 1
Key Laboratory of Vegetation Restoration and Management of Degraded Ecosystems, Guangdong Provincial Key Laboratory of Applied Botany, South China Botanical Garden, Chinese Academy of Sciences, Guangzhou 510650, China
2
Center of Plant Ecology, Core Botanical Gardens, Chinese Academy of Sciences, Guangzhou 510650, China
3
School of Ecology, Sun Yat-sen University, Guangzhou 510006, China
4
State Key Laboratory of Mycology, Institute of Microbiology, Chinese Academy of Sciences, Beijing 100101, China
*
Author to whom correspondence should be addressed.
Forests 2021, 12(6), 803; https://doi.org/10.3390/f12060803
Submission received: 7 May 2021
/
Revised: 15 June 2021
/
Accepted: 15 June 2021
/
Published: 18 June 2021
(This article belongs to the Special Issue Responses of Forest Ecosystems to Nitrogen Deposition)
Abstract
:Humid tropical forests are commonly characterized as N-rich but P-deficient. Increased N deposition may drive N saturation and aggravate P limitation in tropical forests. Thus, P addition is proposed to mitigate the negative effects of N deposition by stimulating N cycling. However, little is known regarding the effect of altered N and P supply on the nutrient status of understory plants in tropical forests, which is critical for predicting the consequences of disturbed nutrient cycles. We assessed the responses of N concentration, P concentration, and N:P ratios of seven understory species to N and P addition in an 8-year fertilization experiment in a primary forest in south China. The results showed that N addition had no effect on plant N concentration, P concentration, and N:P ratios for most species. In contrast, P addition significantly increased P concentration, and decreased N:P ratios but had no effect on plant N concentration. The magnitude of P concentration responses to P addition largely depended on the types of organs and species. The increased P was more concentrated in the fine roots and branches than in the leaves. The gymnospermous liana Gnetum montanum Markgr. had particularly lower foliar N: P (~9.8) and was much more responsive to P addition than the other species studied. These results indicate that most plants are saturated in N but have great potential to restore P in primary tropical forests. N deposition does not necessarily aggravate plant P deficiency, and P addition does not increase the retention of deposited N by increasing the N concentration. In the long term, P inputs may alter the community composition in tropical forests owing to species-specific responses.
1. Introduction
Humid tropical forests support the main organic carbon pool and harbor diverse species in terrestrial ecosystems [1]. These tropical forests are commonly rich in N but are relatively poor in P availability because of the substantial biological N fixation and P leaching loss during pedogenesis [2]. However, global N and P cycling has changed because of the increased N deposition and use of P fertilizers in the last several decades [3,4]. Because nutrient supply controls plant nutrients, nutrient dynamics can influence the structure and function of ecosystems by changing community composition and productivity [5,6]. Considering that N and P are essential nutrients for plants, studying plant N and P status under disturbed nutrient cycling is critically important.
The effects of N input on plant N status have been widely studied. Generally, it is believed that N inputs increase plant N concentration ([N]) in N-limited ecosystems but have a minor effect on plant [N] in N-rich ecosystems [7]. Although N deposition rate has been reduced in many areas, it is projected to increase in the tropics with increasing population and economy [3]. In particular, a large proportion of biodiversity hotspots in humid tropical forest regions have been included in areas affected by N deposition [8]. In N-rich tropical forests, N addition often has no effect on plant [N] [9,10] and causes further N saturation, which is indicated by significant increases in soil inorganic N concentration, N2O emission, and nitrate (NO3−) leaching [11,12]. N inputs may also lead to an imbalance of N and P, and affect plant P status due to the tight coupling of N and P.
However, the effects of N input on plant P are contradictory. N inputs are generally considered to aggravate ecosystem P limitations, particularly in tropical forests [13]. Two mechanisms have been proposed. First, N-induced soil acidification may enhance the immobilization of phosphate with iron or aluminum oxide in old soils, thus, decreasing P availability [13]. Second, N addition may stimulate plant growth and increase the P demand of microorganisms and plants. Increasing evidence shows that N addition increases phosphatase activities in soils and rhizospheres in tropical forests, which is considered a sign of increased P limitation [12,14]. However, the increased phosphatase activity with N addition is also supposed to alleviate P limitation by investing additional N in the synthesis of more phosphatases [15,16], as N is the main component (8–32% N) of the phosphatases [17]. In addition, plants may also adapt to P deficiency caused by N deposition via multiple mechanisms, such as increasing foliar P uptake and resorption [18,19]. To date, whether N addition induces P limitation in tropical forests remains unresolved.
Phosphorus enrichment due to P fertilization alters the cycling of P in tropical forests. P addition commonly increases foliar P concentration ([P]) and decreases plant N:P ratio [20,21,22]. Furthermore, studies have shown large interspecific variation of plant [P] responses to P addition, but few explanations are presented. For example, Ostertag [21] reported 1.7–5.1 times higher foliar [P] after P addition in Hawaiian forests. Mayor et al. [9] found that P addition increased foliar [P] in three eudicot tree species but had no effect on the palm species in Panama. There are also debates on the difference in P accumulation after P fertilization between shade-tolerant and light-demanding species [20,23]. Therefore, the interspecific variation in responses may be attributed to different taxonomic and functional groups. In contrast, emerging evidence shows that stems or roots are more sensitive than leaves to P fertilization [24,25]. If more P is stored in non-photosynthetic organs, using leaf nutrients and stoichiometry to evaluate P limitation may not reveal the real P status. Therefore, additional tests are required to address these uncertainties, which are fundamental to predict the acclimation of tropical forest ecosystems under elevated P supply.
The effects of P addition may increase plant N levels and alleviate N saturation. For example, the addition of P was found to increase soil microbial biomass [26], decrease NO3− leaching and N2O emission [12], and mitigate the inhibition of N deposition on CH4 uptake in tropical forests [27,28]. Therefore, P addition has been proposed as a potential management practice to improve N-induced negative effects in tropical forests [12]. Commonly held views suggest that increased foliar [P] would be accompanied by elevated foliar [N] due to the tight stoichiometric coupling of the two elements. First, alleviation of P limitation can promote plant growth and productivity and stimulate N demand. Second, a large proportion of P compounds in plants also contain N [21], such as nucleic acids; thus, increased plant [P] is expected to increase [N] as well. Third, increased soil P availability may increase plant N acquisition by increasing the rate of nitrate reduction, because the activity of nitrate reductase is controlled by phosphorylation [29]. Nevertheless, how P addition affects plant [N] is rarely reported in N-rich tropical forests; it remains inconclusive whether P addition promotes plant N uptake.
In this study, we aimed to explore how long-term N and P additions affect plant [N], [P], and the N:P ratio by using an in-situ N and P fertilization experiment in an N-rich primary tropical forest in Southern China. The understory plants were selected because they are critical in tree recruitment and contribute significantly to plant diversity in forests [30,31]. We attempted to test the following hypotheses: (I) Long-term N addition would cause no change in plant [N], because the forest has been rich in N. (II) N addition would decrease plant [P] owing to N-induced acidification and decreased P supply. (III) Long-term P addition would greatly increase plant [P], and the responses of plant nutrients to P addition would vary in different species and organs (e.g., leaves, branches, and fine roots). (IV) Phosphorus addition would increase plant [N], considering that increased P availability may facilitate plant N demand and acquisition.
2. Methods
2.1. Study Site
This study was conducted in the Dinghushan Biological Reserve (DHSBR) in South China (23°10′12′′ N, 112°32′42′′ E). The region is characterized by a monsoon climate with a mean annual temperature of 21 °C and a mean annual precipitation of 1927 mm [32]. The soil in the forest is lateritic red earth (Oxisol, according to the U.S. soil taxonomy system), which developed from a sandstone regolith and extends to a depth of >60 cm [33]. The reserve has experienced high N deposition (>30 kg N ha−1 yr−1) since the 1990s [34]. In the studied forest, the N leaching rate was as high as its inputs via rainfall, indicating the saturation status in N [11]. In contrast, the soil’s available [P] (extracted by Bray I solution) was low (~4 mg P kg−1) [35].
The experiment was established in a monsoon evergreen broadleaf forest (250–300 m above sea level), which had been protected from human disturbance for more than 400 years by a local temple and monks [36]. The aboveground community comprises canopy, subcanopy, and understory plants. Dominant species in the canopy and sub-canopy layers include Castanopsis chinensis Hance, Machilus chinensis Hemsl, Schima superba Gardn. et Champ, Cryptocarya chinensis Hemsl, and Syzygium rehderianum Merr. et Perry (see details of the tree structure of the studied forest in Liu et al. [26]). Tree seedlings, shrubs, and herbaceous plants constitute the understory layer, accounting for a high species richness. The understory layer is in deep shade, as canopy closure is commonly >90% without obvious forest gaps [31].
2.2. Experimental Design
A full-factorial experimental design was used, completely randomized with two main factors: N effects (two levels: without N addition and with N addition of 15 g N m−2 yr−1) and P effects (two levels: without P addition and with P addition of 15 g P m−2 yr−1). Accordingly, there were four (2 × 2) treatments: control, N addition (15 g N m−2 yr−1), P addition (15 g P m−2 yr−1), and NP addition (15 g N m−2 yr−1 plus 15 g P m−2 yr−1), each with five replicates, thus, constituting a total of 20 plots. Each plot was 5 × 5 m and was surrounded by a 5–10 m wide buffer strip to avoid interference. All plots were laid out randomly on a slope with minor adjustment of position to avoid top-down runoff (Figure S1). The N and P addition experiment was established in 2007. N (as NH4NO3) and P (as NaH2PO4) were added to the forest floor every other month from February 2007 to July 2015. The fertilizers were weighed and dissolved in 5 L of water for each plot and sprayed on the forest floor using a backpack sprayer (equivalent to 0.5 mm rainfall each time), and the control plots received an equivalent volume of pure water. The N addition level was selected because inorganic N has high mobility and the forest is N-rich. We used a relatively high load of N addition over the year to sustain a significantly increased soil N availability. Similarly, high loads of P additions were used to ensure a significant increase in soil P availability, given that the input phosphate is readily immobilized by iron or aluminum oxides in tropical old soils (pH < 4) and is inaccessible to plants [2,35,37]. Soil colloids need to be saturated to test plant responses to elevated P availability.
2.3. Sampling and Analysis of Plants
We identified seven species that were co-occurring in all plots (Table 1), including Ardisia lindleyana D. Dietrich. (ALI), Carallia brachiata Merr. (CBR), Calamus rhabdocladus Burret (CRH), Cryptocarya chinensis Hemsl (CCH), Cryptocarya concinna Hance (CCO), Aidia canthioides Masam (ACA), and Gnetum montanum Markgr. (GMO). They displayed a range of functional groups, including tree seedlings, shrubs, palm, and gymnosperm liana. Plant samples were collected in July 2015 (in the eighth year of experimental treatment). Fully matured leaves were sampled from two to four individuals (height < 2 m) for all seven species in each plot, while the connected branches were collected for tree seedling of four species (ACA, CBR, CCH and CCO) because of their availability. Five mineral soil cores (10 cm in depth) per plot were sampled using an auger (2.5 cm in diameter), combined into a composite sample, and sieved through a 2 mm mesh to remove stones and roots. Soil pH was measured with soil and deionized water (1:2.5 ratio) using a glass electrode. Soil available N was extracted by 2 mol L−1 KCl and measured with a UV-8000 spectrophotometer (Metash Instruments Corp., Shanghai, China). Soil available P was extracted by 0.03 mol L−1 ammonium fluoride and 0.025 mol L−1 hydrochloric acid and then analyzed colorimetrically [38]. To evaluate the response of fine roots N and P to long-term fertilization, we collected enough fine root samples within the plot scale (0–10 cm soil layer). The live fine roots (defined as <2 mm in diameter) were sorted and washed in pure water. Finally, soil and all plant tissues, including leaves, branches, and fine root samples, were oven-dried for 72 h at 65 °C and ground to a fine and homogeneous powder. The powder was prepared to analyze soil organic matter (SOM), soil total [N], and plant [N] by using an elemental analyzer (Vario ISOTOPE cube, Elementar, Hanau, Germany) and to analyze soil [P] and plant [P] using inductively coupled plasma (ICP-ES, Optima 2000, Perkin Elmer, Norwalk, CT, USA) after nitric acid and perchloric acid dissolution.
2.4. Statistical Analyses
We presented all [N], [P], and N:P ratios on a mass basis. One-way analysis of variance (ANOVA) was employed to examine the effect of differences in treatments (control, +N, +P, and +NP) on soil properties. Tukey’s honestly significant difference test was used to compare the differences between treatments. Two-way ANOVA was performed to test the independent effect of N or P addition (the fixed factors) treatments and their interaction effect on plant [N], [P], and N:P ratios (the dependent variable). The ANOVA model included the main effects of N and P and the N × P interaction. General linear mixed effect models were used to evaluate the N or P concentration of three organs (leaf, branch, and fine root), with species as the random factor. Data were tested for normality and homogeneity, and logarithmic transformation was applied if the data failed to meet assumptions of the selected model. All analyses were performed using SPSS 19.0 for Windows (SPSS, Chicago, IL, USA). Statistically significant differences were set at p-values ≤ 0.05. Mean values ± standard errors of the mean are reported in the text.
3. Results
3.1. Responses of Soil Properties to N or P Addition
After 8 years of continuous fertilization, there was a mild but not significant increase in soil extractable N and a decrease in soil pH in N addition plots compared with those in control plots, but there were no responses for soil total N and P, extractable P, and SOM (Table 2). Long-term P addition significantly increased soil total P and extractable P to an abundant level (0.6 g kg−1 and 111.7 mg kg−1, respectively) but did not significantly change other soil properties (Table 2). Both N and P addition greatly increased soil total P, extractable P, and soil extractable N, with a decreasing trend in soil pH (Table 2).
3.2. Effect of N and P Addition on the Nutrient Status of Understory Vegetation
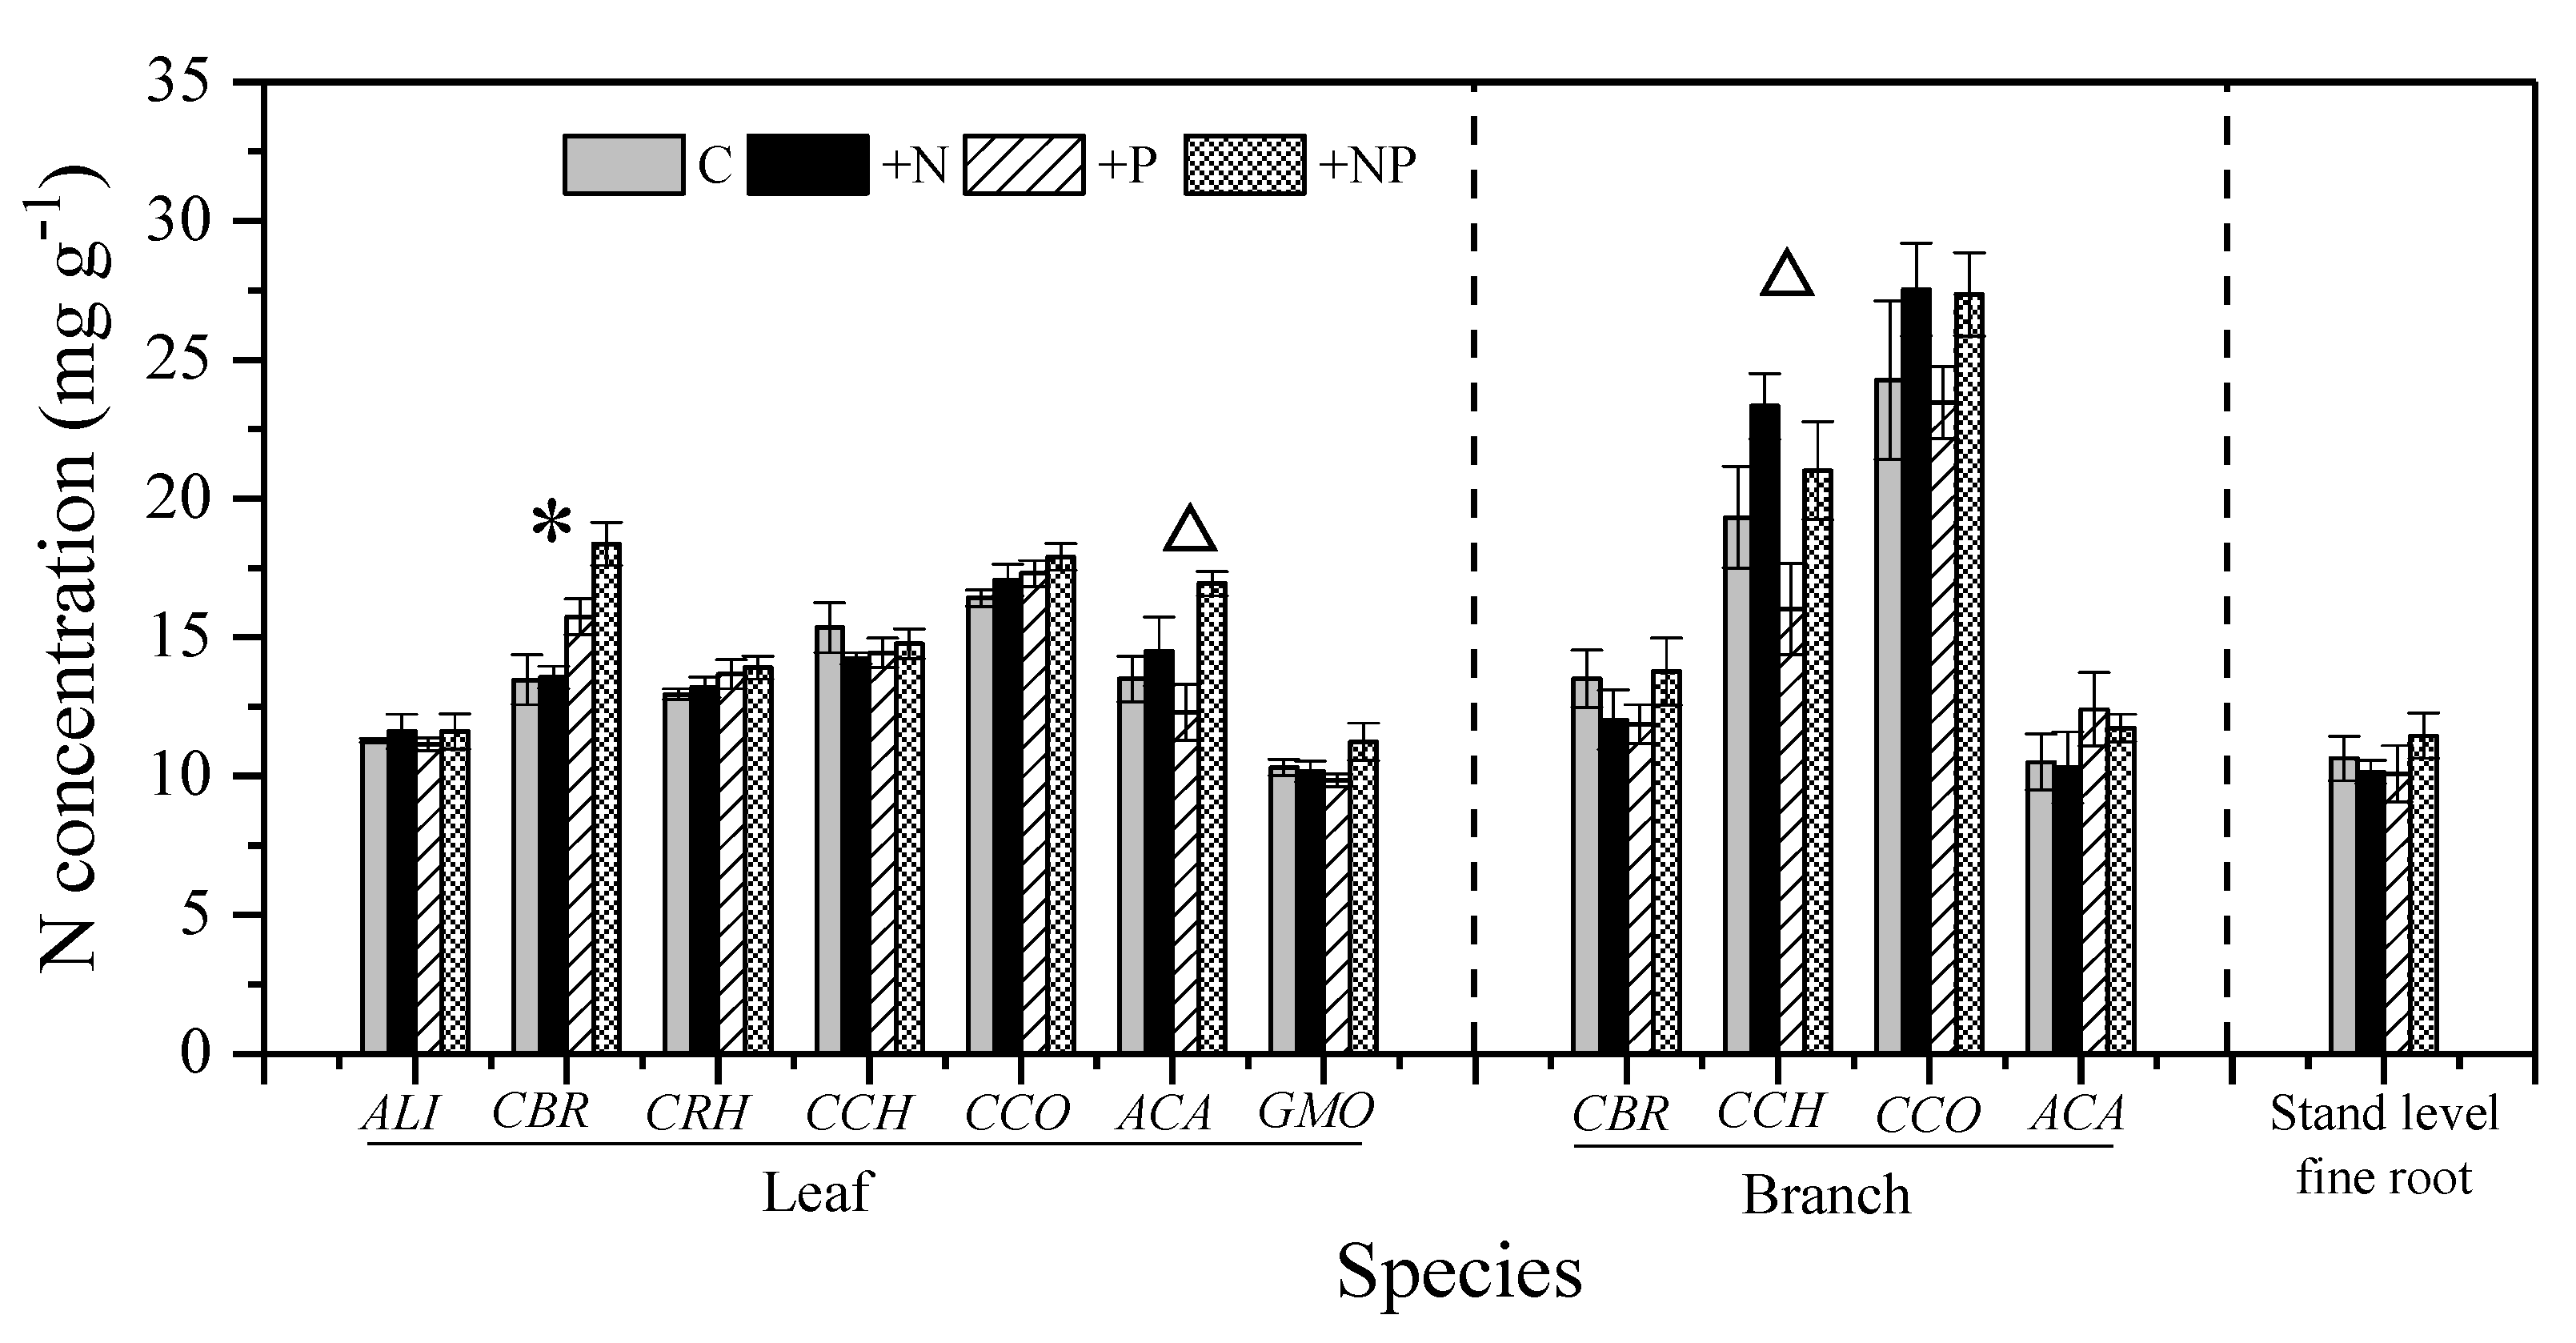
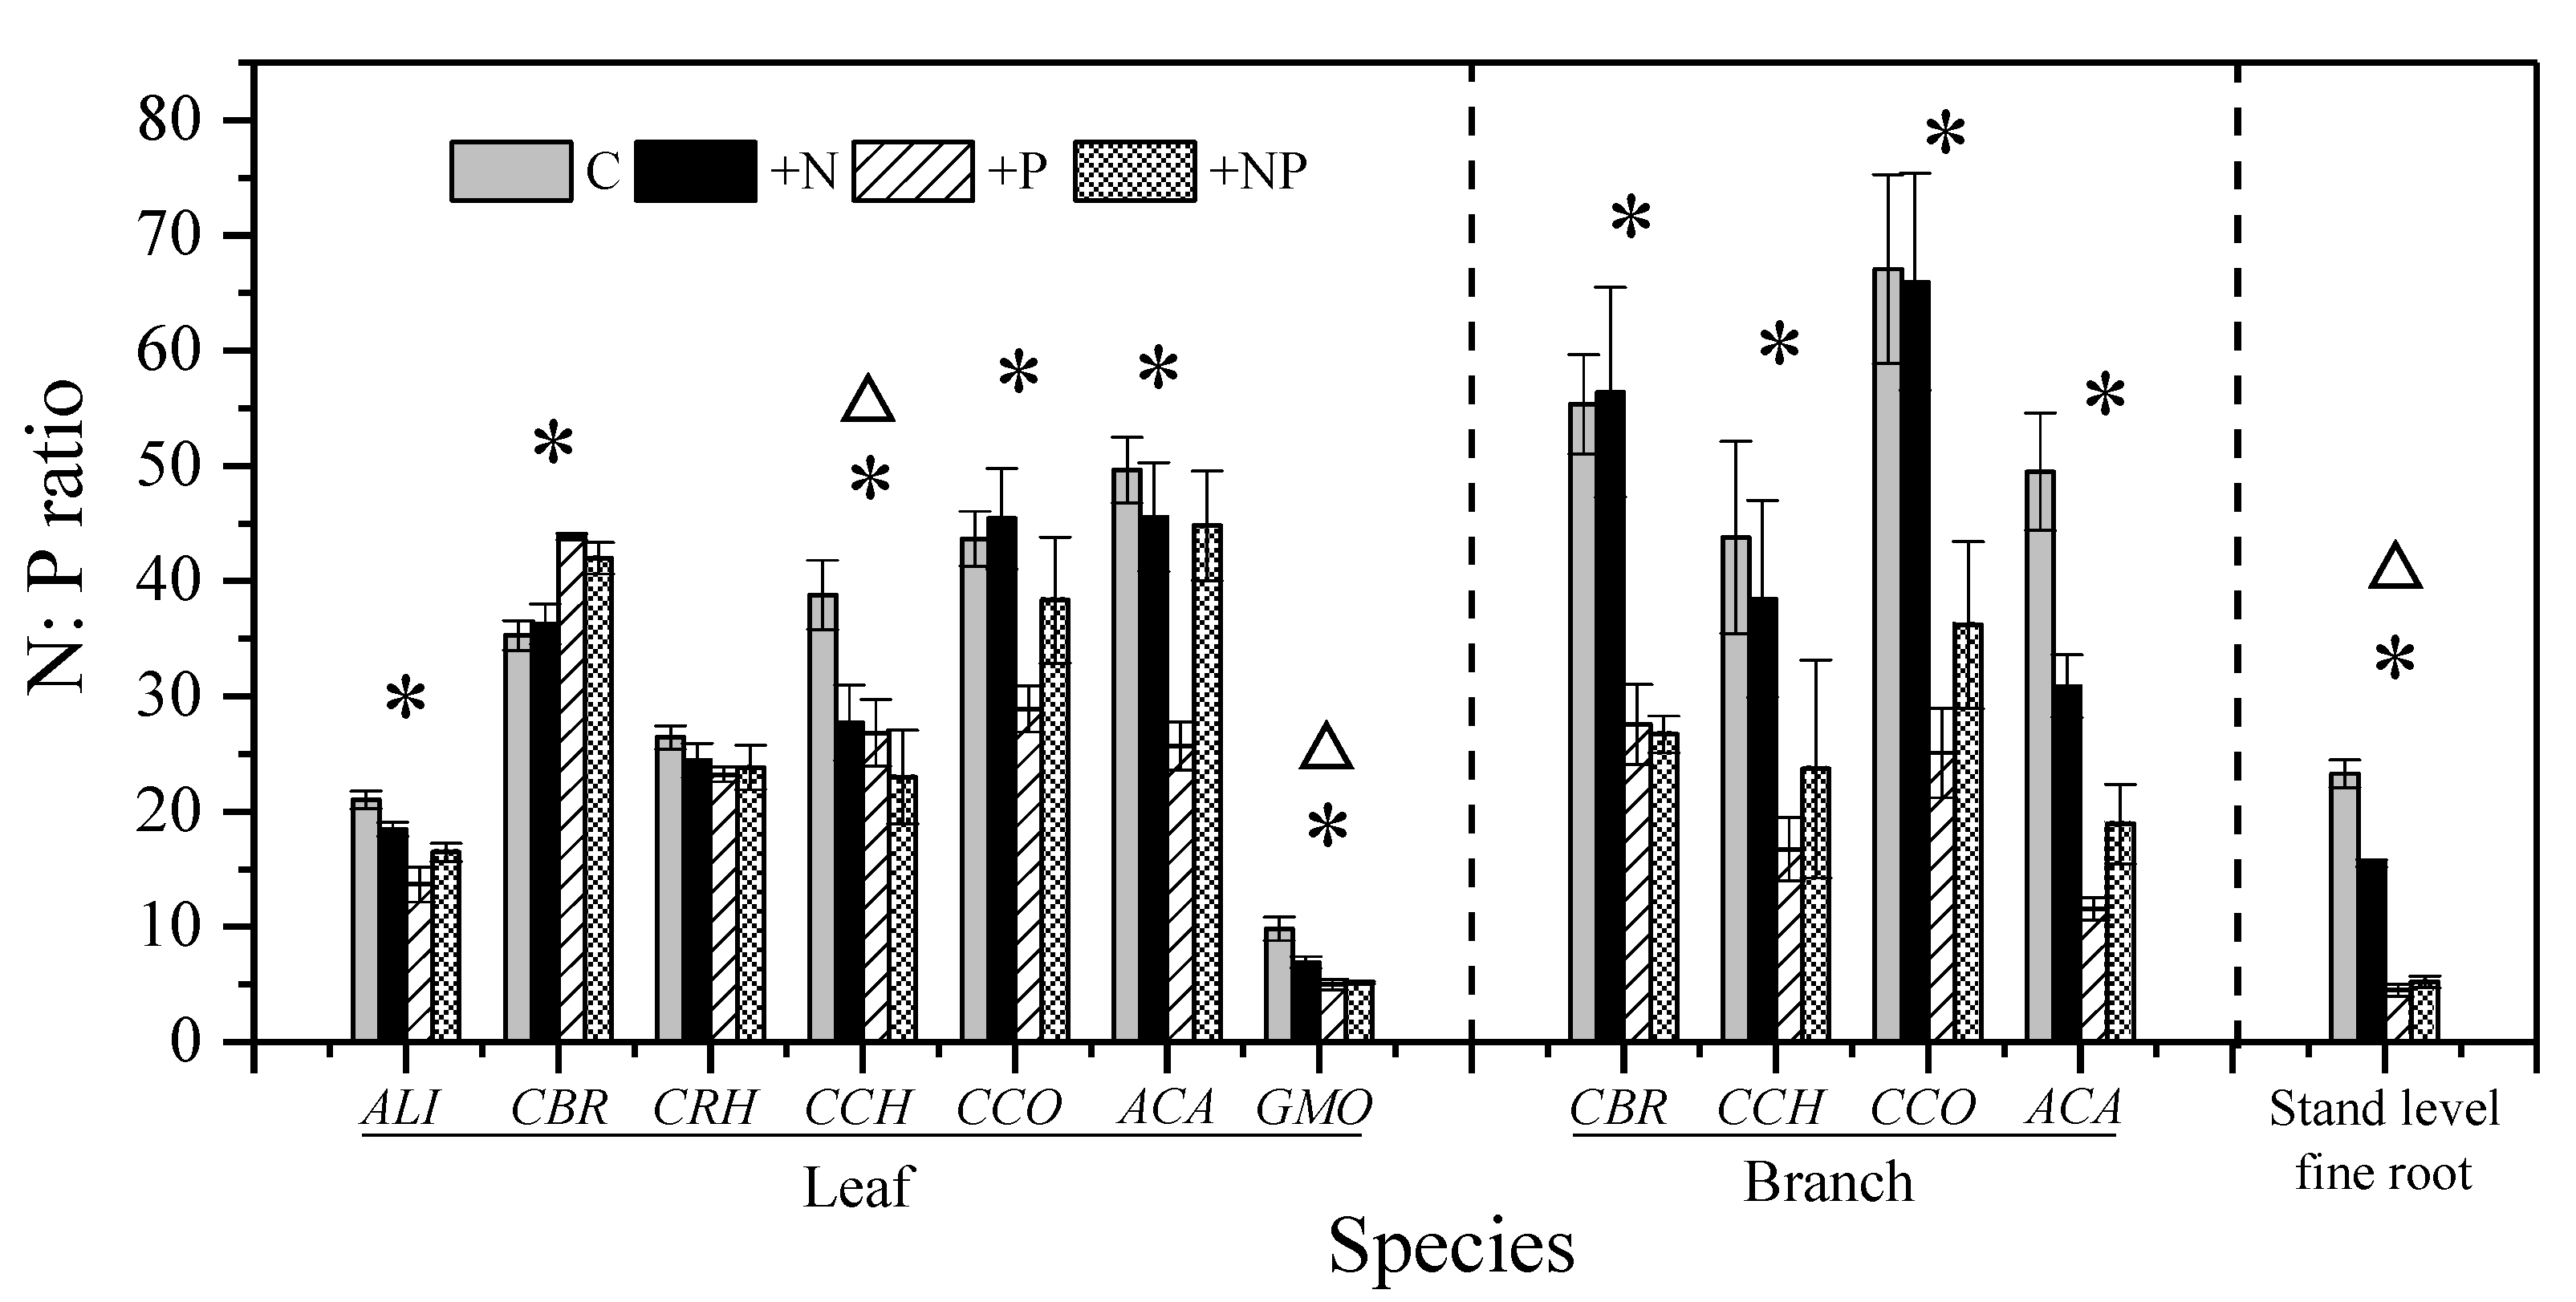
Foliar [N] and branch [N] averaged 13.3 mg g−1 and 16.9 mg g−1, respectively. The species with the highest foliar [N] (CCO, 16.4 mg g−1) possessed the highest branch [N] (CCO, 24.3 mg g−1). Stand-level fine root [N] averaged 10.6 mg g−1. Overall, plant [N] was not different among the organs (leaves, branches, and fine roots) (Figure 1). The mean foliar [P] value was 0.51 mg g−1, with significant differences among species (p < 0.001) (Figure 2). The gymnospermous liana GMO had an exceptionally high foliar [P] (1.09 mg g−1). The mean values of branch [P] and fine root [P] were 0.35 mg g−1 and 0.46 mg g−1, respectively. No significant difference in [P] observed among the organs (Figure S2). Foliar N:P ratio ranged from 9.8 to 49.7, with a mean value of 32.1. The N:P ratios of branches and fine roots averaged 53.9 and 23.3, respectively (Figure S2).
Nitrogen addition did not increase the foliar [N] except for that of ACA, with a 7.7% increase (p < 0.01, Table S1 and Figure 1). Similarly, N had no effect on branches [N] or fine roots [N] (Table S1 and Figure 1). Moreover, N addition did not change the [P] and N:P ratio, with a few exceptions (Table S1). For example, N addition decreased the foliar N:P ratio of CCH (p = 0.04) and GMO (p = 0.04) and the fine roots N:P ratio (p < 0.001) (Table S1 and Figure 3).
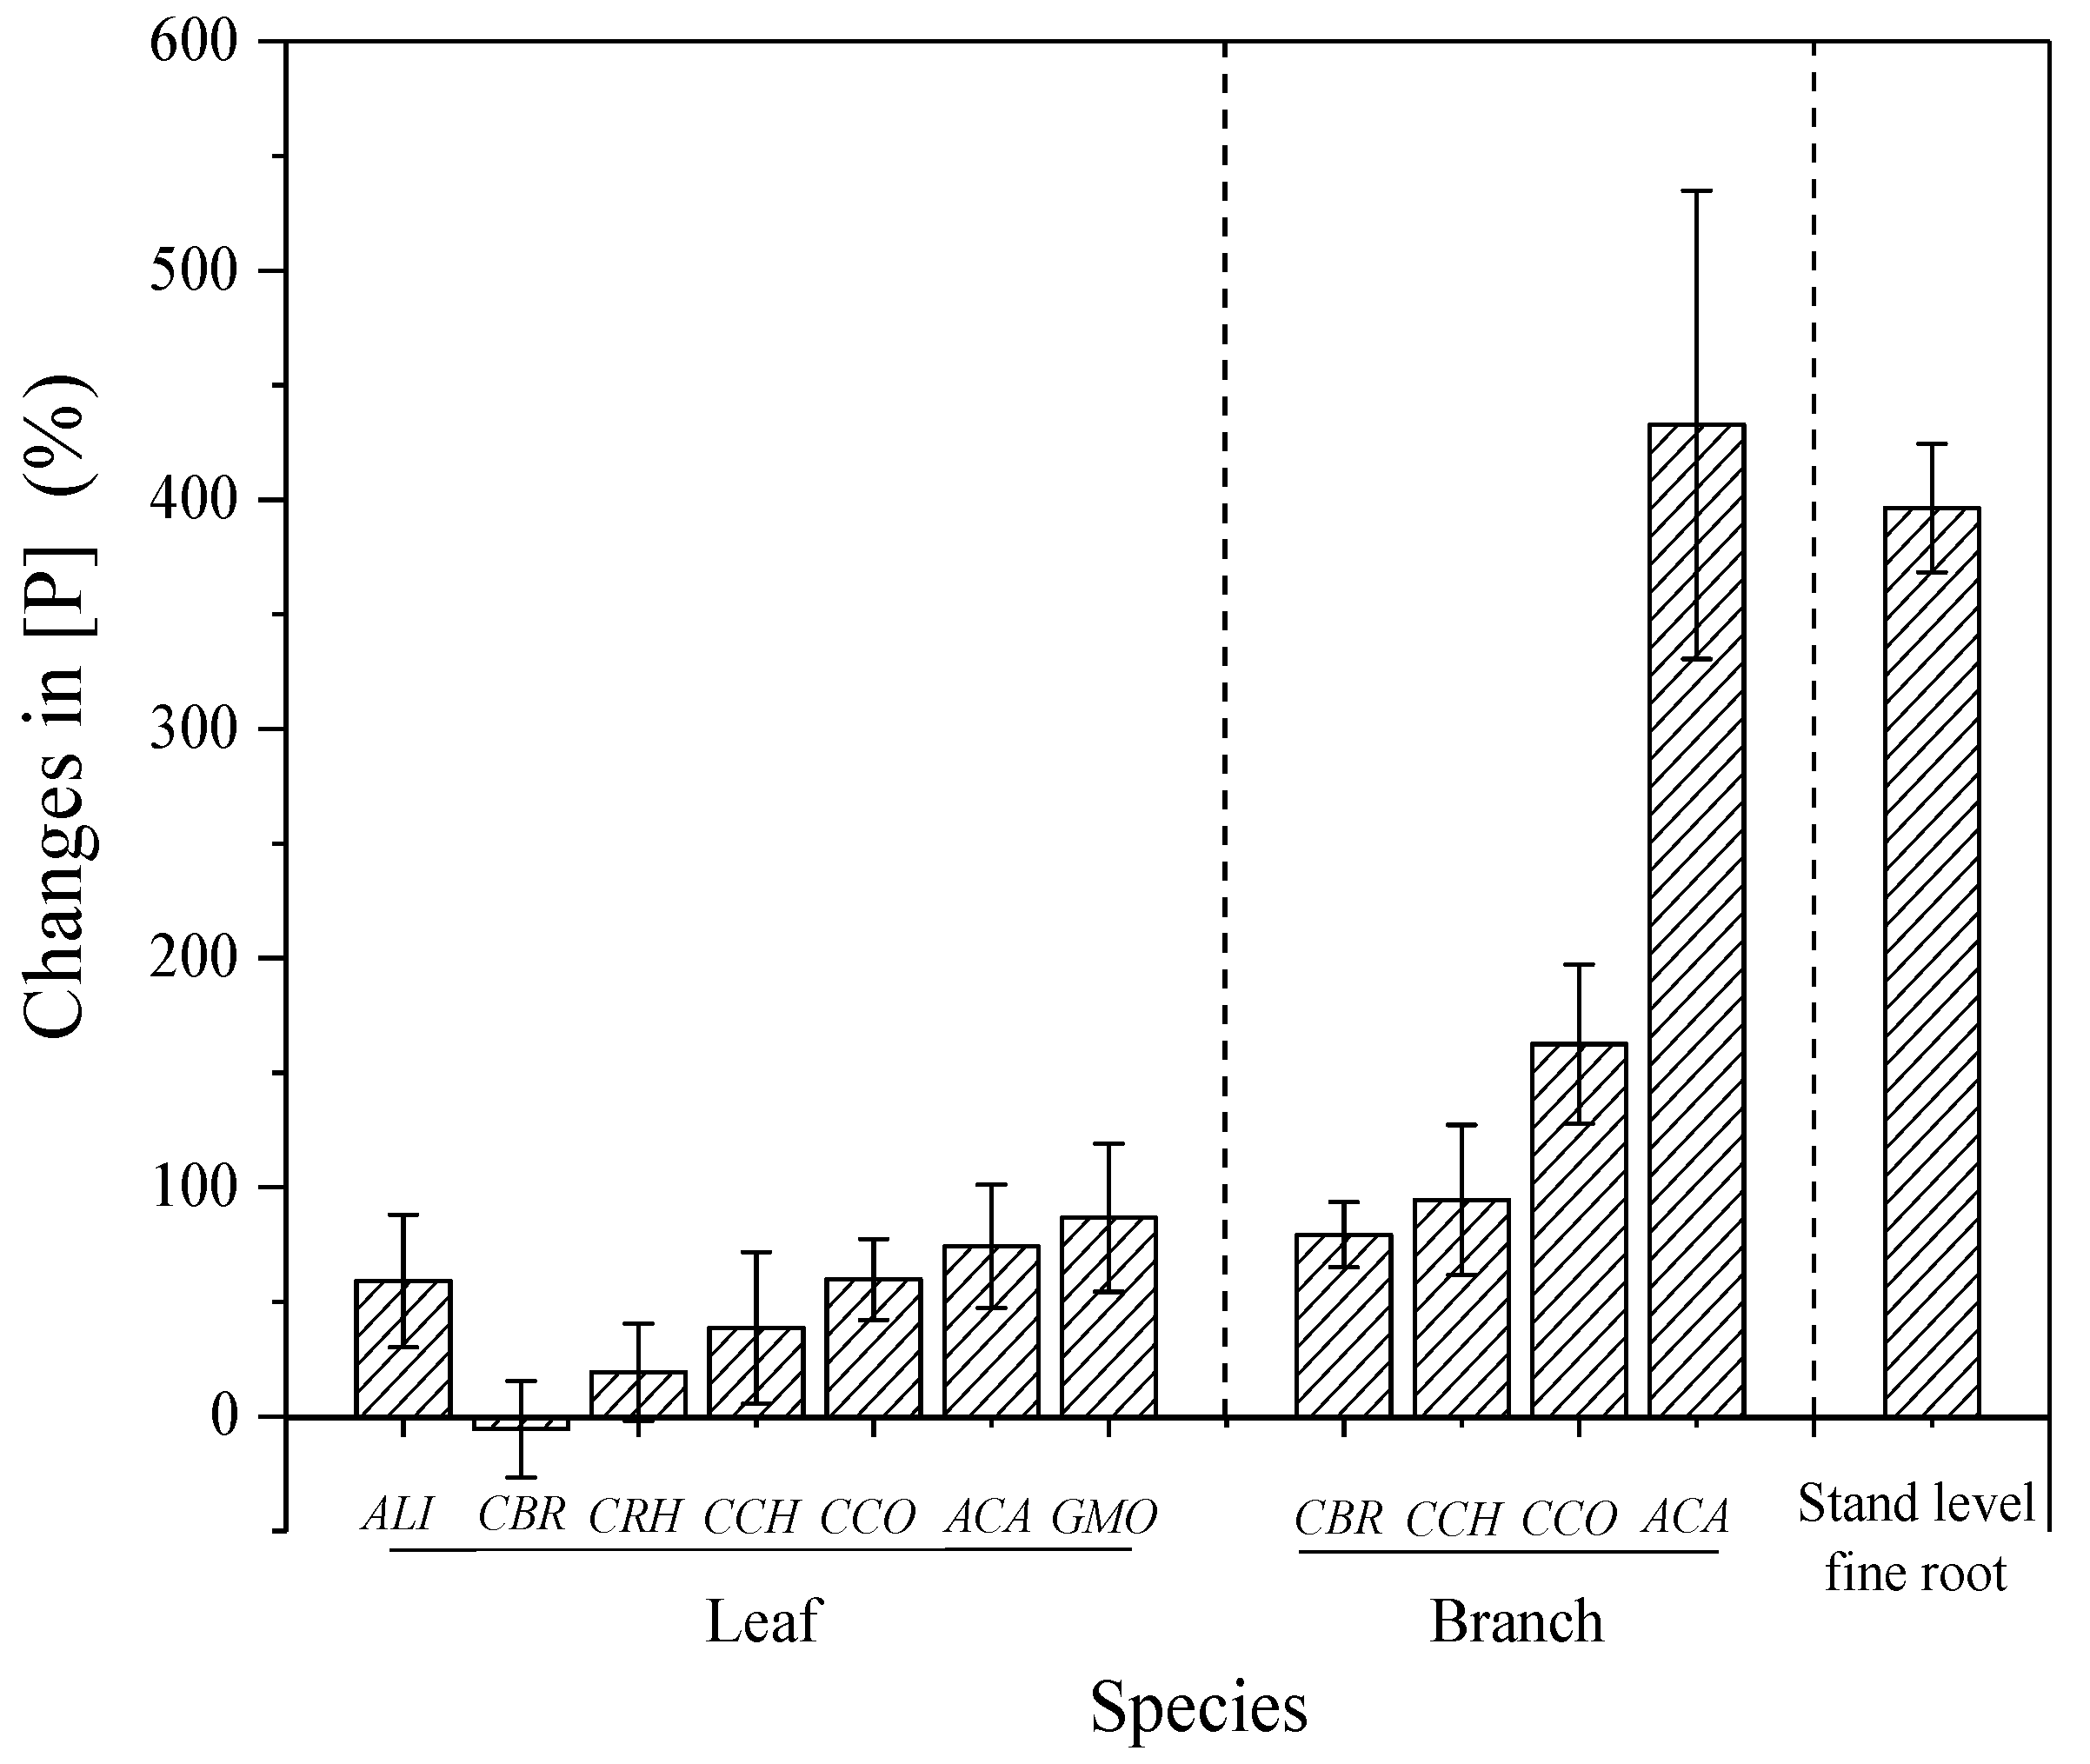
Phosphorus addition significantly increased foliar [P], branches [P], and fine roots [P] by 47%, 192%, and 396%, respectively (Figure 2). In addition, the responses of foliar [P] to P addition varied significantly among co-occurring species and their organs (Figure 4). For example, the foliar [P] of CBR was not changed by P addition, while its branch [P] increased by 79%. In comparison, the increases in foliar [P] and branch [P] of ACA were as high as 74% and 432%, respectively. Therefore, branch [P] and leaf [P] increased remarkably with P addition for all species (Figure S3). P addition showed no effect on foliar [N], except in CBR (p < 0.001), which show a 13.7% increase (Figure 1). P addition also had no effect on branches [N] and fine roots [N] (Table S1). P addition significantly decreased the foliar N:P ratio in all species, except in CBR (Table S1). After P addition, the foliar N:P ratio was still >20 in five of the seven species (Figure 3). In addition, significant interaction of N and P addition was only observed in plant [P] of a few species (p < 0.05) and fine root N:P ratio (p < 0.01; Table S1).
4. Discussion
4.1. Effects of N Addition
Consistent with the first hypothesis, we found that long-term N addition did not increase the tissue [N] and N:P ratio in most species. Similar results have been reported for many other lowland tropical forests [9,24]. Several reasons may account for the mute responses in the present study. First, plants adapt to N-rich environments and have no selection pressure for additional N storage. Generally, N is abundant and open cycled in humid tropical forests because of the vigorous biological N fixation [39]. The amount of input N was found to equally leak out this N-rich forest ecosystems [40]. Second, the studied forest may be more limited by other resources such as K, Ca, and Mg, which hinder additional N demand. A study in a Panama forest showed that tree seedling growth is stimulated by K addition rather than N addition [41]. Third, no responses of plant N may be a strategy for avoiding herbivory risk, given that herbivory is generally N-limited [42]. Increased herbivory risk after N input may constrain N accumulation.
Contrary to hypothesis II, we did not find a decrease in plant [P] under long-term N addition, and even CBR showed increased foliar [P] (Figure 2 and Table S1). Traditionally, it has been suggested that elevated N input aggravates P limitation by acidifying soils or stimulating plant growth [28,43]. However, the evidence supporting these points largely derives from the increase in phosphatase activity caused by N input. Indeed, increased phosphatase activity after N addition was found at our site and in many other tropical forests [14,44,45]. However, phosphatase activity is an indirect parameter that only reflects the enhanced capability of P acquisition; it cannot demonstrate that plants are P limited. Our results suggest that N addition does not decrease plant [P], or that N addition does not aggravate plant P limitation. Conversely, N inputs mitigate P limitation for a few species according to the slight decrease in N:P ratios (Figure 3). This may be because N addition does not stimulate plant growth [31], and dilute plant [P], while these may have compensation mechanisms, such as enhanced phosphatase activity and leaf resorption, to adjust to the decreased P supply [15,16].
4.2. Effects of P Addition
The increased soil P availability causes significant increases in plant [P], and the magnitude of plant [P] responses varies among different species and organs, supporting hypothesis III. Increased foliar [P] under P addition has been frequently reported in many studies [9,24], whereas the present study may provide an extreme example under high loads of P addition. This is because P addition did not stimulate photosynthesis and growth of the studied plants (unpublished data) and of plants in some other tropical forests [46,47]. The remarkable increases in plant [P] could be attributed to the storage function. Indeed, we found that the foliar N:P ratio was above 20 (P limitation) in half of the included species even after long-term P addition (Figure 2), indicating a strong impetus for P acquisition. This may be because the large amount of P storage is beneficial when considering the uncertainty in P supply or confers advantages to understory plant to help them grow rapidly when forest gaps occur.
Although studies have shown the species-specific responses of plant [P] and disproportionate P storage in different organs following P addition, explanations are rarely provided. The species-specific responses may be attributed to their phylogenetic constraints. It is common for a community to be constituted by species with different biogeochemical niches, which are closely related to their shared ancestry [48]. Two examples in the present study support this point. We found that CCH and CCO were quite similar in foliar nutrient concentrations and responses to P addition (Figure 4), as both belong to the same genus (Cryptocarya). In contrast, we found that GMO was distinct from other species in its elemental composition and showed notably high foliar [P] but the lowest foliar [N]; thus, the largest increase in foliar [P] was observed after P addition. This seems reasonable because among studied species, GMO is the only gymnosperm (Table 1). Fine roots and branches were much more sensitive to P addition than leaves (Figure 4), suggesting the main function of P storage in non-photosynthetic organs. These results are consistent with those of other studies. One explanation is that the relatively lower increase in foliar [P] may protect leaves from negative effects (such as toxicity level or increased herbivory) by isolating excess P away from the leaves to other organs [49]. Therefore, branches and roots may serve as nutrient reservoirs that support optimal N:P balance in the leaves, suggesting the capability to regulate P distribution within the whole plant.
Contrary to hypothesis IV, P addition had no effect on foliar [N] for most of the studied species (Figure 1 and Table S1). Commonly held views are that increased foliar [P] would be accompanied by elevated foliar [N] owing to the tight stoichiometric coupling of two elements. A large proportion of P compounds in plants also contain N, such as nucleic acids. However, our results suggest that the acquisition of plant N and P may be independent processes. The data of only one species, CBR, with the lowest foliar [P], seemed to support the view that increased foliar [P] accompanies elevated foliar [N]. One plausible explanation is that the forest has already been N-saturated, and plant [N] has been at the optimal level. Therefore, no factors, such as P addition, could further elevated plant [N], as a high load of N addition has no effect on plant [N], discussed above. Another reason may be that plants of tropical forests are P limited, based on their high foliar N:P ratio [50]. P addition alleviates the inherent demand of P by means of storage. In brief, our results suggest that P addition may have little effect on N retention by increasing plant uptake in N-rich tropical forests.
5. Conclusions
We conclude with the following main findings from the long-term N and P addition experiment in an N-rich tropical forest: (1) N addition has no effect on plant [N] and does not alter plant [P], suggesting that plants have already been N saturated and that further N deposition would not aggravate plant P limitation. (2) P addition increases plant [P], whereas the magnitude of responses varies in different species and organs. Increased P storage occurs in non-photosynthetic organs. P addition also has no effect on plant [N], suggesting that plant P storage would not keep pace with the increased uptake of N. Our findings provide new insights into plant nutrient responses under disturbed nutrient cycling and indicate that P inputs, as practical management to mitigate N-induced negative effects, may have profound effects on plant communities in tropical forests.
Supplementary Materials
The following are available online at https://www.mdpi.com/article/10.3390/f12060803/s1, Figure S1: Layout of plots and treatments in our study forest, Figure S2: The N concentration, P concentration and N: P ratio in different organs in blank control, Figure S3: Effect of N and/or P addition on ratios of branch to leaf in N and P concentration of different species, Table S1: The p-value of two-way ANOVA in effect of N and P addition on N concentration, P concentration.
Author Contributions
Writing—original draft preparation, Q.M.; writing—review and editing, X.L., H.C., C.W., Z.P. and J.M. All authors have read and agreed to the published version of the manuscript.
Funding
Financial support was provided by the National Natural Science Foundation of China (No. 31700422, 41731176, 41922056, 31872691), Guangdong Basic and Applied Basic Research Foundation (2019A1515011642).
Data Availability Statement
The data presented in this study are available on request from the corresponding author.
Acknowledgments
We wish to thank Shaoming Cai and Lijie Deng for their skillful assistance in field work, Hui Mo, Xiaoying You and Xiaoping Pan for their assistance in laboratory work. We would like to thank the two anonymous reviewers and the editor for their insightful comments.
Conflicts of Interest
The authors declare no conflict of interest.
References
- Raven, P.H.; Gereau, R.E.; Phillipson, P.B.; Chatelain, C.; Jenkins, C.N.; Ulloa, C.U. The distribution of biodiversity richness in the tropics. Sci. Adv. 2020, 6, eabc6228. [Google Scholar] [CrossRef]
- Vitousek, P.; Porder, S.; Houlton, B.; Chadwick, O. Terrestrial phosphorus limitation: Mechanisms, implications, and nitrogen- phosphorous interactions. Ecol. Appl. 2010, 20, 10. [Google Scholar] [CrossRef] [Green Version]
- Galloway, J.N.; Dentener, F.J.; Capone, D.G.; Boyer, E.W.; Howarth, R.W.; Seitzinger, S.P.; Asner, G.P.; Cleveland, C.C.; Green, P.A.; Holland, E.A.; et al. Nitrogen Cycles: Past, Present, and Future. Biogeochemistry 2004, 70, 153–226. [Google Scholar] [CrossRef]
- Yuan, Z.; Jiang, S.; Sheng, H.; Liu, X.; Hua, H.; Liu, X.; Zhang, Y. Human perturbation of the global phosphorus cycle: Changes and consequences. Environ. Sci. Technol. 2018, 52, 2438–2450. [Google Scholar] [CrossRef]
- Swaine, M.D. Rainfall and Soil Fertility as Factors Limiting Forest Species Distributions in Ghana. J. Ecol. 1996, 84, 419. [Google Scholar] [CrossRef]
- Zalamea, P.; Turner, B.L.; Winter, K.; Jones, F.A.; Sarmiento, C.; Dalling, J.W. Seedling growth responses to phosphorus reflect adult distribution patterns of tropical trees. New Phytol. 2016, 212, 400–408. [Google Scholar] [CrossRef] [PubMed]
- Aber, J.; McDowell, W.; Nadelhoffer, K.; Magill, A.; Berntson, G.; Kamakea, M.; McNulty, S.; Currie, W.; Rustad, L.; Fernandez, I. Nitrogen Saturation in Temperate Forest Ecosystems. BioScience 1998, 48, 921–934. [Google Scholar] [CrossRef]
- Bleeker, A.; Hicks, W.; Dentener, F.; Galloway, J.; Erisman, J. N deposition as a threat to the World’s protected areas under the Convention on Biological Diversity. Environ. Pollut. 2011, 159, 2280–2288. [Google Scholar] [CrossRef]
- Mayor, J.R.; Wright, S.J.; Turner, B.L. Species-specific responses of foliar nutrients to long-term nitrogen and phosphorus additions in a lowland tropical forest. J. Ecol. 2013, 102, 36–44. [Google Scholar] [CrossRef]
- Mao, Q.; Lu, X.; Mo, H.; Gundersen, P.; Mo, J. Effects of simulated N deposition on foliar nutrient status, N metabolism and photosynthetic capacity of three dominant understory plant species in a mature tropical forest. Sci. Total Environ. 2018, 610-611, 555–562. [Google Scholar] [CrossRef]
- Fang, Y.; Gundersen, P.; Mo, J.M.; Zhu, W.X. Input and output of dissolved organic and inorganic nitrogen in subtropical forests of South China under high air pollution. Biogeosciences 2008, 5, 339–352. [Google Scholar] [CrossRef] [Green Version]
- Chen, H.; Gurmesa, G.A.; Zhang, W.; Zhu, X.; Zheng, M.; Mao, Q.; Zhang, T.; Mo, J. Nitrogen saturation in humid tropical forests after 6 years of nitrogen and phosphorus addition: Hypothesis testing. Funct. Ecol. 2015, 30, 305–313. [Google Scholar] [CrossRef]
- Deng, Q.; Hui, D.F.; Dennis, S.; Reddy, K.C. Responses of terrestrial ecosystem phosphorus cycling to nitrogen addition: A meta-analysis. Glob. Ecol. Biogeogr. 2017, 26, 713–728. [Google Scholar] [CrossRef]
- Wang, C.; Mori, T.; Mao, Q.; Zhou, K.; Wang, Z.; Zhang, Y.; Mo, H.; Lu, X.; Mo, J. Responses of soil microbial community to continuous experimental nitrogen additions for 13 years in a nitrogen-rich tropical forest. Soil Biol. Biochem. 2018, 121, 103–112. [Google Scholar] [CrossRef]
- Deng, M.; Liu, L.; Sun, Z.; Piao, S.; Ma, Y.; Chen, Y.; Wang, J.; Qiao, C.; Wang, X.; Li, P. Increased phosphate uptake but not resorption alleviates phosphorus deficiency induced by nitrogen deposition in temperate Larix principisrupprechtii plantations. New Phytol. 2016, 212, 1019–1029. [Google Scholar] [CrossRef] [PubMed] [Green Version]
- Chen, J.; Van Groenigen, K.J.; Hungate, B.A.; Terrer, C.; Van Groenigen, J.; Maestre, F.T.; Ying, S.C.; Luo, Y.; Jørgensen, U.; Sinsabaugh, R.L.; et al. Long-term nitrogen loading alleviates phosphorus limitation in terrestrial ecosystems. Glob. Chang. Biol. 2020, 26, 5077–5086. [Google Scholar] [CrossRef]
- Pant, H.K.; Warman, P.R. Enzymatic hydrolysis of soil organic phosphorus by immobilized phosphatases. Biol. Fertil. Soils 2000, 30, 306–311. [Google Scholar] [CrossRef]
- Zhou, K.; Lu, X.; Mori, T.; Mao, Q.; Wang, C.; Zheng, M.; Mo, H.; Hou, E.; Mo, J. Effects of long-term nitrogen deposition on phosphorus leaching dynamics in a mature tropical forest. Biogeochemistry 2018, 138, 215–224. [Google Scholar] [CrossRef]
- You, C.; Wu, F.; Yang, W.; Xu, Z.; Tan, B.; Zhang, L.; Yue, K.; Ni, X.; Li, H.; Chang, C.; et al. Does foliar nutrient resorption regulate the coupled relationship between nitrogen and phosphorus in plant leaves in response to nitrogen deposition? Sci. Total Environ. 2018, 645, 733–742. [Google Scholar] [CrossRef]
- Lawrence, D. The response of tropical tree seedlings to nutrient supply: Meta-analysis for understanding a changing tropical landscape. J. Trop. Ecol. 2003, 19, 239–250. [Google Scholar] [CrossRef]
- Ostertag, R. Foliar nitrogen and phosphorus accumulation responses after fertilization: An example from nutrient-limited Hawaiian forests. Plant Soil 2010, 334, 85–98. [Google Scholar] [CrossRef]
- Cárate-Tandalla, D.; Camenzind, T.; Leuschner, C.; Homeier, J. Contrasting species responses to continued nitrogen and phosphorus addition in tropical montane forest tree seedlings. Biotropica 2018, 50, 234–245. [Google Scholar] [CrossRef]
- Brearley, F.Q.; Scholes, J.; Press, M.C.; Palfner, G. How does light and phosphorus fertilisation affect the growth and ectomycorrhizal community of two contrasting dipterocarp species? Plant Ecol. 2007, 192, 237–249. [Google Scholar] [CrossRef]
- Burslem, D.F.R.P.; Grubb, P.J.; Turner, I.M. Responses to Nutrient Addition among Shade-Tolerant Tree Seedlings of Lowland Tropical Rain Forest in Singapore. J. Ecol. 1995, 83, 113. [Google Scholar] [CrossRef]
- Schreeg, L.A.; Santiago, L.S.; Wright, S.J.; Turner, B.L. Stem, root, and older leaf N: P ratios are more responsive indicators of soil nutrient availability than new foliage. Ecology 2014, 95, 2062–2068. [Google Scholar] [CrossRef] [PubMed] [Green Version]
- Liu, L.; Gundersen, P.; Zhang, T.; Mo, J. Effects of phosphorus addition on soil microbial biomass and community composition in three forest types in tropical China. Soil Biol. Biochem. 2012, 44, 31–38. [Google Scholar] [CrossRef]
- Zhang, T.; Zhu, W.; Mo, J.; Liu, L.; Dong, S. Increased phosphorus availability mitigates the inhibition of nitrogen deposition on CH4 uptake in an old-growth tropical forest, southern China. Biogeosciences 2011, 8, 2805–2813. [Google Scholar] [CrossRef] [Green Version]
- Yu, L.; Wang, Y.; Zhang, X.; Dörsch, P.; Mulder, J. Phosphorus addition mitigates N2O and CH4 emissions in N-saturated subtropical forest, SW China. Biogeosciences 2017, 14, 3097–3109. [Google Scholar] [CrossRef] [Green Version]
- Neufeld, H.S.; Lambers, H.; Chapin, F.S.; Pons, T.L. Plant Physiological Ecology. Ecology 1999, 80, 1785–1787. [Google Scholar] [CrossRef]
- Gilliam, F.S. The Ecological Significance of the Herbaceous Layer in Temperate Forest Ecosystems. Bioscience 2007, 57, 845–858. [Google Scholar] [CrossRef]
- Lu, X.; Mo, J.; Gilliam, F.S.; Zhou, G.; Fang, Y. Effects of experimental nitrogen additions on plant diversity in an old-growth tropical forest. Glob. Chang. Biol. 2010, 16, 2688–2700. [Google Scholar] [CrossRef] [Green Version]
- Huang, Z.F.; Fan, Z.G. The Climate of Dinghushan, Tropical and Subtropical Forest Ecosystem; Science Press: Beijing, China, 1983. [Google Scholar]
- Mo, J.; Brown, S.; Peng, S.; Kong, G. Nitrogen availability in disturbed, rehabilitated and mature forests of tropical China. For. Ecol. Manag. 2003, 175, 573–583. [Google Scholar] [CrossRef]
- Lu, X.K.; Vitousek, P.M.; Mao, Q.G.; Gilliam, F.S.; Luo, Y.Q.; Zhou, G.Y.; Zou, X.; Bai, E.; Scanlon, T.M.; Hou, E.; et al. Plant acclimation to long-term high nitrogen deposition in an N-rich tropical forest. Proc. Natl. Acad. Sci. USA 2018, 115, 5187–5192. [Google Scholar] [CrossRef] [PubMed] [Green Version]
- Mao, Q.; Lu, X.; Zhou, K.; Chen, H.; Zhu, X.; Mori, T.; Mo, J. Effects of long-term nitrogen and phosphorus additions on soil acidification in an N-rich tropical forest. Geoderma 2017, 285, 57–63. [Google Scholar] [CrossRef]
- Shen, C.; Liu, D.; Peng, S.; Sun, Y.; Jiang, M.; Yi, W.; Xing, C.; Gao, Q.; Li, Z.; Zhou, G. 14C measurement of forest soils in Dinghushan Biosphere Reserve. Chin. Sci. Bull. 1999, 44, 251–256. [Google Scholar] [CrossRef]
- Mirabello, M.J.; Yavitt, J.B.; García, M.; Harms, K.E.; Turner, B.L.; Wright, S.J. Soil phosphorus responses to chronic nutrient fertilisation and seasonal drought in a humid lowland forest, Panama. Soil Res. 2013, 51, 215–221. [Google Scholar] [CrossRef] [Green Version]
- Anderson, J.M.; Ingram, J.S.I. Tropical Soil Biology and Fertility. Soil Sci. 1994, 157, 265. [Google Scholar] [CrossRef]
- Hedin, L.O.; Brookshire, E.N.J.; Menge, D.N.L.; Barron, A.R. The Nitrogen Paradox in Tropical Forest Ecosystems. Annu. Rev. Ecol. Evol. Syst. 2009, 40, 613–635. [Google Scholar] [CrossRef] [Green Version]
- Gurmesa, G.A.; Lu, X.; Gundersen, P.; Mao, Q.; Zhou, K.; Fang, Y.; Mo, J. High retention of 15N-labeled nitrogen deposition in a nitrogen saturated old-growth tropical forest. Glob. Chang. Biol. 2016, 22, 3608–3620. [Google Scholar] [CrossRef]
- Wright, S.J.; Turner, B.L.; Sheldrake, M.; Garcia, M.N.; Yavitt, J.B.; Harms, K.E.; Kaspari, M.; Tanner, E.V.J.; Bujan, J.; Griffin, E.A.; et al. Plant responses to fertilization experiments in lowland, species-rich, tropical forests. Ecology 2018, 99, 1129–1138. [Google Scholar] [CrossRef]
- Throop, H.L.; Lerdau, M.T. Effects of nitrogen deposition on insect herbivory: Implications for community and ecosystem processes. Ecosystems 2004, 7, 109–133. [Google Scholar] [CrossRef]
- Lu, X.; Mao, Q.; Gilliam, F.S.; Luo, Y.; Mo, J. Nitrogen deposition contributes to soil acidification in tropical ecosystems. Glob. Chang. Biol. 2014, 20, 3790–3801. [Google Scholar] [CrossRef]
- Treseder, K.K.; Vitousek, P.M. Effects of soil nutrient availability on investment in acquisition of N and P in Hawaiian rain forests. Ecology 2001, 82, 946–954. [Google Scholar] [CrossRef]
- Zheng, M.; Huang, J.; Chen, H.; Wang, H.; Mo, J. Responses of soil acid phosphatase and beta-glucosidase to nitrogen and phosphorus addition in two subtropical forests in southern China. Eur. J. Soil Biol. 2015, 68, 77–84. [Google Scholar] [CrossRef]
- Mo, Q.; Li, Z.; Sayer, E.J.; Lambers, H.; Li, Y.; Zou, B.; Tang, J.; Heskel, M.; Ding, Y.; Wang, F. Foliar phosphorus fractions reveal how tropical plants maintain photosynthetic rates despite low soil phosphorus availability. Funct. Ecol. 2019, 33, 503–513. [Google Scholar] [CrossRef] [Green Version]
- Wright, S.J. Plant responses to nutrient addition experiments conducted in tropical forests. Ecol. Monogr. 2019, 89. [Google Scholar] [CrossRef]
- Sardans, J.; Vallicrosa, H.; Zuccarini, P.; Farré-Armengol, G.; Fernández-Martínez, M.; Peguero, G.; Gargallo-Garriga, A.; Ciais, P.; Janssens, I.A.; Obersteiner, M.; et al. Empirical support for the biogeochemical niche hypothesis in forest trees. Nat. Ecol. Evol. 2021, 5, 184–194. [Google Scholar] [CrossRef]
- McGroddy, M.E.; Daufresne, T.; Hedin, L.O. Scaling of C:N:P stoichiometry in forests worldwide: Implications of terrestrial redfield-type ratios. Ecology 2004, 85, 2390–2401. [Google Scholar] [CrossRef]
- Townsend, A.R.; Cleveland, C.C.; Asner, G.; Bustamante, M.M.C. Controls over foliar N: P ratios in tropical rain forests. Ecology 2007, 88, 107–118. [Google Scholar] [CrossRef]
Figure 1.
Effect of long-term N and/or P addition on N concentration of different species and organs. Notes: Error bars indicate standard error (SE; n = 5). Triangles (Δ) and asterisks (*) above the column indicate significant effect of N addition and P addition, respectively (two-way analysis of variance (ANOVA), p < 0.05); Species abbreviations are the same as in Table 1.

Figure 2.
Effect of long-term N and/or P addition on P concentration of different species and organs. Notes: Error bars indicate standard error (SE; n = 5); Triangles (Δ) and asterisks (*) above the column indicate significant effect of N addition and P addition, respectively (two-way analysis of variance (ANOVA), p < 0.05); Species abbreviations are the same as in Table 1.

Figure 3.
Effect of long-term N and/or P addition on N:P ratio of different species and organs. Notes: Error bars indicate standard error (SE; n = 5). Triangles (Δ) and asterisks (*) above the column indicate significant effect of N addition and P addition, respectively (two-way analysis of variance (ANOVA), p < 0.05); Species abbreviations are same as in Table 1.

Figure 4.
Effect of P addition on the changes of P concentration [P] in different species and organs compared with their control counterparts. Notes: Error bars indicate standard error (SE; n = 5). Species abbreviations are the same as in Table 1.
Figure 4.
Effect of P addition on the changes of P concentration [P] in different species and organs compared with their control counterparts. Notes: Error bars indicate standard error (SE; n = 5). Species abbreviations are the same as in Table 1.


Table 1.
Traits of seven species in a primary tropical forest.
| Species | Abbreviation | Family | Growth Form |
|---|---|---|---|
| Ardisia lindleyana D. Dietrich | ALI | Myrsinaceae | shrub |
| Carallia brachiata Merr. | CBR | Rhizophoraceae | subcanopy tree seedling |
| Calamus rhabdocladus Burret | CRH | Arecaceae | palm liana |
| Cryptocarya chinensis Hemsl | CCH | Lauraceae | canopy tree seedling |
| Cryptocarya concinna Hance | CCO | Lauraceae | canopy tree seedling |
| Aidia canthioides Masam | ACA | Rubiaceae | subcanopy tree seedling |
| Gnetum montanum Markgr. | GMO | Gnetaceae | woody liana |
Table 2.
Responses of soil properties to long-term N and P addition.
| Control | +N | +P | +NP | |
|---|---|---|---|---|
| SOM (g kg−1) | 31.15 (0.74) | 29.28 (0.39) | 30.50 (2.75) | 30.28 (1.66) |
| TN (g kg−1) | 1.88 (0.09) | 1.82 (0.06) | 1.79 (0.10) | 1.76 (0.09) |
| TP (g kg−1) | 0.20 (0.02) b | 0.22 (0.02) b | 0.62 (0.04) a | 0.47 (0.06) a |
| Extractable N (mg kg−1) | 12.70 (0.91) ab | 14.93 (0.88) ab | 11.51 (0.82) b | 16.40 (1.57) a |
| Extractable P (mg kg−1) | 3.26 (0.30) b | 5.28 (1.25) b | 111.76 (20.64) a | 73.09 (10.83) a |
| pH(H2O) | 3.88(0.04) ab | 3.70 (0.02) c | 3.95 (0.04) a | 3.77 (0.04) bc |
Note: SOM, soil organic matter; TN, total N; TP, total P. Values are means with standard error in parentheses (n = 5). Different lowercase letters indicate significant differences at p < 0.05 level among treatments.
Publisher’s Note: MDPI stays neutral with regard to jurisdictional claims in published maps and institutional affiliations. |
© 2021 by the authors. Licensee MDPI, Basel, Switzerland. This article is an open access article distributed under the terms and conditions of the Creative Commons Attribution (CC BY) license (https://creativecommons.org/licenses/by/4.0/).
Share and Cite
MDPI and ACS Style
Mao, Q.; Chen, H.; Wang, C.; Pang, Z.; Mo, J.; Lu, X. Effect of Long-Term Nitrogen and Phosphorus Additions on Understory Plant Nutrients in a Primary Tropical Forest. Forests 2021, 12, 803. https://doi.org/10.3390/f12060803
AMA Style
Mao Q, Chen H, Wang C, Pang Z, Mo J, Lu X. Effect of Long-Term Nitrogen and Phosphorus Additions on Understory Plant Nutrients in a Primary Tropical Forest. Forests. 2021; 12(6):803. https://doi.org/10.3390/f12060803
Chicago/Turabian StyleMao, Qinggong, Hao Chen, Cong Wang, Zongqing Pang, Jiangming Mo, and Xiankai Lu. 2021. "Effect of Long-Term Nitrogen and Phosphorus Additions on Understory Plant Nutrients in a Primary Tropical Forest" Forests 12, no. 6: 803. https://doi.org/10.3390/f12060803
Note that from the first issue of 2016, this journal uses article numbers instead of page numbers. See further details here.