
Seeding Rate Effects on Hybrid Spring Wheat Yield, Yield Components, and Quality


Department of Plant Sciences, North Dakota State University, Fargo, ND 58105, USA
*
Author to whom correspondence should be addressed.
Agronomy 2021, 11(6), 1240; https://doi.org/10.3390/agronomy11061240
Submission received: 14 May 2021
/
Revised: 8 June 2021
/
Accepted: 15 June 2021
/
Published: 18 June 2021
(This article belongs to the Section Crop Breeding and Genetics)
Abstract
:Agronomic practices, such as planting date, seeding rate, and genotype, commonly influence hard red spring wheat (HRSW, Triticum aestivum L. emend. Thell.) production. Determining the agronomic optimum seeding rate (AOSR) of newly developed hybrids is needed as they respond to seeding rates differently from inbred cultivars. The objectives of this research were to determine the AOSR of new HRSW hybrids, how seeding rate alters their various yield components, and whether hybrids offer increased end-use quality, compared to conventional cultivars. The performance of two cultivars (inbreds) and five hybrids was evaluated in nine North Dakota environments at five seeding rates in 2019−2020. Responses to seeding rate for yield and protein yield differed among the genotypes. The AOSR ranged from 3.60 to 5.19 million seeds ha−1 and 2.22 to 3.89 million seeds ha−1 for yield and protein yield, respectively. The average AOSR for yield for the hybrids was similar to that of conventional cultivars. However, the maximum protein yield of the hybrids was achieved at 0.50 million seeds ha−1 less than that of the cultivars tested. The yield component that explained the greatest proportion of differences in yield as seeding rates varied was kernels spike−1 (r = 0.17 to 0.43). The end-use quality of the hybrids tested was not superior to that of the conventional cultivars, indicating that yield will likely be the determinant of the economic feasibility of any future released hybrids.
1. Introduction
Current global crop production needs to double to meet the projected global demand by the year 2050 with wheat yield gains needing to increase from 0.9 to 2.4% yr−1 [1]. Maximizing crop production efficiency and profitability is challenged by market instability [2] and the increasing production costs are often a critical barrier to achieving these goals. Yield is the primary factor affecting profitability when paired with the efficient use of crop production inputs, such as fertilizers and seed [3]. Hard red spring wheat (HRSW) grain yield is determined by the complex interaction between genotype, environment, and management [4]. Environment cannot be fully controlled nor accurately predicted, however, producers can select and anticipate the effect of management practices, such as crop rotation [5], genotype [6], seeding date [7], seeding rate [5,7,8], row spacing [8], weather and soil management [9], genetic disease control [10], and pest management [11].
Since the advent of hybrid maize (Zea mays L.) [12], the exploitation of heterosis as a means of increasing yields in various crops, such as rice (Oryza sativa L.) and barley (Hordeum vulgare L.) has been explored [13,14,15]. Interest in exploiting wheat’s heterosis began after male-sterility advances were reported by Kihara [16], Fukasawa [17], and Kihara [18]. Livers and Heyne [19] found hybridized wheat genotypes yielding 30% more than the best performing inbred cultivar at the time. More recent research has shown a 20% yield improvement in hybrids in comparison to the best commercial cultivar and greater yield stability between environments [20]. European winter wheat hybrids displayed a higher nitrogen-use efficiency, compared to inbred cultivars [21]. The adoption of hybrid wheat may be an effective way to increase wheat yield. However, hybrid wheat seed production has been inefficient and costly. Currently, blend hybrids [22], a mixture of male parent and hybrid seed, may be more cost-effective approaches to exploit the benefits of hybrids.
Seed production costs are an important component in the determination of hybrid seed prices. The additional cost of hybrid technology must be paid for by an increase in revenue from improved yield, nutrient content, or grazing value. Retzlaff [23] reported wheat hybrid seed costs of USD 0.84 kg−1 to be five times greater than the average price of USD 0.15 kg−1 for nonhybrid wheat seed. Hybrid wheat seed has been relatively unavailable in the USA but prices in 2002 were 2.5 times greater for hybrid seed, compared to certified seed [24]. Cisar and Cooper [24], nevertheless found that even with its higher cost, hybrid seed use could increase profits by USD 25 ha−1. Future hybrid seed costs in the USA may offset the expected increase in yield generated from hybrid wheat.
The seeding rate is an integral component of the management practices required for high wheat yields. The optimal seeding rate has been shown to vary between HRSW cultivars (inbred wheat genotype) in eastern North Dakota and western Minnesota [25]. Guitard et al. [26] found the seeding rate to be a direct determinant of optimal spikes plant−1 and yield. Chen et al. [8] reported the optimum seeding rate of spring wheat to be 2.15 million live seeds ha−1 in central Montana, whereas Wiersma [7] found maximum yield was achieved with seeding rates between 4.84−5.31 million live seeds ha−1 for seven HRSW cultivars in northwest Minnesota. When combined over eight HRSW cultivars, it was concluded that the highest seeding rate of 4.30 million seeds ha−1 resulted in the highest yield in Saskatchewan, Canada [27]. Utilizing optimal plant densities limits potential yield loss by reducing light-use inefficiency [28] and maximizing nutrient use efficiency [29].
An important crop production goal is for the input use to be economically optimal. Agronomic and economic optimal seeding rates can differ depending on the yield response of a cultivar and the cost of seed used. The agronomic optimum seeding rate (AOSR) describes the point where the maximum yield is obtained, whereas the economic optimum seeding rate (EOSR) usually includes economic factors associated with the seeding rate and yield to find the point at which the maximum net profit is achieved. When the yield followed a quadratic response to seeding rate, the AOSR was found to be 5.43 million seeds ha−1 and the EOSR to be between 4.24 and 4.83 million seeds ha−1 for winter wheat in Ohio [30]. McKenzie et al. [31] reported an EOSR to range from 2.00 to 2.40 million live seeds ha−1 for irrigated soft white spring wheat in southern Alberta, Canada. Similarly, Khah et al. [32] found 2.00 million seeds ha−1 to be the economic optimum for spring wheat in the United Kingdom. Seeding rates above the optimum can potentially result in decreased yield because of increased lodging [33]. Limited information on the response of hybrids of spring wheat to agronomic inputs is available; however, Lloveras et al. [34] found a linear relationship between hybrid winter wheat yield and seeding rate up to 5.00 million seed ha−1. As seeding rate is an important input in wheat production, it is a management practice that can be targeted to reduce production costs by minimizing seed-related inputs while maximizing economic profit. Seed costs for wheat grown in the northern plains typically represent about 13% of the yearly variable input costs [35].
Wheat grain protein content and quality are largely determined by the genotype which can vary widely in agronomic, quality, and yield characteristics. Previous studies have highlighted the importance of genotype in determining protein and baking quality characteristics [36,37,38]. Agronomic practices, such as seeding rate, can affect yield and quality characteristics. Chen et al. [8] reported decreased grain protein content as seeding rate increased from 1.08 to 4.30 million seeds ha−1 in one year of the study. However, other studies noted the absence of significant seeding rate influencing grain protein content [6,39,40,41]. Controlling or predicting wheat grain protein content is an important consideration for growers as HRSW is typically grown for its high protein content relative to other wheat market classes.
Yield components are usually reported as a representation of the final makeup of yield. These components do not develop independently and there is a complex relationship between the various yield components [42,43,44,45]. Some components, such as tiller numbers, are more plastic than others, such as kernels per spike [46]. However, environment and genetics strongly influence yield component composition [45,46].
The objective of this research was to determine the AOSR for new spring wheat hybrids, determine the contribution of their various yield components to yield, and to determine if hybrids have increased end-use qualities relative to conventional cultivars.
2. Materials and Methods
Field experiments were established in three environments in 2019 and two environments in 2020. In 2019, experiments were located in Hettinger, Langdon, and Minot, North Dakota, USA, representing a large geographical area of HRSW production. In 2020, field experiments were conducted in Grand Forks and Prosper, North Dakota, USA. Table 1 summarizes the physical characteristics of the experimental locations.
Treatments consisted of a factorial combination of seven genotypes (two inbred cultivars and five HRSW hybrids) and seeding rates in a randomized complete block design with a split-plot arrangement with four replications. The whole plot was seeding rate and the sub-plot was genotype. In most environments, there were two planting dates, the first date, which was considered the optimal date, occurred as soon as practical in the spring as recommended by Wiersma and Ransom [47]. The second date was two weeks thereafter. Seeding rates were 2.22, 2.96, 3.71, 4.45, and 5.19 million live seed ha−1 which will be referred to using the million seeds ha−1 unit. The genotypes included were “SY Ingmar” and “SY Valda” (inbred cultivars), which will be referred to as Ingmar and Valda, and five experimental hybrids which will be identified as HA, HB, HC, HD, and HE. All genotypes were developed by AgriPro (Syngenta AgriPro, LLC, Greensboro, NC, USA). Ingmar and Valda were among the most commonly grown cultivars and occupied 33% of the total HRSW hectares cultivated in North Dakota in 2019 [48]. Both the agronomic traits and disease resistance of these cultivars are summarized in (Table 2). The hybrids included had not yet been commercially released. Their pedigrees were not disclosed and, because of no previous testing, their agronomic characteristics were not known.
The quantity of seed planted for each genotype and seeding rate was calculated on a live seed basis based on a germination test. Plot size, seeding date, and harvest date information are summarized for each location in Table 3. Management of the trials varied slightly at each location, based on the preferred practices of cooperating researchers at the Hettinger, Langdon, and Minot locations. Soils were tested for plant essential nutrients before seeding to ensure fertility was not a limiting factor (Table 4) and N, P, and K rates were adjusted to ensure they were not limiting as recommended by Wiersma and Ransom [47]. Fertilizers were applied before planting if necessary.
The fungicide combination of pydiflumetoen (150 g ai ha−1) and propiconazole (126 g ai ha−1) commercially marketed as Miravis Ace (Syngenta Crop Protection, LLC, Greeensboro, NC, USA) was applied to all locations at Zadoks 65 at a rate of 0.164 L ha−1 to reduce Fusarium head blight incidence (Fusarium graminearum) and fungal leaf spots. Other management practices were based on North Dakota State University Extension recommendations, regarding cultivation, fertilization, and herbicide and pesticide applications [47].
Plant density and spike density were obtained by counting plants and spikes in two of the innermost rows of each plot from a 0.91 m length from a stake randomly placed after sowing. Plant density was determined at approximately Zadoks 11 and prior to tiller production. Productive spike density was determined by counting spikes at approximately Zadoks 92 within the same 0.91 m of rows used for plant density measurements. Small spikes that were deemed not to contribute to yield were not counted.
Spikes plant−1 and kernels spike−1 were derived from plant density, spike count, and kernel weight measurements. Yield was collected for each plot using a small plot combine and was adjusted to 13.5% moisture. Moisture and test weight were determined using a GAC 2100 moisture tester (Dickey-John Corp., Minneapolis, MN, USA). Percent grain protein content was measured using a DA 7250 NIR analyzer (Perten Instruments, Stockholm, Sweden) and was reported on a 12% moisture basis. The moisture contents used for reporting yield and protein content were those commonly used by the wheat industry in the USA. To report protein yield, protein and yield, which are commonly reported at 12 and 13.5% moisture, respectively, were corrected to 12% moisture and multiplied.
An ANOVA was performed on each measured variable using the MIXED procedure in SAS 9.4 (SAS Institute, Cary, NC, USA). Environments with the ratio of the highest and lowest error mean square for yield, protein, or protein yield being less than 10 were combined for analysis [49]. In the combined analysis, location-year were considered an environment and a random effect while seeding rate, genotype, and the seeding rate by genotype interaction were considered fixed effects and analyzed as described by Carmer [50]. Analysis of variance was conducted for yield (seven environments), protein (eight environments), and protein yield (eight environments). Significant ANOVA seeding rate by genotype interactions for yield and protein yield were analyzed using the MIXED procedure with treatment means separated by Tukey’s multiple comparison test at P = 0.05. The seeding rate by genotype interaction term was further analyzed using regression analysis and the REG procedure in SAS.
The wheat quality analysis was performed on the grain of each genotype from the 2.96 million seeds ha−1 seeding rate treatment. The 2.96 million seeds ha−1 rate was chosen to represent a typical seeding rate that farmers use in the area. The harvested samples from replicates one and two and from replicates three and four were combined for each of these treatments from each location to form two replicates for each genotype and environment. Grain samples were analyzed by the North Dakota State University Wheat Quality Laboratory for test weight, kernel size distribution, kernel weight, protein, falling number, milling extraction, mixograph score, peak maximum time, maximum torque, total energy, and loaf volumes, according to standard protocols [51].
Planting dates within environments had differing yield responses, so data from each planting date were partitioned into high (>5000 kg ha−1) and low (<5000 kg ha−1) yielding environment datasets by considering individual planting dates as a single environment for a total of nine environments similar to Mehring et al. [52]. Yield within an environment was evaluated by standardizing the distribution of each, using z-scores. Data were transformed using the Standard procedure in SAS to calculate a z-score for yield using the formula where x is yield, is the yield mean of the high or low yielding environment, and is the standard deviation of the high or low yield environment [53]. The z-score adjusts the data distribution to have a mean of 0 and a standard deviation of 1. Next, the z-score data were used to adjust yield values to be relative to the yield of the individual environment using the formula Ŷ = (z-score × ) + μ where Ŷ is estimated yield, z-score is z-score of yield, is the standard deviation of the individual environment, and μ is the mean of the high or low yield environment.
Relationships between yield components and yield for high and low yielding environments were analyzed using yields adjusted by the z-score approach previously discussed. Multiple linear regression was used to determine the relative importance of each yield component on yield using the REG procedure which also derived partial correlation coefficients (r2) and adjusted R2. Wheat end quality characteristics were analyzed using the GLM procedure in SAS with single degree of freedom linear contrasts for cultivar and hybrid comparison evaluated at α = 0.05.
3. Results and Discussion
3.1. Weather Data
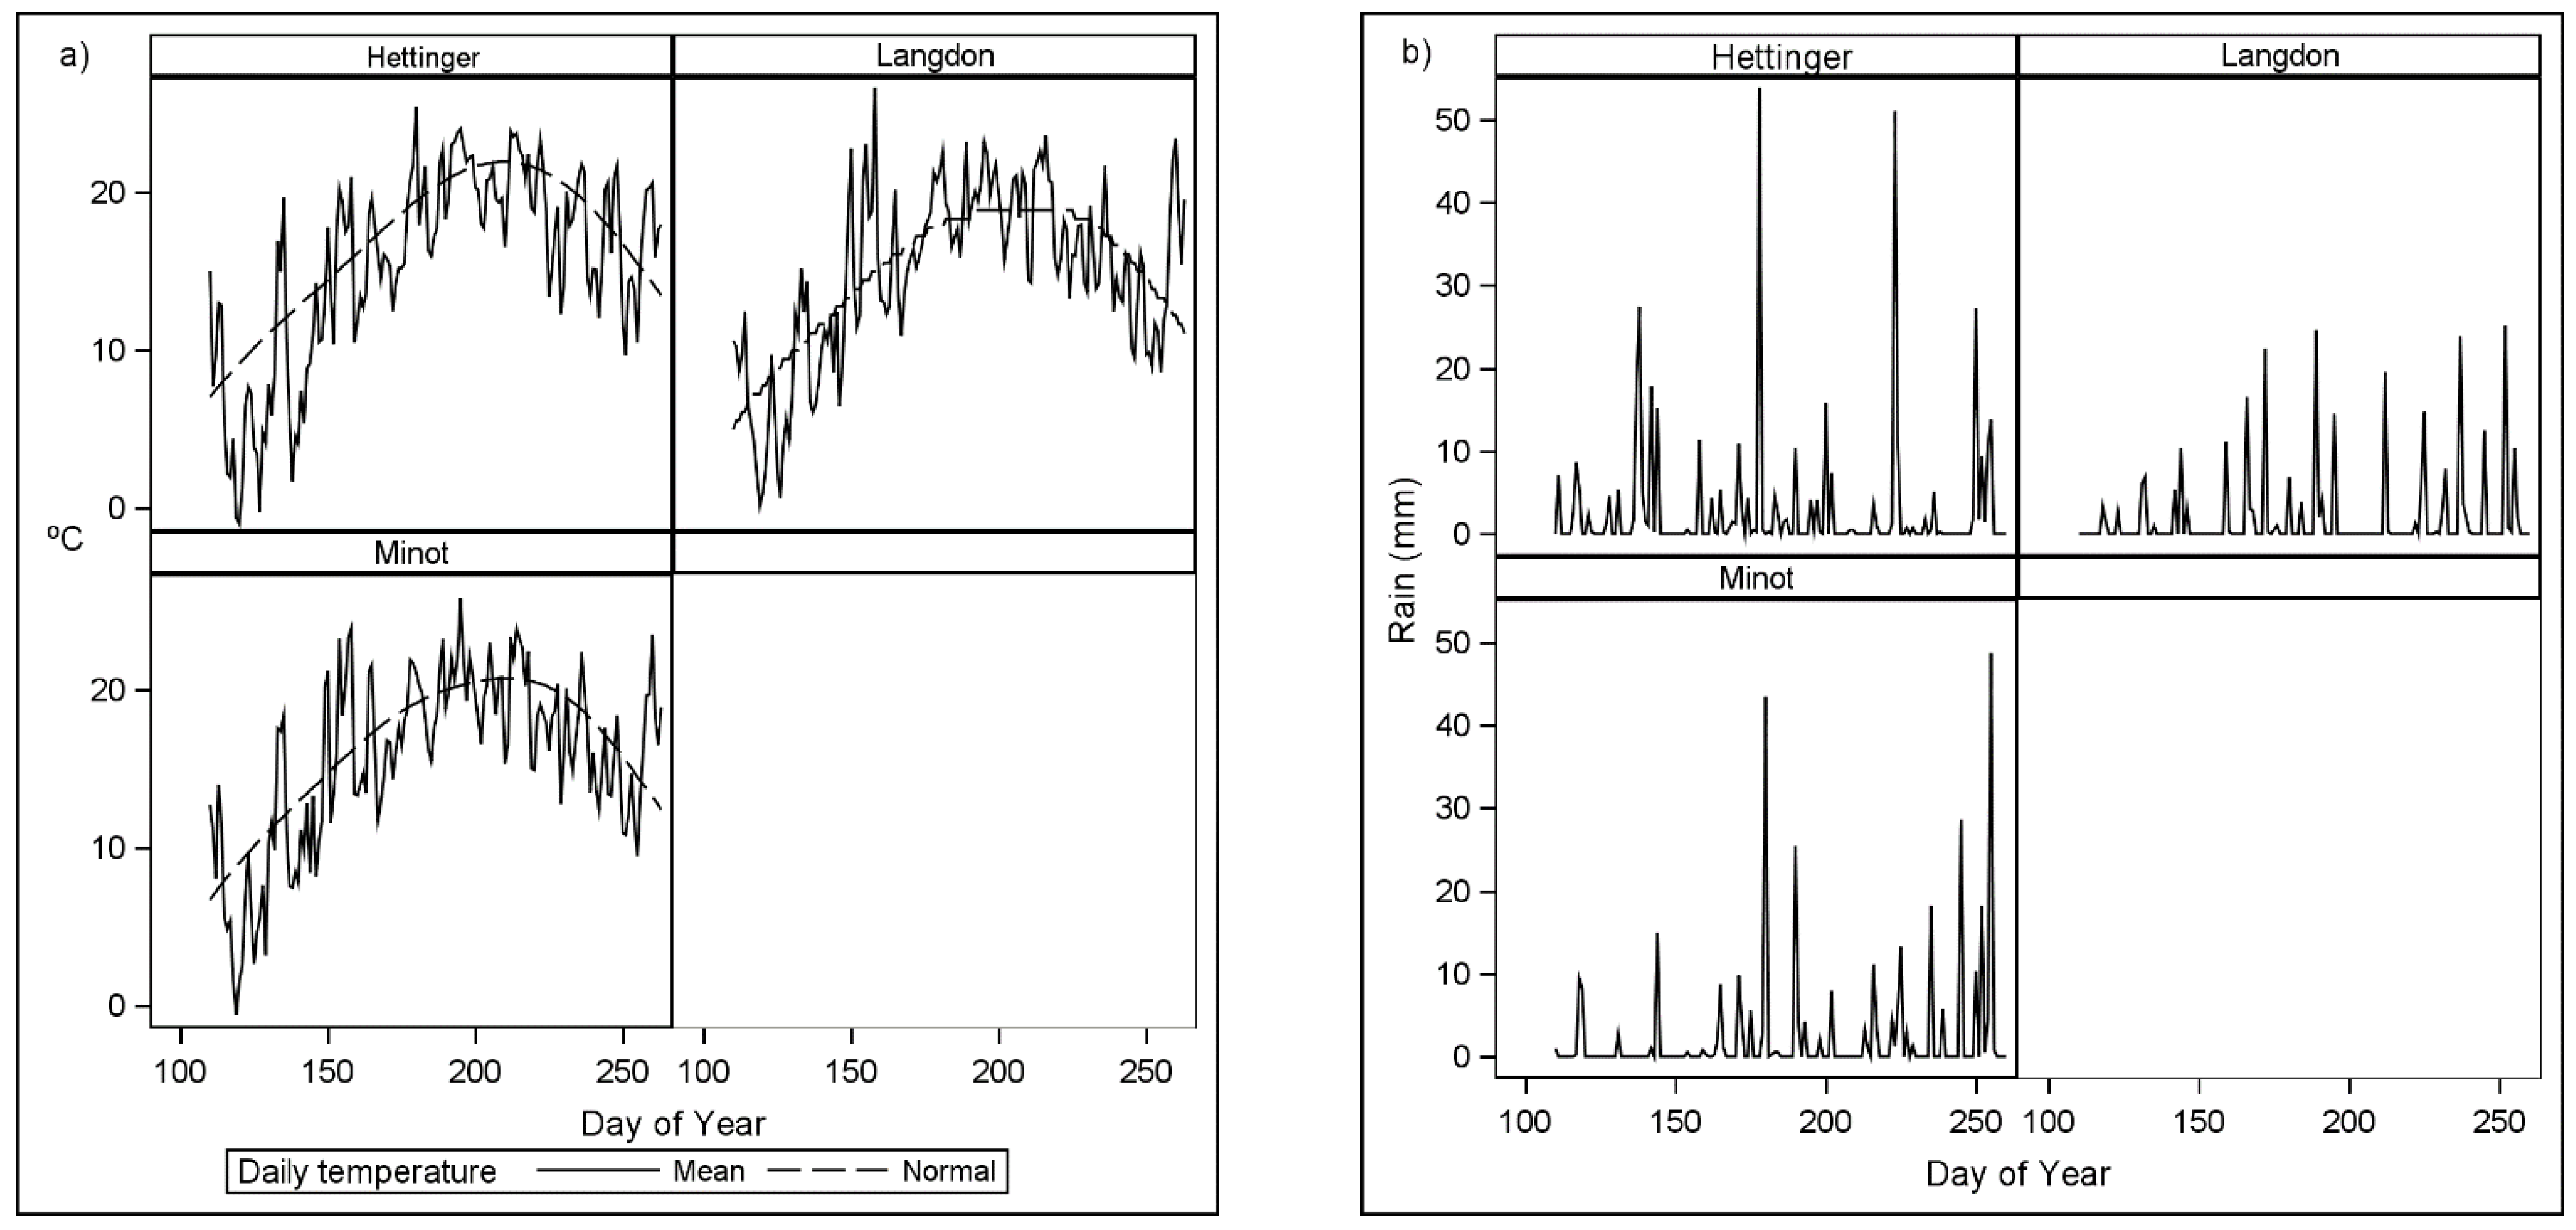
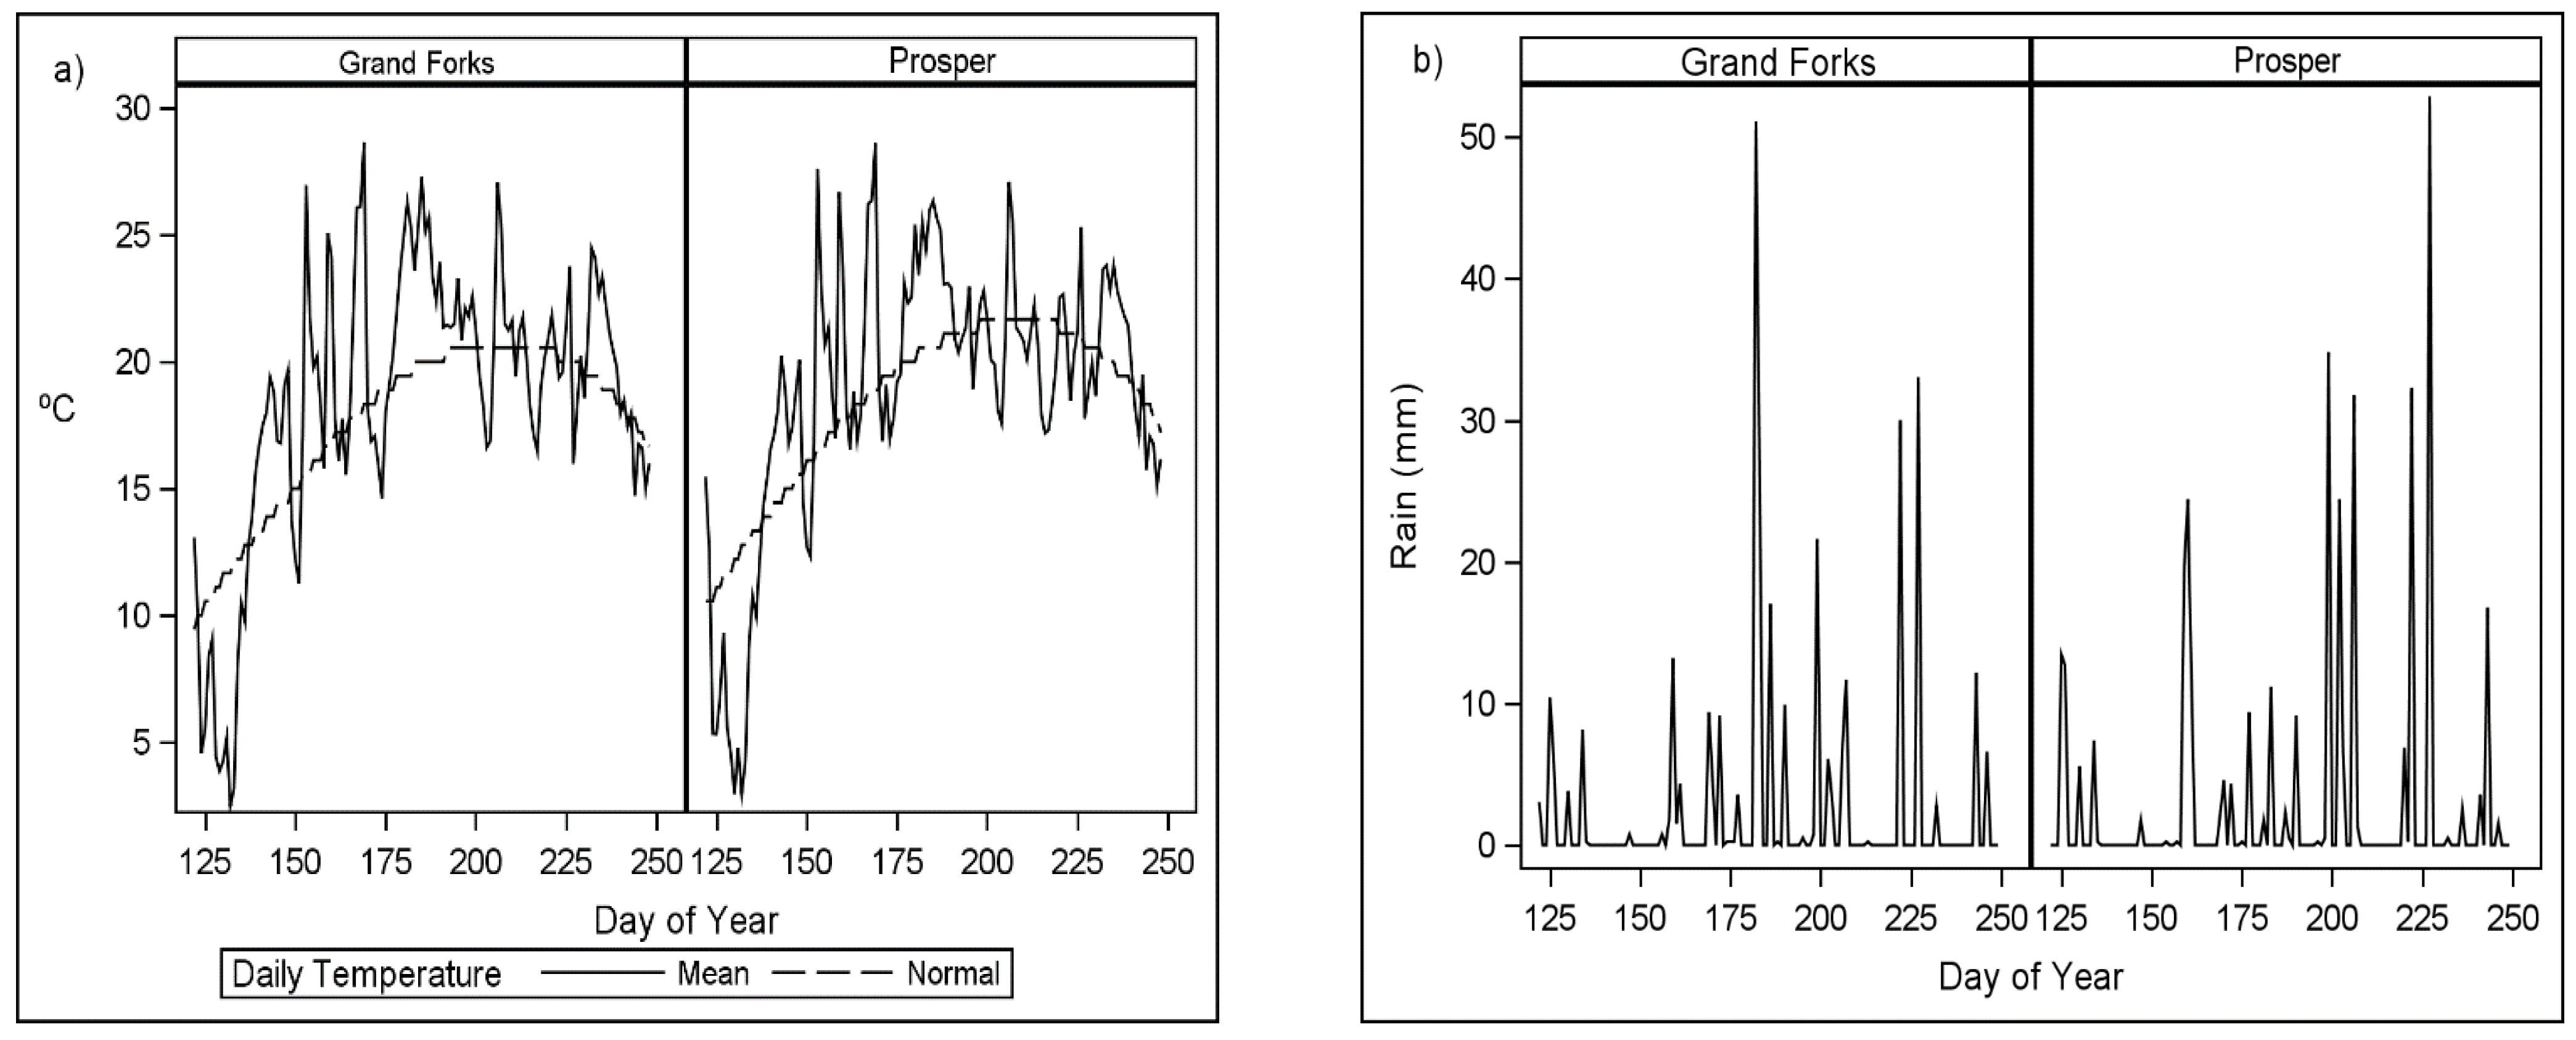
Seeding dates were dependent on appropriate seeding conditions which were primarily affected by rainfall each year (Figure 1 and Figure 2). Seeding dates ranged from 116 to 149 day of the year (DOY) with recommended optimal seeding dates ranging from 91 to 127 DOY from southernmost to the northernmost latitudes in North Dakota. The yield variation between environments can be largely attributed to weather and soil effects, since the management factors were similar in 2019. Hettinger had relatively normal temperatures and rainfall during the growing season and yields were slightly above the mean for the region. In 2019, rainfall was less than normal in Minot and Langdon with Minot generally having warmer temperatures than Langdon. In Minot, minimal rainfall and above normal temperatures between 140 to 170 DOY during tiller formation (Zadoks 11 and 29) greatly reduced yield potential. The 2020 growing season began with above-normal rainfall and cooler than normal temperatures in Grand Forks and Prosper (Figure 2). The low early season temperatures and normal rainfall allowed for favorable tiller formation and grain development in Prosper, resulting in high grain yield.
3.2. Yield
There was a significant seeding rate by genotype interaction for yield when the data were combined across the environments (Table 5). However, the seeding rate by genotype interaction differences in Table 6 inconclusively described the genotype response to seeding rate. To further evaluate this interaction, the response of each genotype to increasing seeding rates was evaluated using regression analysis (Table 7). Significant regression R2 values were relatively similar between linear or quadratic models for each genotype. The AOSR ranged from 3.60 to 5.19 million seeds ha−1 with an average AOSR for the hybrids of 4.49 million seeds ha−1 which was similar to the average AOSR for the cultivars. However, HE had an AOSR that was 83% of the Valda yield, suggesting that highly productive hybrids may require a lower seeding rate than inbred cultivars, at least for those included in this trial. Our AOSR results are within the ranges of those for HRSW and winter wheat cultivars of 1.59 to 5.03 and 2.85 to 5.73 and million seeds ha−1 in the northern great plains and Ohio, USA, respectively [25,30]. In Italy, winter wheat hybrids can be planted at 33% of the seeding rate of a conventional cultivar while not losing significant amounts of yield [54]. In Europe, winter wheat hybrids display greater yield stability compared to conventional cultivars [55]. Similarly, rice hybrids have greater yield stability and are less responsive to reduced inputs [56]. Thus, certain HRSW hybrids can have lower AOSR and require fewer inputs compared to conventional cultivars; however, the hybrids and inbred cultivars in this experiment were generally unresponsive to seeding rate.
3.3. Grain Protein Content
Hard red spring wheat is often sought after for its high protein content for making raised bread products. Various studies have affirmed seeding rate often does not significantly affect grain protein [57,58,59]. Our results show that seeding rate did not affect grain protein content (Table 5). Conversely, Chen et al. [8] found a linear relationship where protein content decreased as seeding rate increased from 1.08 to 4.30 million seeds ha−1. Genotypes differed significantly in protein content with Ingmar having the greatest protein content also being the lowest yielding among all genotypes (Table 8). Protein content levels were relatively consistent across the hybrids that were included in this experiment although significantly less than Ingmar. Thorwarth et al. [60] found winter wheat hybrids to have decreased protein content regardless of quality class, compared to parental lines. The data suggest hybrid wheat protein contents can be similar to relatively lower protein cultivars like Valda that have similar yield potential.
3.4. Protein Yield
The protein yield accounts for the grain protein percentage and seed yield to describe the amount of protein produced per area [61]. The relationship is usually negative between protein and yield, and the variable is useful for integrating them both, as protein content is critical in determining HRSW value. The protein yield was significantly affected by seeding rate, genotype, and the seeding rate by genotype interaction (Table 5). The significant seeding rate by genotype interaction in Table 6 is difficult to interpret, therefore regression analysis was used. Using regression analysis of the protein yield, Valda and HA were similar with HA yielding 18 kg ha−1 more protein (Table 9). Across the five hybrids which ranged from 615 to 634 kg ha−1 protein yield, only HA had a significant protein yield response to seeding rate (Table 9). In general, neither linear nor quadratic relationships between protein yield and seeding rate explained the relatively high amount of deviation from the trendline, aside from Valda and HA. Certain HRSW genotypes may elicit a response in protein yield whereas others are unresponsive. On average, hybrids had a greater protein yield compared to their inbred parental lines [60]. Based on these quadratic protein yield models, the HRSW hybrids do not have a reduced protein yield at the expense of grain yield, compared to cultivars. Simmonds [62] summarized that protein yield increases with grain yield but diminishes beyond an optimal point.
3.5. Yield Components
Wheat yield components are considered plastic and compensate for one another and their relative contributions to yield may vary in high or low yielding environments. Therefore, the data were separated into four high (>5000 kg ha−1) and five low (<5000 kg ha−1) yield environments, similar to Mehring et al. [52]. The environments ranged from 5202 to 5923 and 3846 to 4633 kg ha−1 for high and low yield environments, respectively. Of the genotypes tested, Valda and HD displayed similar yield, quality, and growth characteristics and were used to compare yield components. Plant density did not significantly influence the yield of either Valda or HD in either yield environment (Table 10). In general, spike density and kernels spike−1 contribute to the greatest proportion of yield. In high yielding environments, spike density and kernels spike−1, and kernel weight are more closely related to yield for HD compared to Valda. The differences between the yield component contributions to yield for HD and Valda were not as apparent in low-yielding environments. Standardizing the data for multiple linear regression allows for the relative comparison of each yield component’s contribution to yield. The multiple linear regression coefficients for Valda and HD in high yield environments show that the relative importance of the yield components are similar. Yield components in high yield environments better explain yield for HD (R2 = 0.79) than Valda (R2 = 0.56). Furthermore, yield component contributions to yield for Valda and HD have no discernable differences in low-yield environments.
Spike density, kernel weight, and kernels spike−1 consistently explained yield for both Valda and HD in both high and low yield environments. Our results show that in the hybrids, kernels spike−1 were increased, compared to the inbred cultivar Valda, confirming previous studies [21,63,64]. Slafer et al. [45] described kernels spike−1 as a coarse yield regulator accounting for large changes in yield caused by genotypic differences and can be targeted with management practices to improve overall yield. Improving wheat yield potential through maximizing spike density, kernels spike−1, and kernel weight may benefit hybrid wheat more than inbred cultivars if used for selection during the breeding process. In particular, kernels spike−1 is a more important yield component for HRSW hybrids, compared to inbred cultivars.
3.6. Grain Quality
For each genotype, the seed from all replicates was combined over the 2.96 million seed ha−1 seeding rate for each environment (Table 11). The hybrids had significantly greater proportions of small and medium-sized kernels and greater kernel weight in general. The hybrids also had less milling extraction compared to Ingmar and Valda. This could be expected, given larger kernels are more desirable for milling and provide a higher flour yield compared to medium and small kernels [65]. However, when compared to Ingmar and Valda, the wheat hybrids did not have superior end-use qualities. The hybrids had a relatively similar protein content compared to Valda. In general, experimental wheat hybrids in breeding programs have negative heterosis for grain protein content compared to inbred cultivars [60]. Ingmar and Valda had greater falling numbers, although none of the genotypes had falling numbers that exceeded the preferable value of 400 s. Kindred et al. [66] similarly found hybrid wheat falling numbers to be less than the inbred parent cultivars. These results correspond with those of Gaines et al. [67] who found soft wheat milling extraction was less for smaller kernel sizes although other end quality characteristics were not affected by small kernel sizes.
4. Conclusions
The genotype affected the HRSW agronomic performance more than the seeding rate. Certain hybrids had greater grain yield compared to inbred cultivars. The increased yield of the hybrids, relative to the inbred cultivars, resulted from larger spikes. Within the hybrids tested, the hybrids were generally unresponsive to seeding rate and should be seeded at relatively similar rates to conventional cultivars for maximum yield. The maximum protein yield can be achieved by Valda at a slightly lower seeding rate compared to the hybrids tested. Thus, HRSW hybrids may provide increased total protein yield compared to cultivars when sown at lower seeding rates. Hybrid wheat economic benefits could be constricted by potentially higher seed costs. The hybrids used in this experiment are not expected to be released commercially, and future HRSW hybrids to be released will likely have greater yield and quality benefits increasing agronomic and economic returns. Heterosis did not increase the end-use quality, therefore yield will determine the economic feasibility of hybrids as long as the quality is maintained as evidenced by these hybrids.
Author Contributions
P.K.S.: literature review, conceptualization, methodology, research, formal statistical analysis, writing—original draft, and writing—review and editing. J.K.R.: funding acquisition, project administration, conceptualization, investigation, supervision and writing—review and editing. All authors have read and agreed to the published version of the manuscript.
Funding
This research was funded by Syngenta AgriPro.
Acknowledgments
The authors would like to thank Chad Deplazes for his technical research assistance, and Eric Eriksmoen, Bryan Hanson, and John Rickertsen for their cooperation and experiment management.
Conflicts of Interest
The authors declare no conflict of interest.
References
- Ray, D.K.; Mueller, N.D.; West, P.C.; Foley, J.A. Yield trends are insufficient to double global crop production by 2050. PLoS ONE 2013, 8, e66428. [Google Scholar] [CrossRef] [Green Version]
- Winders, B.; Heslin, A.; Ross, G.; Weksler, H.; Berry, S. Life after the regime: Market instability with the fall of the US food regime. Agric. Hum. Values 2016, 33, 73–88. [Google Scholar] [CrossRef]
- Sonka, S.T.; Hornbaker, R.H.; Hudson, M.A. Managerial performance and income variability for a sample of Illinois cash grain producers. North Cent. J. Agric. Econ. 1989, 11, 39–47. [Google Scholar] [CrossRef]
- Martin, M.M.; Olesen, J.E.; Porter, J.R. A genotype, environment and management (G×E×M) analysis of adaptation in winter wheat to climate change in Denmark. Agric. For. Meteorol. 2014, 187, 1–13. [Google Scholar] [CrossRef]
- Lafond, G.P.; Loeppky, H.; Derksen, D.A. The effects of tillage systems and crop rotations on soil water conservation, seedling establishment, and crop yield. Can. J. Plant Sci. 1992, 72, 103–115. [Google Scholar] [CrossRef]
- Faris, D.G.; DePauw, R.M. Effect of seeding rate on growth and yield of three spring wheat cultivars. F. Crop. Res. 1981, 3, 298–301. [Google Scholar] [CrossRef]
- Wiersma, J.J. Determining an optimum seeding rate for spring wheat in Northwest Minnesota. Crop Manag. 2002. [Google Scholar] [CrossRef]
- Chen, C.; Neill, K.; Wichman, D.; Westcott, M. Hard red spring wheat response to row spacing, seeding rate, and nitrogen. Agron. J. 2008, 100, 5. [Google Scholar] [CrossRef] [Green Version]
- Gooding, M.J.; Davies, W.P. The crop environment and grain quality: Weather and soils. In Wheat Production and Utilization: Systems Quality and the Environment; CABI: Wallingford, UK, 1997. [Google Scholar]
- Singh, R.P.; Singh, P.K.; Rutkoski, J.; Hodson, D.P.; He, X.; Jorgensen, L.N.; Hovmoller, M.S.; Huerta-Espino, J. Disease impact on wheat yield potential and prospects of genetic control. Annu. Rev. Phytopathol. 2016, 54, 303–322. [Google Scholar] [CrossRef] [PubMed] [Green Version]
- Wratten, S.D.; Elliott, N.C.; Farrell, J.A. Integrated pest management in wheat in the USA. In Integrated Pest Management; Dent, D., Ed.; Chapman & Hall: London, UK, 1995. [Google Scholar]
- Shull, G.H. A pure line method of corn breeding. Rept. Amer. Breed. Assoc. 1909, 4, 296–301. [Google Scholar] [CrossRef]
- Virmani, S.S. Hybrid rice. Adv. Agron. 1996, 57, 337–462. [Google Scholar] [CrossRef]
- Muhleisen, J.; Maurer, H.P.; Stiewe, G.; Bury, P.; Reif, J.C. Hybrid breeding in barley. Crop Sci. 2013, 53, 819–824. [Google Scholar] [CrossRef]
- Shull, G.H. What is heterosis? Genetics 1948, 33, 439–446. [Google Scholar] [CrossRef]
- Kihara, H. Substitution of nucleus and its effects on genome manifestations. Cytologia 1951, 16, 117–193. [Google Scholar] [CrossRef] [Green Version]
- Fukasawa, H. Studies on restoration and substitution of nucleus in Aegilotriticum. I. Appearance of male-sterile durum in substitution crosses. Cytologia 1953, 18, 167–175. [Google Scholar] [CrossRef] [Green Version]
- Kihara, H. Cytoplasmic male sterility in relation to hybrid wheat breeding. Zuchter 1967, 37, 86–93. [Google Scholar] [CrossRef]
- Livers, R.W.; Heyne, E.G. Hybrid vigour in hard red winter wheat. In Proceedings of the 3rd International Wheat Genetics Symposium, Canberra, Australia, 5–9 August 1968; Finley, K., Shepherd, K.S.K., Eds.; Australian Academy of Science: Canberra, Australia, 1968; pp. 431–436. [Google Scholar]
- Gowda, M.; Longin, C.F.; Lein, V.; Reif, J.C. Relevance of specific versus general combining ability in winter wheat. Crop Sci. 2012, 52, 2494–2500. [Google Scholar] [CrossRef] [Green Version]
- Prey, L.; Kipp, S.; Hu, Y.; Schmidhalter, U. Nitrogen use efficiency and carbon traits of high-yielding european hybrid vs. line winter wheat cultivars: Potentials and limitations. Front. Plant Sci. 2019, 9, 1988. [Google Scholar] [CrossRef] [PubMed] [Green Version]
- Wilson, P. Hybrid wheat development in Australia and a proposal for hybrid wheat blends for developing countries. In The Genetics and Exploitation of Heterosis in Crops; CIMMYT: An International Symposium; CIMMYT: Mexico City, Mexico, 1997; pp. 216–217. [Google Scholar]
- Retzlaff, R. EC7-864 The Economics of Hybrid Wheat; University of Nebraska-Lincoln: Lincoln, NE, USA, 1976; p. EC7-864. [Google Scholar]
- Cisar, G.; Cooper, D.B. Hybrid wheat. In Bread Wheat: Improvement and Production; Curtis, C., Rajaram, S., Macpherson, H.G., Eds.; FAO: Rome, Italy, 2002; pp. 157–174. [Google Scholar]
- Mehring, G.H. Determining Optimum Seeding Rates for Diverse Hard Red Spring Wheat Cultivars. Ph.D. Thesis, North Dakota State University, Fargo, ND, USA, 2016. [Google Scholar]
- Guitard, A.A.; Newman, J.A.; Hoyt, P.B. The influence of seeding rate on the yield and the yield components of wheat, oats, and barley. Can. J. Plant Sci. 1961, 41, 750–758. [Google Scholar] [CrossRef]
- Baker, R.J. Effect of seeding rate on grain yield, straw yield, and harvest index of eight spring wheat cultivars. Can. J. Plant Sci. 1982, 62, 285–291. [Google Scholar] [CrossRef]
- Puckridge, D.; Donald, C. Competition among wheat plants sown at a wide range of densities. Aust. J. Agric. Res. 1967, 18, 193–211. [Google Scholar] [CrossRef]
- Nass, H.G.; Reiser, B. Grain filling period and grain yield relationships in spring wheat. Can. J. Plant Sci. 1975, 55, 673–678. [Google Scholar] [CrossRef]
- Lindsey, L.E.; Goodwin, A.W.; Harrison, S.K.; Paul, P.A. Optimum seeding rate and stand assessment of soft red winter wheat. Agron. J. 2020, 112, 4069–4075. [Google Scholar] [CrossRef]
- McKenzie, R.H.; Middleton, A.B.; Dunn, R.; Sadasivaiah, R.S.; Beres, B.; Bremer, E. Response of irrigated soft white spring wheat to seeding date, seeding rate and fertilization. Can. J. Plant Sci. 2008, 88, 291–298. [Google Scholar] [CrossRef]
- Khah, E.M.; Roberts, E.H.; Ellis, R.H. Effects of seed ageing on growth and yield of spring wheat at different plant-population densities. F. Crop. Res. 1989, 20, 175–190. [Google Scholar] [CrossRef]
- Laghari, G.M.; Oad, F.C.; Tunio, S.; Chachar, Q.; Ghandahi, A.W.; Siddiqui, M.H.; Hassan, S.W.; Ali, A. Growth and yield attributes of wheat at different seed rates. Sarhad J. Agric. 2011, 27, 177–183. [Google Scholar] [CrossRef]
- Lloveras, J.; Manent, J.; Viudas, J.; Lopez, A.; Santiveri, P. Seeding rate influence on yield and yield components of irrigated winter wheat in a Mediterranean climate. Agron. J. 2004, 96, 1258–1265. [Google Scholar] [CrossRef]
- Vocke, G.; Ali, M. U.S. Wheat Production Practices, Costs, and Yields: Variations Across Regions, EIB-116; US Department of Agriculture; Economic Research Service: Washington, DC, USA, 2013.
- Fowler, D.B.; Brydon, J.; Darroch, B.A.; Entz, M.H.; Johnston, A.M. Environment and Genotype Influence on Grain Protein Concentration of Wheat and Rye. Agron. J. 1990, 82, 655–664. [Google Scholar] [CrossRef]
- Terman, G.L. Yields and Protein Content of Wheat Grain as Affected by Cultivar, N, and Environmental Growth Factors 1. Agron. J. 1979, 71, 437–440. [Google Scholar] [CrossRef]
- Hristov, N.; Mladenov, N.; Djuric, V.; Kondic-Spika, A.; Marjanovic-Jeromela, A.; Simic, D. Genotype by environment interactions in wheat quality breeding programs in southeast Europe. Euphytica 2010, 174, 315–324. [Google Scholar] [CrossRef]
- Walsh, O.S.; Walsh, W.L. Seeding rate and nitrogen fertilizer rate effect on dryland no-till hard red spring wheat yield and quality. Agrosyst. Geosci. Environ. 2020, 3, e20001. [Google Scholar] [CrossRef] [Green Version]
- Otteson, B.N.; Mergoum, M.; Ransom, J.K. Seeding rate and nitrogen management effects on spring wheat yield and yield components. Agron. J. 2007, 99, 1615–1621. [Google Scholar] [CrossRef]
- Briggs, K.G.; Ayten-Fisu, A. The effects of seeding rate, seeding date and location on grain yield, maturity, protein percentage and protein yield of some spring wheats in central Alberta. Can. J. Plant Sci. 1979, 59, 1139–1145. [Google Scholar] [CrossRef]
- Miralles, D.J.; Slafer, G.A. Sink limitations to yield in wheat: How could it be reduced? J. Agric. Sci. 2007, 145, 139–149. [Google Scholar] [CrossRef] [Green Version]
- Sadras, V.O.; Denison, R.F. Do plant parts compete for resources? An evolutionary viewpoint. New Phytol. 2009, 183, 565–574. [Google Scholar] [CrossRef]
- Güler, M.; Sait Adak, M.; Ulukan, H. Determining relationships among yield and some yield components using path coefficient analysis in chickpea (Cicer arietinum L.). Eur. J. Agron. 2001, 14, 161–166. [Google Scholar] [CrossRef]
- Slafer, G.A.; Roxana, S.; Sadras, V.O. Coarse and fine regulation of wheat yield components in response to genotype and environment. F. Crop. Res. 2014, 157, 71–83. [Google Scholar] [CrossRef]
- Sadras, V.O.; Slafer, G.A. Environmental modulation of yield components in cereals: Heritabilities reveal a hierarchy of phenotypic plasticities. F. Crop. Res. 2012, 127, 215–224. [Google Scholar] [CrossRef]
- Wiersma, J.J.; Ransom, J.K. The Small Grains Field Guide; North Dakota State University: Fargo, ND, USA, 2017; p. A290, (Revised); Available online: https://hdl.handle.net/11299/51480 (accessed on 16 June 2021).
- Ransom, J.K.; Green, A.; Simsek, S.; Friskop, A.; Breiland, M.; Friesen, T.; Liu, Z.; Zhong, S.; Rickersen, J.; Eriksmoen, E.; et al. North Dakota Hard Red Spring Wheat Variety Trial Results and Selection Guide; North Dakota State University: Fargo, ND, USA, 2019; p. A574-19. [Google Scholar]
- Tabachnick, B.G.; Fidell, L.S. Using Multivariate Statistics, 4th ed.; Harper Collins: New York, NY, USA, 2001. [Google Scholar]
- Carmer, S.G.; Nyquist, W.E.; Walker, W.M. Least significant differences for combined analyses of experiments with two- or three-factor treatment designs. Agron. J. 1998, 81, 665–672. [Google Scholar] [CrossRef]
- American Association of Cereal Chemists. Method. In Approved Methods of the AACC; American Association of Cereal Chemists: St. Paul, MN, USA, 1995; Volume 10. [Google Scholar]
- Mehring, G.H.; Wiersma, J.J.; Stanley, J.D.; Ransom, J.K. Genetic and environmental predictors for determining optimal seeding rates of diverse wheat cultivars. Agronomy 2020, 10, 332. [Google Scholar] [CrossRef] [Green Version]
- Clark-Carter, D.; Scores, Z. Wiley: StatsRef: Statistics Reference; John Wiley & Sons, LTD: Hoboken, NJ, USA, 2014. [Google Scholar] [CrossRef]
- Milan, M.; Fogliatto, S.; Blandino, M.; Vidotto, F. Are wheat hybrids more affected by weed competition than conventional cultivars? Agronomy 2020, 10, 526. [Google Scholar] [CrossRef] [Green Version]
- Muhleisen, J.; Piepho, H.P.; Maurer, H.P.; Longin, C.F.; Reif, J.C. Yield stability of hybrids versus lines in wheat, barley, and triticale. Theo. Appl. Genet. 2014, 127, 309–316. [Google Scholar] [CrossRef]
- Yuan, S.; Nie, L.; Wang, F.; Huang, J.; Peng, S. Agronomic performance of inbred and hybrid rice cultivars under simplified and reduced-input practices. F. Crop Res. 2017, 210, 129–135. [Google Scholar] [CrossRef]
- Campbell, C.A.; Selles, F.; Zentner, R.P.; McLeod, J.G.; Dyck, F.B. Effect of seeding date, rate and depth on winter wheat grown on conventional fallow in S.W. Saskatchewan. Can. J. Plant Sci. 1991, 71, 51–61. [Google Scholar] [CrossRef]
- Carr, P.M.; Horsley, R.D.; Poland, W.W. Tillage and seeding rate effects on wheat culitvars: I. Grain Production. Crop Sci. 2003, 43, 202–209. [Google Scholar] [CrossRef]
- Larter, E.N.; Kaltsikes, P.J.; McGinnis, R.C. Effect of date and rate of seeding on the performance of triticale in comparison to wheat. Crop Sci. 1971, 11, 593–595. [Google Scholar] [CrossRef]
- Thorwarth, P.; Piepho, H.P.; Zhao, Y.; Ebmeyer, E.; Schacht, J.; Schachschneider, R.; Kazman, E.; Reif, J.C.; Wurschum, T.; Longin, C.F. Higher grain yield and higher grain protein deviation underline the potential of hybrid wheat for a sustainable agriculture. Plant Breed. 2018, 137, 326–337. [Google Scholar] [CrossRef]
- Koekemoer, F.P.; Labuschagne, M.T.; Van Deventer, C.S. A selection strategy for combining high grain yield and high protein content in South African wheat cultivars. Cereal Res. Commun. 1999, 27, 107–114. [Google Scholar] [CrossRef]
- Simmonds, N.W. The relation between yield and protein in cereal grain. J. Sci. Food. Agric. 1995, 67, 309–315. [Google Scholar] [CrossRef]
- Mahajan, V.; Nagarajan, S.; Srivastava, M.; Kumar, V.; Ganga Rao, N. Commercial Heterosis in Wheat: An Overview. RACHIS Newsl. 1999. Available online: https://hybridwheat.tripod.com/commercial_heterosis.htm (accessed on 3 June 2021).
- Kindred, D.R.; Gooding, M.J. Heterosis for yield and its physiological determinants in wheat. Euphytica 2005, 142, 149–159. [Google Scholar] [CrossRef]
- Baasandorj, T.; Ohm, J.B.; Manthey, F.; Simsek, S. Effect of kernel size and mill type on protein, milling yield, and baking quality of hard red spring wheat. Cereal Chem. 2015, 92, 81–87. [Google Scholar] [CrossRef]
- Kindred, D.R.; Gooding, M.J.; Ellis, R.H. Nitrogen fertilizer and seed rate effects on Hagberg falling number of hybrid wheats and their parents are associated with α-amylase activity, grain cavity size and dormancy. J. Sci. Food Agric. 2005, 85, 727–742. [Google Scholar] [CrossRef]
- Gaines, C.S.; Finney, P.L.; Andrews, L.C. Influence of kernel size and shriveling on soft wheat milling and baking quality. Cereal Chem. 1997, 74, 700–704. [Google Scholar] [CrossRef]
Figure 1.
Wheat growing season (a) daily mean and normal temperatures and (b) daily rainfall in 2019 where day of year 100 is 10 April.
Figure 1.
Wheat growing season (a) daily mean and normal temperatures and (b) daily rainfall in 2019 where day of year 100 is 10 April.

Figure 2.
Wheat growing season (a) daily mean and normal temperatures and (b) daily rainfall in 2020 where day of year 125 is 4 May.
Figure 2.
Wheat growing season (a) daily mean and normal temperatures and (b) daily rainfall in 2020 where day of year 125 is 4 May.


Table 1.
Soil series, soil taxonomy, previous crop, and location of the 2019 and 2020 experiment locations.
Table 1.
Soil series, soil taxonomy, previous crop, and location of the 2019 and 2020 experiment locations.
| Location | Soil Series | Soil Taxonomy | Previous Crop 1 | GPS Coordinates |
|---|---|---|---|---|
| 2019 | ||||
| Hettinger | Shambo | Fine-loamy, mixed, superactive, frigid Typic Haplustolls | Soybean | 46.040, −102.384 |
| Langdon | Barnes | Fine-loamy, mixed, superactive, frigid Calcic Hapludolls | Soybean | 48.450, −98.205 |
| Svea | Fine-loamy, mixed, superactive, frigid Pachic Hapludolls | |||
| Minot | Forman | Fine-loamy, mixed, superactive, frigid Calcic Argiudolls | Soybean | 48.106, −101.184 |
| 2020 | ||||
| Grand Forks | Bearden | Fine-silty, mixed, superactive, frigid Aeric Calciaquolls | Dry Bean | 47.789, −97.066 |
| Prosper | Bearden | Fine-silty, mixed, superactive, frigid Aeric Calciaquolls | Soybean | 47.073, −97.619 |
| Lindaas | Fine, smectitic, frigid Typic Argiaquolls | |||
1 Soybean, (Glycine max (L.) Merr.); dry bean, Phaseolus vulgaris L.
Table 2.
Agronomic characteristics of the two cultivars included in the experiment.
| Cultivar | Company | Height | Straw Strength | Days to Heading 1 | Stem Rust 2 | Leaf Rust | Stripe Rust | Tan Spot | BLS | Head Scab |
|---|---|---|---|---|---|---|---|---|---|---|
| cm | 1–9 3 | d | 1–9 4 | |||||||
| Ingmar | AgriPro | 71 | 3 | 60 | 1 | 3 | 6 | 6 | 5 | 5 |
| Valda | AgriPro | 69 | 4 | 60 | 1 | 2 | 7 | 6 | 6 | 5 |
1 Days to head = the number of days from planting to head emergence from the boot, averaged based on data from several North Dakota locations in 2019 (Ransom et al., [48]). 2 Stem rust, Puccinia graminis f.sp. tritici; leaf rust, Puccinia triticina; stripe rust, Puccinis striiformis f.sp. tritici; tan spot, Pyrenophora tricitici-repentis; BLS, bacterial leaf streak (Xanthomonas translucens pv. undulosa); head scab, Fusarium graminearum. 3 Straw strength = 1 to 9 scale, with 1 the strongest and 9 the weakest [48]. 4 Disease reaction scores from 1 to 9, with 1 = resistant and 9 = very susceptible [48].
Table 3.
Important dates and seeding information for HRSW environments in 2019 and 2020.
| Year | Location | Plot Size | Row Spacing | Early Seeding | Late Seeding | Early Harvest | Late Harvest |
|---|---|---|---|---|---|---|---|
| m | cm | DOY 1 | |||||
| 2019 | Hettinger | 1.62 × 6.69 | 17 | 116 | 148 | 244 | 260 |
| Langdon | 1.06 × 6.69 | 17 | 127 | 148 | 244 | 260 | |
| Minot | 1.24 × 3.65 | 19 | 113 | 140 | 232 | 241 | |
| 2020 | Grand Forks | 1.24 × 3.65 | 19 | 125 | 149 | 237 | 248 |
| Prosper | 1.24 × 3.65 | 19 | 125 | - | 233 | - | |
1 DOY = day of year; day 113 = 23 April; day 260 = 17 September.
Table 4.
Soil test results for all wheat environments in 2019 and 2020.
| Year | Location | Depth | NO3-N | P 1 | K | pH | OM |
|---|---|---|---|---|---|---|---|
| cm | kg ha | mg kg−1 | % | ||||
| 2019 | Hettinger | 0–15 | 32 | 23 | 336 | 5.4 | 3.1 |
| 15–61 | 30 | - 2 | - | 7.6 | - | ||
| Langdon | 0–15 | 24 | 7 | 279 | 6.9 | 3.7 | |
| 15–61 | 31 | 10 | 194 | 7.7 | 4.6 | ||
| Minot | 0–15 | 8 | 32 | 263 | 6.7 | 3.5 | |
| 15–61 | 24 | - | 105 | 7.7 | - | ||
| 2020 | Grand Forks | 0–15 | 13 | 6 | 314 | 8.1 | 4.3 |
| 15–61 | 15 | 5 | 202 | 8.4 | 4.0 | ||
| Prosper | 0–15 | 11 | 12 | 273 | 7.5 | 4.4 | |
| 15–61 | 27 | 13 | 128 | 7.9 | 2.9 | ||
1 P, available P fraction; K, available K fraction; OM, organic matter. 2 “-”, soil test result is unavailable.
Table 5.
Significance levels from ANOVA for yield, grain protein content, and protein yield combined across environments (location-year).
Table 5.
Significance levels from ANOVA for yield, grain protein content, and protein yield combined across environments (location-year).
| Source of Variation 1 | Degrees of Freedom | Yield | Protein | Protein Yield |
|---|---|---|---|---|
| Seeding Rate [SR] | 4 | 0.422 | 0.770 | 0.443 |
| Genotype [G] | 6 | <0.001 | <0.001 | 0.049 |
| SR × G | 24 | 0.042 | 0.990 | 0.012 |
1 Error terms for F-test were assigned as described by Carmer et al. [50] considering seeding rate, genotype, and their interaction fixed effects, whereas environment and any interaction with environment was considered as a random effect.
Table 6.
Means for the genotype by seeding rate interaction for yield, protein, and protein yield combined across seven, eight, and eight environments (location-year) in North Dakota, USA.
Table 6.
Means for the genotype by seeding rate interaction for yield, protein, and protein yield combined across seven, eight, and eight environments (location-year) in North Dakota, USA.
| Genotype 1 | Seeding Rate | Yield 2 | Protein | Protein Yield |
|---|---|---|---|---|
| million seeds ha−1 | kg ha−1 | g kg−1 | kg ha−1 | |
| Ingmar | 2.22 | 4494 l | 150 | 606 ghi |
| 2.96 | 4753 fghijk | 150 | 638 abcdef | |
| 3.71 | 4600 kl | 149 | 617 defghi | |
| 4.45 | 4667 ijkl | 149 | 622 bcdefghi | |
| 5.19 | 4634 jkl | 148 | 620 cdefghi | |
| Valda | 2.22 | 4703 hijk | 146 | 617 efghi |
| 2.96 | 4769 fghijk | 146 | 621 bcdefghi | |
| 3.71 | 4842 cdefghij | 145 | 623 bcdefghi | |
| 4.45 | 4923 abcdefg | 145 | 624 bcdefghi | |
| 5.19 | 4922 bcdefg | 145 | 633 abcdefg | |
| HA | 2.22 | 4707 ghijk | 144 | 605 hi |
| 2.96 | 4796 efghijk | 144 | 617 defghi | |
| 3.71 | 4965 abcdef | 144 | 636 abcdef | |
| 4.45 | 5047 abc | 144 | 641 abcde | |
| 5.19 | 4865 bcdefghi | 144 | 622 cdefghi | |
| HB | 2.22 | 4790 efghijk | 144 | 618 efghi |
| 2.96 | 4864 bcdefghij | 143 | 627 abcdefghi | |
| 3.71 | 4840 cdefghij | 143 | 619 cdefghi | |
| 4.45 | 4777 efghijk | 143 | 608 ghi | |
| 5.19 | 4878 bcdefghi | 143 | 628 abcdefgh | |
| HC | 2.22 | 4849 bcdefghij | 143 | 623 bcdefghi |
| 2.96 | 4942 abcdefg | 143 | 626 bcdefghi | |
| 3.71 | 5068 ab | 143 | 653 a | |
| 4.45 | 4772 efghijk | 143 | 606 ghi | |
| 5.19 | 4788 efghijk | 142 | 603 i | |
| HD | 2.22 | 5028 abc | 142 | 644 abcd |
| 2.96 | 5034 abcd | 142 | 638 abcdef | |
| 3.71 | 5050 ab | 142 | 638 abcdef | |
| 4.45 | 4922 bcdefgh | 142 | 614 fghi | |
| 5.19 | 5144 a | 142 | 647 ab | |
| HE | 2.22 | 4803 defghijk | 141 | 629 abcdefghi |
| 2.96 | 4994 abcde | 141 | 645 abc | |
| 3.71 | 4952 abcdef | 141 | 629 abcdefghi | |
| 4.45 | 4932 abcdefgh | 140 | 628 abcdefghi | |
| 5.19 | 4925 abcdefgh | 139 | 632 abcdefgh |
Within columns, means followed by the same letter are not significantly different according to Tukey’s multiple comparison test with p = 0.05. 1 HA, Hybrid A; HB Hybrid B; HC, Hybrid C; HD, Hybrid D; HE, Hybrid E. 2 Yield, protein, and protein yield were determined at 13.5%, 12%, and 12% moisture content from seven, eight, and eight environments, respectively.
Table 7.
Linear and quadratic regression analysis for seeding rate (x) and yield (ŷ) by genotype averaged across seven environments in North Dakota, USA.
Table 7.
Linear and quadratic regression analysis for seeding rate (x) and yield (ŷ) by genotype averaged across seven environments in North Dakota, USA.
| Genotype | p 1 | R2 | AOSR | Yield | Equation |
|---|---|---|---|---|---|
| million seeds ha−1 | kg ha−1 | ||||
| Ingmar | 0.45 | 0.20 | ŷ = 4634 + 38.9x | ||
| 0.69 | 0.31 | 4.29 | 4826 | ŷ = 4216 + 284.4x − 33.12 | |
| Valda | 0.05 | 0.73 | ŷ = 4712 + 84x | ||
| 0.17 | 0.83 | 4.89 | 5112 | ŷ = 4266 + 345.8x − 35.32 | |
| HA | 0.18 | 0.51 | ŷ = 4840 + 72.7x | ||
| 0.19 | 0.81 | 4.28 | 5200 | ŷ = 4037 + 543.7x − 63.62 | |
| HB | 0.12 | 0.61 | ŷ = 4891 + 42.9x | ||
| 0.38 | 0.62 | 5.19 | 5106 | ŷ = 4811 + 89.5x − 6.32 | |
| HC | 0.74 | 0.04 | ŷ = 5152 − 20.2x | ||
| 0.25 | 0.75 | 3.60 | 5182 | ŷ = 3952 + 683.7x − 94.92 | |
| HD | 0.03 | 0.83 | ŷ = 4994 + 69.3x | ||
| 0.17 | 0.83 | 5.19 | 5333 | ŷ = 4998 + 66.7x − 0.42 | |
| HE | 0.16 | 0.54 | ŷ = 4831 + 76.1x | ||
| 0.02 | 0.98 | 4.19 | 5218 | ŷ = 3844 + 655.3x − 78.22 |
1p, p-value; R2, coefficient of determination; AOSR, agronomic optimum seeding rate derived from quadratic regression.
Table 8.
Yield, protein, and protein yield means of seven hard red spring wheat genotypes in 2019 and 2020 combined across environments (location-year) in North Dakota, USA.
Table 8.
Yield, protein, and protein yield means of seven hard red spring wheat genotypes in 2019 and 2020 combined across environments (location-year) in North Dakota, USA.
| Genotype | Yield 1 | Protein | Protein Yield |
|---|---|---|---|
| kg ha−1 | g kg−1 | kg ha−1 | |
| Ingmar | 4786 c | 150 a | 621 c |
| Valda | 5032 b | 146 b | 624 bc |
| HA | 5108 ab | 146 b | 625 bc |
| HB | 5031 b | 146 b | 620 c |
| HC | 5084 b | 146 b | 623 bc |
| HD | 5251 a | 145 b | 637 a |
| HE | 5127 ab | 144 b | 633 ab |
Within columns, means followed by the same letter are not significantly different according to Tukey’s multiple comparison test with p = 0.05. 1 Yield, protein, and protein yield were determined at 13.5%, 12%, and 12% moisture content using seven, eight, and eight environments, respectively.
Table 9.
Linear and quadratic regression analysis for HRSW protein yield response averaged across seeding rate for eight environments in North Dakota, USA.
Table 9.
Linear and quadratic regression analysis for HRSW protein yield response averaged across seeding rate for eight environments in North Dakota, USA.
| Genotype | p 1 | R2 | AOSR | Protein Yield | Equation |
|---|---|---|---|---|---|
| million seeds ha−1 | kg ha−1 | ||||
| Ingmar | 0.76 | 0.04 | ŷ = 611 + 1.9x | ||
| 0.74 | 0.26 | 3.88 | 625 | ŷ = 542 + 42.4x − 5.452 | |
| Valda | 0.02 | 0.89 | ŷ = 606 + 4.2x | ||
| 0.08 | 0.92 | 2.22 | 617 | ŷ = 618 − 2.6x + 0.92 | |
| HA | 0.24 | 0.42 | ŷ = 593 + 7.9x | ||
| 0.09 | 0.91 | 4.11 | 634 | ŷ = 469 + 80.0x − 9.72 | |
| HB | 0.98 | 0.02 | ŷ= 617 + 0.1x | ||
| 0.90 | 0.10 | 3.69 | 615 | ŷ = 651 − 19.4x + 2.62 | |
| HC | 0.33 | 0.31 | ŷ = 647 − 9.2x | ||
| 0.43 | 0.57 | 3.22 | 626 | ŷ = 527 + 61.1x − 9.52 | |
| HD | 0.75 | 0.04 | ŷ = 642 − 2.1x | ||
| 0.65 | 0.35 | 3.86 | 626 | ŷ = 729 − 53.3x + 6.92 | |
| HE | 0.67 | 0.07 | ŷ = 636 − 1.6x | ||
| 0.89 | 0.11 | 3.11 | 632 | ŷ = 619 + 8.4x − 1.42 |
1p, p-value; R2, coefficient of determination; AOSR, agronomic optimum seeding rate derived from quadratic regression.
Table 10.
Cultivar Valda and HD in four high (>5000 kg ha−1) and five low (<5000 kg ha−1) yield environments with partial correlation coefficients (r) and significance for relationships between the yield and yield components and the corresponding standardized multiple linear regression equations.
Table 10.
Cultivar Valda and HD in four high (>5000 kg ha−1) and five low (<5000 kg ha−1) yield environments with partial correlation coefficients (r) and significance for relationships between the yield and yield components and the corresponding standardized multiple linear regression equations.
| High | Low | ||||
|---|---|---|---|---|---|
| Valda | HD | Valda | HD | ||
| PD 1 | 0.01 ns 2 | 0.01 ns | 0.03 ns | 0.01 ns | |
| SD | 0.55 *** | 0.74 *** | 0.77 *** | 0.79 *** | |
| Kernels | 0.55 *** | 0.78 *** | 0.60 *** | 0.64 *** | |
| KWT | 0.35 *** | 0.63 *** | 0.33 *** | 0.39 *** | |
| R2 | Equations | ||||
| High | |||||
| Valda | 0.56 | ŷ = 0.03PD + 1.53SD + 1.58Kernels + 0.55KWT − 1.69 × 10⁻¹⁵ | |||
| HD | 0.79 | ŷ = −0.01PD + 1.41SD + 1.60Kernels + 0.65KWT − 1.49 × 10⁻¹⁵ | |||
| Low | |||||
| Valda | 0.79 | ŷ = −0.09PD + 1.55SD + 1.07Kernels + 0.36KWT + 4.90 × 10⁻¹⁵ | |||
| HD | 0.81 | ŷ = −0.03PD + 1.46SD + 1.03Kernels + 0.45KWT − 1.05 × 10⁻¹⁵ | |||
1 PD, plant density; SD, spike density; kernels, kernels per spike; KWT, 1000 kernel weight; R2, adjusted R2. 2 ***, and ns represent partial correlation coefficients at p ≤ 0.001, and non-significant, respectively.
Table 11.
Combined ANOVA P-values and single degree of freedom contrasts for HRSW milling and baking quality samples combined across nine North Dakota, USA environments and the 2.96 million seeds ha−1 seeding rate.
Table 11.
Combined ANOVA P-values and single degree of freedom contrasts for HRSW milling and baking quality samples combined across nine North Dakota, USA environments and the 2.96 million seeds ha−1 seeding rate.
| Source of Variation | TW 1 | S | M | L | TKW | GPC | FN | ME | MS | PMT | BEM | TE | LV |
|---|---|---|---|---|---|---|---|---|---|---|---|---|---|
| p values | |||||||||||||
| Environment (E) | <0.001 | <0.001 | <0.001 | <0.001 | <0.001 | <0.001 | <0.001 | 0.843 | <0.001 | <0.001 | <0.001 | <0.001 | 0.007 |
| Genotype (G) | <0.001 | <0.001 | <0.001 | <0.001 | <0.001 | <0.001 | <0.001 | 0.093 | 0.230 | 0.003 | 0.212 | 0.065 | 0.008 |
| E × G | <0.001 | <0.001 | <0.001 | <0.001 | 0.050 | <0.001 | <0.001 | 0.162 | 0.347 | 0.264 | 0.306 | 0.185 | 0.405 |
| Contrast2 | |||||||||||||
| I vs. Hybrids | <0.001 | <0.001 | <0.001 | <0.001 | 0.012 | 0.006 | <0.001 | 0.004 | 0.174 | 0.030 | 0.921 | 0.721 | 0.073 |
| V vs. Hybrids | <0.001 | 0.676 | 0.385 | 0.009 | <0.001 | <0.001 | <0.001 | 0.093 | 0.083 | 0.041 | 0.042 | 0.017 | <0.001 |
| I–V vs. Hybrids | <0.001 | <0.001 | <0.001 | <0.001 | <0.001 | <0.001 | <0.001 | 0.003 | 0.047 | 0.919 | 0.170 | 0.160 | 0.228 |
| Means | kg hL−1 | % | g | g kg−1 | s | g kg−1 | 1–8 3 | s | AU 4 | Nm | cm3 | ||
| I | 87 | 0.5 | 26 | 74 | 38 | 153 | 354 | 54 | 3 | 116 | 55 | 1533 | 178 |
| V | 89 | 0.7 | 34 | 66 | 37 | 140 | 366 | 52 | 3 | 142 | 58 | 1615 | 205 |
| I–V | 89 | 0.6 | 30 | 70 | 37 | 146 | 360 | 53 | 3 | 129 | 56 | 1574 | 191 |
| Hybrids | 86 | 0.9 | 33 | 66 | 40 | 141 | 330 | 49 | 2 | 129 | 55 | 1543 | 187 |
Significant dependent variables from the ANOVA for genotype were evaluated using single degree of freedom contrasts. 1 TW, test weight; S, M, L, small, medium, and large kernel distribution percent; TKW, 1000 kernel weight, GPC, grain protein content; FN, falling number; ME, milling extraction; MS, mixograph score; PMT, peak max time; BEM, torque maximum; TE, total energy; LV, loaf volume. 2 I, Ingmar; V, Valda. 3 Mixograph score where 1 is low mixing tolerance and 8 is high mixing tolerance. 4 AU, Ambiguous units.
Publisher’s Note: MDPI stays neutral with regard to jurisdictional claims in published maps and institutional affiliations. |
© 2021 by the authors. Licensee MDPI, Basel, Switzerland. This article is an open access article distributed under the terms and conditions of the Creative Commons Attribution (CC BY) license (https://creativecommons.org/licenses/by/4.0/).
Share and Cite
MDPI and ACS Style
Schmitz, P.K.; Ransom, J.K. Seeding Rate Effects on Hybrid Spring Wheat Yield, Yield Components, and Quality. Agronomy 2021, 11, 1240. https://doi.org/10.3390/agronomy11061240
AMA Style
Schmitz PK, Ransom JK. Seeding Rate Effects on Hybrid Spring Wheat Yield, Yield Components, and Quality. Agronomy. 2021; 11(6):1240. https://doi.org/10.3390/agronomy11061240
Chicago/Turabian StyleSchmitz, Peder K., and Joel K. Ransom. 2021. "Seeding Rate Effects on Hybrid Spring Wheat Yield, Yield Components, and Quality" Agronomy 11, no. 6: 1240. https://doi.org/10.3390/agronomy11061240
Note that from the first issue of 2016, this journal uses article numbers instead of page numbers. See further details here.